Article

Machine Learning Optimization of Waste Salt Pyrolysis: Predicting Organic Pollutant Removal and Mass Loss

College of Resources and Environment, University of Chinese Academy of Sciences, Beijing 101408, China
*
Author to whom correspondence should be addressed.
These authors contributed equally to this work.
Sustainability 2025, 17(7), 3216; https://doi.org/10.3390/su17073216
Submission received: 28 February 2025 / Revised: 26 March 2025 / Accepted: 1 April 2025 / Published: 4 April 2025

Abstract

Pyrolysis presents a promising solution for the complete purification and recycling of waste salt. However, the presence of organic pollutants in waste salts significantly hinders their practical application, owing to their diverse sources and strong resistance to degradation. This study developed predictive models for the removal of organic pollutants from waste salt using three machine learning techniques: Random Forest (RF), Support Vector Machine, and Artificial Neural Network. The models were evaluated based on the total organic carbon (TOC) removal rate and the mass loss rate, with the RF model demonstrating high accuracy, achieving R2 values of 0.97 and 0.99, respectively. Feature engineering revealed that the contribution of salt components was minimal, rendering them redundant. Feature importance analysis identified temperature as the most critical factor for TOC removal, while moisture content and carbon and nitrogen content were key determinants of mass loss. Partial dependence plots further elucidated the individual and interactive effects of these variables. The model was validated using both the literature data and laboratory experiments, and a user interface was developed using the Python GUI library. This study provides novel insights into the pyrolysis process of waste salt and establishes a foundation for optimizing its application.

1. Introduction

With the rapid expansion of global industry, the production of high-salinity industrial wastewater has increased significantly. To address freshwater scarcity, many countries are promoting zero-liquid discharge (ZLD) strategies [1]. At the core of ZLD, evaporation crystallization technology converts high-salinity wastewater into solid salt. While this process is mature and widely recognized, it also generates large quantities of waste salt (WS), posing a significant challenge [2]. In China, 1.0 million tons of pesticide waste salt is produced annually, with the waste output ratio in key industries, such as fine chemicals and coal chemicals, reaching 150–500% [3,4]. The composition of WS is highly complex due to variations in production processes and raw material sources, often resulting in high toxicity, disposal difficulties, and environmental hazards [5,6]. Additionally, the lack of relevant standards and the prohibitively high disposal costs have led to the accumulation and storage of large quantities of WS, posing significant environmental risks and contributing to resource wastage [7]. Therefore, rather than treating WS as hazardous waste, recycling it as a raw material presents a more sustainable and effective treatment strategy.
Various technologies have been applied to purify WS, but their effectiveness is significantly constrained by the presence of complex organic pollutants [8,9,10,11,12]. Pyrolysis is considered the most reliable and efficient approach due to its exceptional ability to reduce organic pollutant content [13]. When the heating temperature (HT) ranges from 350 °C to 700 °C, most organic pollutants are reduced, achieving a mean removal rate of 80% [14]. Notably, certain WSs, such as those derived from hydrazine hydrate (N2H4), can be completely removed through this process [15]. Wang et al. reported a positive correlation between the optimal HT and the boiling point of organic impurities [16]. The composition and concentration of organic substances are believed to influence the pyrolysis behavior of WS, with most studies using the total organic carbon (TOC) removal rate (RTOC) as the primary indicator [8,10,17]. Moreover, mass loss is an important parameter that warrants consideration. To prevent data distortion in TOC measurements, recent studies on WS pyrolysis have incorporated both TOC removal and mass loss [18,19]. However, research on WS pyrolysis remains limited, with insufficient exploration of variables beyond pyrolysis parameters such as temperature and retention time (RT). Factors such as elemental composition and salt components can markedly impact TOC and mass loss through catalytic or synergistic reactions [20,21]. Additionally, removing organic pollutants via pyrolysis using an experimental screening method is time-consuming and labor-intensive. This underscores the need to optimize pyrolysis processes and gain a deeper understanding of their influencing factors.
Machine learning (ML) has emerged as a powerful computational tool, demonstrating remarkable effectiveness in pyrolytic conversion [22]. Its applications encompass a wide range of tasks, including predicting chemical reactions and optimizing process parameters. Algorithms play a vital role in ML model development, as they generate predicted values [23]. In pyrolysis, Trees, Forests, Bagging, Boosting (TFBB) and state-of-the-art Neural Networks (NNs) have been widely used [24]. The Forest model can directly process input features, offering accurate predictions with strong interpretability. The Random Forest (RF) algorithm has been successfully applied to predict the pyrolysis yields of wheat straw, achieving high performance across triphase products (p > 0.81, R2 > 0.78) [25]. Additionally, feature engineering (FE) has been integrated into the RF model framework through feature importance assessment, enabling the identification of the most significant factors while eliminating redundant ones. Support Vector Machine (SVM) outperforms RF when the kernel is optimized to the radial basis function (RBF). Research indicates that SVM exhibits strong predictive capabilities for the yields of bio-oil, biochar, and biogas from the co-pyrolysis of biomass and plastic, with R2 values of 0.96, 0.93, and 0.91, respectively [26]. NN models are widely used for predicting and modeling complex nonlinear processes. Artificial NNs (ANNs) have demonstrated promising results in predicting derivative mass loss in the pyrolysis process (DTG). Thus, employing explanatory models to assess the impact of different features on the pyrolysis of WS and optimizing parameters holds significant potential. Previous studies on ML applications in pyrolysis have primarily focused on biomass and plastics. However, to date, no study has established a predictive model.
In this study, ML models were employed to investigate the effects of WS properties and pyrolysis conditions on TOC removal and mass loss rate. A comprehensive dataset on WS pyrolysis was established, and key influencing factors in the pyrolysis process were identified through FE. The overall research workflow is illustrated in Figure 1. Three ML algorithms were introduced for model training and optimization. Additionally, this study analyzed the importance of the input features in the best-performing model and employed partial correlation analysis to evaluate their impact on the target variables. The model was validated using experimental data as well as supplementary data from published studies. Furthermore, a model-based user interface was developed. This study highlights the potential uses of ML technologies in WS pyrolysis and provides novel insights for parameter optimization.

2. Materials and Methods

2.1. Data Collection

The dataset used for model training and testing comprised 142 mass loss data points and 325 TOC removal rate data points, sourced from previous publications and supplementary experiments. Data from prior studies on WS pyrolysis, published between 2015 and 2024, were retrieved using Web of Science, China National Knowledge Infrastructure Database, and Google Scholar. These data were extracted directly from tables or indirectly from figures in the literature using the GetData Graph Digitizer 2.26 software (see the website of SOFT RADAR: GetData Graph Digitizer). To ensure consistency and minimize experimental uncertainties, we strictly limited the dataset to studies conducted in a tubular furnace environment. Although various methods for handling missing values have been proposed in previous studies [25], inferential supplementation in the presence of unobserved data can introduce inaccuracies [27]. Thus, missing values were excluded from this study. Ultimately, 11 papers were selected as the primary data sources (Table S1). The experimental dataset, which included characterization methods, thermogravimetric (TG) analysis, and tubular furnace experiments, was generated from the pyrolysis of two types of WSs (Table S1).
In this study, WS samples were subjected to pyrolysis experiments under both anaerobic and aerobic conditions, with a varied heating rate (HR), HT, and RT. The pyrolyzed samples were subsequently analyzed to assess TOC removal and mass loss rate. Overall, the dataset included WSs from diverse industrial sources, such as pesticide production, phosphorus processing, coal chemical operations, N2H4 production, epoxy resin manufacturing, and industrial wastewater treatment.
The removal rate of TOC from WS was directly obtained from the experimental data or calculated as a percentage using Equation (1).
R T O C = φ 0 φ 1 φ 0 × 100 %
In Equation (1), RTOC denotes the removal rate in the control treatment; φ 0 represents the TOC content in the WS before pyrolysis; and φ 1 signifies the TOC content in the WS after pyrolysis.
The mass loss rate (Rml) denotes the ratio of mass loss, and was determined using Equation (2).
R m l = m 0 m 1 m 0 × 100 %
In Equation (2), m0 and m1 represent the original and final sample weights.
The key factors influencing the pyrolysis process of industrial WSs can be categorized into four main groups: (1) Properties of WSs—This includes the composition and water content of the salts. The composition is defined by the mass ratios of major salts, such as NaCl, Na2SO4, KCl, and Na3PO4. (2) Characteristics of organic substances—This pertains to the initial TOC content (wt%) and the boiling points of the primary organic substances. (3) Pyrolysis conditions—These include using the pyrolysis atmosphere, RT, and temperature as input variables. Studies have shown that the HR generally does not have a significant impact on TOC removal [3]. (4) Pyrolysis characteristics—This involves the TG properties of WS pyrolysis, such as the mass loss rate (TG-M, %) and the maximum mass loss temperature (DTG-T, °C). These two factors are generally utilized to describe the characteristics of moisture volatilization and organic matter release during pyrolysis [28]. These properties help to clarify the underlying processes and assess the feasibility of the pyrolysis process, particularly in terms of the instantaneous reaction temperature and reaction extent. Consequently, a dataset combining literature-derived data and experimental results was established, incorporating four types of input factors and two output parameters.
As a necessary preprocessing step, data normalization was performed, since the dataset contained variables with different ranges, means, and standard deviations (SDs). The standard normal variate Zi was employed in accordance with established ML practices:
Z i = ( X i ρ ) / σ
In Equation (3), Zi represents the input value; ρ denotes the mean of the input; and σ represents the SD of the input variables.
Before constructing the model, we conducted a Pearson correlation coefficient (PCC) analysis. Using PCC Equation (4), the linear correlation between any two variables was measured [29].
ρ x y = i = 1 n ( x i x ¯ ) i = 1 n ( y i y ¯ ) i = 1 n ( x i x ¯ ) 2 i = 1 n ( y i y ¯ ) 2
In Equation (4), ρxy denotes the PCC between two variables, where x ¯ and y ¯ denote the mean values of the input variable x and the output variable y, respectively. The ρxy values range from 1 to −1, with positive or negative values indicating positive and negative correlations, respectively, while a value of 0 indicates no linear correlation. PCC can determine the correlation between input variables, allowing for the exclusion of highly associated features and the reduction in model dimensionality as a preliminary test.

2.2. ML Model Algorithm

According to the “No Free Lunch” theory, no single algorithm consistently outperforms all others across all problem instances. An algorithm that performs well in certain cases may perform poorly in others [23]. Therefore, it is advisable to apply several candidate algorithms and select the one best suited to a specific problem [24]. In this study, three classical ML methods—RF, SVM, and ANN—were employed to train predictive models. RF constructs models by randomly sampling subsets of data with replacements to generate diverse decision trees. Each tree is trained on a bootstrap sample and fully grown, producing predictions based on the average label values at its leaf nodes. The final prediction is obtained by averaging the outputs from all trees, thereby improving model robustness and accuracy [30]. RF methodologies are often easier to implement compared to other machine learning techniques. They also enable users to easily extract feature importance, which contributes to a better understanding of the model and facilitates its further improvement [22]. ANN serves as a data-driven modeling tool designed to predict complex and nonlinear relationships between inputs and outputs. The network learns and refines its parameters through data processing within a dynamic structure, leveraging a feedback mechanism to enhance its prediction accuracy until they closely align with the desired outcomes [31]. SVM, when applied to regression tasks, constructs a hyperplane to approximate the relationship between dependent and independent variables, excelling in high-dimensional data and handling nonlinear interactions by mapping data into higher dimensional spaces [32].
The three models selected for this research exhibited strong generalization capabilities, excellent adaptability to diverse feature data, and high prediction accuracy. Moreover, these models have demonstrated significant potential in research applications for predicting the properties of pyrolysis products [22]. The overall dataset was randomly split into a training set and a test set at a ratio of 85:15. Grid search was used to identify the optimal hyperparameter combination, ensuring the model’s best performance. All analyses were conducted using the Scikit-learn library in Python 2.7 (https://scikit-learn.org/stable/, accessed on 3 April 2025).

2.3. Model Development and Evaluation

In ML, the choice of inputs markedly impacts modeling. Selecting the most relevant and representative inputs efficiently is vital. Feature engineering plays a key role in this process by filtering out redundant features and selecting the valuable features [33]. The optimal subset of features is determined based on statistical properties, including importance assessment and ranking. Features with low rankings and minimal influence are eliminated to refine the models. The updated models achieve greater efficiency and reduced computational cost while maintaining the same hyperparameters.
The hyperparameters of each algorithm were optimized to minimize prediction error. Considering the size of dataset, a five-fold cross-validation approach was applied, except for in the ANN model, owing to its significant computational and time requirements. For the RF model, special attention was given to the number of trees and the maximum depth of each tree during model training. In the ANN model, the model structure consisted of two hidden layers, with the learning rate and the number of neurons per layer being carefully fine-tuned. For the SVM model, key hyperparameters, including the penalty parameter and the gamma parameter of the RBF kernel, were meticulously adjusted.
Two types of model evaluation were utilized to compare the prediction accuracy and to quantify predictive performance. The regression coefficient (R2) measures predictive performance, with values closer to 1 indicating higher accuracy, while the root mean squared error (RMSE) denotes prediction accuracy, with lower values signifying more precise predictions. The formulae for calculating R2 and RMSE are given in Equations (5) and (6):
R 2 = 1 i = 1 N ( Y i p r e d Y i t r u e ) 2 i = 1 N ( Y a v e p r e d Y i t r u e ) 2
R M S E = 1 N i = 1 N ( Y i t r u e Y i p r e d ) 2
where Y i t r u e denotes the true value of the input; Y i p r e d signifies the predicted value of the model; and Y a v e p r e d represents the average predicted value of the model.

2.4. Model Interpretation

While ML has demonstrated significant promise in the field of pyrolysis, the interpretability of these models remains a challenge [34]. Therefore, two model interpretation methods were employed in this study to evaluate the optimal ML model: feature importance and partial dependence plots (PDPs). Feature importance was assessed by measuring the reduction in prediction accuracy when individual feature values were randomly permuted, providing a robust indication of each feature’s influence on model predictions [35]. Additionally, PDP provided a more detailed perspective by illustrating how specific features affected predictions, demonstrating the impact of a particular feature on the predicted outcomes while keeping all other features constant at their mean values.

2.5. Pyrolysis Optimization and Experimental Verification

The final model was validated through both experimental verification and additional data. The additional data were obtained from published studies beyond this dataset, ensuring that the criteria for data acquisition were aligned with those of the existing database. The feature values fell within the coverage range of the corresponding features in the dataset, with missing values replaced by 0. Practical validation remained the most reliable approach for assessing the accuracy and robustness of ML models.
The forward optimization approach served as an experimental verification method [36]. This method utilized the model to predict the RTOC and Rml of WSs with known properties under various pyrolysis conditions, using iteration steps of 5 °C between 200 °C and 700 °C and time intervals of 1 min from 0 to 120 min. The extensive results were filtered based on the engineering feasibility, and the optimized process parameters were subsequently validated through practical experiments conducted in a laboratory tube furnace. Details of the characterization and pyrolysis experiments are provided in the Supplementary Materials.

3. Results

3.1. Statistical Analysis of Datasets and Pearson Correlation Coefficients

The statistical characteristics of 18 WSs were analyzed based on their salt compositions, organic content, and pyrolysis properties, as presented in Table S2. The dataset size for each variable ranged from 142 to 325 data points. The dispersion of variables was represented by their mean values and SDs, while minimum and maximum values, along with quartile ranges, provided insights into the range and distribution of each variable. The primary salt components identified were NaCl, Na2SO4, KCl, and Na3PO4. However, due to data limitations, the features of these components did not fully capture the overall salt composition. NaCl was the predominant component in most WSs, with 75% of samples containing over 65.5% NaCl. Other salt components, such as Na2SO4 and KCl, were present at concentrations ranging from 1.12% to 74.19%.
In terms of organic properties, the TOC content of the WSs ranged from 0.01% to 7.54%. The boiling points of the primary organic substances—identified based on the highest peak areas in the total ion chromatograms from Gas Chromatography–Mass Spectrometry (GC-MS) analysis—spanned from 41.9 °C to 527.1 °C, with the majority falling between 41.9 °C and 254.9 °C. These values were verified using the PubChem database. Another critical characteristic, carbon content, ranged from 0.04% to 20.7%, indicating the quantity of organic matter in the feedstock [37]. The elemental N content was relatively low, ranging from 0% to 8.9%, with the highest N content observed in the pesticide-derived WS (nicosulfuron). Regarding the pyrolysis parameters, research has primarily focused on low–medium-temperature treatments, with temperatures below 550 °C commonly employed. RTs varied from 0 to 200 min, aligning with typical experimental ranges in pyrolysis studies [38]. Mass loss during TG analysis ranged primarily from 0.73% to 7.3%. The highest mass loss temperature, representing the primary reaction phase of the TG process, ranged from 116.0 °C to 570.0 °C, with most data concentrated between 334.8 °C and 455.1 °C. As for the model targets, TOC removal rates ranged from 0% to 100%, with over half of the samples achieving removal rates above 91%. The Rml varied from 3.14% to 13.1%, with an average reduction of 5.78%.
Figure 2 presents the Pearson correlation heatmap, illustrating the interactions among the variables. A correlation coefficient between 0.5 and 0.8 suggested a substantial relationship between features, while a coefficient exceeding 0.8 indicated a strong correlation, potentially leading to collinearity issues in models. To enhance model reliability, it was advisable to exclude at least one of the correlated variables [39]. Regarding the characterization of RTOC (Figure 2a), NaCl exhibited a strong negative correlation with TG-M (%) (PCC = −0.8). This relationship can be attributed to NaCl constituting a significant portion of the WS. Since inorganic salts remain stable during thermal reactions—provided that the temperature stays below their melting and volatilization points—the residual substances in the WS primarily account for the mass changes observed in the TG analysis. These two features necessitate additional FE for refinement.
Temperature plays a crucial role in the conversion of substances during pyrolysis, resulting in a strong correlation between TOC removal and HT (PCC = 0.78). This correlation likely arises from the increased removal of organic compounds at higher temperatures. Organic materials undergo cracking or oxidation at moderate to low temperatures, with further losses occurring as temperatures rise. The removal of organic matter during pyrolysis also contributes to weight reduction, aligning with the observed correlation between TOC (wt%) and TG-M (%) (PCC = 0.49). Figure 2b presents the PCC results for the Rml dataset, highlighting a negative correlation between the NaCl content in WS and the mass loss rate (PCC = −0.77). When the salt content in WS exceeds 99.9%, thermal treatment should be used in conjunction with more cost-effective purification methods, such as washing [15]. Additionally, TOC (wt%) exhibits a positive correlation with Rml (PCC = 0.43), highlighting its significance as a major component of WS [40]. Regarding the elemental features, both C (wt%) and N (wt%) showed positive correlations with Rml, indicating that C- and N-containing substances are key impurities in WS. This finding is primarily associated with the characteristics of wastewater from chemical, pesticide, and pharmaceutical industries. The positive correlation between C and N (PCC = 0.55) suggestted a link to specific organic residues, such as N,N-dimethylaniline (DMF) in pharmaceutical WSs, triadimefon in pesticide residues, and prochloraz in pesticide WSs. Furthermore, N-containing solvents are widely used in chemical and pharmaceutical processes [41]. While heat treatment effectively removes organic compounds from WSs, the cracking of N-containing organics can generate harmful gases, especially under anaerobic conditions. Therefore, it is crucial to closely monitor N behavior during the heat treatment process [4].
In summary, to avoid the issue of feature collinearity and to reduce the risk of information overlap undermining model performance, it is advisable to exclude NaCl and TG-M (%) from the modeling options for RTOC.

3.2. Model Evaluation

Three primary ML algorithms—RF, SVM, and ANN—were selected for this study. Plots comparing the experimental data with predictions from these models (Figure S1) indicate that all three demonstrated a strong performance in predicting RTOC and Rml, with the test coefficient of determination ranging from 0.82 to 0.99. The initial dataset yielded satisfactory results, particularly for the RF model. However, in the initial model, the selection of input features was determined by data availability and domain knowledge. The inclusion of less relevant features and numerous inputs may have weakened the generalization capacity of the model. Therefore, implementing FE techniques to mitigate these issues was essential.
According to the PCC analysis, NaCl (wt%) and TG-M (%) exhibited a strong correlation (PCC = 0.8) within the RTOC dataset, necessitating the removal of one of them. The feature importance analysis of the RF model (Figure S2) further indicated that TG-M (%) had a greater impact than NaCl (wt%), whereas Na2SO4 (wt%), KCl (wt%), and Na3PO4 (wt%) were considerably less significant. Therefore, all of these salt components were removed as redundant features. Meanwhile, two distinct datasets were developed for the Rml model (Table S3): one including all available inputs and another excluding less significant variables based on feature importance analysis. This strategic approach, informed by both domain expertise and feature importance analysis, aimed to optimize the model performance.
After reducing the redundant inputs, we retrained the models using the same dataset while maintaining the original split. As shown in Figure 3, FE improved predictive performance across all retrained models, with significant enhancements observed in the RTOC model. The R2 values for the test set of the SVM and RF algorithms approached 1, and the RMSE decreased compared to previous results. The Rml model exhibited enhanced accuracy, maintaining robust performance with eight key features and decreasing the RMSE of the RF model by 8%. These findings suggest that selecting more relevant features can effectively enhance model accuracy.
Furthermore, FE indicated that salt components had a minimal contribution to both the RTOC and mass loss rate models. This indicated that, beyond potential melting point issues being associated with salt components, their influence on heat treatment processes may be limited. This may be due to the fact that the salt components are mainly alkaline earth metallic species, which primarily affect thermally labile organics, such as pyrones and short-chain compounds, with less impact on thermally stable substances [42]. Moreover, dominant chloride salts in the dataset, such as NaCl, have been shown to exert minimal impact on pyrolysis yield. For instance, the addition of NaCl reduced the char yield by only 0.79 wt% during the pyrolysis of acid hydrolysis residues [43]. Consequently, subsequent pyrolysis research could prioritize investigating the residual components.
Figure 4 illustrates the precise performance of predictions following the model update. The blue line represents y = x, indicating that the proximity of points to this curve correlates with prediction accuracy. The RF model outperformed other methods in predicting RTOC, achieving a training R2 of 0.99 and a testing R2 of 0.97, with RMSE values of 0.03 and 0.05, respectively (Figure 4b). The testing R2 values for the SVM and ANN models were 0.91 and 0.86, respectively (Figure 4a,c). Additionally, several test data points in the RF model exhibited a slight bias towards the lower segment of the y = x line, suggesting that the predictions were somewhat underestimated compared to the actual results.
The predictive outcomes of Rml are illustrated in Figure 4d–f, where all three models exhibit strong correlations. The R2 values for the testing phase were 0.98, 0.99, and 0.98 for the SVM, RF, and ANN models, respectively. Notably, RF exhibited the lowest prediction error, with an RMSE of approximately 0.3, confirming its status as the most accurate model. This result can be primarily attributed to the dataset size and the dimensionality of the input variables. While the ANN algorithm is effective for making predictions on large datasets with low-dimensional inputs, the SVM model is particularly well suited for nonlinear data. Given that the dataset used in this study exhibited relatively high dimensionality despite its size, along with some degree of linearity, these challenges were effectively addressed by employing the more robust RF model. Hence, the RF model developed in this study can be considered both reliable and robust for accurately predicting the RTOC and Rml of WS pyrolysis.
In summary, both FE and the refinement of ML algorithms are essential for enhancing predictive performance. These methods not only optimize the models but also provide deeper insights into conversion processes. The next section will present the feature impact results from the RF model, offering a clearer understanding of the factors influencing the pyrolysis process.

3.3. Model Interpretation

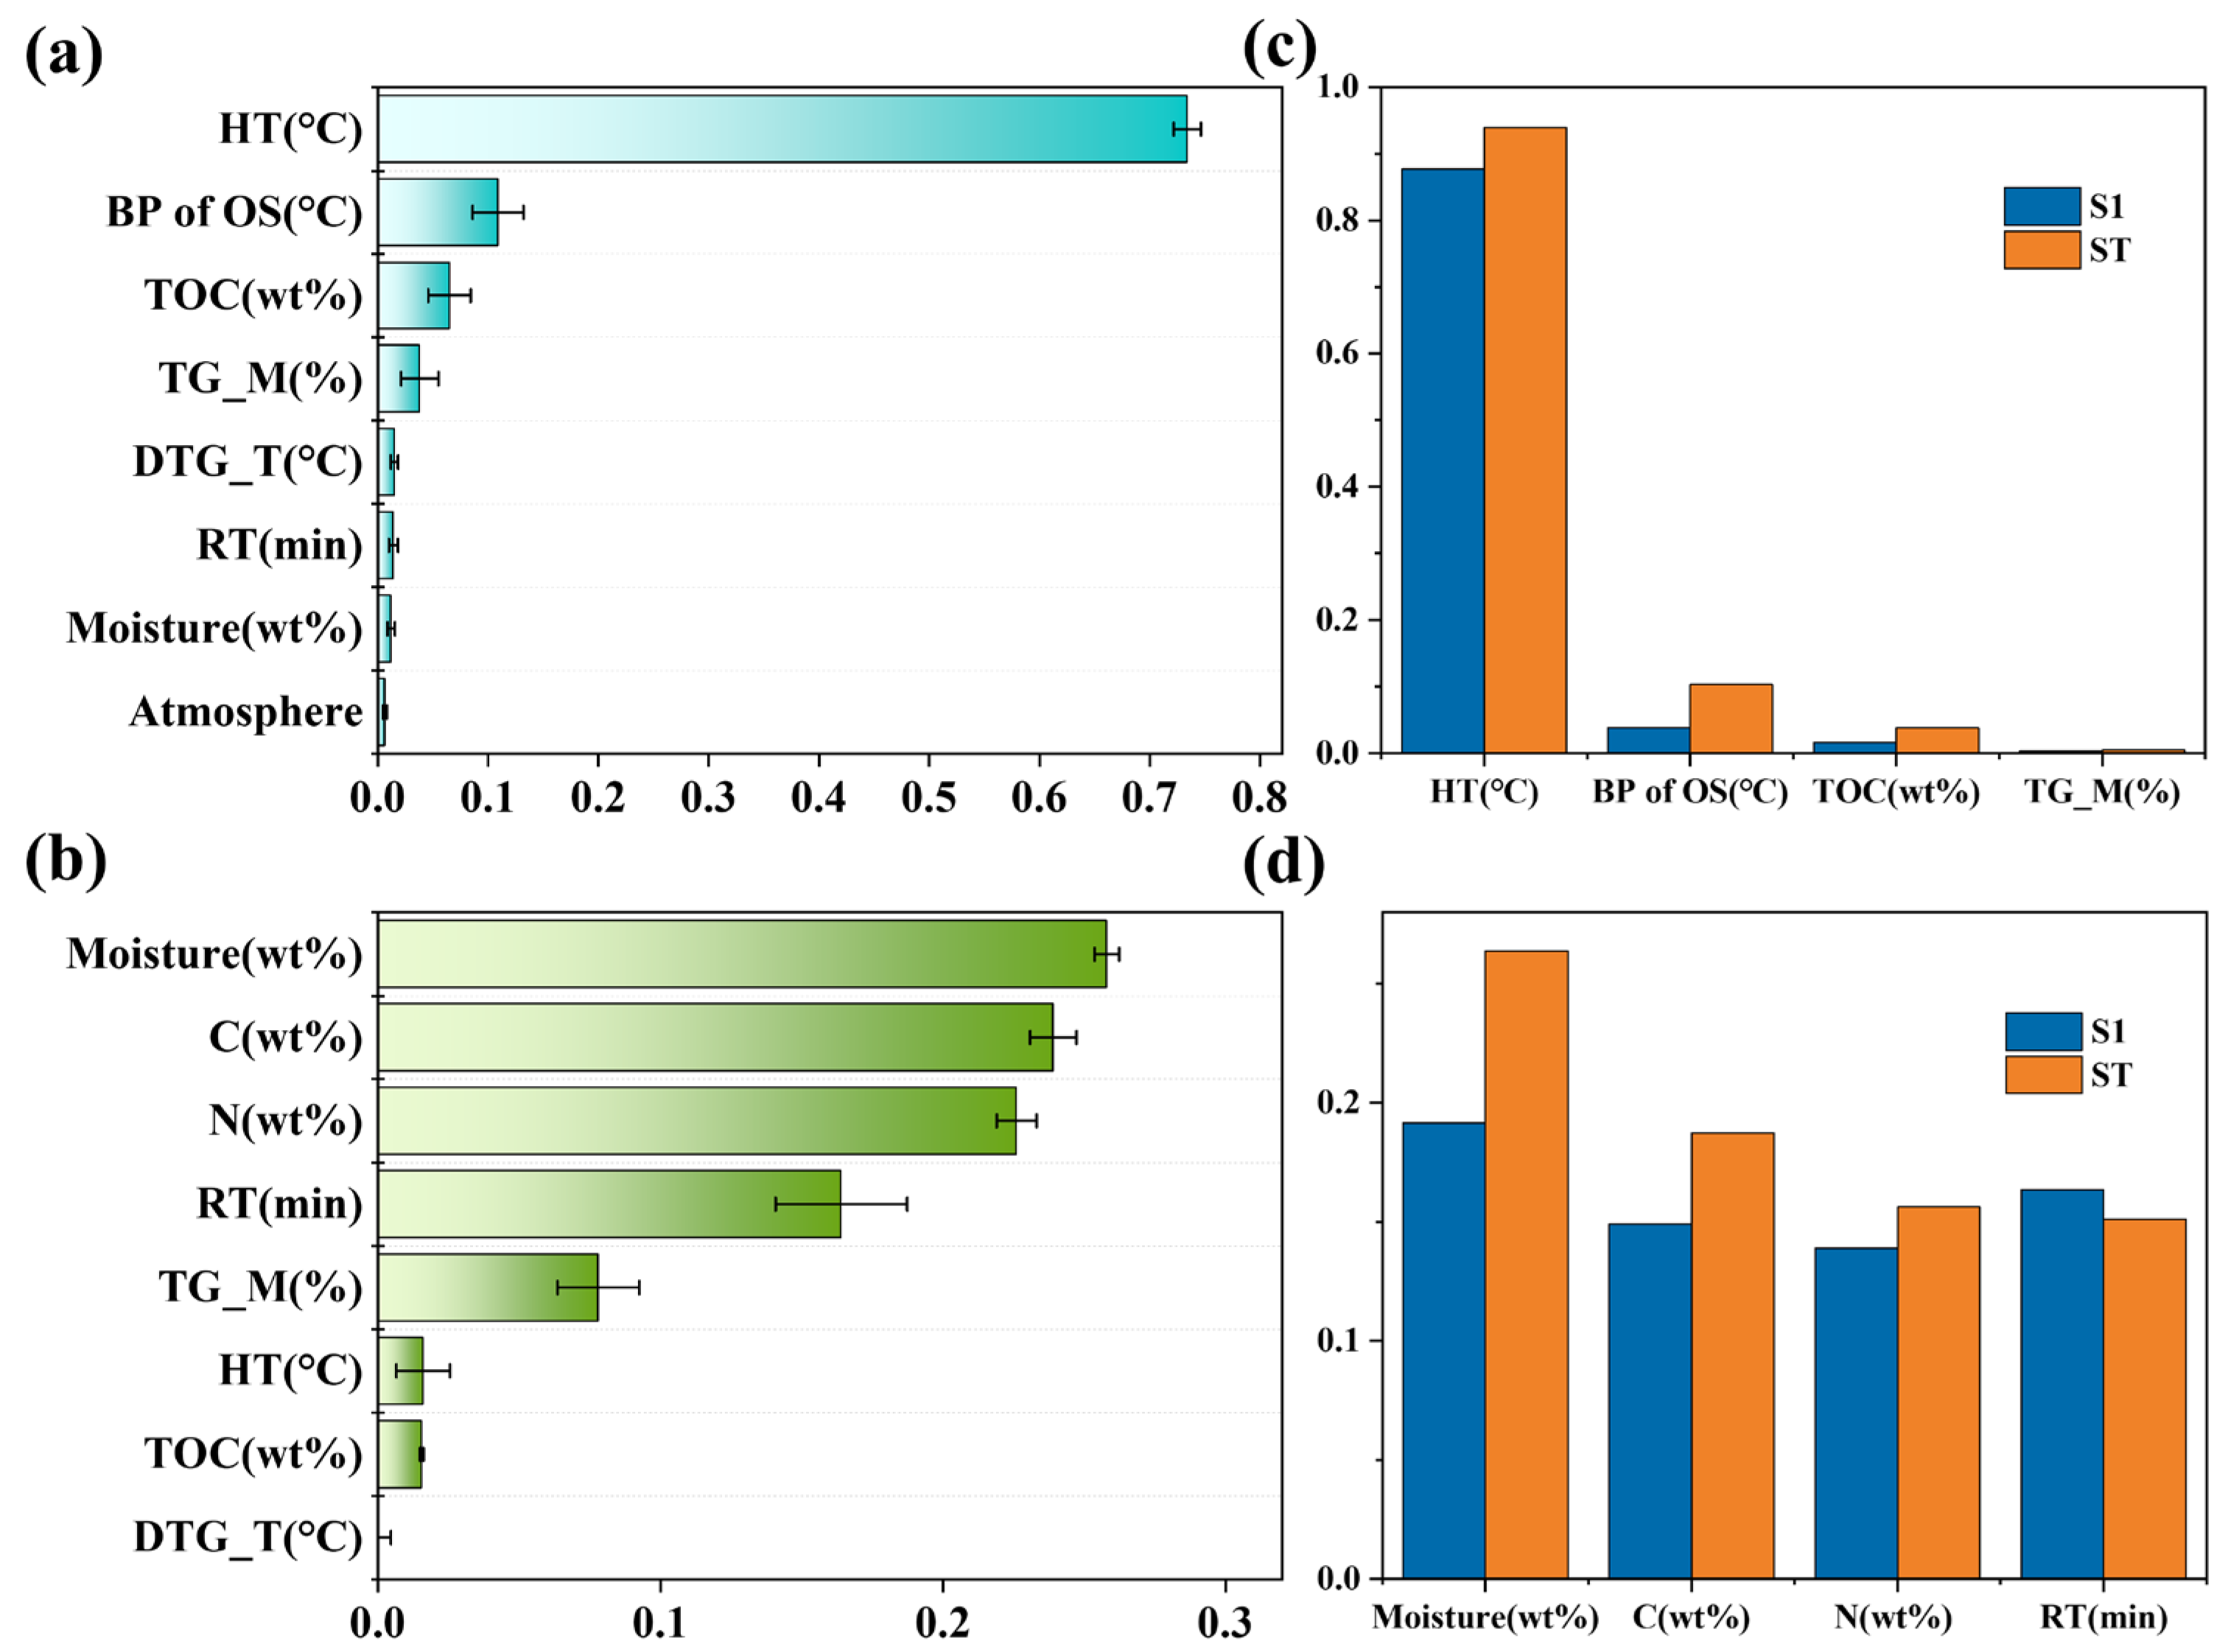
Feature importance analysis was conducted to evaluate the relative contribution of each feature in the RF models predicting RTOC and Rml individually (Figure 5a,b). Based on the feature importance derived from the RF model, which captured both linear and nonlinear dependencies, this study ranked the features. The results showed that heating temperature was the most influential factor, accounting for 73.9% of the variations in RTOC, consistent with the Pearson correlation analysis (Figure 2). This finding aligns with the well-established effect of temperature on the decomposition and secondary cracking of organic contents. It also corroborates previous research on the combustion characteristics of waste pharmaceutical Na2SO4, which have identified HT as the primary factor influencing impurity removal [44]. In contrast, RT (min) had a minimal impact, contributing only 1.03%. This study also investigated the boiling point of primary organic substances (BP of OS, °C) and TOC as indicators of organic content in WSs. The boiling point exhibited a stronger influence on RTOC (9.52%) compared to TOC (7.47%). This observation aligns with prior studies suggesting that treatment temperatures should be at least 30 °C above the boiling point of primary organic compounds, emphasizing the significance of organic content [16]. Additionally, weight loss during the TG process (TG-M, %) and the maximum peak temperature (DTG-T, °C) were utilized to characterize the pyrolysis properties of WSs, collectively contributing 6.47% to the model predictions. These two features provided crucial insights into the pyrolytic behavior of waste salts during the heating process [45]. Given that TG data have long served as a key reference for determining the optimal pyrolysis parameters in WS treatment [14], it is notable that the incorporation of TG data into ML models has remained relatively rare in previous studies. This research demonstrated that TG data can serve as an effective feature in WS modeling, offering a novel descriptor that compensates for data limitations in WS research. Furthermore, the atmospheric conditions had a limited impact on TOC removal, consistent with the findings of Zhang et al. [46]. However, while the trends were similar across different conditions, a significant exothermic peak was observed at 372–519 °C in the presence of air, indicating that O2 promoted the pyrolysis reaction [46].
Moisture played a dominant role in predicting the mass loss rate, accounting for 25.88% of the variations (Figure 5b). As a major component of WS, the moisture content was generally higher than that of organic substances in most cases. Additionally, the presence of moisture facilitated the formation of gaseous products during pyrolysis, which further contributed to mass reduction. Among the elemental compositions, C and N content were significant predictors of mass loss, contributing 23.95% and 22.66%, respectively. This is likely because both elements were released during the gaseous and vapor phases of pyrolysis [47]. Regarding pyrolysis conditions, RT (min) had a stronger influence (16.51%) than HT (°C), despite temperature being a key factor in the decomposition of organic matter. This result can be attributed to the encapsulation of organic substances within the salt matrix, which forms a dense composite structure that impedes heat conduction. To ensure complete decomposition, a gradual temperature increase over an extended RT is necessary. Li et al. similarly observed that even at temperatures up to 800 °C, 70% of pesticide WS pyrolysis residues remained combustible [48]. However, conclusive evidence confirming this effect is lacking. Further studies involving a wider range of WSs or modified experimental conditions could potentially magnify the relevance of temperature. The TG-M (%) and TOC (wt%) measurements determined the mass loss rate in salt for 7.8% and 1.5%, respectively. Conversely, DTG-T (°C) appeared to have a negligible effect on predicting Rml, likely because mass loss information in WS was better captured through C and N content rather than organic matter.
The biases derived from the feature importance results may have influenced the interpretation of variables; on this basis, the Sobol sensitivity analysis was employed to assist in identifying key features [49]. The Sobol sensitivity analysis is a global sensitivity analysis method evaluating the contribution of each input variable to the variance in model output. The results revealed that temperature (S1 = 0.877, ST = 0.939) had the greatest impact on RTOC (Figure 5c), followed by the BP of OS (°C), TOC (wt%), and TG_M (%), with significantly lower contributions from the latter features (S1 and ST values below 0.04). These findings aligned with feature importance results, confirming HT (°C) as the dominant factor. Moisture (wt%) was identified as the main feature affecting Rml. Its higher total sensitivity (ST) suggested stronger interactions with other features. In contrast to the feature importance analysis, RT (min) showed higher single-feature sensitivity (S1) and ST. This may be due to the synergistic effect between retention time and other key features. For instance, extending the retention time under appropriate moisture conditions can promote secondary cracking reactions, leading to mass fluctuation [50]. After identifying the relative importance of each input variable, the next step was to examine the dependency relationships between inputs and outputs in greater detail. In this stage, PDPs were employed to visualize the general impact trends of one or two specific features while averaging the effects of all other features. This study focused on the four most significant features identified through the importance analysis for each model. Additional single-factor PDPs can be provided upon request (Figure S3).
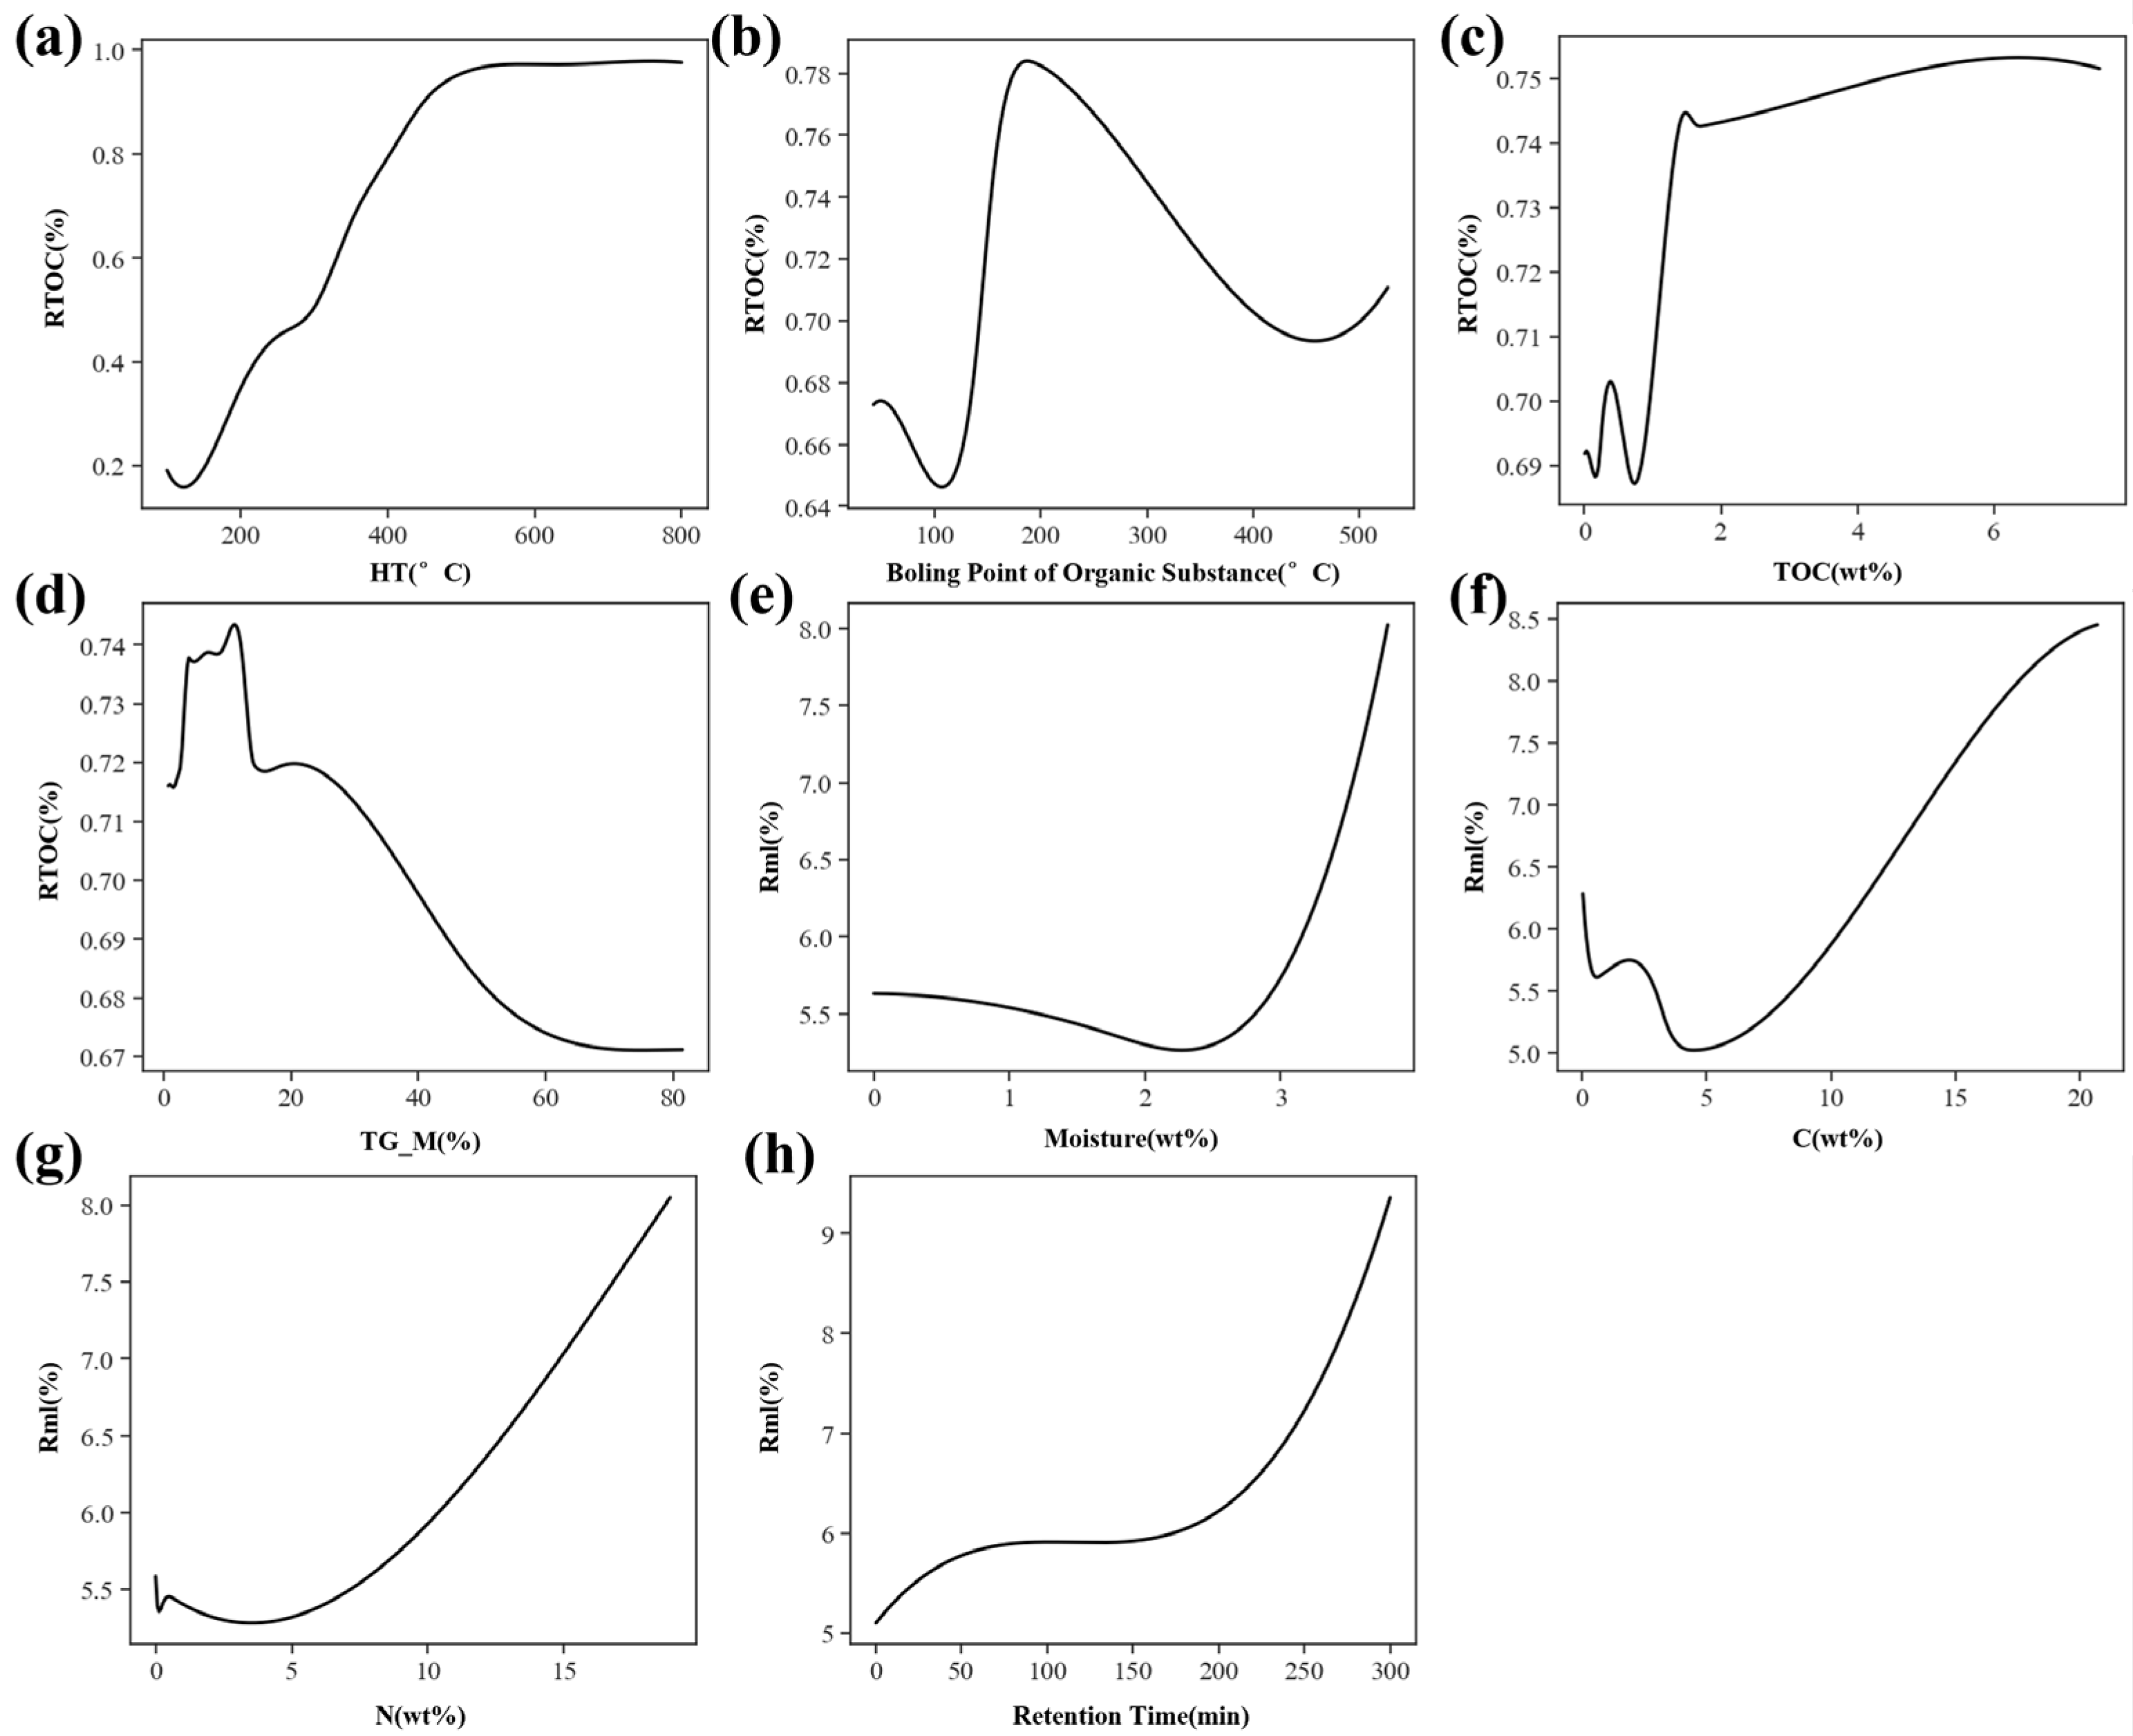
Regarding the RTOC model, Figure 6a shows a strong positive correlation between HT and RTOC. TOC removal exhibited only slight fluctuations below 124 °C, likely due to moisture evaporation. As the temperature increased, RTOC rose almost linearly until approximately 490 °C, where the rate of TOC removal began to decelerate. This stage likely corresponded to significant organic degradation reactions within the WS, with decomposition temperatures primarily ranging from 200 °C to 500 °C [51]. These findings align with previous experimental studies indicating that the optimal treatment temperature is approximately 500 °C [15,17,52]. Beyond 600 °C, further temperature increases had a minimal impact on RTOC, suggesting that future research should focus on low- to medium-temperature conditions for treatment. As the second most important feature, the boiling point of OS, which ranged between 150 °C and 300 °C, corresponded to a higher TOC removal rate (Figure 6b, >74%). However, its influence diminished as the boiling point increased, because the boiling points of hydrocarbons are closely linked to their chemical structures, which in turn determine their physical and thermal properties [53]. High-boiling-point organics, such as p-toluenesulfonic acid in medical WSs, and aromatic compounds such as isobutylbenzene, tend to undergo cracking reactions, forming tar. This tar adheres to pyrolysis products, resulting in a lower TOC removal rate [13]. Additionally, certain low-boiling-point organics may also exhibit poor removal efficiency, potentially due to electrostatic interactions between the organics and the WS. H and C atoms in these organics are adsorbed onto sites on the surface of negatively charged ions within the crystal structure. Low-boiling-point organics, in particular, are more susceptible to adsorption due to their higher positive charge. During crystallization, the growing solute mass encapsulates these organics within the salt, resulting in incomplete removal [54]. This finding is consistent with experimental results showing encapsulated organic carbon within shale and coal particles [55]. Furthermore, this phenomenon may explain why some high-temperature treatments in previous studies were ineffective, despite exceeding the boiling points of the primary organic compounds. Figure 6c indicates that TOC (wt%) positively influences RTOC up to a concentration of 2%, beyond which the removal effect stabilizes. When thermal mass loss is between 6% and 27%, organic material removal remains consistently high, aligning with findings from most studies.
Figure 6e illustrates the impact of moisture content on Rml. An increase in moisture content, particularly beyond 3%, resulted in a significant rise in the mass loss of WS. This mass loss primarily resulted from the evaporation of moisture and the decomposition of organic substances. At high moisture levels, the generated steam accelerated void change in the WS, facilitating the volatilization and breakdown of the organic compounds originally encapsulated within the salt. Additionally, a steam-rich atmosphere promoted the gasification reactions of solid char derived from the decomposition of organic pollutants during pyrolysis, generating gaseous products such as CO and H2, thereby contributing to a decrease in solid yield [56]. The mass loss rate initially increased as the percentage of C content in the WSs increased (Figure 6f). This trend can be attributed to the fact that the carbon content primarily consisted of organic substances, which decomposed at high temperatures into CO2, NOx, and solid char, particularly under aerobic conditions. Notably, despite a correlation of 0.49 between C content and TOC content (Figure 2), C contributed more significantly to mass loss. This was primarily attributed to the presence of alkali salts in WSs, which decompose during pyrolysis or react with organic acids generated from the degradation of organic matter, leading to further mass loss [57,58]. When the N concentration exceeded 5%, a substantial positive correlation was observed between N (wt%) and Rml (Figure 6g). This relationship was governed by the decomposition behavior of various nitrogen-containing residues in WS. Some fully decomposable compounds, such as nitriles and amines, readily released nitrogen during pyrolysis, decomposing into CO2, NO, and H2O under aerobic conditions. Additionally, nitrogen-containing gases such as NH3 and HCN were generated [59]. Meanwhile, some CHNO compounds decomposed to form amide-N, which could subsequently undergo cyclization reactions at 400 °C, resulting in the formation of heterocyclic-N compounds that remained in the WSs [60]. It is suggested that increasing the heating temperature may be necessary to enhance the decomposition efficiency and reduce the emissions of harmful gaseous nitrogenous compounds [4]. Moreover, extending the duration of pyrolysis can facilitate complete reactions; however, optimal parameters must be determined by balancing temperature with economic feasibility (Figure 6h).
To investigate the impact of the interaction between WS characteristics and pyrolysis conditions on RTOC and Rml, we conducted a two-factor analysis by adjusting two features to predict the target variables while keeping all other features at their mean values. Four key features were identified, as shown in Figure 7a–f and Figure 7g–l, respectively.
The results suggested that the dependence of RTOC on heating temperature was more pronounced at TOC contents ranging from 0.218 wt% to 2.709 wt% (Figure 7a). This is because higher temperatures accelerate heat transfer and facilitate thermochemical reactions, indicating that heat treatment can effectively remove organic pollutants from most WS species by increasing HT (°C). In contrast, the influence of temperature becomes limited at higher boiling points of organic compounds, as these substances tend to be more structurally complex (Figure 7b). The influence of TG-M (%) on TOC removal is primarily observed at temperatures exceeding 450 °C. This phenomenon can be attributed to the range of cracking and carbonization reactions, which correspond to the major stages of mass loss [61]. Additionally, synergistic effects among organic pollutants were evident (Figure 7d). The dependence of TOC content on RTOC was more notable than that of the BP of OS (°C), due to the synergistic or antagonistic interactions during pyrolysis, which may hinder the decomposition of the primary organic pollutant [21]. Furthermore, distinct negative regions were observed when the mass loss during pyrolysis (TG-M, %) was lower than the TOC content (Figure 6e). The presence of refractory organic pollutants in WS, such as 1,3- and 1,2-xylenes, resulted in a substantial reduction in RTOC efficiency, which aligned with previous experimental findings [14]. Evidently, TG-M (%) and the BP of OS (°C) exhibited a negligible interaction effect (Figure 7f).
The mass loss rate exhibited comparable effects when moisture interacted with the elemental composition of WS (C, N), as shown in Figure 7g,h. The elemental presence of C and N positively influenced the Rml of WS at elevated moisture levels, as steam facilitated the conversion of char-C to gas-C [62]. This effect may be attributed to the cleavage of C–C bonds in certain organic molecules in the presence of water, leading to the steam gasification of char and its subsequent conversion into gaseous products [63]. Moreover, moisture promoted the conversion of nitrogenous compounds into NH3. The primary mechanism for NH3 production involved the pyrolysis of NHCO in the presence of water, which could contribute to further mass reduction [64]. Notably, the interaction between RT and moisture had a limited effect on Rml (Figure 7i) due to water evaporation. As the reaction proceeded, moisture was gradually released through evaporation at 150 °C, with only some free –OH and –O groups combining to form H2O [65]. The interactions with the C and N components are illustrated in Figure 7j. The greater dependence of the mass loss rate on N might have been attributed to the substantial presence of N-containing substances, which have been reported to release 60–80% of their N content as gaseous products during pyrolysis, in contrast to C-containing compounds [66]. Additionally, Figure 7k,l indicate that no significant interaction is observed between these two factors and RT, with mass loss fluctuating similarly as RT increases.
The PDP analysis provided valuable insights into the reaction mechanism of WS pyrolysis and contributed to process optimization. However, due to limitations in the dataset collected for this research, the prediction model selected proximate data as substitute features. Further extensive research is needed to clarify the relationships among WS components, organic characteristics, and pyrolysis parameters, as well as to incorporate reinforcement learning techniques to address the issue of limited sample data. Future studies should focus on more detailed features, such as elemental composition (i.e., the contents of C, hydrogen [H], oxygen [O], nitrogen [N], sulfur [S], and chlorine [Cl]), the atomic molar ratios of elements (i.e., H/C, O/C, and N/C), and the chemical composition of WS (e.g., the relative content of aromatic and aliphatic compounds) [67]. This study presents an operational methodology for conducting more comprehensive investigations into the pyrolysis of WS.

3.4. Model Validation

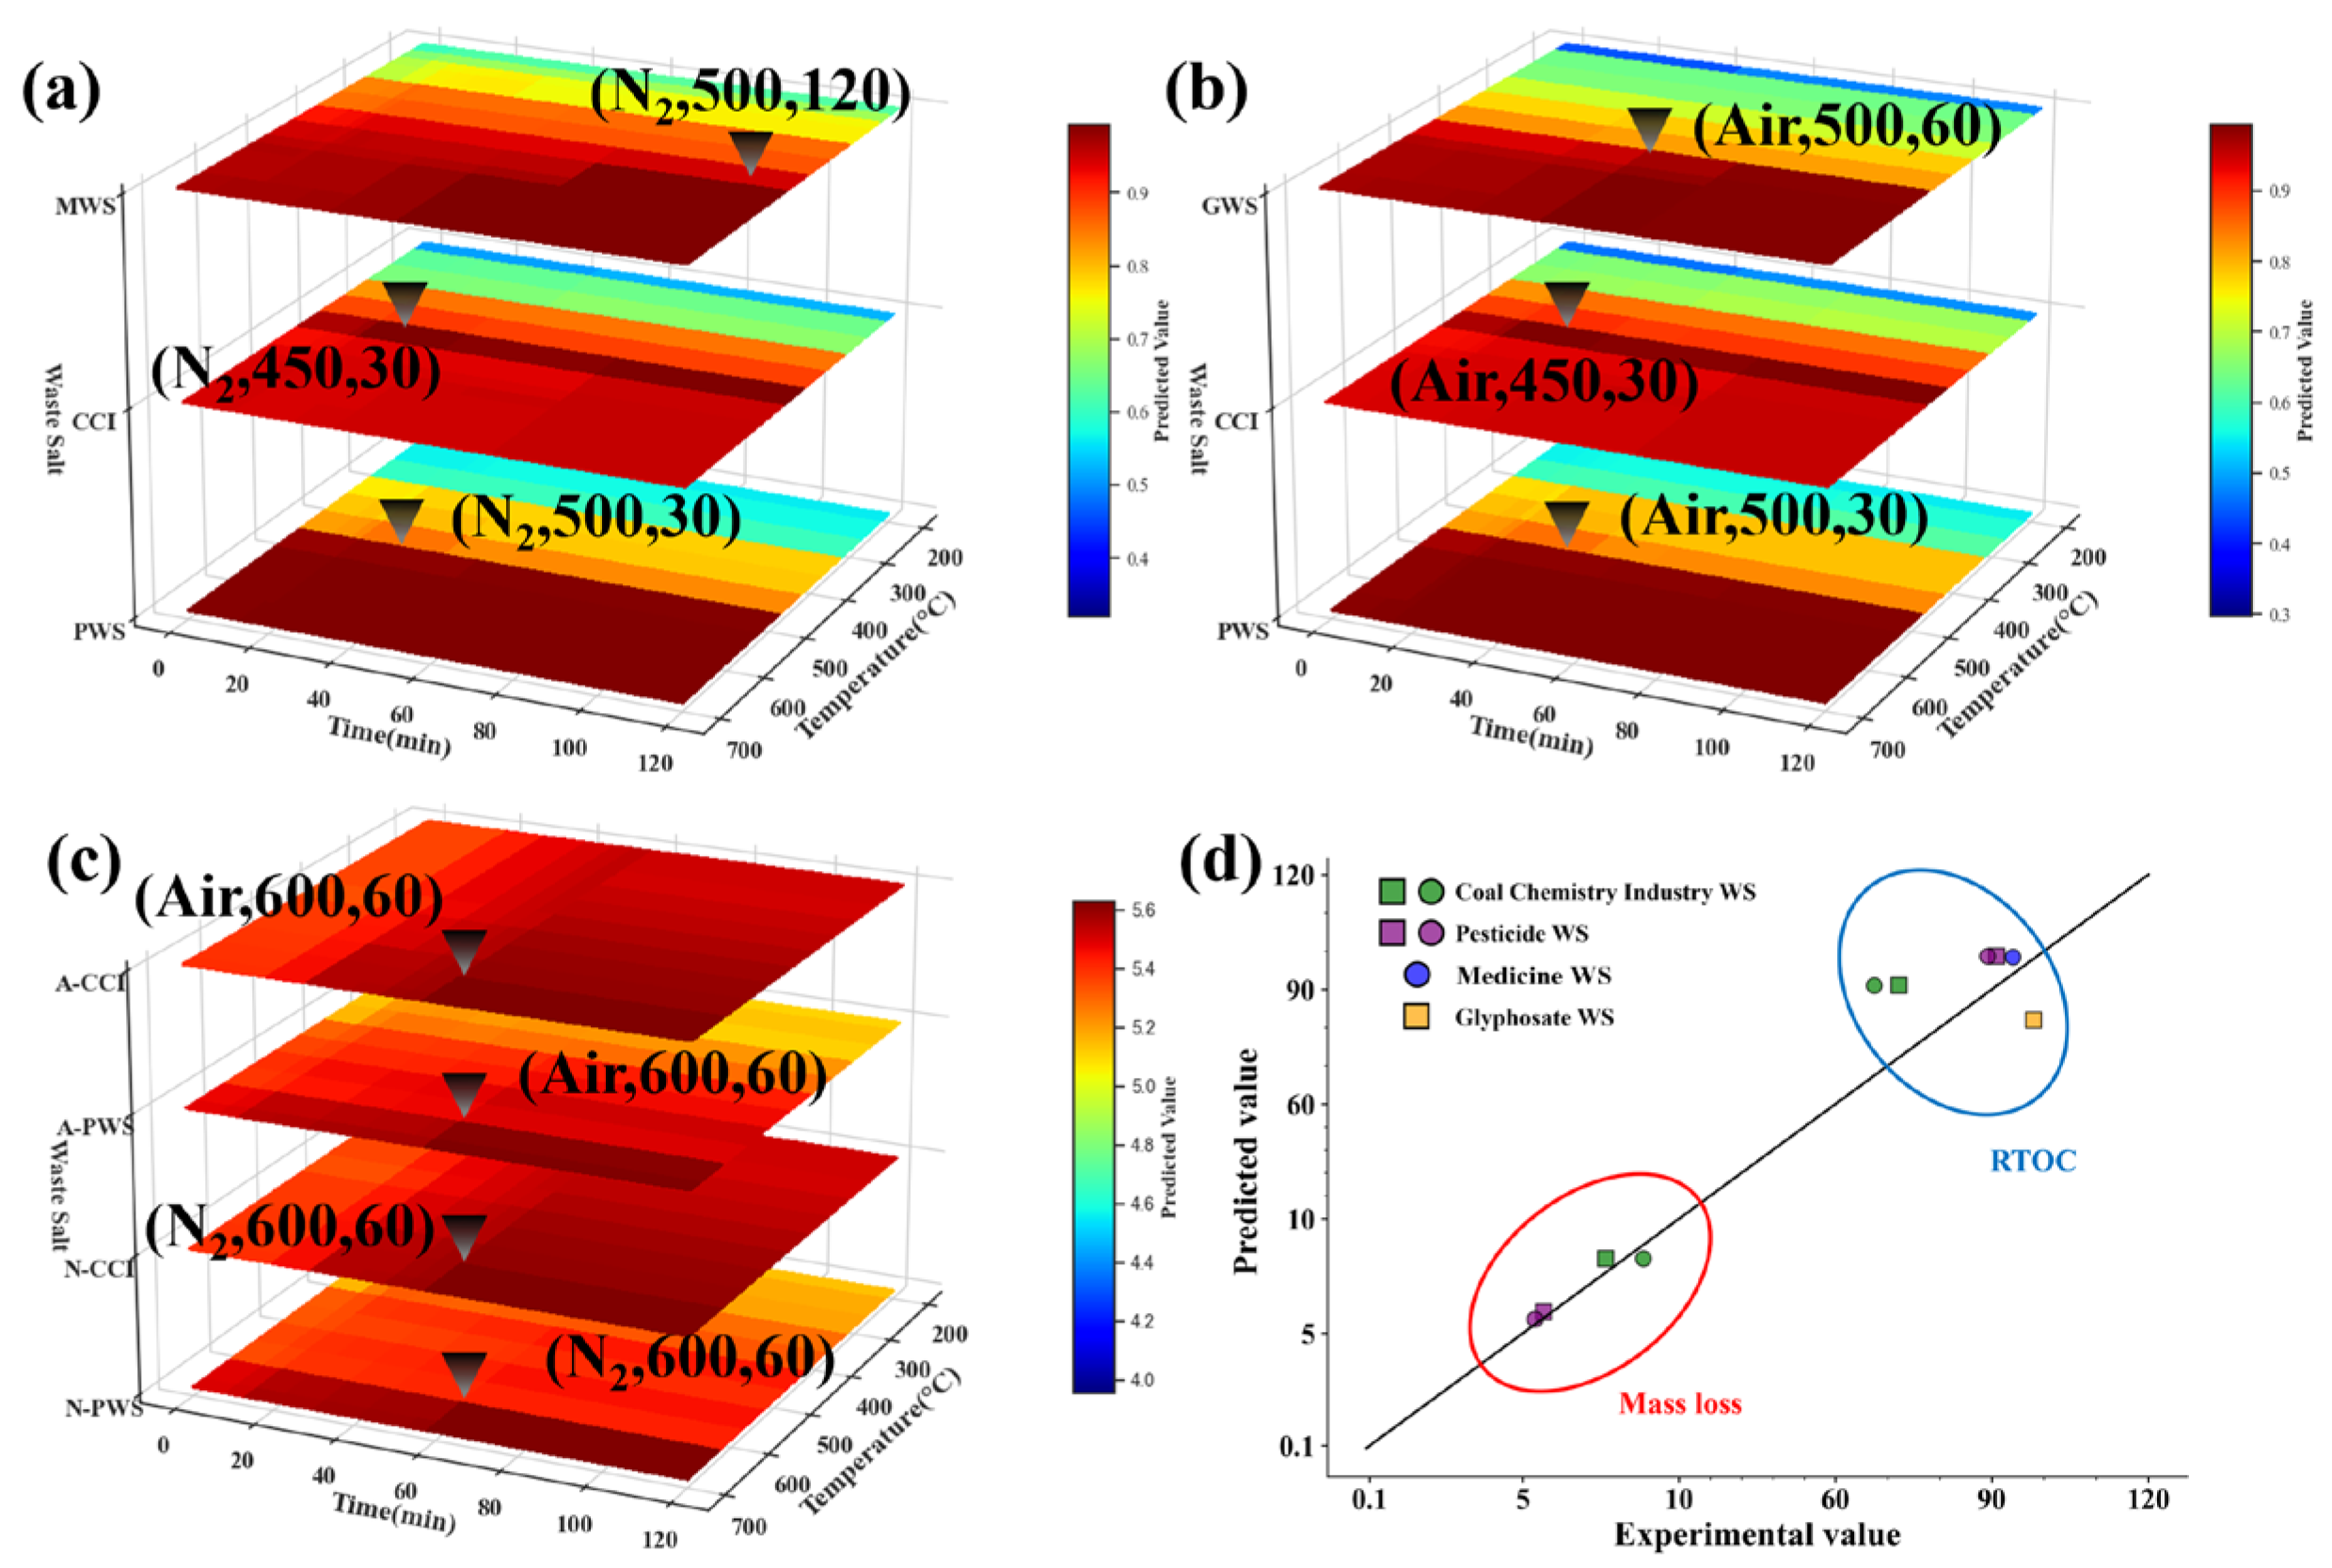
This study employed two types of WSs—coal chemical industry WS (CCI) and pesticide WS (PWS)—to experimentally validate the RTOC and Rml models and to optimize their pyrolysis conditions. Additionally, data from two supplementary WSs, medicine WS (MWS) and glyphosate WS (GWS), were incorporated to evaluate the predictive accuracy of the RTOC model [8,44]. Figure 8a,b present the iteration contours used to determine the optimal pyrolysis conditions for RTOC, while Figure 8c illustrates the Rml process.
When the HT and RT were set to 600 °C and 60 min, respectively, both CCI and PWS achieved the optimal mass loss rate, with an error margin of 4–6% compared to the actual test results (Figure 8c,d). The consistency of these results across different atmospheric conditions (N2 and Air) may be attributed to the limited dataset. Additionally, when the HT and RT were set to 450 °C and 30 min, the organic removal rates for CCI and PWS reached their maximum values (Figure 8a,b). By applying the processing parameters for MWS and GWS from the literature, the predicted RTOC values were 98.5% and 82.0%, respectively. Differences between the verification results and the RF model predictions for these two targets were analyzed (Figure 8d). While the experimental validation was acceptable, it was not entirely satisfactory. Notably, the prediction accuracy for CCI, a novel type of WS, was relatively poor due to its significant organic residue content at high temperatures. In CCI waste salts, particularly those from coal gasification sources, the TOC is much lower than in other WSs, comprising only 3–4% of the organic content found in pesticide samples. Consequently, the thermal treatment outcome, specifically the TOC removal rate, is also lower. This low RTOC characteristic has been rarely studied, and the model required additional data to fully capture the pyrolysis behavior of such WSs. A user interface (Figure S4) based on the RF model was developed using Python’s Tkinter module. This interface allowed users to obtain the optimal WS treatment parameters based on the input features. The program provided a novel approach to WS treatment and recycling while accommodating user requirements.
The exploration of the pyrolysis of WS through ML models holds potential real-world significance. Firstly, it facilitates the optimization of operational parameters for organic pollutant removal and enhances the purification of WS. Secondly, these models reveal the importance and impact patterns of key features. The feature engineering highlights the limited influence of salt compositions, filling a gap in this field. Thirdly, these models can be applied to process monitoring and control, with the user interface enabling non-experts to optimize production and ensure consistent performance. Lastly, integrating these models with environmental impact and economic feasibility assessments quantifies their potential. However, future research must address certain limitations. Despite the challenges posed by the diverse sources of waste salts and the limited studies on the topic, there remains an opportunity to further investigate the modeling of pyrolysis processes in WS.

4. Conclusions

The characteristics of WS were engineered. The inputs based on TG data, e.g., TG-M (%) and DTG-T (°C), were incorporated. The influence of salt components was found to be minimal and was subsequently excluded from the input features. ML methods, including RF, SVM, and ANN, were employed to predict RTOC and Rml models. The RF model outperformed the others, achieving test R2 and RMSE values of 0.97/0.05 and 0.99/0.32, respectively. PCC analysis and feature importance evaluation revealed that temperature was the primary factor influencing TOC removal, while moisture, along with C and N content, had the greatest impacts on the mass loss rate. Moreover, the models were validated using experimental data and the existing literature, and a user interface was developed. This study presents a novel approach for optimizing WS treatment conditions. In future research, more algorithms and features should be explored to enhance the prediction performance of RTOC and Rml, while integrating environmental impact and economic feasibility assessments to advance the application of this field.

Supplementary Materials

The following supporting information can be downloaded at: https://www.mdpi.com/article/10.3390/su17073216/s1, Figure S1: Predictive performance of initial dataset for RTOC: (a) SVM, (b) RF, and (c) ANN. Predictive performance for mass loss rate: (d) SVM, (e) RF, and (f) ANN; Figure S2: Feature importance results of initial ML model; Figure S3: PDPs for the rest features in two models: (a-c) RTOC and (d-g) Rml.; Figure S4: User Interface of this work; Table S1: Properties of waste salt extracted from each of the papers; Table S2: Statistical analysis of the whole datasets; Table S3: Features of the initial model and updated model.

Author Contributions

Conceptualization, R.Z.; Methodology, R.Z. and Q.G.; Investigation, R.Z. and Q.G.; Data curation, R.Z. and Q.W.; Writing—original draft, R.Z.; Writing—review and editing, R.Z. and Q.G.; Supervision, G.X. All authors have read and agreed to the published version of the manuscript.

Funding

This research received no external funding.

Institutional Review Board Statement

Not applicable.

Informed Consent Statement

Not applicable.

Data Availability Statement

Data will be made available on request.

Acknowledgments

The authors thank the University of Chinese Academic of Sciences for providing the analytical test conditions. The authors also thank Zhao Zhang and Zhichao Xu from the University of Chinese Academy of Sciences for their critical review and constructive suggestions in refining the manuscript.

Conflicts of Interest

The authors declare no conflicts of interest.

References

  1. Cui, Z.; Wang, W.; Lin, Y.; Hu, M.; Li, Y.; Pan, B.; Tan, M.; Zhang, Y. Simultaneous ion fractionation and concentration by selectrodialysis for saline wastewater valorization. Desalination 2023, 554, 116489. [Google Scholar] [CrossRef]
  2. Huang, G.; Guo, X.; Xu, J.; Wu, S. Improved Sedimentation Performance of Low-Rank Coal by Coprocessing with Saline Wastewater. Min. Metall. Explor. 2021, 38, 1267–1276. [Google Scholar] [CrossRef]
  3. Li, W.; Huang, Z.; Lei, G.; Xu, Y.; Huang, A.L.Y.; Huang, Q. Combustion and pyrolysis characteristics of pesticide residue. J. CSEE 2018, 38, 2691–2698. [Google Scholar]
  4. Feng, L.; Tian, B.; Zhang, L.; Yang, M. Pyrolysis of hydrazine hydrate waste salt: Thermal behaviors and transformation characteristics of organics under aerobic/anaerobic conditions. J. Environ. Manag. 2022, 323, 116304. [Google Scholar] [CrossRef] [PubMed]
  5. Wu, Q.; Yuan, W.; Wang, J.; Zhang, K.; Tian, S.; Li, M. Research progress of industrial waste salt thermal treatment technologies. J. Environ. Eng. Technol. 2022, 12, 1668–1680. [Google Scholar]
  6. Lijia, W. Research on the Valorization and Disposal Technology of Industrial Waste Salt. Master’s Thesis, Zhejiang Gongshang University, Hangzhou, China, 2020. [Google Scholar]
  7. Wang, N.; Huo, H.; He, Y.; Zheng, Y.; Liu, Y.; Wei, H. Research progress and inspiration on the generation and treatment technology of chemical waste salt. Chin. J. Environ. Eng. 2024, 18, 1–13. [Google Scholar]
  8. Wang, J.; Hong, X.; Fang, G.; Zhang, X. Deep purification of pesticide waste salt containing high-concentration organic pollutants by ethanol solvents washing and heating treatment. J. Environ. Chem. Eng. 2024, 12, 112480. [Google Scholar] [CrossRef]
  9. Annamalai, S.; Chandrasekaran, K.; Shin, W.S.; Sundaram, M.; Khaleel, T.M. Beyond dumping: New strategies in the separation of preservative salt from tannery waste mixed salt and its reuse for tannery industrial application. Environ. Res. 2022, 214, 113885. [Google Scholar] [CrossRef]
  10. Xin, H.; Chen, X.; Lin, S.; Luo, H.; Cao, Y.; Tang, C.Y.; Liu, G. Resource utilization of coal chemical waste salt by bipolar membrane electrodialysis with thermal pretreatment. Desalination 2024, 580, 117553. [Google Scholar] [CrossRef]
  11. Wang, X.; Gong, Y.; Qin, J.; Cheng, J.; Gong, C.; Jiang, D. Deep removal of organic matter in glyphosate contained industrial waste salt by dielectric barrier discharge plasma. J. Environ. Chem. Eng. 2021, 9, 106295. [Google Scholar]
  12. Liu, S.; Zhang, T.; Yang, Q.; Li, H. Synergistic promotion of low-temperature pyrolysis and chloride complexation in waste salt purification process. J. Mater. Cycles Waste Manag. 2024, 26, 2435–2444. [Google Scholar]
  13. Xiong, P. Study on Heat Treatment Characteristics of Tymiomycin Waste Salt and the Utilization of Generated Carbon. Master’s Thesis, Nanjing University of Science and Technology, Nanjing, China, 2021. [Google Scholar]
  14. Weishi, L.; Zechun, H.; Yuqiang, L.; Qifei, H.; Ya, X.; Lu, D.; Jingcai, L. Evaluation of low-medium temperature pretreatment on the removal efficiency of organic toxic pollutants from pesticide waste salts: Characteristics, regularity, and key factors. J. Clean. Prod. 2021, 316, 128118. [Google Scholar]
  15. Feng, L.; Tian, B.; Chen, L.; Yang, M. Purification and recovery of NaCl from epoxy resin waste salt through an integrated process based on aqueous two-phase systems (ATPS). J. Environ. Chem. Eng. 2024, 12, 113091. [Google Scholar]
  16. Wang, L.; Wang, Z.L.; Ma, T.W. High-temperature Treatment of Simulated Sodium Chloride Salt Slag. Environ. Prot. Chem. Ind. 2014, 34, 419–422. [Google Scholar]
  17. Xi, S.; Wei, X.; Ding, J.; Wang, W.; Lu, J. The removal of organic contaminants from industrial waste salts by pyrolysis and potential use for energy storage. J. Clean. Prod. 2023, 425, 138931. [Google Scholar] [CrossRef]
  18. Zhang, L. Study of Pyrolysis Characteristics and Comprehensive Utilization of Organics-Containing Industrial Mixed-Salts. Master’s Thesis, China University of Petroleum, Beijing, China, 2018. [Google Scholar]
  19. Chen, L. Study on Heat Treatment of Sodium Chloride Waste Salt by Product from Glyphosate Industry. Master’s Thesis, Hefei University of Technology, Hefei, China, 2021. [Google Scholar]
  20. Yang, H.; Chen, Z.; Zhang, Y.; Liu, B.; Yang, Y.; Tang, Z.; Chen, Y.; Chen, H. Catalytic effect of K and Na with different anions on lignocellulosic biomass pyrolysis. Front. Chem. Sci. Eng. 2024, 18, 141. [Google Scholar]
  21. Wang, J.; Feng, Y.; Huang, Q.; He, Y.; Shi, M. Unraveling the pyrolysis behavior and co-pyrolysis characteristics of EVA and backsheet in spent crystalline silicon photovoltaic modules. Chem. Eng. J. 2025, 506, 160164. [Google Scholar]
  22. Ascher, S.; Watson, I.; You, S. Machine learning methods for modelling the gasification and pyrolysis of biomass and waste. Renew. Sustain. Energy Rev. 2022, 155, 111902. [Google Scholar]
  23. Wolpert, D.H.; Macready, W.G. No free lunch theorems for optimization. IEEE Trans. Evol. Comput. 1997, 1, 67–82. [Google Scholar] [CrossRef]
  24. Wang, H.S.-H.; Yao, Y. Machine learning for sustainable development and applications of biomass and biomass-derived carbonaceous materials in water and agricultural systems: A review. Resour. Conserv. Recycl. 2023, 190, 106847. [Google Scholar] [CrossRef]
  25. Dong, Z.; Bai, X.; Xu, D.; Li, W. Machine learning prediction of pyrolytic products of lignocellulosic biomass based on physicochemical characteristics and pyrolysis conditions. Bioresour. Technol. 2023, 367, 128182. [Google Scholar]
  26. Potnuri, R.; Rao, C.S.; Surya, D.V.; Kumar, A.; Basak, T. Utilizing support vector regression modeling to predict pyro product yields from microwave-assisted catalytic co-pyrolysis of biomass and waste plastics. Energy Convers. Manag. 2023, 292, 117387. [Google Scholar]
  27. Cullen, L.; Marinoni, A.; Cullen, J. Machine learning for gap-filling in greenhouse gas emissions databases. J. Ind. Ecol. 2024, 28, 636–647. [Google Scholar]
  28. Yu, Z.; Guo, W.; Yang, P.; Zhang, J.; Gao, K.; Shang, J.; Yang, B.; Wu, Z. In-situ infrared and kinetic characteristics analysis on pyrolysis of tar-rich coal and macerals. Fuel 2023, 348, 128601. [Google Scholar] [CrossRef]
  29. Mu, Y.; Liu, X.; Wang, L. A Pearson’s correlation coefficient based decision tree and its parallel implementation. Inf. Sci. 2018, 435, 40–58. [Google Scholar]
  30. Li, J.; Pan, L.; Suvarna, M.; Tong, Y.W.; Wang, X. Fuel properties of hydrochar and pyrochar: Prediction and exploration with machine learning. Appl. Energy 2020, 269, 115166. [Google Scholar] [CrossRef]
  31. Sahu, P.; Gangil, S. ANN approach for the prediction of pyrolytic behaviour of pigeon pea stalk and insight into thermo-kinetics of pseudo components using RSM. J. Clean. Prod. 2024, 449, 141816. [Google Scholar] [CrossRef]
  32. Song, Y.; Huang, Z.; Jin, M.; Liu, Z.; Wang, X.; Hou, C.; Zhang, X.; Shen, Z.; Zhang, Y. Machine learning prediction of biochar physicochemical properties based on biomass characteristics and pyrolysis conditions. J. Anal. Appl. Pyrolysis 2024, 181, 106596. [Google Scholar]
  33. Chen, C.; Wang, Z.; Ge, Y.; Liang, R.; Hou, D.; Tao, J.; Yan, B.; Zheng, W.; Velichkova, R.; Chen, G. Characteristics prediction of hydrothermal biochar using data enhanced interpretable machine learning. Bioresour. Technol. 2023, 377, 128893. [Google Scholar]
  34. Wang, C.; Zhang, X.; Zhao, G.; Chen, Y. Mechanisms, methods and applications of machine learning in bio-alcohol production and utilization: A review. Chemosphere 2023, 342, 140191. [Google Scholar]
  35. Genuer, R.; Poggi, J.-M.; Tuleau-Malot, C. Variable selection using random forests. Pattern Recognit. Lett. 2010, 31, 2225–2236. [Google Scholar] [CrossRef]
  36. Leng, L.; Yang, L.; Lei, X.; Zhang, W.; Ai, Z.; Yang, Z.; Zhan, H.; Yang, J.; Yuan, X.; Peng, H.; et al. Machine learning predicting and engineering the yield, N content, and specific surface area of biochar derived from pyrolysis of biomass. Biochar 2022, 4, 63. [Google Scholar] [CrossRef]
  37. Wei, S.; Zhu, M.; Fan, X.; Song, J.; Peng, P.; Li, K.; Jia, W.; Song, H. Influence of pyrolysis temperature and feedstock on carbon fractions of biochar produced from pyrolysis of rice straw, pine wood, pig manure and sewage sludge. Chemosphere 2019, 218, 624–631. [Google Scholar] [CrossRef] [PubMed]
  38. Dong, Z.; Tao, Y.; Ye, H.; Xin, X. Experimental and numerical study on pyrolysis characteristics of organic impurities in waste salt. J. Clean. Prod. 2024, 444, 141223. [Google Scholar] [CrossRef]
  39. Liu, J.; Lyu, H.; Cheng, C.; Xu, Z.; Zhang, W. Enhancing pyrolysis process monitoring and prediction for biomass: A machine learning approach. Fuel 2024, 362, 130873. [Google Scholar] [CrossRef]
  40. Zhao, Z.; Xu, W.; Wang, Z.; Qin, W.; Lei, J.; Guo, X.; Long, J. Investigation of organic impurity and its occurrence in industrial waste salt produced by physicochemical process. PLoS ONE 2021, 16, e0256101. [Google Scholar] [CrossRef]
  41. Weng, S.; Zhou, J.; Tian, Y.; Jiang, X.; Chen, R.; Hu, J.; Guo, Z.; Chen, L.; Chen, W. Compatibility Study between 50% H2O2/H2SO4 Solution and Some Common Organic Solvents. Org. Process Res. Dev. 2024, 28, 2542–2551. [Google Scholar] [CrossRef]
  42. Cen, K.; Cao, X.; Chen, D.; Zhou, J.; Chen, F.; Li, M. Leaching of alkali and alkaline earth metallic species (AAEMs) with phenolic substances in bio-oil and its effect on pyrolysis characteristics of moso bamboo. Fuel Process. Technol. 2020, 200, 106332. [Google Scholar] [CrossRef]
  43. Guo, Q.; Chen, G.; Cheng, Z.; Yan, B.; Ma, W.; Hou, L. The effect of alkali metal chlorides and temperature on acid-hydrolysis residual pyrolysis products. J. Anal. Appl. Pyrolysis 2019, 137, 106–117. [Google Scholar] [CrossRef]
  44. Yang, W.; Ping, X.; Sun, X.; Han, W. Study on combustion characteristics of waste pharmaceutical Na2SO4 and impurity removal by low-temperature carbonization. Inorg. Chem. Ind. 2021, 53, 76–82. [Google Scholar]
  45. Huang, Z.; Wang, X.-J.; Ren, X. Kinetic study of sesame stalk pyrolysis by thermogravimetric analysis. Renew. Energy 2024, 222, 119878. [Google Scholar]
  46. Zhang, S.; Cui, H.; Hu, X.; Qu, A. Research on heat treatment of NaCl-KCl waste salt in pesticide industry. Inorg. Chem. Ind. 2023, 55, 106–112. [Google Scholar]
  47. Mašek, O.; Brownsort, P.; Cross, A.; Sohi, S. Influence of production conditions on the yield and environmental stability of biochar. Fuel 2013, 103, 151–155. [Google Scholar]
  48. Li, C.; Jiang, G.; An, C.; Fei, Z.; Chi, Y.; Yan, J. Combustion and Pyrolysis Characteristics of Pesticide Residue. Proc. CSEE 2009, 29, 45–50. [Google Scholar]
  49. Antoniadis, A.; Lambert-Lacroix, S.; Poggi, J.-M. Random forests for global sensitivity analysis: A selective review. Reliab. Eng. Syst. Saf. 2021, 206, 107312. [Google Scholar] [CrossRef]
  50. Fonseca, F.G.; Funke, A.; Niebel, A.; Dias, A.P.S. Moisture content as a design and operational parameter for fast pyrolysis. J. Anal. Appl. Pyrolysis 2019, 139, 73–86. [Google Scholar]
  51. Yang, Y.; Zhang, Y.; Omairey, E.; Cai, J.; Gu, F.; Bridgwater, A.V. Intermediate pyrolysis of organic fraction of municipal solid waste and rheological study of the pyrolysis oil for potential use as bio-bitumen. J. Clean. Prod. 2018, 187, 390–399. [Google Scholar]
  52. Gao, R. Study on Heat Treatment Mechanism of Organic Waste Removal Based on Fluidized Bed. Master’s Thesis, Zhejiang University, Hangzhou, China, 2020. [Google Scholar]
  53. Satou, M.; Yokoyama, S.; Sanada, Y. Structural analysis and estimation of boiling point of hydrocarbons in a coal-derived liquid by a group contribution method. Fuel 1992, 71, 565–574. [Google Scholar] [CrossRef]
  54. Mao, X.; Song, X.; Lu, G.; Sun, Y.; Xu, Y.; Yu, J. Control of Crystal Morphology and Size of Calcium Sulfate Whiskers in Aqueous HCl Solutions by Additives: Experimental and Molecular Dynamics Simulation Studies. Ind. Eng. Chem. Res. 2015, 54, 4781–4787. [Google Scholar]
  55. Kwiecińska, B.; Pusz, S.; Valentine, B.J. Application of electron microscopy TEM and SEM for analysis of coals, organic-rich shales and carbonaceous matter. Int. J. Coal Geol. 2019, 211, 103203. [Google Scholar] [CrossRef]
  56. Xiong, S.; Zhuo, J.; Zhang, B.; Yao, Q. Effect of moisture content on the characterization of products from the pyrolysis of sewage sludge. J. Anal. Appl. Pyrolysis 2013, 104, 632–639. [Google Scholar]
  57. Ministry of Ecology and Environment of the People’s Republic of China. Guidelines for Environmental Management of Waste Salt in the Chemical Industry (Draft for Comment). Available online: https://www.mee.gov.cn/xxgk2018/xxgk/xxgk06/202101/W020210104377240592817.pdf (accessed on 25 March 2025).
  58. Wei, Y.; Shen, C.; Xie, J.; Bu, Q. Study on reaction mechanism of superior bamboo biochar catalyst production by molten alkali carbonates pyrolysis and its application for cellulose hydrolysis. Sci. Total Environ. 2020, 712, 136435. [Google Scholar] [CrossRef]
  59. Zhan, H.; Zhuang, X.; Song, Y.; Chang, G.; Wang, Z.; Yin, X.; Wang, X.; Wu, C. Formation and regulatory mechanisms of N-containing gaseous pollutants during stage-pyrolysis of agricultural biowastes. J. Clean. Prod. 2019, 236, 117706. [Google Scholar] [CrossRef]
  60. Wei, F.; Cao, J.-P.; Zhao, X.-Y.; Ren, J.; Wang, J.-X.; Fan, X.; Wei, X.-Y. Nitrogen Evolution during Fast Pyrolysis of Sewage Sludge under Inert and Reductive Atmospheres. Energy Fuels 2017, 31, 7191–7196. [Google Scholar] [CrossRef]
  61. Bai, F.; Sun, Y.; Liu, Y.; Li, Q.; Guo, M. Thermal and kinetic characteristics of pyrolysis and combustion of three oil shales. Energy Convers. Manag. 2015, 97, 374–381. [Google Scholar] [CrossRef]
  62. Liu, H.; Zhang, Q.; Hu, H.; Li, A.; Yao, H. Influence of residual moisture on deep dewatered sludge pyrolysis. Int. J. Hydrogen Energy 2014, 39, 1253–1261. [Google Scholar]
  63. Widyawati, M.; Church, T.L.; Florin, N.H.; Harris, A.T. Hydrogen synthesis from biomass pyrolysis with in situ carbon dioxide capture using calcium oxide. Int. J. Hydrogen Energy 2011, 36, 4800–4813. [Google Scholar] [CrossRef]
  64. Liu, X.; Luo, Z.; Yu, C.; Xie, G. Conversion mechanism of fuel-N during pyrolysis of biomass wastes. Fuel 2019, 246, 42–50. [Google Scholar] [CrossRef]
  65. Zhu, J.; Lin, S.; Fan, Y.; Chen, Y.; Jin, L.; Gao, H. Investigations on the iron-rich textile dyeing sludge pyrolysis characteristics: Thermal decomposition behaviors, products, potential mechanisms. J. Anal. Appl. Pyrolysis 2023, 169, 105834. [Google Scholar] [CrossRef]
  66. Glarborg, P.; Jensen, A.D.; Johnsson, J.E. Fuel nitrogen conversion in solid fuel fired systems. Prog. Energy Combust. Sci. 2003, 29, 89–113. [Google Scholar]
  67. Wu, Z.; Zhang, Q.; Yu, H.; Fu, L.; Yang, Z.; Lu, Y.; Guo, Z.; Li, Y.; Zhou, X.; Liu, Y.; et al. Quantitative analysis of pyrolysis characteristics and chemical components of tobacco materials based on machine learning. Front. Chem. 2024, 12, 1353745. [Google Scholar] [CrossRef] [PubMed]
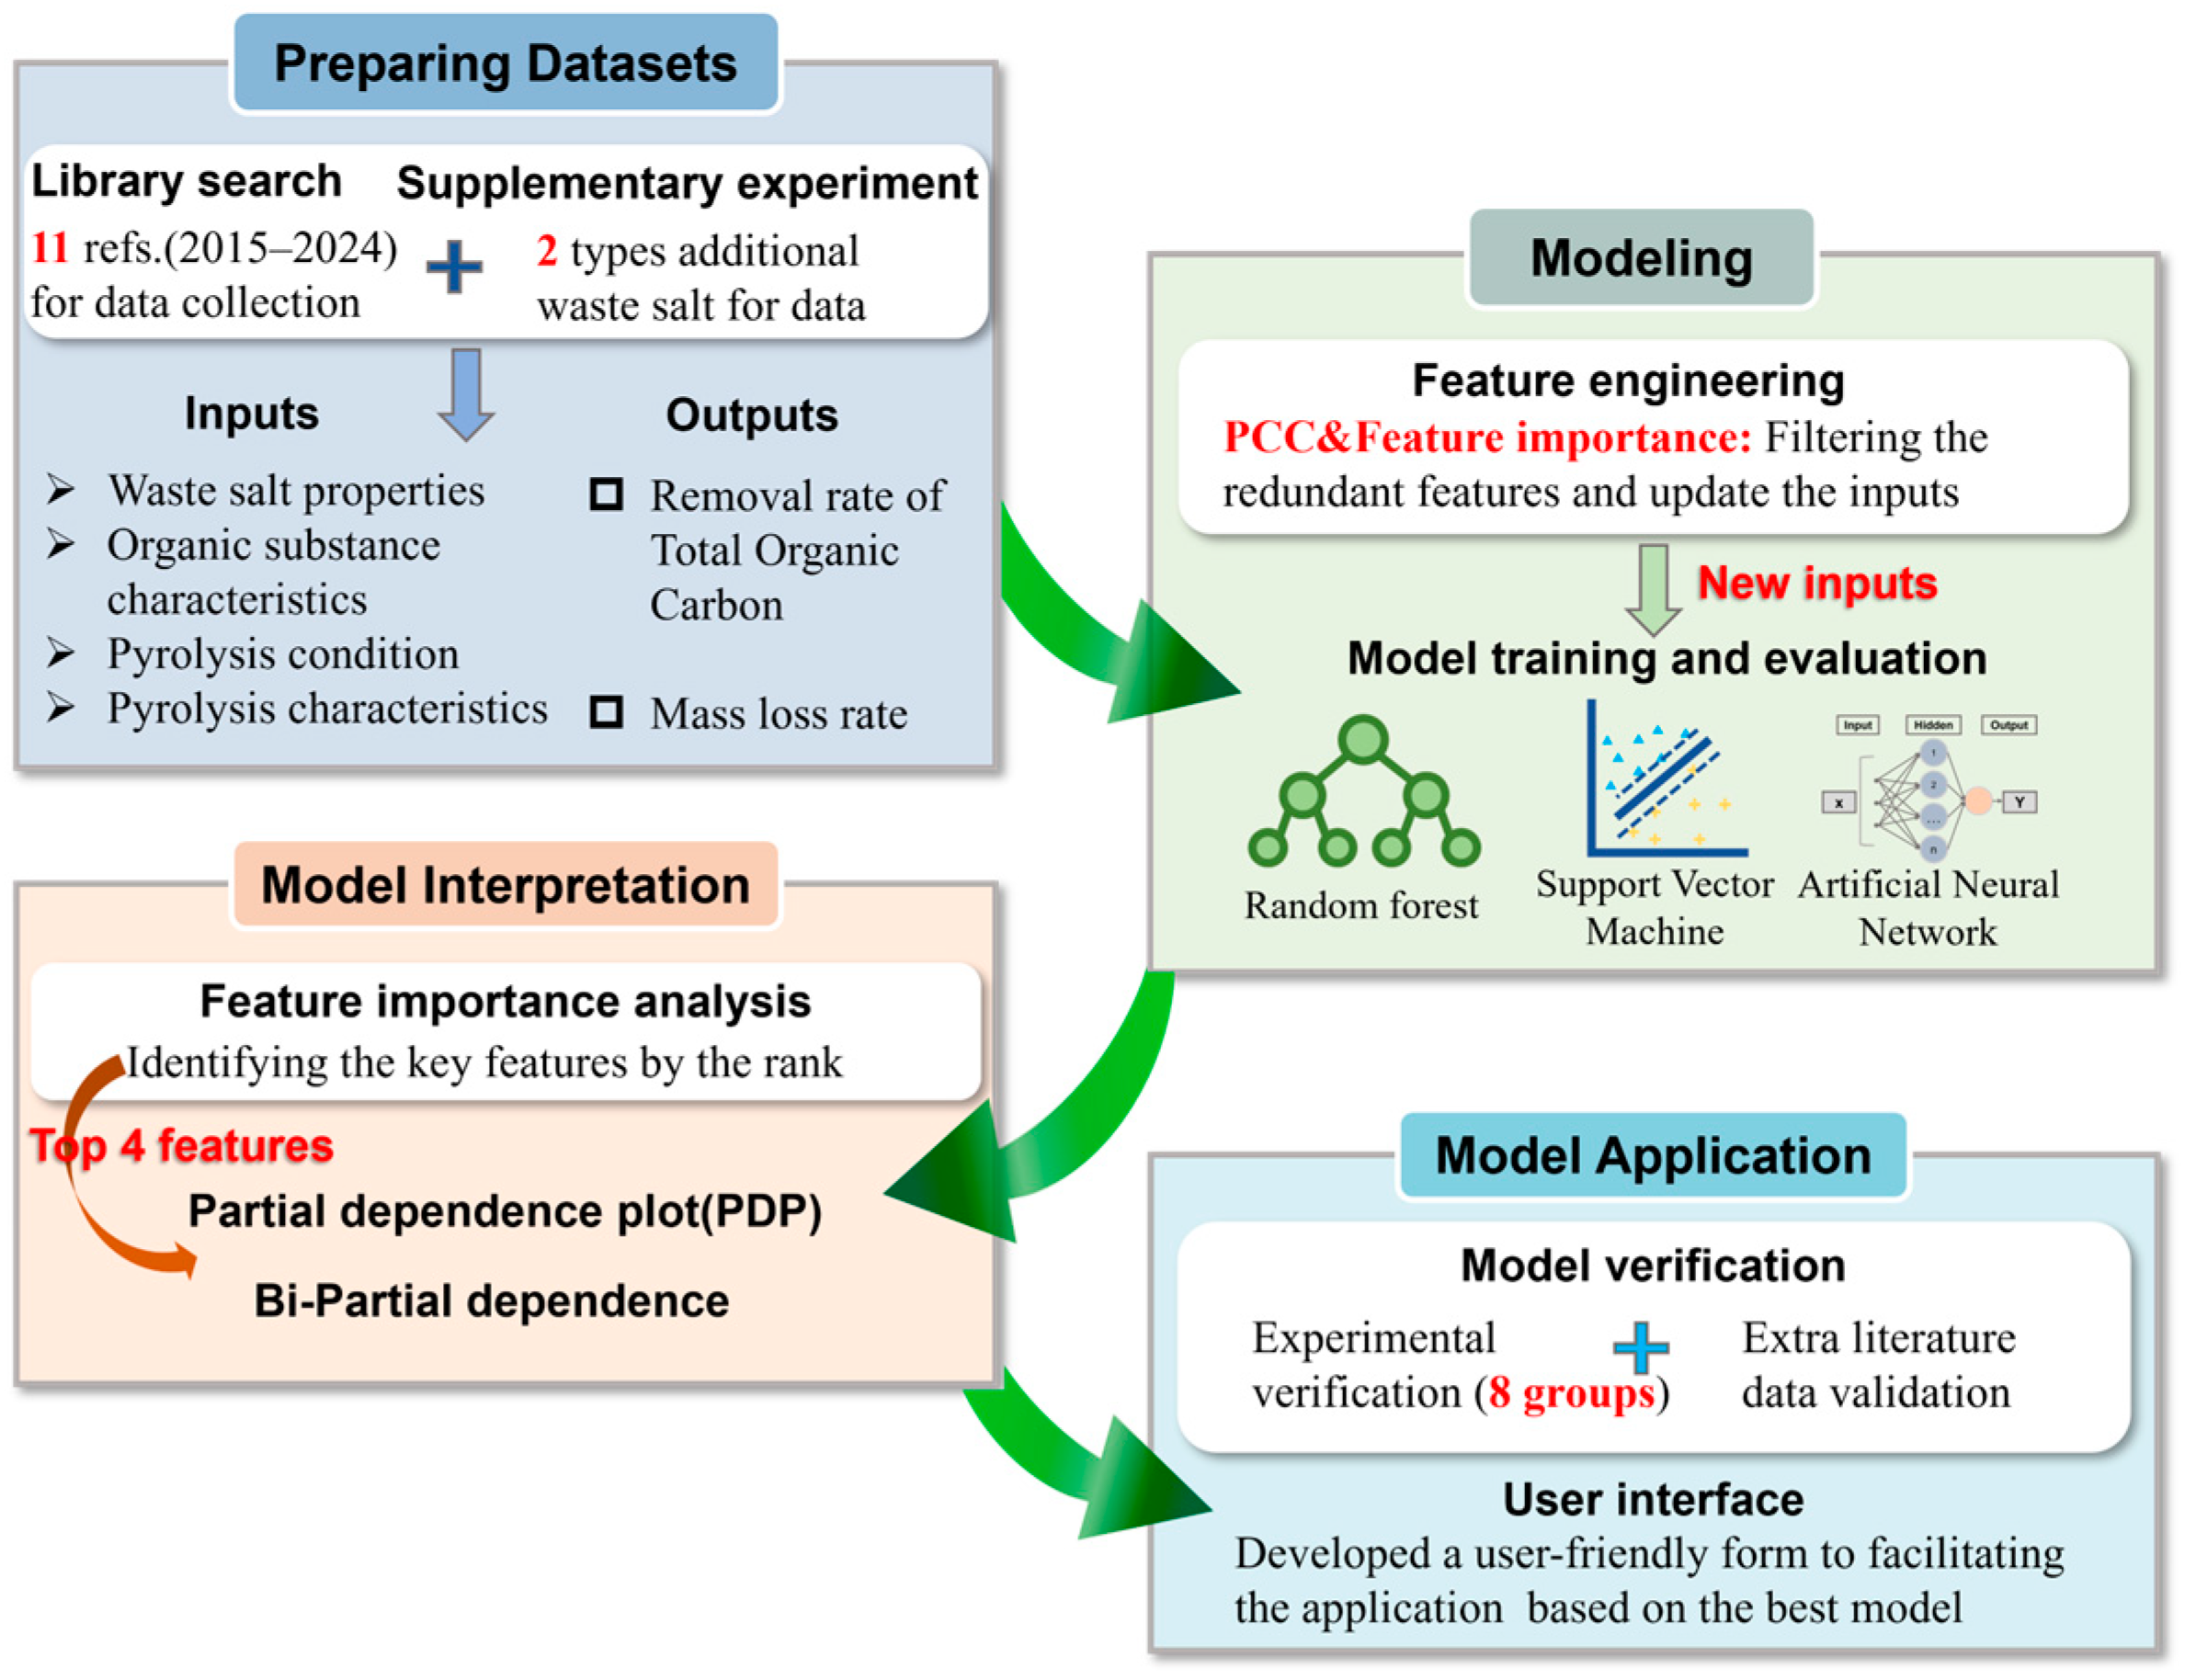
Figure 1. Machine learning workflow in this study.
Sustainability 17 03216 g001
Figure 2. PCC matrix between variables for the datasets: (a) PCC heatmap based on RTOC and (b) PCC heatmap based on Rml. The results highlighted with red squares represent the strongest correlations that were ultimately removed.
Sustainability 17 03216 g002
Figure 3. Comparison of model performance using different input features based on SVM, RF, and ANN: (a) RTOC prediction results, (b) Rml prediction results.
Sustainability 17 03216 g003
Figure 4. Predictive performance for RTOC: (a) SVM, (b) RF, and (c) ANN. Predictive performance for mass loss rate: (d) SVM, (e) RF, and (f) ANN.
Sustainability 17 03216 g004
Figure 5. Feature importance ranking for each feature: (a) RTOC, (b) Rml. Sensitivity analysis of the top four key features: (c) RTOC, (d) Rml.
Sustainability 17 03216 g005
Figure 6. PDPs for the top four predictors of (ad) RTOC and (eh) Rml.
Sustainability 17 03216 g006
Figure 7. Bivariate PDPs of any two key inputs for the targets: (af) RTOC and (gl) Rml.
Sustainability 17 03216 g007
Figure 8. Model validation of optimal schemes for two targets: (a) optimal parameters for RTOC of MWS, CCI, and PWS under N2 atmosphere; (b) optimal parameters for RTOC of GWS, CCI, and PWS under air atmosphere; (c) optimal parameters for Rml of CCI and PWS under both atmospheres; (d) experimental verification of different cases.
Sustainability 17 03216 g008
Disclaimer/Publisher’s Note: The statements, opinions and data contained in all publications are solely those of the individual author(s) and contributor(s) and not of MDPI and/or the editor(s). MDPI and/or the editor(s) disclaim responsibility for any injury to people or property resulting from any ideas, methods, instructions or products referred to in the content.