Article

Evaluating Pollution Reduction and Carbon Mitigation in China’s Zero-Waste Cities

1
School of Economics and Management, Chongqing Normal University, Chongqing 401331, China
2
School of Accounting and Finance, Chongqing Business Vocational College, Chongqing 401331, China
*
Authors to whom correspondence should be addressed.
Sustainability 2025, 17(7), 3215; https://doi.org/10.3390/su17073215
Submission received: 2 March 2025 / Revised: 30 March 2025 / Accepted: 2 April 2025 / Published: 4 April 2025
(This article belongs to the Section Development Goals towards Sustainability)

Abstract

Efficient waste management is instrumental in both reducing waste generation and mitigating CO2 emissions. The Zero-waste City Pilot (ZWCP) policy, a location-oriented waste governance initiative, aims to minimize waste production, enhance waste management efficiency, and improve resource utilization. Therefore, does the ZWCP policy achieve the dual environmental effect of pollution reduction and carbon mitigation? Based on panel data from 158 cities in China from 2011 to 2021, this paper employed a difference-in-differences (DID) model to empirically assess the impact of the ZWCP policy on solid waste and CO2 emissions. The results indicate that: (1) The ZWCP policy effectively reduced both solid waste and CO2 emissions, and the estimation results are robust as shown by robustness testing. (2) The policy achieved pollution reduction and carbon mitigation through two transmission mechanisms: stimulating green technological innovation and strengthening environmental regulation. (3) Heterogeneity analysis revealed that the policy’s effects on pollution reduction and carbon mitigation are more pronounced in central regions, non-resource-based cities, and large cities. (4) The ZWCP policy demonstrated no discernible enterprise exit effect, indicating its success in balancing environmental protection with economic growth, thereby providing a strong rationale for its extension to additional pilot regions. (5) The spatial spillover effect analysis revealed no significant spatial spillover of the ZWCP policy’s dual environmental effects. This may stem from the policy’s urban-centric implementation, uneven resource allocation and weak cross-regional collaboration mechanisms—factors that highlight the necessity for stronger cross-regional governance in waste management strategies. The study’s conclusions carry important policy implications for advancing China’s ecological civilization goals while provide valuable insights for other developing countries seeking to design effective zero-waste strategies.

1. Introduction

Amid rapid urbanization and industrialization, the environmental challenges posed by solid waste have attracted increasing attention. The Global Waste Management Outlook (2024) projects alarming trends: without immediate intervention, global municipal solid waste generation is expected to increase by 1.5 billion tons by 2050 compared to 2023 levels [1]. Concurrently, the direct costs associated with waste management are projected to rise from $252.0 billion in 2020 to $640.3 billion by 2050 [1], underscoring the urgent need for effective waste management strategies. Beyond environmental pollution and rising management costs, solid waste treatment contributes significantly to greenhouse gas (GHG) emissions. Landfill biogas, for example, generally consists of 45–76% CH4 and 30–45% CO2 [2,3,4,5]. While gas collection systems help capture GHG emissions, approximately 10–50% of landfill GHG emissions still release into the atmosphere [6,7,8]. Overall, direct carbon emissions generated during solid waste management account for approximately 3.2% of global GHG emissions [9,10,11]. Data from Climate Watch reveal that solid waste management in China generated over 216.23 million tons of CO2 in 2021 [12]. Exploring sustainable solid waste management practices is therefore essential to achieving pollution reduction and carbon mitigation (PRCM). This serves a dual purpose: alleviating environmental pressure while making substantive contributions to global climate change mitigation. Furthermore, in-depth research and implementation of innovative waste management strategies can catalyze synergistic economic, social, and environmental progress, serving as a key driver in global transition toward a sustainable, green and low-carbon future.
In response to the global PRCM imperative, international organizations and countries have actively pursued strategic initiatives. “The European Green Deal” announced by European Union and Japan’s “The Green Growth Strategy for Carbon Neutrality by 2050” exemplify this trend, demonstrating how sustainable development with green and low-carbon practices has become a global consensus [13]. As a major contributor to global solid waste and carbon emissions, China has been proactively exploring pathways for green, low-carbon development. A pivotal initiative toward this goal is the zero-waste city pilot (ZWCP). This concept was first introduced in China through a 2017 proposal by Academician Du Xiangwan, titled “On Promoting the Resource Utilization of Solid Waste and Building a Zero-Waste Society through the Zero-Waste City Pilot”. The Chinese government prioritized this recommendation, leading to the 2018 release of the “Pilot Work Plan for the Construction of Zero-Waste City”. By April 2019, the Ministry of Ecology and Environment of China (MEEC) had designated 16 cities and regions as zero-waste pilot sites. These pilots aim not only to achieve ecological goals thought efficient waste management but also to enhance the synergistic relationship between reducing pollution and mitigating carbon emissions [14,15]. The program’s expansion to 108 cities in 2022 underscores China’s strong commitment to the ZWCP and its crucial role in advancing sustainable waste management. China’s pioneering zero-waste city (ZWC) development provides both domestic implementation models and valuable global insights for environmental governance and climate change mitigation. By examining the ecological effects of China’s ZWCP policy, this study can facilitate significant advancements in solid waste management, thereby generating new momentum for achieving global sustainable development goals.
Numerous studies have demonstrated that optimized solid waste management can minimize solid waste emissions, enhance energy efficiency, and lower carbon emissions [16]. As such, China’s ZWCP policy holds significant potential to improve environmental quality and support the nation’s “dual carbon” goals of carbon peaking and carbon neutrality. Despite these theoretical expectations, a critical research question remains unexplored: does the ZWCP policy effectively generate synergistic improvement in PRCM? The current literature offers limited insights, with the most relevant study by Liu et al. (2024), which evaluated the ZWCP’s influence on urban total factor carbon emission efficiency (TFCEE) without a comprehensive PRCM assessment [17]. To answer this question, this paper employed panel data encompassing 158 cities in China from 2011 to 2021 to systematically investigate the mechanism of the ZWCP policy in achieving PRCM, with a focus on green technology innovation and environmental regulatory intensity. This study further examined the heterogeneity of the ZWCP policy from the perspectives of urban location, resource endowment, and urban scale, while exploring its exit effect and spatial spillover effect. The findings contribute significantly to enriching the ZWCP policy framework construction while offering empirically grounded insights to policymakers. Moreover, this study provides actionable experience and a reference for global urban sustainability transitions, advancing progress toward global sustainable development goals (SDG), particularly SDG 11 (Sustainable Cities) and SDG 13 (Climate Action).
Compared to previous studies, this study makes several novel contributions. First, by focusing on the PRCM effects of the ZWCP policy, this study provided direct empirical evidence linking ZWCP implementation to measurable environmental improvements, advancing the discourse on zero-waste urban governance. Second, this study uncovered the dual transmission mechanism of green technological innovation and environmental regulation in achieving the PRCM effects of the ZWCP policy, thus providing a fresh perspective for optimizing ZWCP policy and enhancing the depth of the research. Third, this study provided empirical evidence for tailored ZWCP policies by discussing the heterogeneity of the policy’s effects. Fourth, this paper evaluated the enterprise exit effect and spatial spillover effect, providing empirical support for enhancing regional collaboration in ecological policy.
The rest of this research is structured as follows. Section 2 presents a comprehensive literature review. Section 3 conducts the theoretical analysis and proposes the research hypotheses. Section 4 explains the research design. Section 5 presents the estimation results, robustness tests, and mechanism examinations. Section 6 makes an in-depth analysis from three aspects: heterogeneity, enterprise exit effect and spatial spillover effect. Section 7 summarizes the findings and provides recommendations.

2. Literature Review

2.1. Study on PRCM

Pollution reduction and carbon mitigation (PRCM) constitute a critical pathway toward sustainable development. Current research on PRCM centers on three key dimensions: implementation pathways, influencing factors, and policy effectiveness evaluations.
First, two dominant strategies emerge in the pursuit of PRCM: technological emission reduction and structural emission reduction [18]. Regarding technological emission reduction, scholars emphasize the need for accelerated research, development, and deployment of environmentally friendly technologies. Optimizing production processes and implementing effective pollutant management systems can simultaneously advance pollution reduction and carbon mitigation [19]. In the domain of structural emission reduction, scholars suggest that restructuring regional industrial composition and improving energy efficiency across industrial sectors are conducive to achieving PRCM [20].
Second, the primary drivers influencing PRCM can be categorized into direct and indirect factors. The energy consumption pattern is the direct factor influencing PRCM, with fossil fuel-dependent economic models exacerbating pollutant and CO2 emissions [21]. Indirect factors encompass technological innovation, environmental regulations [22], financial policies, and related elements. Bekun (2024) suggested that environmental technological innovation positively influences environmental quality in South Africa [23]. Zhao et al. (2024) found that market incentives and public participation in regulation can reduce environmental pollution [24]. Chen et al. (2024) conducted research showing that green financial policies positively influence emission reduction and environmental quality [25].
Third, scholars assessed the impacts of location-oriented ecological policies, including a carbon emission trading pilot policy [26], a low-carbon city pilot (LCCP) policy [27,28], an ecological civilization pilot zone [13], and a circular economy policy [29], and so on. The consensus indicates that these pilot policies can further optimize resource allocation efficiency, stimulate technological innovation, and accelerate the adoption of clean energy [30]. Therefore, they play a vital role in realizing the ecological objectives of PRCM.
It is noteworthy that while extensive research examined the impact of diverse policies on PRCM, the ZWCP policy has received limited scholarly attention. To bridge this gap, this study conducted an in-depth analysis of the ZWCP policy’s effects and transmission mechanisms on PRCM, thereby enriching the literature on ecologically oriented policy evaluation.

2.2. Study on ZWC

A zero-waste city (ZWC) is a green and circular sustainable development model. The theoretical concept of “zero-waste” was first proposed in 1973 and gained global scholarly attention in the late 1990s [31,32]. The definition of “zero-waste” originating from the Zero Waste International Alliance—now widely accepted—encompasses responsible production, consumption, and recycling practices to ensure that all waste materials are repurposed without resorting to incineration, landfilling, open dumps or marine disposal [33]. The ZWCP policy adopted in China integrates the zero-waste concept into urban development practices [34]. In the quest for a ZWC, scholars concur on four key strategies: First, the transition to sustainable production necessitates corporate-level adoption of green technological innovations and circular economy practices [34], and complementary government policies combining economic incentives with regulatory measures [35]. Second, waste management should undergo digital transformation to establish an efficient waste lifecycle management system [36] while fostering a circular resource industry [37]. Third, financial incentives, reduced disposal costs [38], open resource recovery facilities [39], and waste reuse initiatives [40] are critical for maximizing resource efficiency. Fourth, promoting simple, moderate, green, and low-carbon lifestyles helps cultivate an ecologically conscious society, alleviates resource pressures, and advances a resource-efficient economy [41].
Existing studies have established a theoretical consensus on ZWC frameworks, yet systematic assessment of zero-waste policies remains limited. In a related study, Liu et al. (2024) explored the impact of the ZWCP policy on TFCEE [17] and Zhou (2024) examined the impact of the ZWCP policy on the quality of urban development [42]. However, these approaches lack a focused examination of the direct ecological effects of the ZWCP policy. Addressing this gap, this study makes four contributions to the literature: First, this paper comprehensively examined the dual environmental effects of the ZWCP policy from the perspective of PRCM, exploring its realization mechanisms via green technological innovation and environmental regulation intensity. This enriches the existing research in the assessment of ZWCP policy. Second, unlike previous studies—which primarily focused on urban location and size—this study further analyzed the heterogeneity of the ZWCP policy with varying resource endowment characteristics. The findings indicate stronger PRCM effects in non-resource-based cities, offering policymakers valuable insights when tailoring ecological policies. Third, existing studies often overlooked the potential exit effects of ecological policies on enterprises, which could negatively impact regional economic development. Contrary to concerns that ecological policies may induce firm exits and hinder regional economics; this paper found no evidence of such adverse effects under the ZWCP policy. This result underscores the dual benefits of the ZWCP policy for the economy and the environment. Finally, while existing studies relied on geographic and economic distance matrices, this study further introduced geographic adjacency matrices and economic geographic nested matrices for more robust spillover effect assessments. The absence of any detected spatial spillover effects indicates that the current ZWCP policy remains in a developmental phase, yet to generate cross-regional demonstration effects.

3. Research Hypothesis

3.1. The Basic Assumptions

Environmental regulation theory posits that the government can effectively facilitate green development through policy guidance and constraint mechanisms [22]. The ZWCP, as a pilot ecological protection policy introduced by the government, is designed to reduce solid waste and carbon emissions via a combination of policy incentives and regulatory mechanisms. This policy operates through four key mechanisms: First, a core objective of the ZWCP is reducing solid waste generation at the source [42]. By incentivizing enterprises to invest in research and development (R&D) and technological innovations, the policy encourages optimized product design and improving process flow, thereby lowering pollutants and carbon emissions [43]. Second, solid waste resource recovery is also a vital direction for the ZWCP policy [44]. Through standardized waste classification, collection, transportation, and treatment, the policy can increase resource recovery rates [45]. Moreover, by employing a circular economy development model, it will reduce raw material extraction and associated emissions [46], thus reducing overall pollutant and carbon emissions. Third, solid waste sanitization is another important aspect of the ZWCP policy. The ZWCP policy can establish a comprehensive solid waste harmless management system to minimize energy consumption and emissions during the waste treatment [47]. Additionally, it promotes resource recovery from solid waste [48]. Fourth, the ZWCP policy can strengthen governmental commitment to ecological and environmental conservation, while raising public environmental awareness. Drawing on attention theory, increased government focus on sustainability leads to greater financial investment in green initiatives. Similarly, heightened public awareness of environmental protection fosters sustainable lifestyles and consumption patterns [49], including waste sorting, energy conservation, and emission reduction activities—further contributing to PRCM. To sum up, this study introduces the following hypothesis:
H1. 
The ZWCP policy can achieve dual environmental benefits of PRCM.

3.2. Influence Mechanism Analysis

3.2.1. Green Technological Innovation Mechanism

Sustainable development theory emphasizes that the application of green technologies can enhance production efficiency, optimize fossil energy efficiency, and reduce pollution and CO2 emissions [50]. The ZWCP policy catalyzes this process by incentivizing enterprises to advance green technological innovation and strengthen solid waste management through dual channels of government and market forces. From the government’s perspective, local authorities implement economic instruments including tax exemptions, financial subsidies for solid waste management subsidies, and dedicated innovation funds [51,52]. These measures directly stimulate investment in green technological R&D by enterprises and research institutions. From a market perspective, the ZWCP policy can foster the growth of the environmental protection and renewable resource sectors [52], attracting capital and skilled professionals to drive innovation in clean technologies [53], energy efficiency [17], and waste management [53]. For example, among the pilot cities, Baotou’s implementation plan accelerates breakthrough industrial solid waste projects, technologies, and products. In the financial market, financial institutions place greater emphasis on green technology investment projects related to solid waste management [54]. Rui Feng Bank in Shaoxing introduced the “Rui Feng Bank Green Credit Promotion Management Measures” to enhance the green credit allocation for waste treatment. By integrating government support with market-driven innovation, the ZWCP policy effectively strengthens local green technological capabilities, thereby achieving the dual environmental benefits of PRCM. Given this, this study introduces the following hypothesis:
H2. 
The ZWCP policy can achieve the dual environmental benefits of PRCM through improved green technological innovation.

3.2.2. Environmental Regulation Mechanism

The ZWCP policy serves as a powerful environmental regulation that actively drives green economic transformation [54]. This aligns with the Porter Hypothesis, which posits that well-designed environmental regulations can simultaneously improve environmental quality and enhance enterprise competitiveness [55,56,57]. First, the ZWCP empowers pilot cities to develop specialized environmental standards that raise industrial benchmarks. For example, Chongqing introduced the “Chongqing Municipal Standards for the Quality of Pre-treatment Products from Hazardous Waste Co-processing in Cement Kilns”, which establishes clear technical requirements that drive cleaner production practices while maintaining operational efficiency. Second, the ZWCP policy encourages market-driven mechanisms to enhance the economic viability of waste management through fiscal incentives, ecological compensation, and waste trading platforms. This approach reinforces a market-oriented regulatory framework for environmental governance. Shenzhen enacted the “Shenzhen Municipal Enterprise Environmental Credit Evaluation Management Measures”, a policy that provides tax incentives to enterprises based on their environmental credit scores. Third, the pilot policy advances the zero-waste concept by raising public awareness of ecological conservation and waste recycling. Numerous pilot cities have spearheaded nationwide residential waste segregation initiatives, actively establishing “zero-waste communities”, “zero-waste campuses”, and “zero-waste scenic areas” [58,59]. These efforts substantially elevate public ecological consciousness and facilitate the recycling and circular utilization of solid waste. Given this, this study introduces the following hypothesis:
H3. 
The ZWCP policy can achieve the dual environmental benefits of PRCM by strengthening environmental regulation.

4. Research Design

4.1. Data and Sample Selection

Considering the completeness of the indicators, this study defined the research period from 2011 to 2021. The treatment group comprises 16 cities and regions designated as ZWCP zones in 2019, while all non-pilot cities are the control group. The dependent variables in this analysis are general industrial solid waste and CO2. However, significant absence was identified in city-level panel data for these indicators. To address this, we established the following data screening criteria: (1) Cities missing data for both key indicators for three or more consecutive years were excluded from the sample; (2) For cities with isolated missing data in a specific year, linear interpolation was applied to impute values. Following this processing, the final sample consisted of 158 cities, 14 pilot cities in the treatment group (Baoding, Baotou, Beijing, Nanping, Tianjin, Weihai, Xuzhou, Shenzhen, Panjin, Shaoxing, Xining, Ganzhou, Chongqing, and Tongling) and 144 non-pilot cities in the control group. The data sources are the China City Statistical Yearbook, China provincial statistical yearbooks, the EPS database, and the China Emission Accounts and Datasets (CEADs). All economic data were adjusted for inflation using the Consumer Price Index (CPI) with 2011 as the base year. Missing data points were estimated through linear interpolation.

4.2. Model Construction

As a regional pilot initiative, the ZWCP policy can be likened to a quasi-natural experiment. Therefore, this study used the DID method to examine the PRCM effects of the ZWCP policy. Following the framework established by Zhao et al. (2023), two DID models were set [60]:
l n w a s t e i t = α + β 1 z w c i t + δ X i t + μ i + τ t + ε i t
l n C O 2 i t = α + β 2 z w c i t + δ X i t + μ i + τ t + ε i t
where the subscripts i and t in the two equations denote the city and year; lnwasteit and lnCO2it are dependent variables; zwcit is the core explanatory variable, indicating whether city i adopted the ZWCP policy in year t; Xit represents the set of control variables that influence pollution emissions and CO2 emissions; the city fixed effect and year fixed effect are expressed by μi and τt, respectively; εit is the random error term of the models; α, β1, β2 and δ are estimated parameters; α is the intercept term of the equation; and β1 and β2 reflect the effect of pollution reduction and carbon reduction of the ZWCP policy, respectively. If β1 < 0, this suggests that the ZWCP policy can effectively reduce pollution emissions. If β2 < 0, this implies that the ZWCP policy can effectively decrease CO2 emissions. δ denotes the estimated coefficient vector for each control variable, quantifying how other observed factors influence the pollution emissions and CO2 emissions.
To ensure the validity of the DID estimates, we constructed a systematic test process. First, we verified the parallel trends assumption by examining whether the treatment and control groups followed similar pre-treatment trajectories in the outcome variables—a critical requirement for causal inference in DID models. Second, a placebo test was carried out to eliminate the interference of random factors on the estimation results. Finally, robustness tests were carried out from multiple perspectives, including policy contamination control (controlling for similar environmental policies interference), administrative hierarchy adjustment (excluding cities with high administrative levels, e.g., municipalities/provincial capitals), and control group refinement (refining the selection of control groups) to verify the robustness of the results.

4.3. Variable Definitions

Dependent variable. Solid waste reduction and carbon mitigation are two kinds of environmental benefits examined in this paper. Therefore, this research used city-level general industrial solid waste emissions (lnwaste) and CO2 emissions (lnCO2) as two dependent variables. To mitigate potential heteroscedasticity, both variables underwent log-transformation in this analysis.
Core explanatory variable. The ZWCP policy (zwc) is a dummy variable. If city i participates in ZWCP in year t, it takes the value of 1 in that year and subsequent ones and 0 otherwise.
Control variables. Economic development level (lnpgdp) is indicated by the natural logarithm of per capita GDP. According to the Environmental Kuznets hypothesis [61], pollution initially rises with economic growth but declines beyond a certain income threshold. Industrial structure (struc) is defined by the proportion of the secondary industry in GDP. Sun et al. (2022) showed that a high proportion of industrial output value is a factor exacerbating pollution emissions in China [62]. Government intervention intensity (lngov) is quantified by the logarithm of the fiscal expenditure intensity. The existing literature presents divergent perspectives on the environmental impact of government fiscal expenditure. Some scholars argue that excessive government intervention through fiscal spending may distort resource allocation efficiency, potentially exacerbating environmental degradation [63]. Conversely, other researchers contend that properly designed fiscal expenditures can generate pollution reduction co-benefits by enhancing human capital development and facilitating emissions-reduction technological innovation [64]. Foreign direct investment (lnfdi) is measured by the logarithm of foreign direct investment (FDI) to GDP. The environmental impact of FDI manifests through two competing theoretical lenses: the “pollution haven effect” indicates that FDI facilitates the agglomeration of pollution-intensive industries in host countries, thereby intensifying local environmental degradation [65], while the “pollution halo effect” suggests that FDI can generate positive environmental externalities through the transfer of advanced production technologies, implementation of superior management practices, and systemic improvements in energy efficiency [66]. Financial development level (lnfin) is quantified by the logarithm of the ratio between the annual loan volume of financial institutions and GDP. Robust financial systems enable firms to adopt cleaner technologies, supporting pollution reduction [67].

5. Results and Discussion

5.1. Discussion of the Benchmark Regression Results

Table 1 presents the benchmark regression results. The results show that the estimated coefficient of zwc remains statistically significant (p < 0.1) and negative, irrespective of the inclusion of control variables. This robust finding indicates that the ZWCP policy generates dual environmental benefits by significantly reducing solid waste generation and CO2 emissions, thereby supporting H1. As previously discussed, the implementation of the ZWCP policy furnished participating cities with substantial policy support, effectively improving waste management efficiency. By facilitating waste reduction, resource recovery, and harmless treatment, this pilot policy significantly mitigates pollution and CO2 emissions. Consequently, it plays a significant role in enhancing the urban ecological environment.

5.2. Robustness Tests

5.2.1. Parallel Trends Test

The parallel trend hypothesis is a prerequisite for using a DID model to assess a policy effect. This assumption ensures that the dependent variables of the treatment and control groups exhibit similar trends before policy implementation. Following established methodologies in the literature [68], this study adopted an event study approach to examine the parallel trends of the dependent variables across the two groups. The test models are set as follows:
l n w a s t e i t = α + k = 5 2 γ k z w c i t k + δ X i t + μ i + τ t + ε i t
l n C O 2 i t = α + k = 5 2 γ k z w c i t k + δ X i t + μ i + τ t + ε i t
where z w c i t k represents a collection of dummy variables associated with the timing of policy implementation. In the treatment group, if city i is in the kth year before or after the ZWCP policy implementation, z w c i t k takes a value of 1, and 0 otherwise. In particular, z w c i t 5 is a dummy variable representing the treatment group during the initial five years and subsequent periods following ZWCP designation. The parallel trends assumption is satisfied if γk is statistically insignificant, indicating that pilot and non-pilot cities followed similar changing tendencies in the dependent variables prior to policy implementation. After the ZWCP policy implementation, γk shows the dynamic features of the ZWCP policy effects.
The estimated results of γk along with their 95% confidence intervals are shown in Figure 1. The results indicate that before the ZWCP policy implementation, the γk coefficients are statistically insignificant, satisfying the parallel trends assumption required for our difference-in-differences analysis. The γk in Equation (3) is significantly negative one year after the ZWCP policy implementation and in Equation (4) two years after the ZWCP policy implementation. One potential reason could be that, during the initial phase, the ZWC construction is still in an exploratory phase, leading to less apparent policy effects. As the zero-waste policy framework in the treatment group continued to improve, the capacity for solid waste management increased, resulting in observable pollution reduction effects. However, carbon reduction often requires both technological upgrades and operational refinements that take longer to implement effectively, resulting in the carbon reduction effects of the ZWCP policy lagging behind the pollution reduction effects.

5.2.2. Placebo Test

To validate whether the dual environmental effects of the ZWCP policy are affected by random factors, this research constructed a placebo test with randomized treatment assignment. A pseudo-group for the ZWCP was randomly selected from 158 cities, equal to the size of the authentic treatment group. Pseudo-policy dummy variables were then created to perform 500 regressions, each with a different random assignment of the pseudo-treatment group. The kernel density distribution of the pseudo-estimation coefficients is presented in Figure 2. The vertical dotted line in the graph represents the average of the pseudo-estimated coefficients across 500 regressions. The pseudo-estimation coefficients are tightly clustered around zero, with mean values of 0.0012 (pollution reduction) and 0.0053 (carbon mitigation), respectively. These findings robustly demonstrate that the observed dual environmental benefits of the ZWCP are not driven by random variation but instead reflect a causal and stable policy impact on PRCM.

5.2.3. Other Robustness Tests

This study conducted the following robustness tests to reinforce the validity of its conclusions. (1) Controlling for policy interference. The LCCP policy implemented in 2010 and the waste classification pilot (WCP) policy implemented in 2017 exhibit similarities with the ZWCP policy. Given the potential impact on solid waste emissions and carbon emissions, this study incorporated these two policy variables into the benchmark regression models to mitigate their influence on the estimation results. (2) Exclusion of high administrative-level cities. To address potential biases arising from resource allocation disparities linked to varying urban administrative hierarchies, this study omitted samples from municipalities with elevated administrative status. (3) Adjustment of the control group. Considering that economic homogeneity among cities within the same province, the control group was restricted to cities located within the provinces of the treatment group. (4) PSM-DID. Given that the ZWCP policy was not implemented as a randomized controlled experiment, the baseline regression estimates may be susceptible to selection bias. Therefore, the PSM-DID method was employed to re-estimate the benchmark model. The process of the PSM is as follows: First, the sample was randomly sorted using the control variables as covariates. Second, logit regression based on Equation (5) was estimated to obtain the propensity score of each observational city. Third, based on the propensity score, the treatment group was matched with the control group in a 1:1 ratio.
z w c i t = α + δ X i t + μ i + τ t + ε i t
The variables in Equation (5) are the same as those mentioned above. Based on the robustness test methods mentioned above, the benchmark models were re-estimated in this study. As presented in Table 2, the estimated coefficients of zwc were significantly negative in all models (p < 0.1). This indicates that the construction of ZWC effectively promotes PRCM, robustly confirming the validity of the benchmark regression findings.

5.3. Endogeneity Test

Dealing with the endogeneity bias arising from bidirectional causality, this study used a two-stage least squares (2SLS) approach. Following the methodology of Hong et al. (2022), this study utilized a dummy variable as an instrumental variable (iv) indicating whether a city implemented environmental legislation between 1963 and 1985 [69]. The choice of this iv is justified for two reasons. First, cities with a history of implementing environmental legislation tend to possess more established solid waste management systems, increasing their probability of being selected as a ZWC. This satisfies the relevance condition for iv. Second, the sample period (2011–2021) is separated by over two decades from the environmental legislation period (1963–1985). This historical fact can seldom directly influence current urban pollution emissions, fulfilling the exogeneity condition of the instrumental variable.
The regression results of 2SLS are shown in Table 3. In the first-stage regression, the coefficient of iv (p < 0.01) shows a statistically significant positive association with zwc, confirming their relevance condition. The second-stage regression results show that the coefficient of zwc remains significantly negative (p < 0.05), which aligns consistently with the benchmark model estimates after correcting for potential endogeneity bias.

5.4. Mechanism Test Results

Based on the influence mechanism analysis of the ZWCP policy for achieving the PRCM effects, this paper carried out an empirical test following the methodological approach proposed by Yin and Shi (2019) [70]. The testing models are as follows:
M i t = θ 0 + θ 1 z w c i t + θ 2 X i t + μ i + τ t + ε i t
l n w a s t e i t = α + λ 1 z w c i t + η 1 M i t + δ X i t + μ i + τ t + ε i t
l n C O 2 i t = α + λ 2 z w c i t + η 2 M i t + δ X i t + μ i + τ t + ε i t
where Mit represents the two mechanism variables: green technological innovation (gpa) and environmental regulation (env). gpa is quantified by per capita green invention patents, while env is measured by the frequency of environmental terms appearing in government work reports. The other variables are consistent with the previous sections. Equation (6) assesses the effect of ZWCP implementation on the mechanism variables. Equations (7) and (8) add the mechanism variable as the control variable based on Equations (1) and (2). If θ1, η1, and η2 are significant, this implies that the mechanism effects are valid. On this premise, if λ1 and λ2 are also significant and have the same sign as β1 and β2, this indicates the presence of a partial mechanism effect. The contribution rate of the mechanism effect can be depicted as θ1 × η1/β1 and θ1 × η2/β2, respectively.
Table 4 shows the mechanism test results. Columns (1)–(3) present the results of the green technological innovation mechanism. The analysis reveals that θ1 in column (1) is significantly positive, while η1 and η2 in columns (2) and (3) are both significantly negative. Based on the estimated coefficients from the benchmark regression, we can infer that the ZWCP policy achieved a 9.22% reduction in pollution and 12.68% reduction in carbon emissions by promoting green technological innovation. Columns (4)–(6) present the results of the environmental regulation mechanism. The results show that θ1 in column (4) is significantly positive, while both η1 and η2 in columns (5) and (6) exhibit significant negative values. This indicates that the ZWCP policy can promote PRCM by enhancing the environmental regulation intensity in pilot cities. Based on the baseline regression estimates, the ZWCP policy achieved a 16.29% reduction in pollution and 22.34% reduction in carbon emissions by enhancing environmental regulation intensity. To sum up, H2 and H3 are verified.

6. Further Analysis

6.1. Heterogeneity Analysis

6.1.1. Geographical Location Heterogeneity

Regional differences influence urban development [71,72]. Therefore, the effectiveness of the ZWCP policy may vary depending on the geographical location of the pilot cities. This study conducted regression analysis for each region based on the classification of locations by the National Bureau of Statistics (eastern, central, and western regions). Figure 3 reports the estimated results. And more detailed estimates are provided in Table A1. The ZWCP policy effectively reduced pollution in the eastern region, though its impact on CO2 emissions was not significant. The ZWCP policy exhibited significant dual environmental effects of PRCM in the central region. The ZWCP policy implemented in the western region yielded no significant influence on solid waste and CO2 emissions. This regional variation may be attributed to developmental disparities. The economic structure of the western region, characterized by heavy reliance on resource-intensive industries and a development paradigm prioritizing economic expansion over environmental protection [73,74], constrains the policy’s effectiveness. Therefore, even with the implementation of the ZWCP policy, the region exhibits limited capacity for PRCM.

6.1.2. Resource Endowment Heterogeneity

The development path of a city is often shaped by its resource endowment type [75]. Cities that rely on mineral resource development as a core industry typically face worse environmental pollution challenges [76]. This raises a critical question regarding the ZWCP policy’s capacity to alleviate environmental pressures in resource-based cities (RBCs), warranting further analysis. Based on the classification framework established in “National Sustainable Development Plan for Resource-Based Cities (2013–2020)”, this paper distinguished and compared RBCs and non-resource-based cities (NRBCs). The regression results presented in Figure 3 reveal distinct policy impacts across city types. And more detailed estimates are provided in Table A2. It shows that the ZWCP policy demonstrated significant dual environmental effects of PRCM in NRBCs. However, in RBCs, the ZWCP policy yielded effects on pollution reduction, while the carbon mitigation effect remained statistically insignificant. This differential effectiveness can be attributed to several factors. First, waste reduction is the primary task of ZWCP, hence the ZWCP has a pollution reduction effect on all city types. Second, carbon emissions stem from heavy industry and coal-dominated energy consumption [77], which constrains the decarbonization effect of the ZWCP policy in the early stages [78]. NRBCs benefit from more diversified, service-oriented economies with greater flexibility in adopting low-carbon technologies [79].

6.1.3. Urban Size Heterogeneity

Given the potential impact of urban size on the effectiveness of ZWCP implementation, this study categorized sample cities into two groups: large cities (LCs, populations equal to or greater than the median) and small cities (SCs, populations less than the median) based on the average population size. The regression results (Figure 3 and Table A3) reveal a striking divergence in policy effectiveness: the ZWCP policy had significant PRCM effects in LCs, while it only had a pollution reduction effect in SCs. Economic and resource capacity disparities may be one of the explanations for this finding. In SCs, fiscal pressures prioritize local economic development over CO2 management [80]. In contrast, LCs possess greater fiscal resources and specialized environmental agencies [81], enabling simultaneous investment in pollutants reduction and CO2 emissions mitigation [82].

6.2. Whether ZWCP Exhibits Enterprise Exit Effect

Industrial enterprises are drivers of regional economic growth yet primary contributors to pollution and carbon emissions. Some scholars contend that the improvement of China’s ecological environment quality is achieved through mandatory production suspensions [83]. Thus, this study investigated whether ZWCP policies achieve their goals through enterprise exits—specifically, whether pilot cities rely on industrial shutdowns rather than sustainable waste management transitions. The following model to test the enterprise exit effect was employed:
l n c o m _ n u m i t = α + β 3 z w c i t + δ X i t + μ i + τ t + ε i t
where lncom_num is the natural logarithm of the number of industrial enterprises. The other variables are consistent with the previous sections. As shown in Table 5, the coefficient of zwc is negative and statistically insignificant (p > 0.1). This finding indicates that first, there is no significant enterprise exit effect. The ZWCP does not achieve its zero-waste objectives through mandatory production suspensions or large-scale industrial shutdowns. Second, the ZWCP policy achieves dual economic–environmental benefits.

6.3. Whether ZWCP Exhibits Spatial Spillover Effect

To further investigate the potential spillover effects of the ZWCP policy on neighboring cities, this paper used spatial DID models for analysis.
l n w a s t e i t = α + ρ W l n w a s t e i t + β 1 z w c i t + φ 1 W z w c i t + δ X i t + ψ 1 W X i t + μ i + τ t + ε i t
l n C O 2 i t = α + ρ W l n C O 2 i t + β 2 z w c i t + φ 2 W z w c i t + δ X i t + ψ 2 W X i t + μ i + τ t + ε i t
where ρ indicates the spatial spillover characteristic of the dependent variable and φ1 and φ2 represent the spatial spillover effect of zwc. If their values are significantly negative, this implies that the PRCM effects of the ZWCP policy have spatial spillover. W is a spatial weight matrix. Four types of spatial weight matrices were used in this paper, including the geographic adjacency matrix (W1), geographic distance matrix (W2), economic distance matrix (W3), and economic geography nested matrix (W4). Their calculation formulas are expressed as:
W 1 = 1 ,   if   city   i   is   adjacent   to   city   j 0 ,   if   city   i   is   not   adjacent   to   city   j
W 2 = 1 d i j 2 , i j 0 , i = j
W 3 = 1 l i g h t i ¯ l i g h t j ¯ , i j 0 , i = j
W 4 = W 2 × d i a g l i g h t 1 ¯ l i g h t ¯ , l i g h t 2 ¯ l i g h t ¯ , , l i g h t n ¯ l i g h t ¯
Equation (12) is the calculation formula for W1. In matrix W1, a value of 1 is assigned if there exists a shared administrative boundary between cities; otherwise, a value of 0 is assigned. Equation (13) is the calculation formula for W2. In matrix W2, d i j 2 represents the square of the distance between the city i and city j. Equation (14) is the calculation formula for W3. To address the potential endogeneity problem associated with the spatial matrix, this paper used the urban nighttime light intensity (exogenous proxy) instead of GDP to construct economic weights [84]. The urban nighttime light intensity data come from the research results of Wu et al. (2021) [84]. l i g h t i ¯ ( l i g h t j ¯ ) is the average nighttime light intensity of city i (j) over the study period. Equation (15) is the calculation formula for W4. It is the product of W2 and a diagonal matrix [85]. The main diagonal elements of this diagonal matrix represent the ratios of the average light intensity of each city ( l i g h t n ¯ ) to the average light intensity across all cities ( l i g h t ¯ ) during the study period.
Table 6 presents the estimated results of spatial spillover effects. Columns (1) and (2) display regression outcomes based on the geographic adjacency matrix. Columns (3) and (4) present regression results based on the geographic distance matrix. Columns (5) and (6) provide regression results based on the economic distance matrix. Columns (7) and (8) show regression results using the economic geography nested matrix.
The parameter ρ is significantly positive across all models, confirming pronounced spatial spillover effects in both solid waste emissions and CO2 emissions. This implies that pollution and carbon reduction outcomes in one city are linked to those in neighboring areas. The significantly negative coefficient zwc under all four spatial weight matrices align with the benchmark model. The statistically insignificant interaction term W × zwc shows that the PRCM effects of the ZWCP policy has no spatial spillover. In other words, the PRCM effects of the ZWCP policy do not spill over to neighboring cities, whether measured by geographic adjacency, distance, or economic linkages. This further illustrates that the demonstration effect of the ZWCP policy remains geographically constrained, failing to systematically influence the technological innovation path and environmental supervision mode of neighboring cities. The limited spatial spillover of the ZWCP can be attributed to three constraints: First, the absence of formal interregional coordination mechanisms restricts the policy influence to the designated pilot cities, effectively curtailing broader geographical penetration [86]. Second, significant disparities in economic development, industrial structure adaptability, and technological innovation capabilities hinder the cross-regional transfer of pilot experiences [87]. Third, the lack of institutionalized platforms for experience-sharing and technology transfer between pilot and neighboring regions leads to inefficient information dissemination, thereby obstructing knowledge spillovers [88].

7. Conclusions and Suggestions

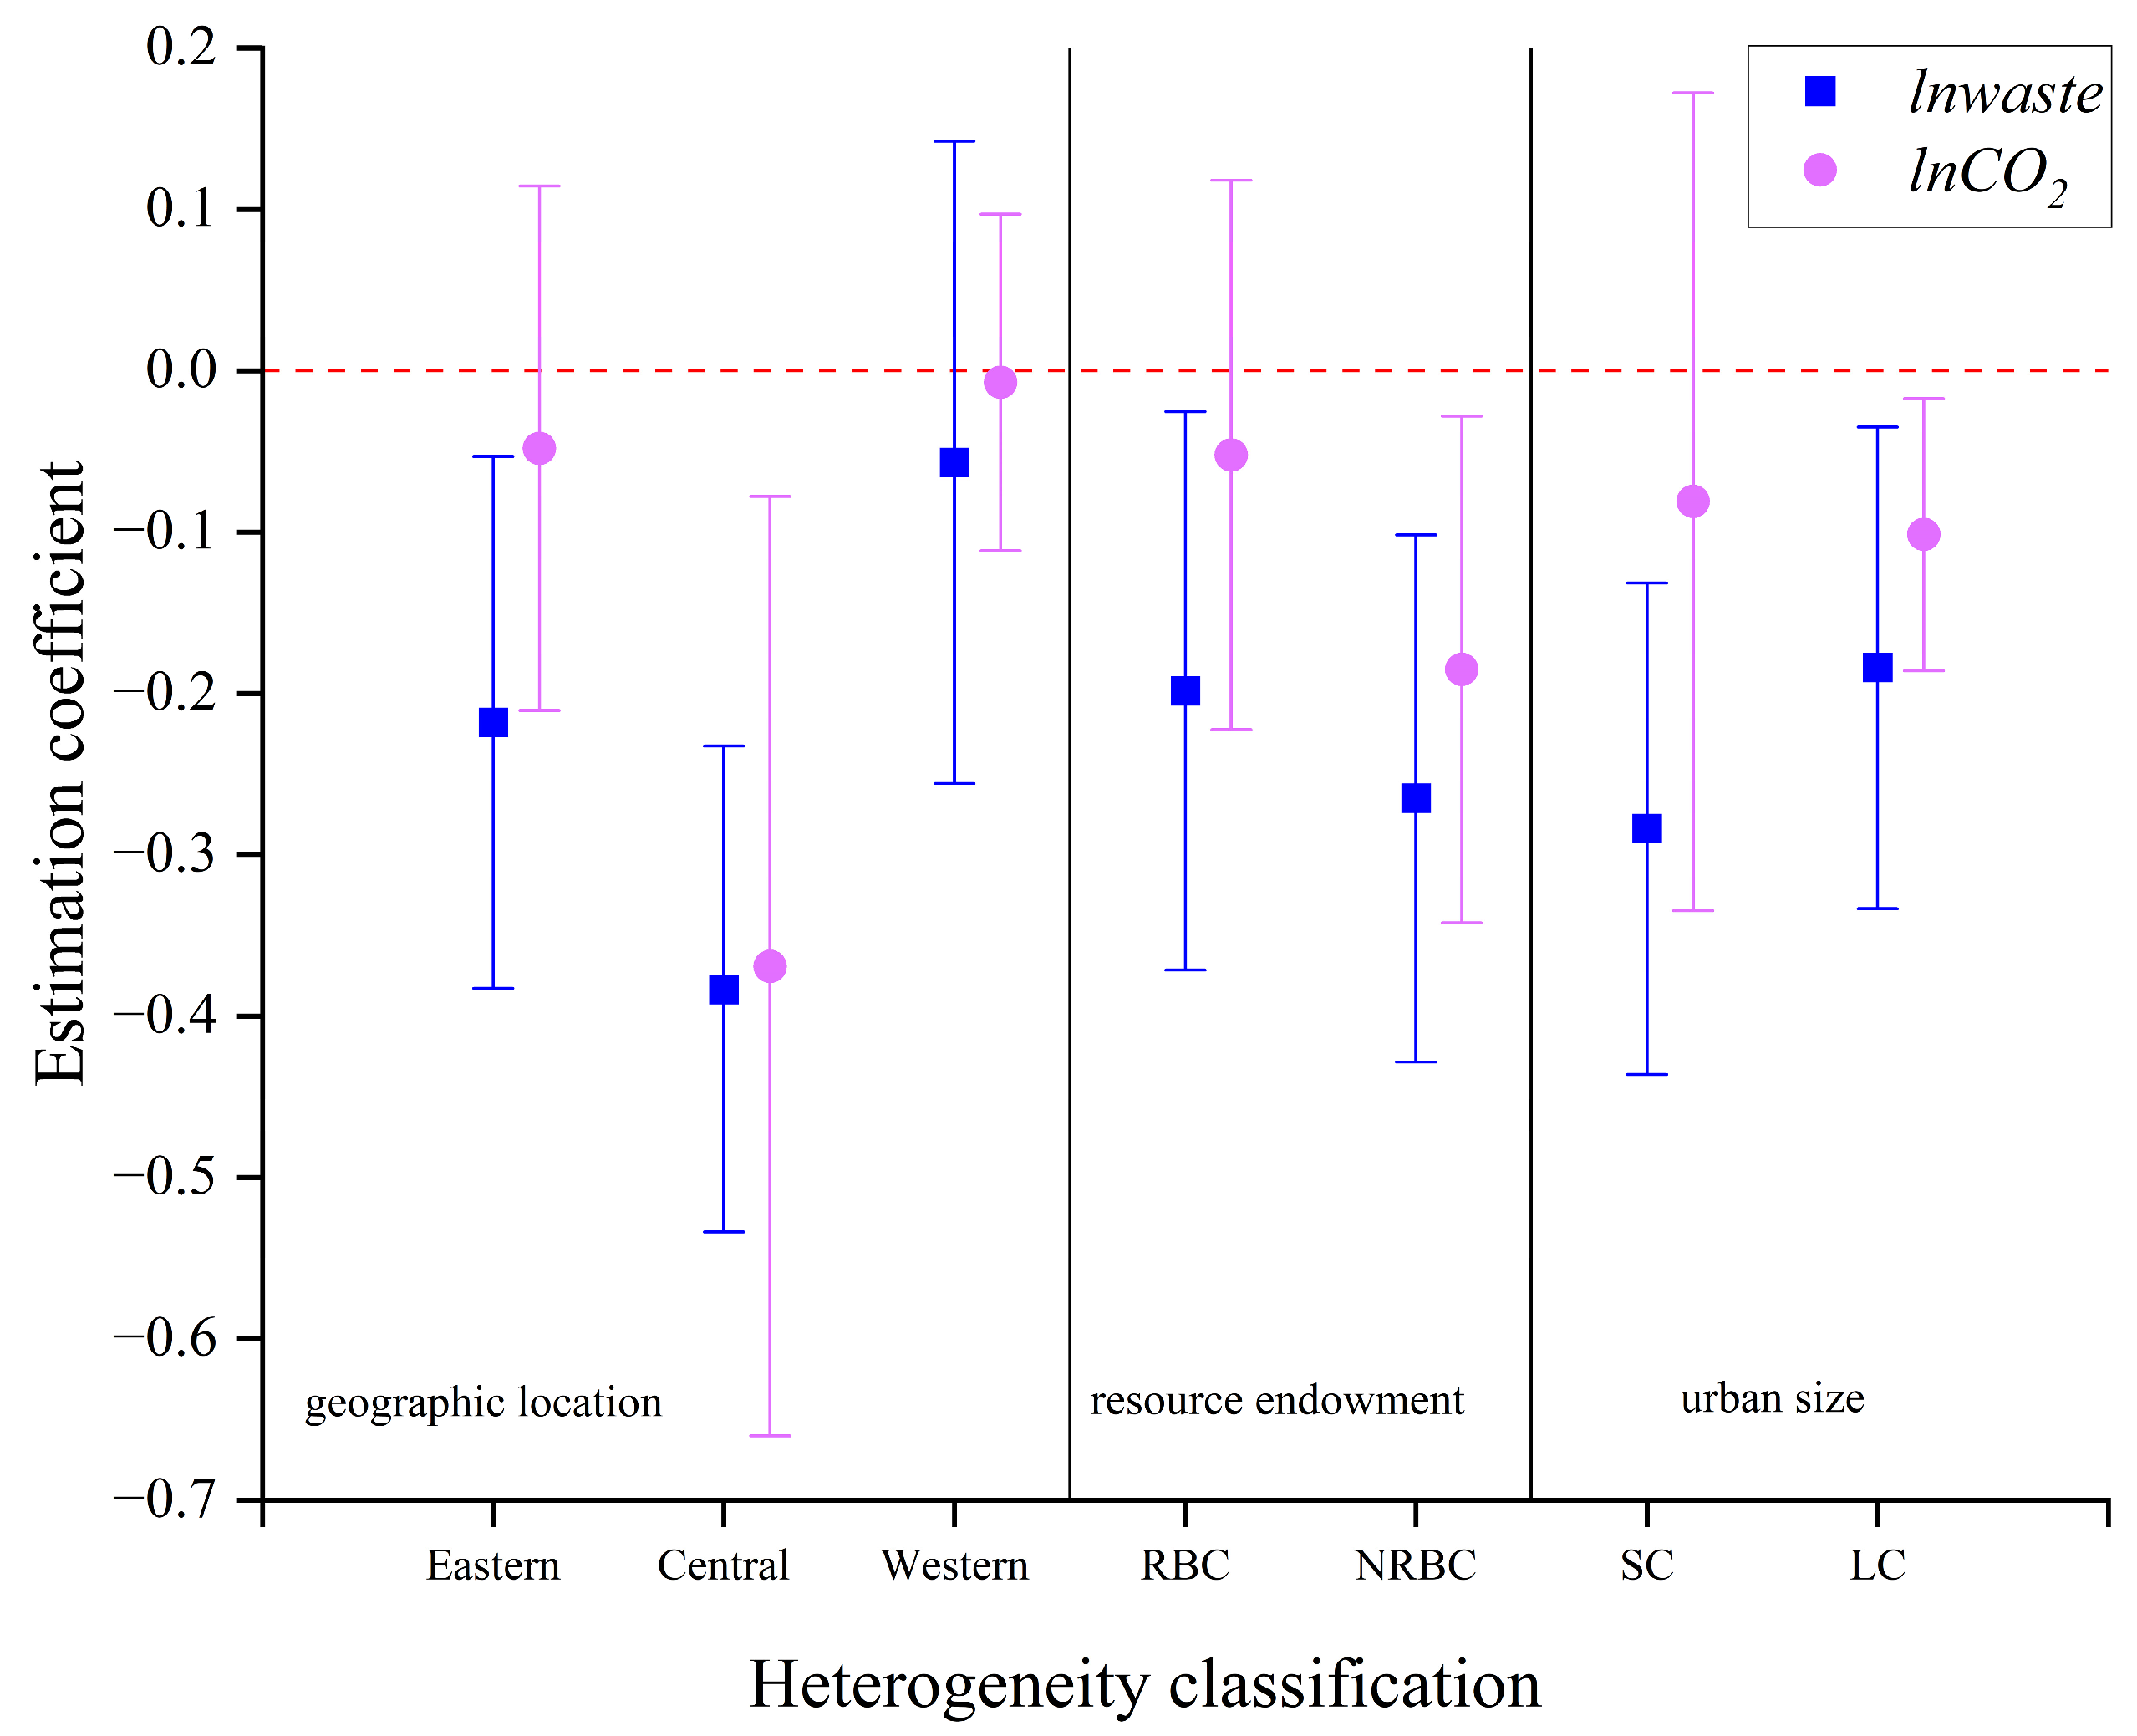
Taking the ZWCP policy as a quasi-experiment, this paper used a DID model to examine its PRCM effects. The main conclusions are as follows. First, the ZWCP policy demonstrated significant efficacy in reducing pollutants and CO2 emissions, confirming a dual environmental effect. Second, mechanism testing showed that the PRCM effects in the ZWCP policy are primarily driven by accelerated green technology innovation and strengthened environmental regulation. Third, there is urban heterogeneity in the PRCM effects of the ZWCP policy. Specifically, more pronounced PRCM effects were observed in central region cities, non-resource-based cities and large cities. Finally, the ZWCP policy showed no significant enterprise exit effects or spatial spillover effects. This indicates that the ZWCP policy maintains economic sustainability by avoiding disruptive market exits, yet the absence of spatial spillover potentially constrains its broader environmental impacts. Considering these research results, this paper puts forward the following suggestions.
(1)
Constructing a differentiated policy pilot promotion framework. Priority should be given to expanding ZWCP coverage in central region cities, non-resource-dependent cities, and large cities. The central region, serving as a critical nexus between eastern and western China, possesses both industrial absorption capacity and ecological buffering functions. Its substantial population density and economic scale enable the efficient deployment of waste classification and resource circulation infrastructure, maximizing economies of scale. Meanwhile, megacities (urban population ≥ 5 million) should be granted greater regulatory autonomy in environmental governance, permitting the adoption of stricter waste management standards than national baselines—exemplified by Shanghai’s “No sorting, No collection” policy under its municipal solid waste regulations. Concurrently, a dedicated technical assistance mechanism should be established for resource-dependent cities. For resource-oriented cities such as Daqing and Hulunbuir, a specialized circular economy technology transformation fund should be introduced to support critical technologies, including tailings recycling and industrial equipment remanufacturing, thereby fostering sustainable economic restructuring.
(2)
Innovating green technology incentive mechanisms and facilitating technology diffusion pathways. A centralized environmental technology sharing platform should be implemented between pilot cities and non- pilot cities, encouraging participating enterprises and regions to disclose green technology patents between pilot zones and neighboring areas. For instance, in 2022, Hangzhou pioneered a “Green Technology Market” aggregating 530 energy-saving and environmental protection technologies, which accelerated broader societal decarbonization. A dedicated “Dual Carbon Technology” subsidy fund should be established, implementing a tiered incentive structure. Tianjin’s “Notice on the Establishment of Zero-Waste Enterprises” provides a valuable template.
(3)
Establishing a dual-dimensional dynamic supervision framework integrating pollution and carbon emissions to enhance policy enforcement efficacy. At the technical level, a “Pollution-Carbon Emission Synergistic Monitoring Platform” should be developed, leveraging IoT-enabled sensor networks to capture real-time data on industrial solid waste generation, logistical pathways, and end-treatment facility operations. This will create a closed loop tracking system spanning source generation, transportation, and final disposal, ensuring comprehensive oversight. At the mechanism level, a tiered response mechanism should be implemented. Pilot cities failing to meet baseline performance thresholds will trigger a three-colored warning system (yellow, orange, red). The yellow-warning pilot cities need to submit a corrective action plan coupled with technical support interventions; the orange-warning pilot cities face temporary suspension of approvals for new waste treatment projects; and the red-warning pilot cities suspend their pilot qualification and conduct an investigation under comprehensive supervision.
(4)
Strengthening public environmental education to cultivate conservation awareness and ecological consciousness. An immersive environmental education system should be established through the dissemination of “Zero-Waste Lifestyle Guidelines” and the promotion of the whole life cycle environmental protection concept. Digital transformation serves as both a strategic priority for ecological civilization advancement during the 14th Five-Year Plan period and as a critical enabler for sustainable development education. A digitally-driven incentive framework should be implemented to raise awareness about the impact of a single person on pollution reduction and carbon mitigation. Another important measure is to establish a national environmental governance framework that institutionalizes public participation and oversight. To strengthen transparency and civic engagement, the government should mandate open-access policies for environmental protection facilities, ensuring the public’s right to access information, participate in decision-making, and exercise supervision. This approach aligns with international best practices in environmental democracy.
This study still has the following limitations. First, due to the availability of data, the study period of this research only spans from 2011 to 2021. Therefore, this study only included cities that qualified for the ZWCP in 2019 as the treatment group. The MEEC announced a second batch of pilot cities in 2022, but the lack of key city-level data (e.g., CO2, pollution metrics) hindered their inclusion in the empirical analysis. In the future, once more comprehensive city-level data become available, the second batch of pilot cities can be included as the treatment group, employing a progressive DID approach to further investigate the environmental effects of the ZWCP policy. Second, this study examined the impact of the ZWCP policy on solid waste and CO2 emissions at the city level, providing reliable macro-level evidence. However, it lacks empirical evidence at the micro level of individual enterprises. Future research could further explore the pollution reduction and carbon mitigation effects of the ZWCP from a micro-level enterprise perspective.

Author Contributions

Conceptualization, Z.C. and Y.S.; methodology, X.Z.; software, X.Z.; validation, X.Z.; formal analysis, X.Z. and X.C.; data curation, Y.S.; writing—original draft preparation, X.Z.; writing—review and editing, Z.C.; visualization, X.Z.; supervision, Z.C. and Y.S.; project administration, Z.C. and Y.S. All authors have read and agreed to the published version of the manuscript.

Funding

This work was funded by Chongqing Social Science Planning Doctoral Project (2022BS062); funded by the Basic Scientific Research Funds in the Collaborative Innovation Center in Chongqing Business Vocational College (2022XJZX03).

Institutional Review Board Statement

Not applicable.

Informed Consent Statement

Not applicable.

Data Availability Statement

Data will be made available on request.

Conflicts of Interest

The authors declare no conflicts of interest.

Heterogeneity Regression Analysis Results

This paper examined the heterogeneity of the ZWCP policy from three aspects: urban geographical location, urban resource endowment, and urban size. Specifically, Table A1 reports the estimated results for urban geographical location heterogeneity, Table A2 reports the estimated results for urban resource endowment heterogeneity, and Table A3 provides the estimated results for urban size heterogeneity. Figure 3 in the article is drawn from these three tables.
Table A1. Heterogeneity estimation based on urban geographic location.
VariableEasternCentralWestern
(1)(2)(3)(4)(5)(6)
lnwastelnCO2lnwastelnCO2lnwastelnCO2
zwc−0.218 ***−0.048−0.383 ***−0.369 **−0.057−0.007
(0.084)(0.083)(0.077)(0.148)(0.101)(0.053)
ControlsYesYesYesYesYesYes
Constant−4.676 ***−7.631 ***−6.052 ***−10.497 ***0.284−2.774 **
(1.198)(0.967)(1.486)(1.204)(1.673)(1.094)
N737737605605388388
R20.9370.8990.9380.9220.9520.971
Note: Standard errors in parentheses; *** p < 0.01, ** p < 0.05.
Table A2. Heterogeneity estimation based on urban resource endowment.
VariablesRBCNRBC
lnwastelnCO2lnwastelnCO2
(1)(2)(3)(4)
zwc−0.198 **−0.052−0.265 ***−0.185 **
(0.088)(0.087)(0.083)(0.080)
ControlsYesYesYesYes
Constant−0.604−4.185 ***−4.282 ***−9.029 ***
(1.247)(1.005)(0.928)(0.903)
N61361311171117
R20.9450.9570.9220.910
Note: Standard errors in parentheses; *** p < 0.01, ** p < 0.05.
Table A3. Heterogeneity estimation based on urban size.
VariablesSCLC
lnwastelnCO2lnwastelnCO2
(1)(2)(3)(4)
zwc−0.284 ***−0.081−0.184 **−0.102 *
(0.078)(0.135)(0.076)(0.060)
ControlsYesYesYesYes
Constant−2.830 **−5.985 ***−1.922 **−7.324 ***
(1.301)(1.136)(0.760)(0.756)
N858858880880
R20.9400.9320.9480.937
Note: Standard errors in parentheses; *** p < 0.01, ** p < 0.05, * p < 0.1.

References

  1. UNEP—Global Waste Management Outlook 2024—Beyond an Age of Waste: Turning Rubbish into a Resource. Available online: https://doi.org/10.59117/20.500.11822/44939 (accessed on 25 March 2025).
  2. Bensmain, L.; Yassaa, N.; Saber, M.; Merabet, H. Sustainable energy potential from landfill biogas in Algeria case study of three landfills. Biomass Bioenergy 2025, 197, 107765. [Google Scholar] [CrossRef]
  3. Kjeldsen, P.; Kissas, K.; Scheutz, C. Do compost-based landfill biocover systems designed for methane oxidation emit nitrous oxide in significant amounts? Waste Manag. 2024, 190, 506–510. [Google Scholar] [CrossRef]
  4. Kumar, A.; Sharma, M.P. Estimation of GHG emission and energy recovery potential from MSW landfill sites. Sustain. Energy Technol. Assess. 2014, 5, 50–61. [Google Scholar] [CrossRef]
  5. Seman, S.Z.A.; Idris, I.; Abdullah, A.; Shamsudin, I.K.; Othman, M.R. Optimizing purity and recovery of biogas methane enrichment process in a closed landfill. Renew. Energy 2019, 131, 1117–1127. [Google Scholar] [CrossRef]
  6. Delgado, M.; López, A.; Esteban-García, A.L.; Lobo, A. The importance of particularizing the model to estimate landfill GHG emissions. J. Environ. Manag. 2023, 325, 116600. [Google Scholar] [CrossRef] [PubMed]
  7. Folino, A.; Gentili, E.; Komilis, D.; Calabrò, P.S. Biogas recovery from a state-of-the-art Italian landfill. J. Environ. Manag. 2024, 367, 122040. [Google Scholar] [CrossRef]
  8. Giordano, C.R.; Van Brunt, M.E.; Halevi, S.J.; Castaldi, M.J.; Orlovits, Z.; Illes, Z. Landfill gas collection efficiency: Categorization of data from existing in-situ measurements. Waste Manag. 2024, 175, 83–91. [Google Scholar] [CrossRef] [PubMed]
  9. IPCC—AR5 Synthesis Report: Climate Change 2014. Available online: https://www.ipcc.ch/report/ar5/syr/ (accessed on 5 February 2025).
  10. Schmidt, S.; Laner, D. Reducing the climate impact of residual waste treatment: A German case study on carbon management strategies. Waste Manag. 2025, 198, 137–150. [Google Scholar] [CrossRef]
  11. Zhang, L.; Li, H.; Hu, T.; Du, X.; Zhou, Y.; Sun, G.; Liu, J. The reduction of the carbon footprint of municipal solid waste management via source classification and supporting strategies: An analysis for the megacity of Shenzhen. Waste Manag. 2024, 187, 145–155. [Google Scholar] [CrossRef]
  12. Climate Watch Data—China. Available online: https://www.climatewatchdata.org/countries/CHN?end_year=2021&start_year=1990&tnqh_x0026%3Bstart_year=1990 (accessed on 25 March 2025).
  13. Chai, Z.; Guo, F.; Cao, J.; Yang, X. The road to eco-efficiency: Can ecological civilization pilot zone be useful? New evidence from China. J. Environ. Plan. Manag. 2024, 67, 477–503. [Google Scholar] [CrossRef]
  14. Qi, S.; Chen, Y.; Wang, X.; Yang, Y.; Teng, J.; Wang, Y. Exploration and practice of “Zero-Waste City” in China. Circ. Econ. 2024, 3, 100079. [Google Scholar] [CrossRef]
  15. Li, Y.; Li, J. Method development and empirical research in examining the construction of China’s “Zero-Waste Cities”. Sci. Total Environ. 2024, 906, 167345. [Google Scholar] [CrossRef] [PubMed]
  16. Razzaq, A.; Sharif, A.; Najmi, A.; Tseng, M.L.; Lim, M.K. Dynamic and causality interrelationships from municipal solid waste recycling to economic growth, carbon emissions and energy efficiency using a novel bootstrapping autoregressive distributed lag. Resour. Conserv. Recycl. 2021, 166, 105372. [Google Scholar] [CrossRef]
  17. Liu, M.; Chen, L.; Sheng, X.; Xu, Y.; Yuan, X.; Wang, Q.; Ma, Q.; Zuo, J. Zero-waste city pilot and urban green and low-carbon transformation: Quasi-experimental evidence from China. Resour. Conserv. Recycl. 2024, 206, 107625. [Google Scholar] [CrossRef]
  18. Zhou, B.; Zhang, C.; Song, H.; Wang, Q. How does emission trading reduce China’s carbon intensity? An exploration using a decomposition and difference-in-differences approach. Sci. Total Environ. 2019, 676, 514–523. [Google Scholar] [CrossRef]
  19. Sun, H.; Deng, Y. The effect of “Reducing Pollution and Carbon Emissions” in environmental policy: A study based on the perspective of pollution fee collection. China Econ. Stud. 2022, 115–129. [Google Scholar] [CrossRef]
  20. Lyu, Y.; Chen, L.; Tian, J.; Liu, R.; Zhou, Q. Realizing synergy between pollution reduction and carbon mitigation in industrial parks: From model development to tool application. J. Clean. Prod. 2024, 446, 141197. [Google Scholar] [CrossRef]
  21. Rahman, A.; Murad, S.W.; Mohsin, A.K.M.; Wang, X. Does renewable energy proactively contribute to mitigating carbon emissions in major fossil fuels consuming countries? J. Clean. Prod. 2024, 452, 142113. [Google Scholar] [CrossRef]
  22. Wang, Z.; He, B.; Fujita, T. Does environmental regulation affect inward foreign direct investment? Evidence from China. Appl. Econ. Lett. 2024, 1–7. [Google Scholar] [CrossRef]
  23. Bekun, F.V. Race to carbon neutrality in South Africa: What role does environmental technological innovation play? Appl. Energy 2024, 354, 122212. [Google Scholar] [CrossRef]
  24. Zhao, J.; Zhang, C.; Wu, Y.; Zhu, J. Dual driving forces for corporate environmental responsibility performance: The synergistic effects of government environmental regulation and market multi-agent green supervision. Sci. Total Environ. 2024, 949, 174790. [Google Scholar] [CrossRef] [PubMed]
  25. Chen, X.; Mao, Y.; Cheng, J.; Wei, P.; Li, X. Green financial policy, technological advancement reversal, assessment of emission reduction effects. Energy Econ. 2024, 136, 107678. [Google Scholar] [CrossRef]
  26. Dewaelheyns, N.; Schoubben, F.; Struyfs, K.; Van Hulle, C. The influence of carbon risk on firm value: Evidence from the European Union emission trading scheme. J. Environ. Manag. 2023, 344, 118293. [Google Scholar] [CrossRef]
  27. Lee, C.C.; Feng, Y.; Peng, D. A green path towards sustainable development: The impact of low-carbon city pilot on energy transition. Energy Econ. 2022, 115, 106343. [Google Scholar] [CrossRef]
  28. Zhou, R.; Lou, J.; He, B. Greening corporate environmental, social, and governance performance: The impact of China’s carbon emissions trading pilot policy on listed companies. Sustainability 2025, 17, 963. [Google Scholar] [CrossRef]
  29. Kurniawan, T.A.; Othman, M.H.D.; Liang, X.; Goh, H.H.; Gikas, P.; Kusworo, T.D.; Anouzla, A.; Chew, K.W. Unlocking synergies between waste management and climate change mitigation to accelerate decarbonization through circular-economy digitalization in Indonesia. Sustain. Prod. Consum. 2024, 46, 522–542. [Google Scholar] [CrossRef]
  30. Wang, C.; Yi, S.; Zhang, L.; Zhao, X.; Chen, H. The policy effects and influence mechanism of China’s carbon emissions trading scheme. Air Quallity Atmos. Health 2021, 14, 2101–2114. [Google Scholar] [CrossRef]
  31. Zaman, A.U. A comprehensive review of the development of zero waste management: Lessons learned and guidelines. J. Clean. Prod. 2015, 91, 12–25. [Google Scholar] [CrossRef]
  32. Chu, Z.; Li, Q.; Zhou, A.; Zhang, W.; Huang, W.; Wang, J. Strategy formulation path towards zero-waste of municipal solid waste: A case study from Shanghai. J. Clean. Prod. 2023, 418, 138091. [Google Scholar] [CrossRef]
  33. Romano, G.; Masserini, L. Does a zero-waste strategy in sustainable urban waste management affect hierarchy targets and costs? Util. Policy 2023, 85, 101659. [Google Scholar] [CrossRef]
  34. Chen, Y.; Teng, J.; Zhao, N. The content, objectives and path of “Zero-Waste Cities” construction. Environ. Prot. 2019, 47, 21–25. [Google Scholar] [CrossRef]
  35. Greyson, J. An economic instrument for zero waste, economic growth and sustainability. J. Clean. Prod. 2007, 15, 1382–1390. [Google Scholar] [CrossRef]
  36. Meng, X.; Wang, Y. Progress, problems and countermeasures of promoting construction of “Zero-Waste City” in China. Bull. Chin. Acad. Sci. 2022, 37, 995–1005. [Google Scholar] [CrossRef]
  37. Zhao, X.; Wu, S.; Lu, D. Development of an evaluation system for assessing construction level in operation of municipal solid waste comprehensive treatment park for zero-waste cities. Environ. Eng. 2021, 39, 136–140. [Google Scholar] [CrossRef]
  38. Hong, I.; Park, S.; Lee, B.; Lee, J.; Jeong, D.; Park, S. IoT-based smart garbage system for efficient food waste management. Sci. World J. 2014, 2014, 646953. [Google Scholar] [CrossRef]
  39. Phillips, P.S.; Tudor, T.; Bird, H.; Bates, M. A critical review of a key waste strategy initiative in England: Zero waste places projects 2008–2009. Resour. Conserv. Recycl. 2011, 55, 335–343. [Google Scholar] [CrossRef]
  40. Li, Z.; Lin, G.; Wang, H.; Zhao, Y.; Chen, T. Constructing carbon sink-oriented waste management system towards reduction and maximum recovery via high-precision packaging waste inventory. Resour. Conserv. Recycl. 2022, 184, 106412. [Google Scholar] [CrossRef]
  41. Zhang, J.; Zheng, T. Can dual pilot policy of innovative city and low carbon city promote green lifestyle transformation of residents? J. Clean. Prod. 2023, 405, 136711. [Google Scholar] [CrossRef]
  42. Zhou, Y. Does the concept of green development promote high-quality urban development?—An empirical analysis based on the pilot policy of the “Zero-Waste City” in China. Sustainability 2024, 16, 8240. [Google Scholar] [CrossRef]
  43. Sikalidis, A.; Emmanouil, C. Description and economic evaluation of a “Zero-Waste Mortar-Producing Process” for municipal solid waste management in Greece. J. Open Innov. Technol. Mark. Complex. 2019, 5, 46. [Google Scholar] [CrossRef]
  44. Tian, C.; Sui, H.; Chen, Y.; Wang, W.; Deng, H. Estimating carbon emission reductions from China’s “Zero-waste City” construction pilot program. Resour. Conserv. Recycl. 2025, 212, 107975. [Google Scholar] [CrossRef]
  45. Zhao, J.; Li, X.; Liu, W.; Chen, L.; Yang, Y.; Wang, M. Carbon emission reduction potential of municipal solid waste-to-energy under resource mismatch patterns: Evidence from urban agglomerations in China. Resour. Conserv. Recycl. 2025, 217, 108188. [Google Scholar] [CrossRef]
  46. Lakhouit, A. Revolutionizing urban solid waste management with AI and IoT: A review of smart solutions for waste collection, sorting, and recycling. Results Eng. 2025, 104018. [Google Scholar] [CrossRef]
  47. He, M.; Wu, F.; Qu, G.; Liu, X. Harmless and resourceful utilization of solid waste: Multi physical field regulation in the microbiological treatment process of solid waste treatment. Environ. Res. 2023, 238, 117149. [Google Scholar] [CrossRef]
  48. Guo, D.; Zhang, S.; Hou, H.; Zhang, Y.; Xu, H. Synergistic evaluation methodology for pollution and carbon reduction in the field of solid waste resource utilization. Environ. Impact Assess. Rev. 2024, 108, 107604. [Google Scholar] [CrossRef]
  49. Suryawan, I.W.K.; Lee, C.H. Achieving zero waste for landfills by employing adaptive municipal solid waste management services. Ecol. Indic. 2024, 165, 112191. [Google Scholar] [CrossRef]
  50. Müller, V.P.; Eichhammer, W. Economic complexity of green hydrogen production technologies—A trade data-based analysis of country-specific industrial preconditions. Renew. Sustain. Energy Rev. 2023, 182, 113304. [Google Scholar] [CrossRef]
  51. Ghozatfar, A.; Yaghoubi, S.; Bahrami, H. A novel game-theoretic model for waste management with waste-to-energy and compost production under government intervention: A case study. Process Saf. Environ. Prot. 2023, 173, 729–746. [Google Scholar] [CrossRef]
  52. Bi, S.; Du, J.; Yan, Z.; Appolloni, A. Can “Zero waste city” policy promote green technology? Evidence from econometrics and machine learning. J. Environ. Manag. 2024, 370, 122895. [Google Scholar] [CrossRef]
  53. Tao, J.; Li, Z.; Chen, C.; Liang, R.; Wu, S.; Lin, F.; Cheng, Z.; Yan, B.; Chen, G. Intelligent technologies powering clean incineration of municipal solid waste: A system review. Sci. Total Environ. 2024, 173082. [Google Scholar] [CrossRef]
  54. Filimonova, N.; Birchall, S.J. Sustainable municipal solid waste management: A comparative analysis of enablers and barriers to advance governance in the Arctic. J. Environ. Manag. 2024, 371, 123111. [Google Scholar] [CrossRef]
  55. Ramanathan, R.; He, Q.; Black, A.; Ghobadian, A.; Gallear, D. Environmental regulations, innovation and firm performance: A revisit of the porter hypothesis. J. Clean. Prod. 2017, 155, 79–92. [Google Scholar] [CrossRef]
  56. Yu, Y.; Zhang, X.; Liu, Y.; Zhou, T. Carbon emission trading, carbon efficiency, and the Porter hypothesis: Plant-level evidence from China. Energy 2024, 308, 132870. [Google Scholar] [CrossRef]
  57. Miguel, I.; Santos, A.; Venâncio, C.; Oliveira, M. Knowledge, concerns and attitudes towards plastic pollution: An empirical study of public perceptions in Portugal. Sci. Total Environ. 2024, 906, 167784. [Google Scholar] [CrossRef]
  58. Zhou, L.; Li, S.; Liu, Z.; Zhou, Y.; He, B.J.; Zhang, Z.; Wang, H.; Zhang, G. Advancing zero-carbon community in China: Policy analysis, implementation challenges, and strategic recommendations. Energy Build. 2024, 115106. [Google Scholar] [CrossRef]
  59. Shboul, B.; Koh, S.L.; Veneti, C.; Herghelegiu, A.I.; Zinca, A.E.; Pourkashanian, M. Evaluating sustainable development practices in a zero-carbon university campus: A pre and post-COVID-19 pandemic recovery study. Sci. Total Environ. 2023, 896, 165178. [Google Scholar] [CrossRef] [PubMed]
  60. Zhao, F.; Hu, Z.; Zhao, X. Does innovative city construction improve urban carbon unlocking efficiency? Evidence from China. Sustain. Cities Soc. 2023, 92, 104494. [Google Scholar] [CrossRef]
  61. Filimonova, I.V.; Provornaya, I.V.; Komarova, A.V.; Zemnukhova, E.A.; Mishenin, M.V. Influence of economic factors on the environment in countries with different levels of development. Energy Rep. 2020, 6, 27–31. [Google Scholar] [CrossRef]
  62. Sun, K.; Liu, C.; Yang, Z.; Han, J.; Xie, W.; Cao, Y. The impact of industrial structure on the environment pollution and its spatial-temporal differences in Henan, China. J. Clean. Prod. 2022, 381, 135127. [Google Scholar] [CrossRef]
  63. Yadav, S.; Samadhiya, A.; Kumar, A.; Luthra, S.; Pandey, K.K. Nexus between fintech, green finance and natural resources management: Transition of BRICS nation industries from resource curse to resource blessed sustainable economies. Resour. Policy 2024, 91, 104903. [Google Scholar] [CrossRef]
  64. Hondroyiannis, G.; Papapetrou, E.; Tsalaporta, P. New insights on the contribution of human capital to environmental degradation: Evidence from heterogeneous and cross-correlated countries. Energy Econ. 2022, 116, 106416. [Google Scholar] [CrossRef]
  65. Ye, Z.; Zou, C.; Huang, Y. Impact of heterogeneous spatial structure on regional innovation—From the perspectives of efficiency and gap. Sustainability 2022, 14, 12095. [Google Scholar] [CrossRef]
  66. Benzerrouk, Z.; Abid, M.; Sekrafi, H. Pollution haven or halo effect? A comparative analysis of developing and developed countries. Energy Rep. 2021, 7, 4862–4871. [Google Scholar] [CrossRef]
  67. Peng, Z.; Huang, Y.; Liu, L.; Xu, W.; Qian, X. How government digital attention alleviates enterprise financing constraints: An enterprise digitalization perspective. Financ. Res. Lett. 2024, 67, 105883. [Google Scholar] [CrossRef]
  68. Beck, T.; Levine, R.; Levkov, A. Big bad banks? The winners and losers from bank deregulation in the United States. J. Financ. 2010, 65, 1637–1667. [Google Scholar] [CrossRef]
  69. Hong, Q.; Cui, L.; Hong, P. The impact of carbon emissions trading on energy efficiency: Evidence from quasi-experiment in China’s carbon emissions trading pilot. Energy Econ. 2022, 110, 106025. [Google Scholar] [CrossRef]
  70. Yin, J.; Shi, S. Analysis of the mediating role of social network embeddedness on low-carbon household behavior: Evidence from China. J. Clean. Prod. 2019, 234, 858–866. [Google Scholar] [CrossRef]
  71. Li, C.; Chen, G.; Zhang, X.; Li, Y.; Ding, W.; Yu, X.; He, B. The impact of digital inclusive finance on agricultural carbon emissions: Evidence from China. Pol. J. Environ. Stud. 2025, 34, 1593–1605. [Google Scholar] [CrossRef]
  72. Guo, L.; Tang, M.; Wu, Y.; Bao, S.; Wu, Q. Government-led regional integration and economic growth: Evidence from a quasi-natural experiment of urban agglomeration development planning policies in China. Cities 2025, 156, 105482. [Google Scholar] [CrossRef]
  73. Wang, H.; Huang, Y. Spatial correlation network of Chinese-style ecological modernization and its influencing factors. Ecol. Indic. 2025, 172, 113297. [Google Scholar] [CrossRef]
  74. Liu, G.; Cui, F.; Wang, Y. Spatial effects of urbanization, ecological construction and their interaction on land use carbon emissions/absorption: Evidence from China. Ecol. Indic. 2024, 160, 111817. [Google Scholar] [CrossRef]
  75. Huang, S.; Ge, J. Are there heterogeneities in environmental risks among different types of resource-based cities in China? Assessment based on environmental risk field approach. Int. J. Disaster Risk Reduct. 2024, 113, 104810. [Google Scholar] [CrossRef]
  76. Dou, S.; Xu, D.; Zhu, Y.; Keenan, R. Critical mineral sustainable supply: Challenges and governance. Futures 2023, 146, 103101. [Google Scholar] [CrossRef]
  77. Yang, Y.; Cheng, D.; Zhang, B.; Guan, C.; Cheng, X.; Cheng, T. Coal resource-based cities at the crossroads: Towards a sustainable urban future. Cities 2023, 140, 104424. [Google Scholar] [CrossRef]
  78. Li, P.; He, C.; Huang, Q.; Wang, Y.; Duan, X. Metacoupling flow of embodied carbon in resource-based cities: A case study of Hohhot-Baotou-Ordos-Yulin urban agglomeration in China. Energy 2024, 313, 134041. [Google Scholar] [CrossRef]
  79. Akash, F.A.; Shovon, S.M.; Rahman, M.A.; Rahman, W.; Chakraborty, P.; Haque, M.N.; Monir, M.U.; Habib, M.A.; Biswas, A.K.; Chowdhury, S.; et al. Innovative pathways to sustainable energy: Advancements in clean coal technologies in Bangladesh-A review. Clean. Eng. Technol. 2024, 22, 100805. [Google Scholar] [CrossRef]
  80. Li, C.; Chen, X.; Yuan, C. Does digital government reduce carbon emissions? Empirical evidence from global sources. J. Environ. Manag. 2025, 380, 125081. [Google Scholar] [CrossRef]
  81. Fan, X. Research on the coupling of ecological environment and socio-economic development in resource-based cities: Based on scenario simulation method. Sustain. Cities Soc. 2024, 114, 105810. [Google Scholar] [CrossRef]
  82. Chen, Z.; He, Y.; Liao, N. Can carbon emission trading policy enhance the synergistic emission reduction of carbon dioxide and air pollutants? A comparative study considering different pollutants. Energy 2024, 305, 132364. [Google Scholar] [CrossRef]
  83. Ma, L.; Iqbal, N.; Bouri, E.; Zhang, Y. How good is green finance for green innovation? Evidence from the Chinese high-carbon sector. Resour. Policy 2023, 85, 104047. [Google Scholar] [CrossRef]
  84. Wu, Y.Z.; Shi, K.F.; Chen, Z.Q.; Liu, S.R.; Chang, Z.J. An improved time-series DMSP-OLS-like data (1992–2023) in China by integrating DMSP-OLS and SNPP-VIIRS. Harv. Dataverse 2021, 60, 1–14. [Google Scholar] [CrossRef]
  85. Fan, Q.; Hudson, D. A new endogenous spatial tempoal weight matrix based on ratios of global moran’s I. J. Quant. Technol. Econ. 2018, 35, 131–149. [Google Scholar] [CrossRef]
  86. He, L.; Yuan, H.; Wu, H. Collaborative mechanism for promoting the cross-regional management of construction and demolition waste. J. Clean. Prod. 2022, 372, 133706. [Google Scholar] [CrossRef]
  87. Song, J.; Feng, R.; Yue, C.; Shao, Y.; Han, J.; Xing, J.; Yang, W. Reinforced urban waste management for resource, energy and environmental benefits: China’s regional potentials. Resour. Conserv. Recycl. 2022, 178, 106083. [Google Scholar] [CrossRef]
  88. Gao, Y.; Gao, M. Spatial correlation network of municipal solid waste carbon emissions and its influencing factors in China. Environ. Impact Assess. Rev. 2024, 106, 107490. [Google Scholar] [CrossRef]
Figure 1. Parallel trend test.
Sustainability 17 03215 g001
Figure 2. Results of placebo test.
Sustainability 17 03215 g002
Figure 3. Heterogeneity results.
Sustainability 17 03215 g003
Table 1. Benchmark regression results.
VariableslnwastelnwastelnCO2lnCO2
(1)(2)(3)(4)
zwc−0.276 ***−0.235 ***−0.174 ***−0.118 *
(0.064)(0.063)(0.068)(0.061)
lnpgdp 0.356 *** 0.509 ***
(0.070) (0.069)
struc −0.002 0.001
(0.003) (0.002)
lngov 0.097 0.094 *
(0.085) (0.055)
lnfdi −0.005 0.005
(0.010) (0.006)
lnfin 0.234 *** 0.184 ***
(0.074) (0.053)
Constant0.397 ***−3.280 ***−2.508 ***−7.948 ***
(0.008)(0.716)(0.007)(0.666)
N1738173817381738
R20.9400.9390.9300.930
Note: Standard errors in parentheses; *** p < 0.01, * p < 0.1.
Table 2. Other robustness tests.
VariablesRemoving the Influence of Relevant PoliciesExcluding Cities with a High Administrative StatusAdjustment of the Control GroupPSM-DID
lnwastelnCO2lnwastelnCO2lnwastelnCO2lnwastelnCO2
(1)(2)(3)(4)(5)(6)(7)(8)
zwc−0.217 ***−0.095 *−0.486 **−0.374 ***−0.218 ***−0.124 **−0.246 **−0.225 ***
(0.060)(0.057)(0.214)(0.128)(0.065)(0.063)(0.101)(0.081)
lccp0.001−0.075 **
(0.042)(0.031)
wsp−0.187 ***−0.209 ***
(0.032)(0.025)
ControlsYesYesYesYesYesYesYesYes
Constant−2.704 ***−7.299 ***−11.103 ***−16.165 ***−5.426 ***−10.423 ***−4.221 ***−9.907 ***
(0.709)(0.657)(1.138)(0.729)(0.886)(0.951)(1.333)(1.639)
N173817381356135610671067264264
R20.9400.9330.4490.5820.9330.9140.9550.949
Note: Standard errors in parentheses; *** p < 0.01, ** p < 0.05, * p < 0.1; lccp and wsp are dummy variables of the LCCP policy and the WCP policy, respectively.
Table 3. 2SLS regression results.
VariablesFirst StageSecond Stage
(1)(2)(3)
zwclnwastelnCO2
zwc −5.030 **−3.624 **
(2.137)(1.578)
iv0.097 ***
(0.020)
ControlsYesYesYes
Constant−0.406 ***1.328−4.405 ***
(0.093)(2.314)(1.709)
N169716971697
Note: Standard errors in parentheses; *** p < 0.01, ** p < 0.05.
Table 4. Mediating effect test results.
VariableGreen Innovation MechanismEnvironmental Regulation Mechanism
(1)(2)(3)(4)(5)(6)
gpalnwastelnCO2envlnwastelnCO2
zwc0.087 **−0.213 ***−0.103 *0.101 *−0.197 ***−0.091 *
(0.038)(0.052)(0.061)(0.059)(0.051)(0.049)
gpa −0.249 ***−0.172 ***
(0.057)(0.038)
env −0.379 ***−0.261***
(0.085)(0.057)
ControlsYesYesYesYesYesYes
Constant2.799 ***−2.582 ***−7.468 ***4.602 ***−1.535 *−6.749 ***
(0.437)(0.736)(0.701)(0.289)(0.833)(0.773)
Proportion of indirect effect 9.22%12.68% 16.29%22.34%
N173817381738173817381738
R20.8290.9400.9320.8300.9400.932
Note: Standard errors in parentheses; *** p < 0.01, ** p < 0.05, * p < 0.1.
Table 5. The results of enterprise exit effect.
Variablelncom_num
(1)
zwc−0.011
(0.061)
Constant2.546 ***
(0.635)
ControlsYes
Obs.1738
R20.960
Note: Standard errors in parentheses; *** p < 0.01.
Table 6. The results of the spatial spillover effect.
VariableGeographic Adjacency MatrixGeographic Distance MatrixEconomic Distance MatrixEconomic Geography Nested Matrix
lnwastelnCO2lnwastelnCO2lnwastelnCO2lnwastelnCO2
(1)(2)(3)(4)(5)(6)(7)(8)
zwc−0.188 ***−0.100 **−0.216 ***−0.108 **−0.208 ***−0.123 ***−0.220 ***−0.125 ***
(0.058)(0.044)(0.060)(0.046)(0.060)(0.046)(0.059)(0.046)
W × zwc−0.045−0.0040.484−0.2200.1380.0710.436 ***0.056
(0.093)(0.070)(0.377)(0.277)(0.140)(0.108)(0.147)(0.113)
ρ0.186 ***0.311 ***0.380 ***0.609 ***0.116 ***0.124 ***0.149 ***0.177 ***
(0.027)(0.027)(0.121)(0.097)(0.042)(0.035)(0.040)(0.034)
ControlsYesYesYesYesYesYesYesYes
W × ControlsYesYesYesYesYesYesYesYes
Obs.17381738173817381738173817381738
R20.0030.0600.0270.2770.0100.1280.0100.176
Note: Standard errors in parentheses; *** p < 0.01, ** p < 0.05.
Disclaimer/Publisher’s Note: The statements, opinions and data contained in all publications are solely those of the individual author(s) and contributor(s) and not of MDPI and/or the editor(s). MDPI and/or the editor(s) disclaim responsibility for any injury to people or property resulting from any ideas, methods, instructions or products referred to in the content.

