
Geographical Variations in Egg Nutrient Density: A Comparative Study of Sustainable Layer Hen Systems in Ohio and Indiana in Late Fall and Early Winter Months

 ,
,
Abstract
1. Introduction
2. Materials and Methods
2.1. Sample Characteristics
2.2. Physical Characteristics of Eggs
2.3. Proximate Analysis of Forage and Layer Hen Feed
2.4. Fatty Acid Extraction and Methylation Procedure
2.5. Fatty Acid Quantification
2.6. Phenolics
2.7. Egg Yolk Carotenoids
2.8. Forage and Layer Hen Feed Carotenoids
2.9. Vitamin Analysis
2.10. Egg Yolk Mineral Assessment
2.11. Egg Yolk Cholesterol Analysis
2.12. Soil Collection and Analysis
2.13. Weather Collection
2.14. Statistical Analysis and Manuscript Preparation
3. Results
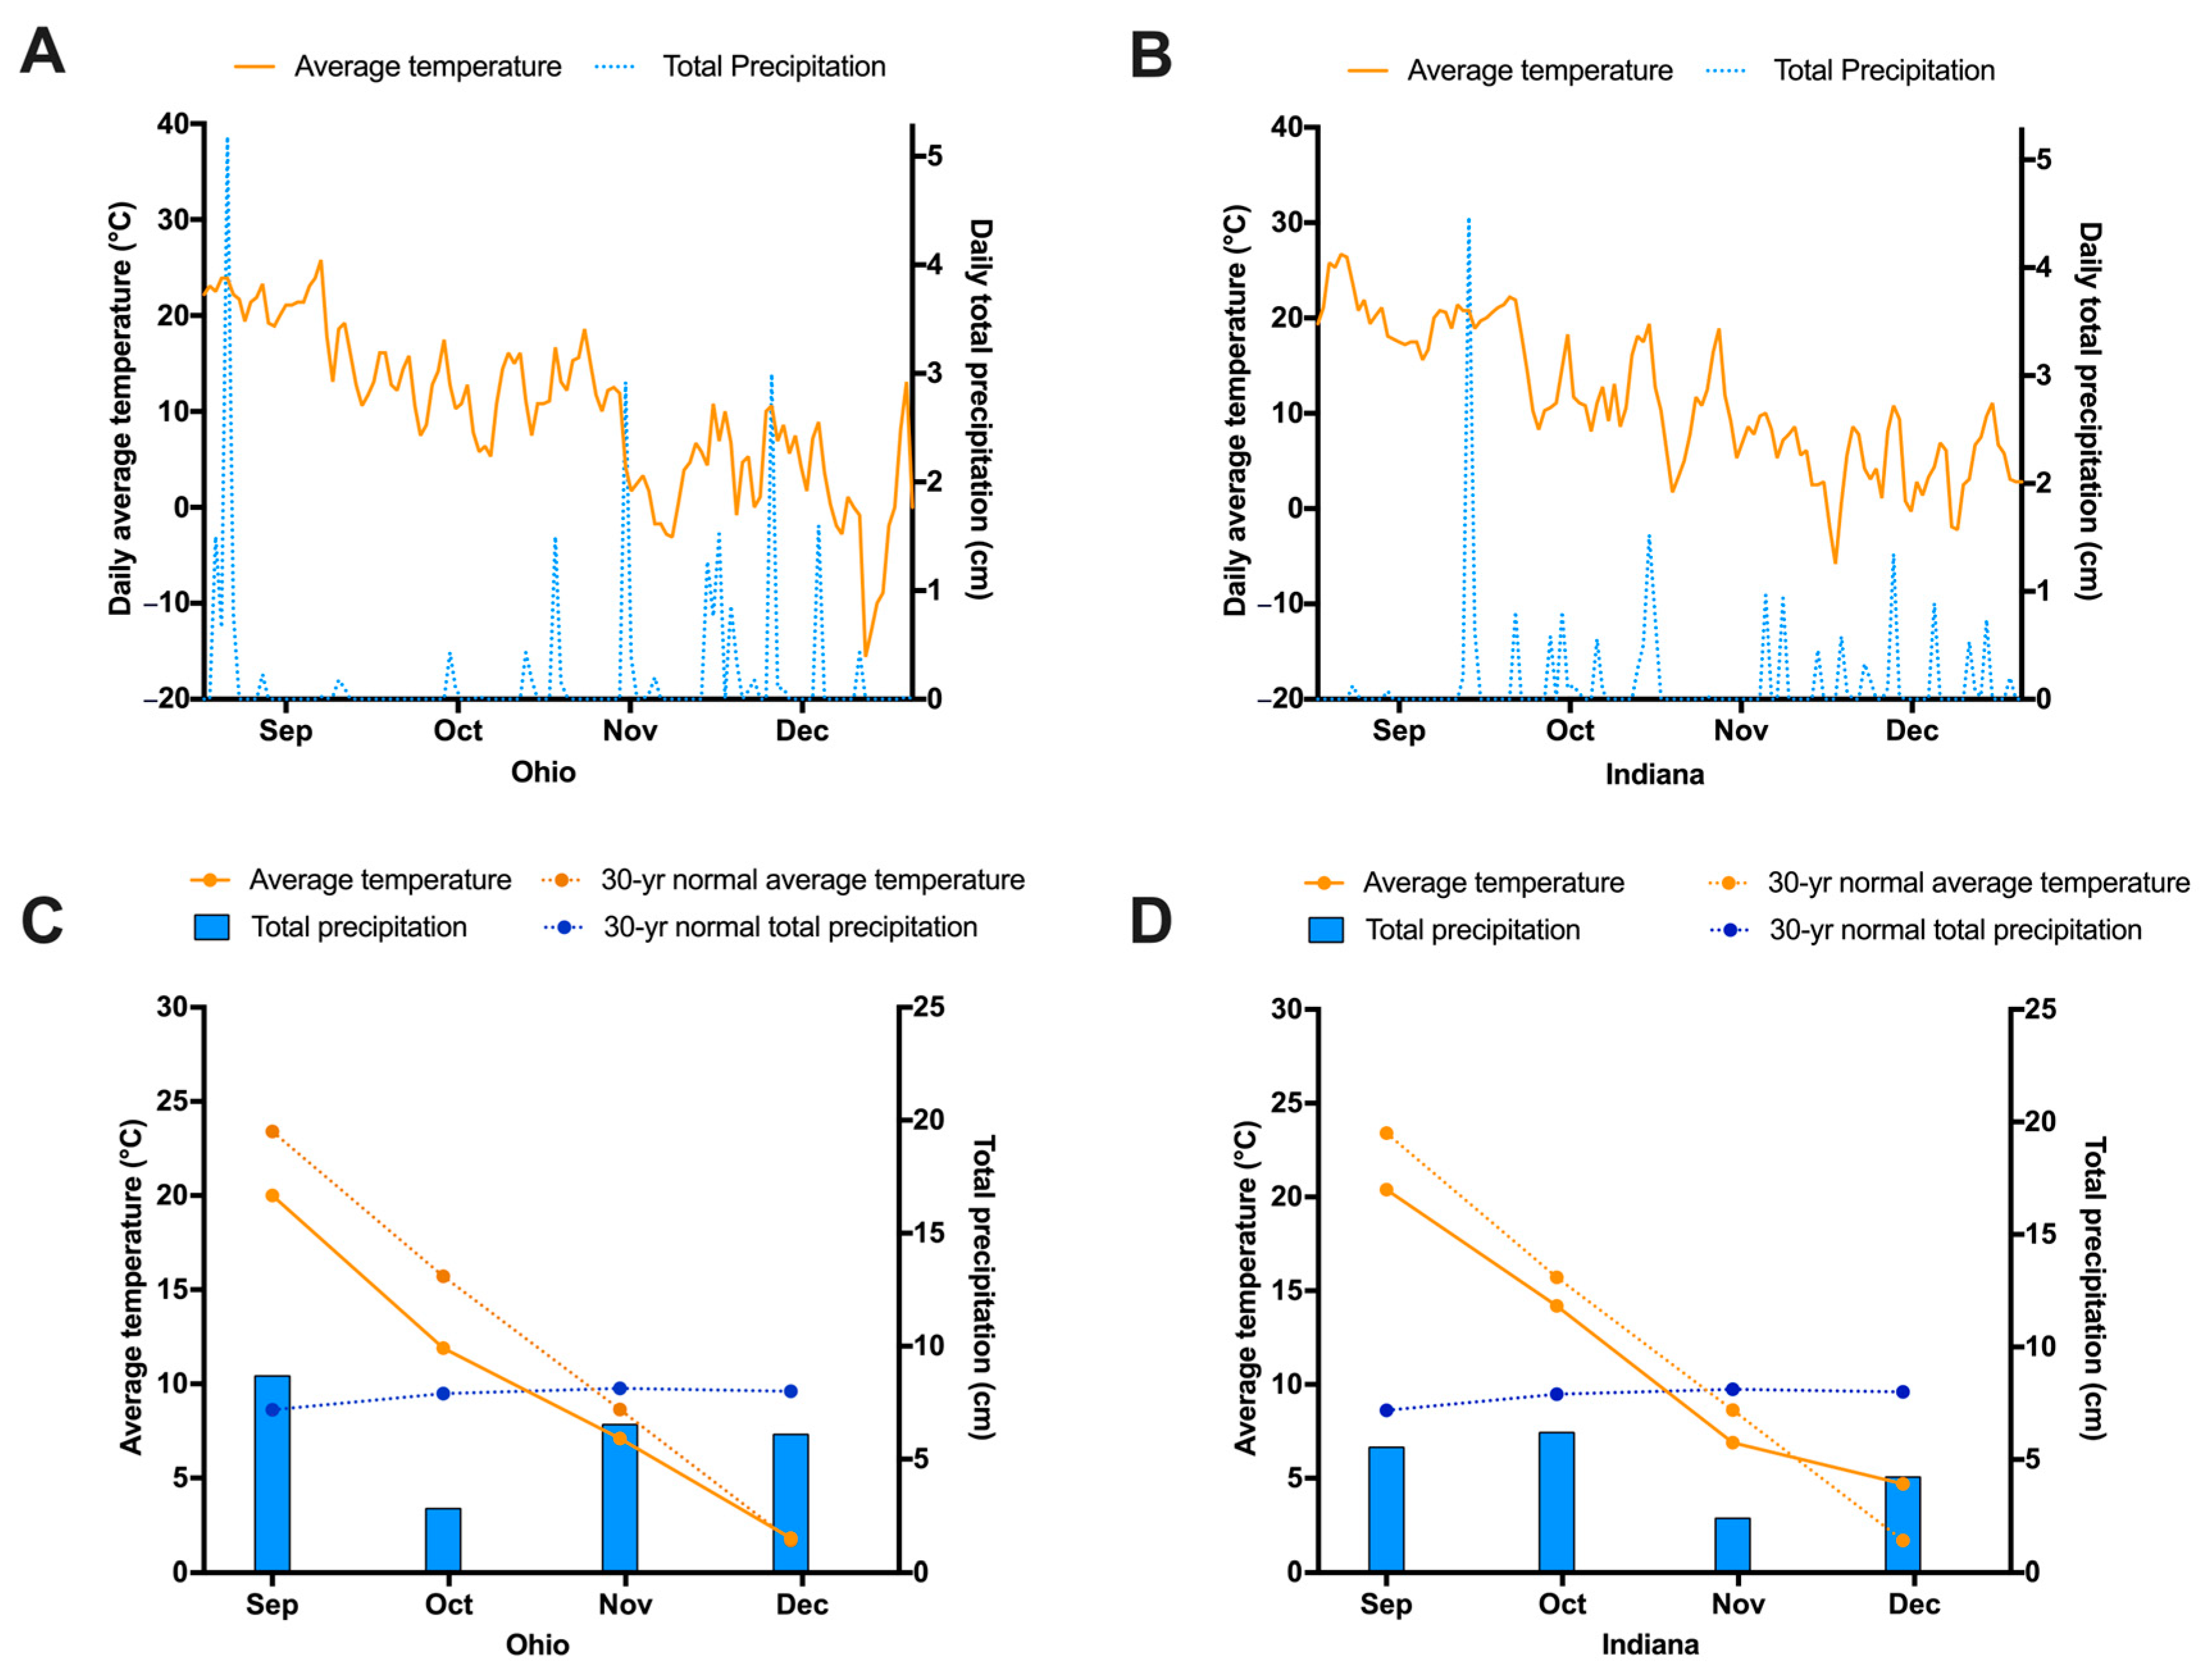
3.1. Weather
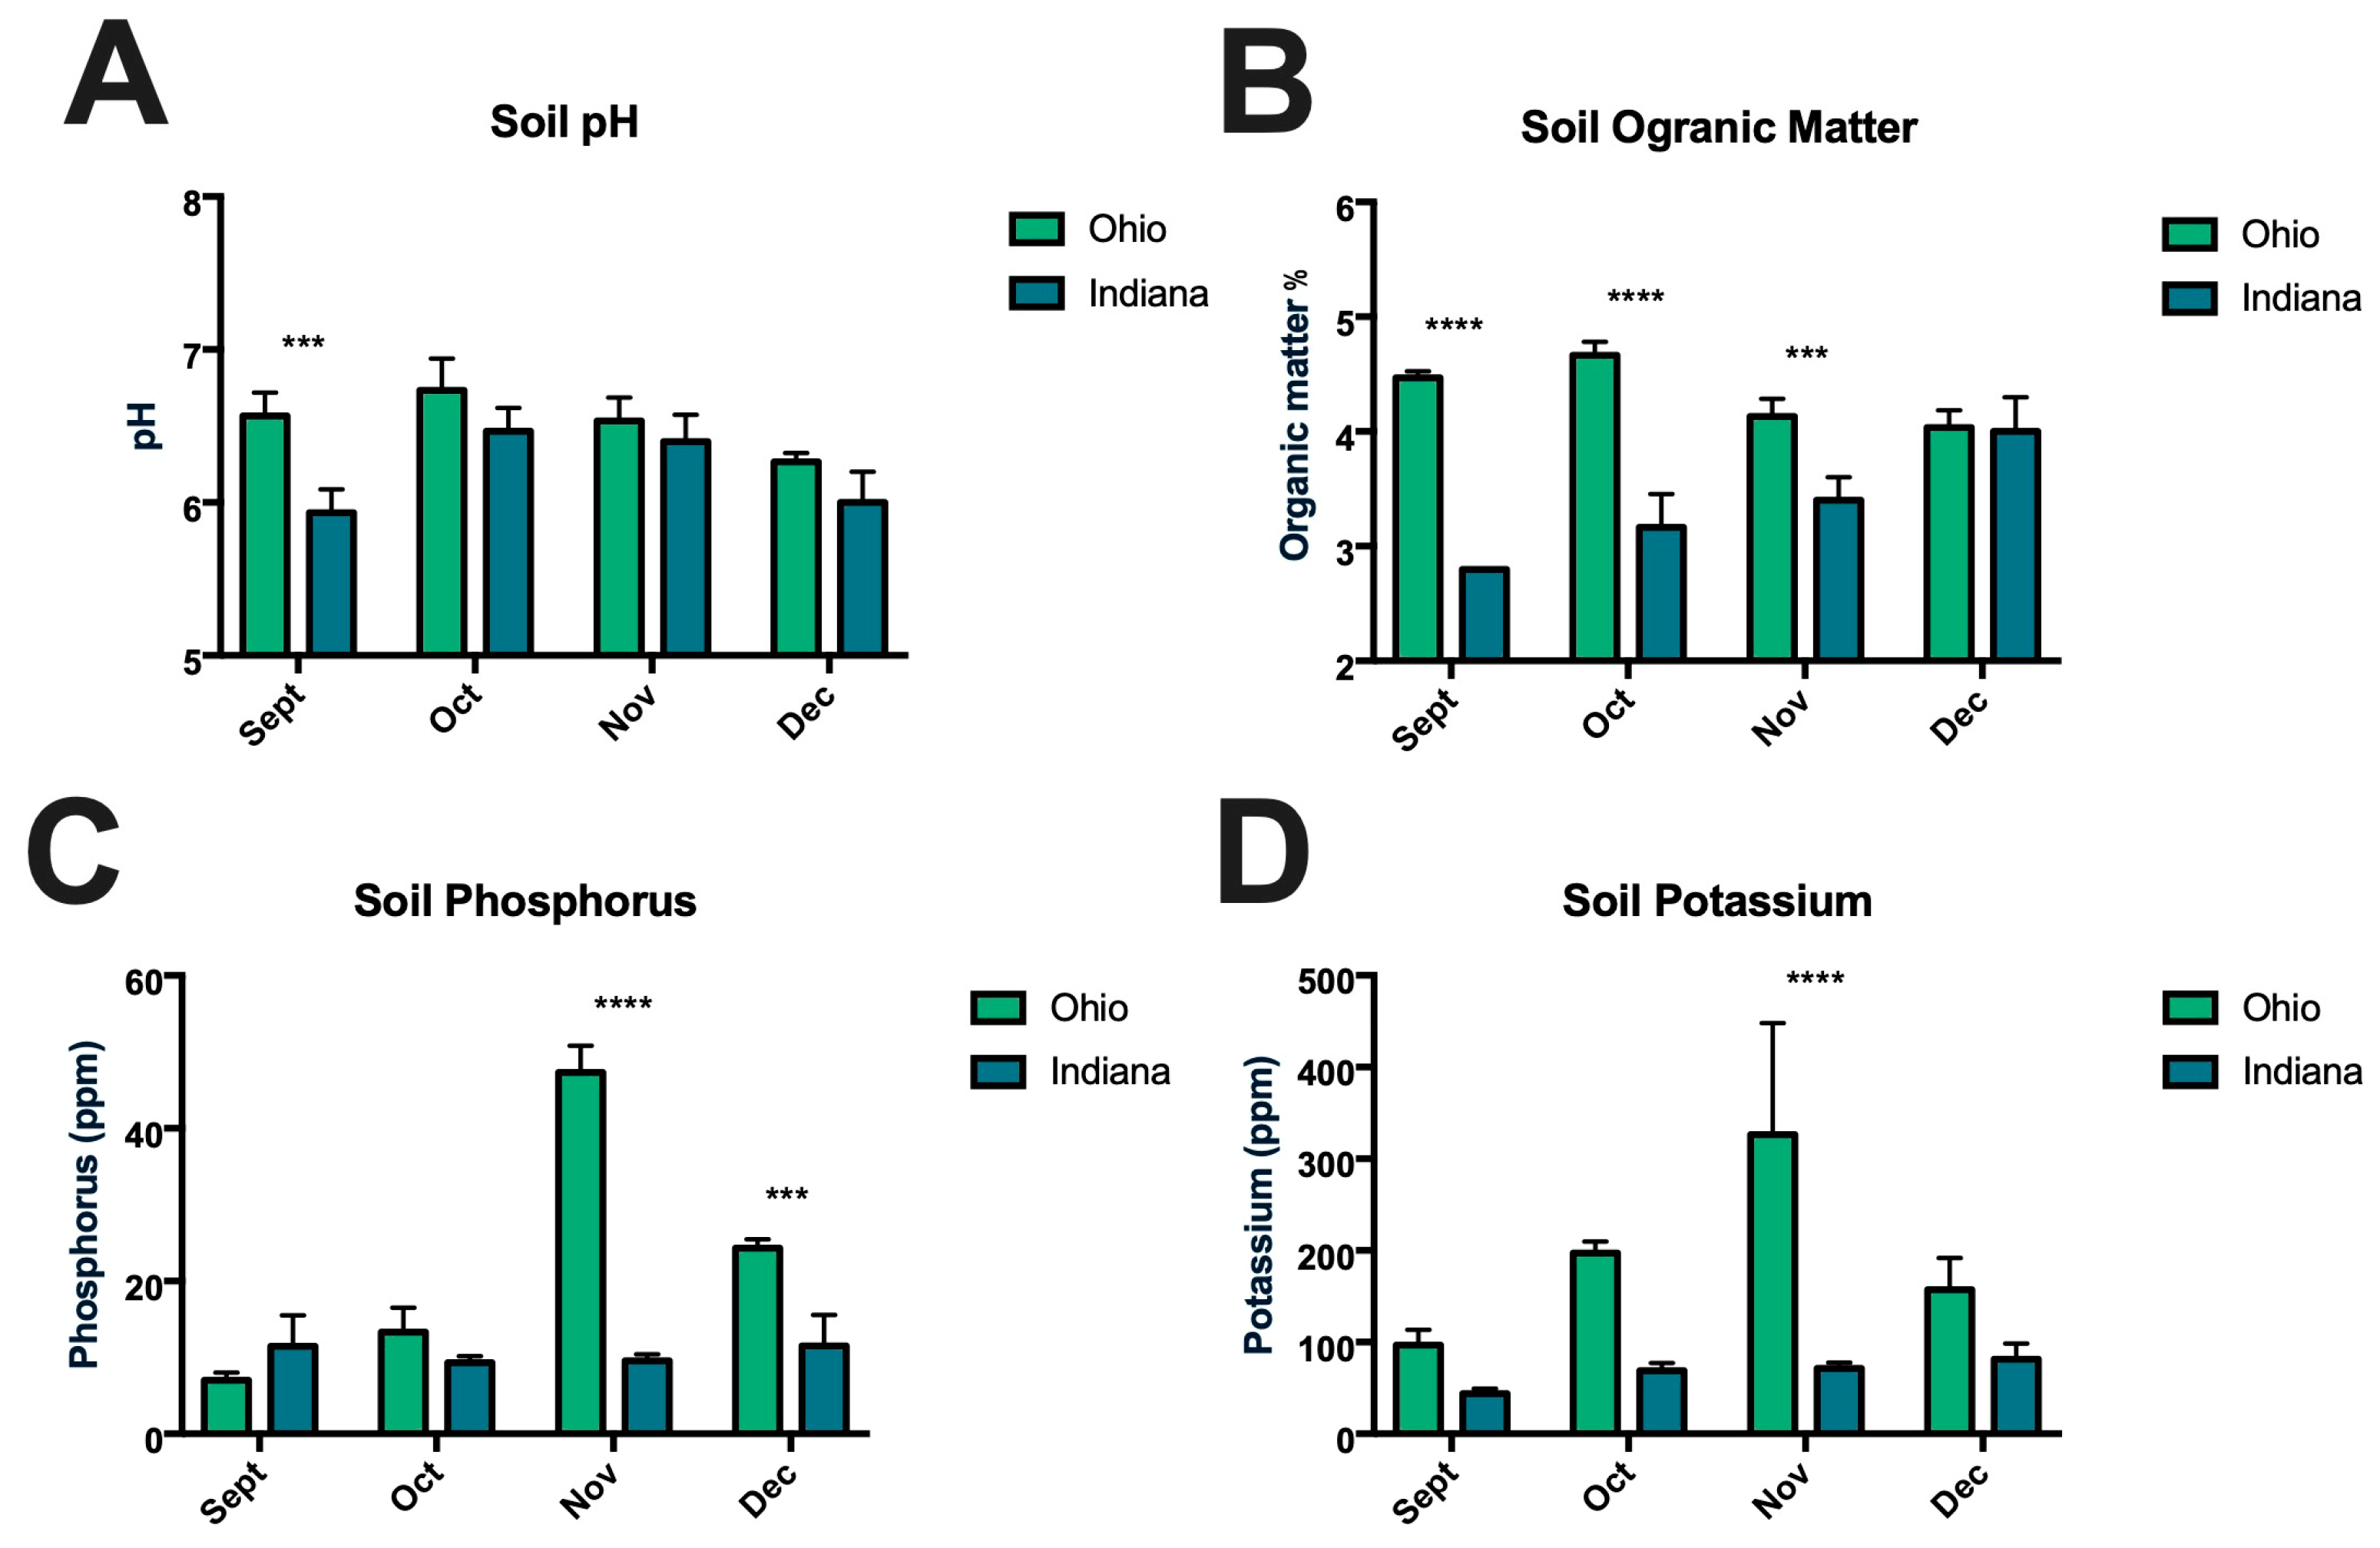
3.2. Soil Composition
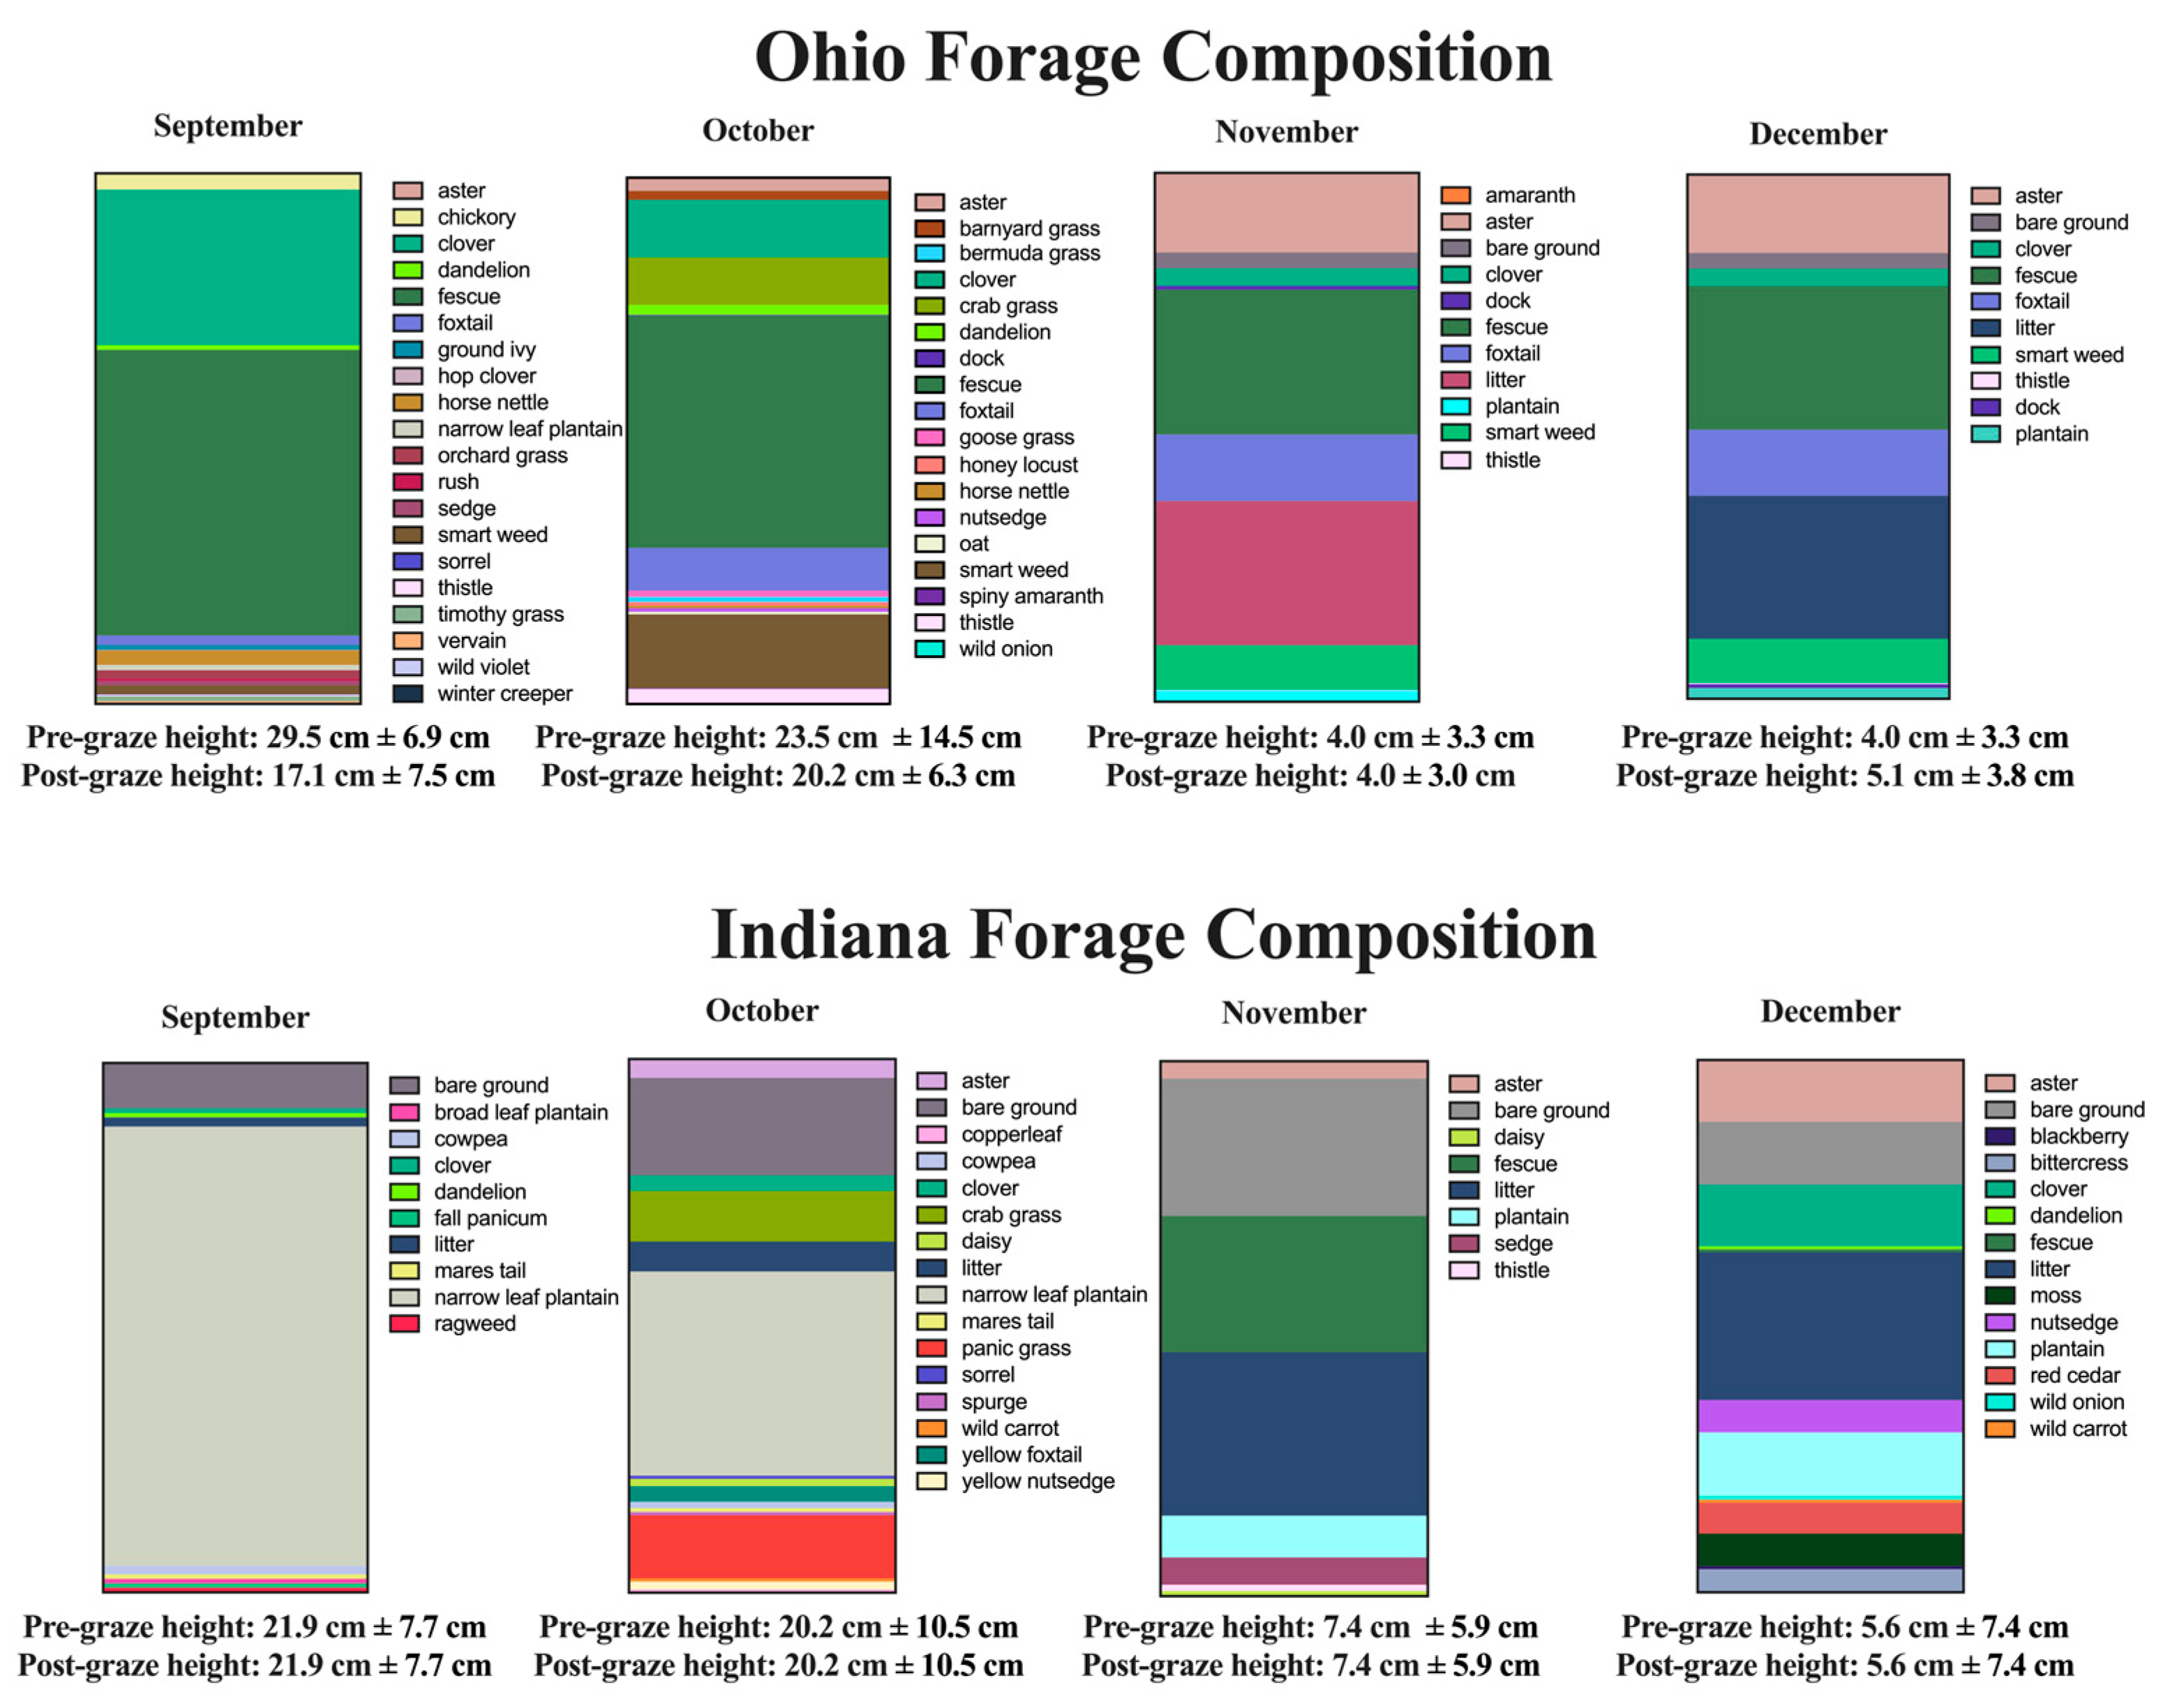
3.3. Forage Compositon
3.4. Physcial Characteristics of Eggs
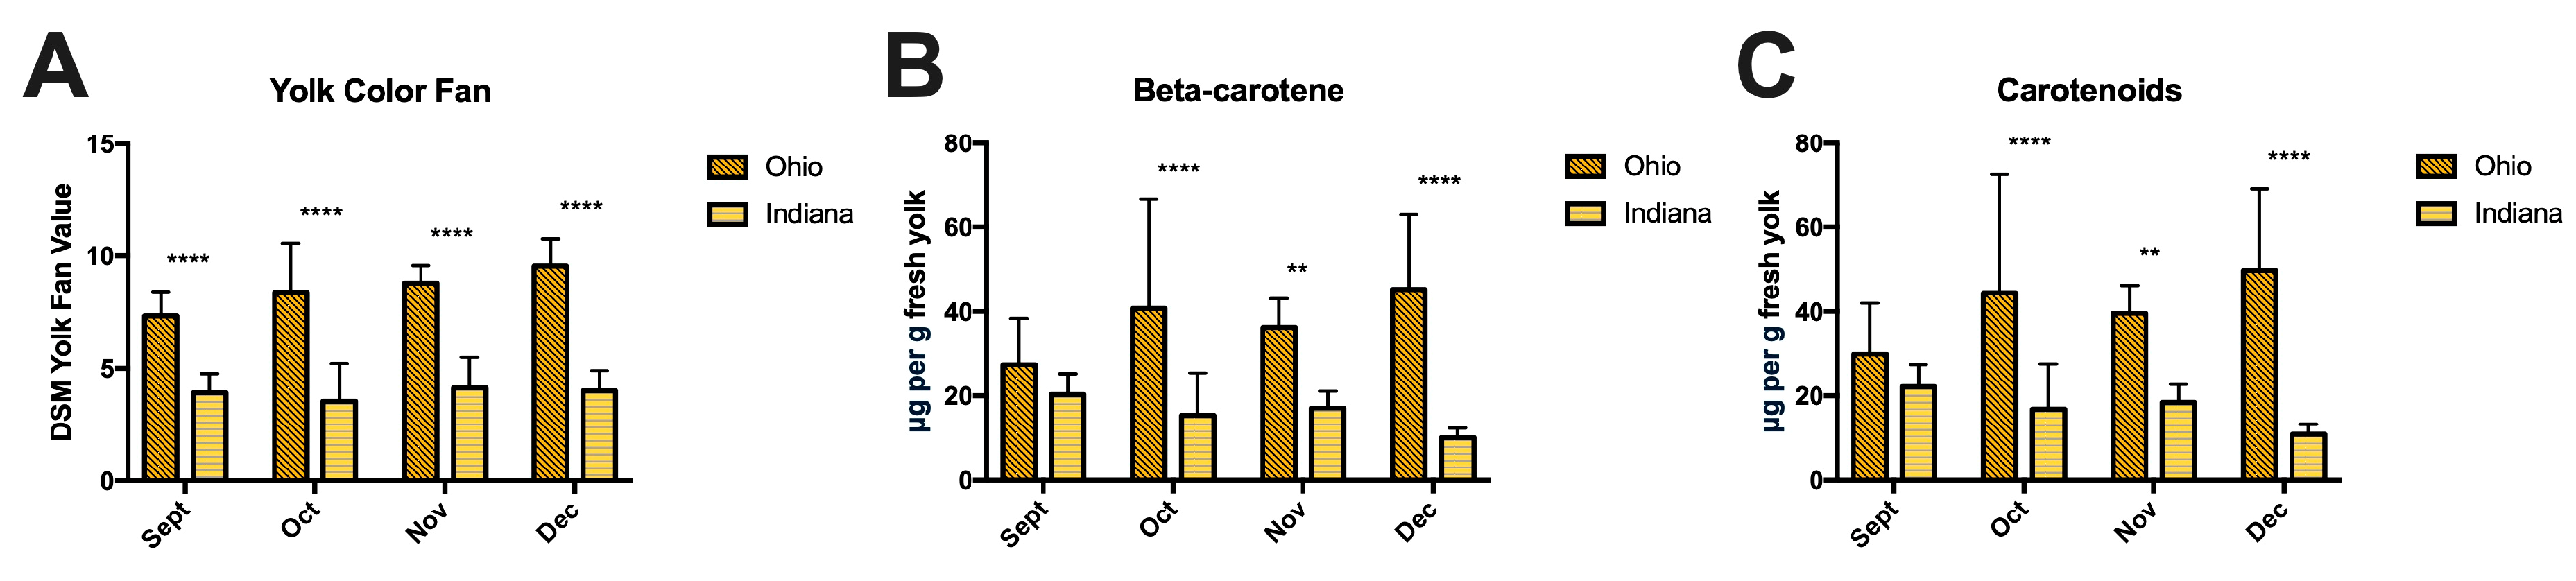
3.5. Egg Yolk Color and Antioxidants
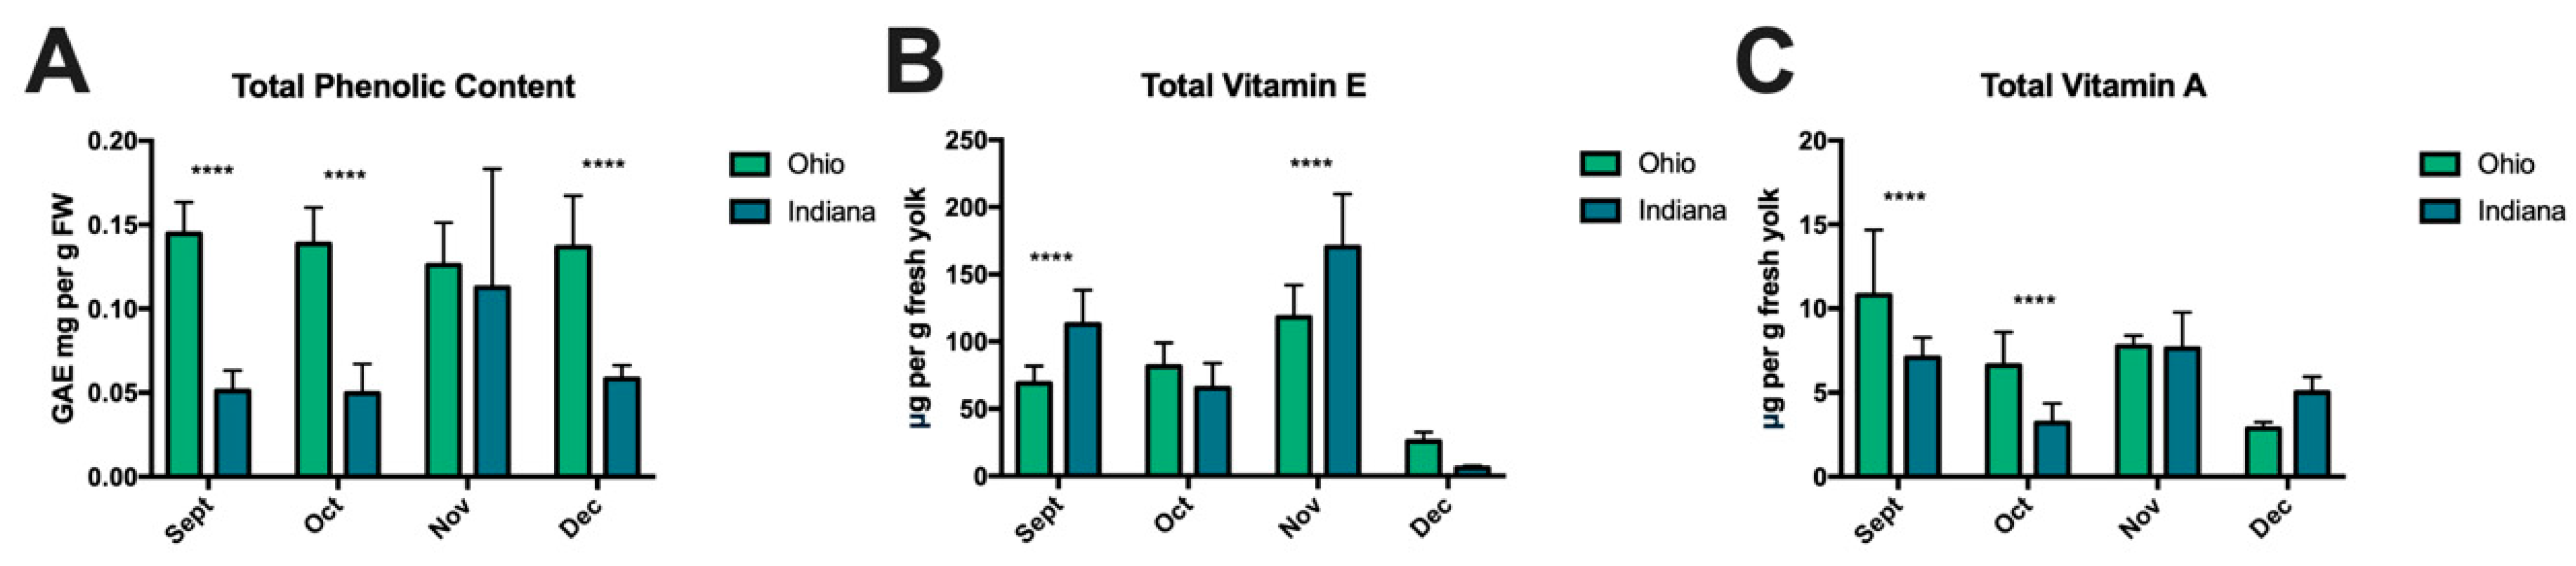
3.6. Egg Yolk Vitamins and Phenolic Content
3.7. Egg Yolk Fatty Acids and Total Cholesterol
3.8. Correlation Analysis Between Yolk and Forage Nutrients
4. Discussion
5. Conclusions
Supplementary Materials
Author Contributions
Funding
Institutional Review Board Statement
Informed Consent Statement
Data Availability Statement
Acknowledgments
Conflicts of Interest
Abbreviations
| SFA | Saturated fatty acid |
| MUFA | Monounsaturated fatty acid |
| PUFA | Polyunsaturated fatty acid |
| BCFAs | Branch chain fatty acid |
| n-6 | Omega-6 fatty acid |
| n-3 | Omega-3 fatty acid |
| n-6:n-3 ratio | Omega-6 fatty acid to Omega-3 fatty acid ratio |
| GC-MS | Gas chromatography-mass spectrometer |
| CLA | Conjugated linoleic acid |
| AOAC | Association of Official Analytical Chemists |
| BHT | Butylated hydroxytoluene |
| ANOVA | Analysis of Variance |
| ADF | Acid detergent fiber |
| NDF | Neutral detergent fiber |
| TDN | Total digestible nutrients |
| ppm | Parts per million |
| FW | Fresh weight |
References
- Jaeger, S.R.; Harker, F.R.; Ares, G. Consumer insights about sustainable and ‘beyond organic’ agriculture: A study of biodynamics in the United Kingdom, Australia, Singapore, and Germany. J. Clean. Prod. 2023, 401, 136744. [Google Scholar] [CrossRef]
- Spain, C.V.; Freund, D.; Mohan-Gibbons, H.; Meadow, R.G.; Beacham, L. Are they buying it? United States consumers’ changing attitudes toward more humanely raised meat, eggs, and dairy. Animals 2018, 8, 128. [Google Scholar] [CrossRef] [PubMed]
- Spratt, E.; Jordan, J.; Winsten, J.; Huff, P.; Van Schaik, C.; Jewett, J.G.; Filbert, M.; Luhman, J.; Meier, E.; Paine, L. Accelerating regenerative grazing to tackle farm, environmental, and societal challenges in the upper midwest. J. Soil Water Conserv. 2021, 76, 15A–23A. [Google Scholar] [CrossRef]
- Stampa, E.; Schipmann-Schwarze, C.; Hamm, U. Consumer perceptions, preferences, and behavior regarding pasture-raised livestock products: A review. Food Qual. Prefer. 2020, 82, 103872. [Google Scholar] [CrossRef]
- Connor, D.S.; Oppenhein, D. Demand for pasture-raised livestock products: Results from michigan retail surveys. J. Agribus. 2008, 26, 1–20. [Google Scholar] [CrossRef]
- Anderson, K.E. Comparison of fatty acid, cholesterol, and vitamin A and E composition in eggs from hens housed in conventional cage and range production facilities. Poult. Sci. 2011, 90, 1600–1608. [Google Scholar] [CrossRef]
- Kiczorowska, B.; Samolińska, W.; Kwiecień, M.; Winiarska-Mieczan, A.; Rusinek-Prystupa, E.; Ridha, A.; Al-Yasiry, M. Nutritional value and the content of minerals in eggs produced in large-scale, courtyard and organic systems. J. Elem. 2015, 20, 887–895. [Google Scholar] [CrossRef]
- Mugnai, C.; Sossidou, E.N.; Dal Bosco, A.; Ruggeri, S.; Mattioli, S.; Castellini, C. The Effects of Husbandry System on the Grass Intake and Egg Nutritive Characteristics of Laying Hens. J. Sci. Food Agric. 2014, 94, 459–467. Available online: https://scijournals.onlinelibrary.wiley.com/doi/abs/10.1002/jsfa.6269 (accessed on 26 March 2025).
- Hammershøj, M.; Johansen, N.F. Review: The effect of grass and herbs in organic egg production on egg fatty acid composition, egg yolk colour and sensory properties. Livest. Sci. 2016, 194, 37–43. [Google Scholar] [CrossRef]
- Hammershøj, M.; Steenfeldt, S. Organic egg production. ii: The quality of organic eggs is influenced by hen genotype, diet and forage material analyzed by physical parameters, functional properties and sensory evaluation. Anim. Feed Sci. Technol. 2015, 208, 182–197. [Google Scholar] [CrossRef]
- Wallace, T.C.; Montenegro-Bethancourt, G.; Rohloff, P.; Jimenez, E.Y.; Proaño, G.V.; McCabe, G.P.; Steiber, A.; Ruosch, A.; Laessig, I.; Ladwig, E.; et al. Comparison of the nutrient composition of eggs produced in the guatemalan highlands during the wet and dry seasons. Food Sci. Nutr. 2023, 11, 8163–8173. [Google Scholar] [CrossRef]
- Michigan Legislature. MCL—Section 287.746. Available online: https://www.legislature.mi.gov/Laws/MCL?objectName=MCL-287-746 (accessed on 20 February 2025).
- Shell Egg Labeling Guidance|Agricultural Marketing Service. Available online: https://www.ams.usda.gov/grades-standards/shell-egg-labeling-guidance (accessed on 24 February 2025).
- Sergin, S.; Jambunathan, V.; Garg, E.; Rowntree, J.E.; Fenton, J.I. Fatty acid and antioxidant profile of eggs from pasture-raised hens fed a corn- and soy-free diet and supplemented with grass-fed beef suet and liver. Foods 2022, 11, 3404. [Google Scholar] [CrossRef] [PubMed]
- Sergin, S.; Goeden, T.; Krusinski, L.; Kesamneni, S.; Ali, H.; Bitler, C.A.; Medina-Meza, I.G.; Fenton, J.I. Fatty acid and antioxidant composition of conventional compared to pastured eggs: Characterization of conjugated linoleic acid and branched chain fatty acid isomers in eggs. ACS Food Sci. Technol. 2021, 1, 260–267. [Google Scholar] [CrossRef]
- Eisen, E.J.; Bohren, B.B.; McKean, H.E. The haugh unit as a measure of egg albumen quality1. Poult. Sci. 1962, 41, 1461–1468. [Google Scholar] [CrossRef]
- Bertoncelj, J.; Gašperlin, A.; Korošec, M. Yolk colour of eggs from different housing systems. MESO Prvi Hrvat. Časopis O Mesu 2019, 21, 378–385. [Google Scholar] [CrossRef]
- Official Methods of Analysis, 22nd Edition. 2023. Available online: https://www.aoac.org/official-methods-of-analysis/ (accessed on 14 January 2025).
- Van Soest, P.J.; Robertson, J.B.; Lewis, B.A. Methods for dietary fiber, neutral detergent fiber, and nonstarch polysaccharides in relation to animal nutrition. J. Dairy Sci. 1991, 74, 3583–3597. [Google Scholar] [CrossRef]
- Nutrient Requirements of Dairy Cattle: Seventh Revised Edition, 2001; National Academies Press: Washington, DC, USA, 2001; ISBN 978-0-309-06997-7.
- Bronkema, S.M.; Rowntree, J.E.; Jain, R.; Schweihofer, J.P.; Bitler, C.A.; Fenton, J.I. A nutritional survey of commercially available grass-finished beef. Meat Muscle Biol. 2019, 3, 116. [Google Scholar] [CrossRef]
- Jenkins, T.C. Lipid metabolism in the rumen. J. Dairy Sci. 1993, 76, 3851–3863. [Google Scholar] [CrossRef]
- Kramer, J.K.G.; Hernandez, M.; Cruz-Hernandez, C.; Kraft, J.; Dugan, M.E.R. Combining results of two GC separations partly achieves determination of all cis and trans 16:1, 18:1, 18:2 and 18:3 except cla isomers of milk fat as demonstrated using ag-ion SPE fractionation. Lipids 2008, 43, 259–273. [Google Scholar] [CrossRef]
- Nimalaratne, C.; Lopes-Lutz, D.; Schieber, A.; Wu, J. Free aromatic amino acids in egg yolk show antioxidant properties. Food Chem. 2011, 129, 155–161. [Google Scholar] [CrossRef]
- Chen, Y.-S.; Aluwi, N.A.; Saunders, S.R.; Ganjyal, G.M.; Medina-Meza, I.G. Metabolic fingerprinting unveils quinoa oil as a source of bioactive phytochemicals. Food Chem. 2019, 286, 592–599. [Google Scholar] [CrossRef]
- Biehler, E.; Mayer, F.; Hoffmann, L.; Krause, E.; Bohn, T. Comparison of 3 spectrophotometric methods for carotenoid determination in frequently consumed fruits and vegetables. J. Food Sci. 2010, 75, C55–C61. [Google Scholar] [CrossRef] [PubMed]
- Determinations of Total Carotenoids and Chlorophylls a and b of Leaf Extracts in Different Solvents|Biochemical Society Transactions|Portland Press. Available online: https://portlandpress.com/biochemsoctrans/article-abstract/11/5/591/57549/Determinations-of-total-carotenoids-and?redirectedFrom=fulltext (accessed on 27 March 2025).
- US Department of Commerce. N. New 1991–2020 Climate Normals. Available online: https://www.weather.gov/tbw/newnormals (accessed on 25 February 2025).
- Krusinski, L.; Maciel, I.C.d.F.; Sergin, S.; Goeden, T.; Ali, H.; Kesamneni, S.; Jambunathan, V.; Cassida, K.A.; Singh, S.; Medina-Meza, I.G.; et al. Evaluation of fatty acid and antioxidant variation in a complex pasture system as compared to standard cattle feed in the Great Lakes region. Front. Sustain. Food Syst. 2022, 6, 945080. [Google Scholar] [CrossRef]
- Kim, D.-H.; Lee, Y.-K.; Kim, S.-H.; Lee, K.-W. The impact of temperature and humidity on the performance and physiology of laying hens. Anim. Open Access J. 2020, 11, 56. [Google Scholar] [CrossRef]
- Chen, Y.; Yu, S.; Zhang, L.; Xiao, M.; An, L. Effects and mechanisms investigation of heat stress on egg yolk quality in Huaixiang chickens. Anim. Open Access J. 2023, 13, 3513. [Google Scholar] [CrossRef] [PubMed]
- Kim, D.-H.; Song, J.-Y.; Park, J.; Kwon, B.-Y.; Lee, K.-W. The effect of low temperature on laying performance and physiological stress responses in laying hens. Anim. Open Access J. 2023, 13, 3824. [Google Scholar] [CrossRef]
- National Research Council. Subcommittee on Environmental Stress. In Effect of Environment on Nutrient Requirements of Domestic Animals; National Academies Press: Washington, DC, USA, 1981. [Google Scholar]
- Allahverdi, A.; Feizi, A.; Takhtfooladi, H.; Nikpiran, H. Effects of heat stress on acid-base imbalance, plasma calcium concentration, egg production and egg quality in commercial layers. Glob. Vet. 2013, 10, 203–207. [Google Scholar] [CrossRef]
- Ebeid, T.A.; Suzuki, T.; Sugiyama, T. High ambient temperature influences eggshell quality and calbindin-d28k localization of eggshell gland and all intestinal segments of laying hens. Poult. Sci. 2012, 91, 2282–2287. [Google Scholar] [CrossRef]
- Niu, Y.; Zhang, Q.; Wang, J.; Li, Y.; Wang, X.; Bao, Y. Vitamin E synthesis and response in plants. Front. Plant Sci. 2022, 13, 994058. [Google Scholar] [CrossRef]
- Mathur, S.; Agrawal, D.; Jajoo, A. Photosynthesis: Response to high temperature stress. J. Photochem. Photobiol. B 2014, 137, 116–126. [Google Scholar] [CrossRef]
- Alig, B.N.; Malheiros, R.D.; Anderson, K.E. Evaluation of physical egg quality parameters of commercial brown laying hens housed in five production systems. Anim. Open Access J. 2023, 13, 716. [Google Scholar] [CrossRef]
- Tůmová, E.; Gous, R.M. Interaction of hen production type, age, and temperature on laying pattern and egg quality. Poult. Sci. 2012, 91, 1269–1275. [Google Scholar] [CrossRef] [PubMed]
- Dewangan, S.K.; Shrivastava, S.; Kumari, L.; Minj, P.; Kumari, J.; Sahu, R. The effects of soil ph on soil health and environmental sustainability: A review. JETIR 2023, 10, 611–616. [Google Scholar]
- Xia, Y.; Feng, J.; Zhang, H.; Xiong, D.; Kong, L.; Seviour, R.; Kong, Y. Effects of soil ph on the growth, soil nutrient composition, and rhizosphere microbiome of Ageratina adenophora. PeerJ 2024, 12, e17231. [Google Scholar] [CrossRef] [PubMed]
- Maharjan, B.; Das, S.; Nielsen, R.; Hergert, G.W. Maize yields from manure and mineral fertilizers in the 100-year-old knorr–holden plot. Agron. J. 2021, 113, 5383–5397. [Google Scholar] [CrossRef]
- Berkhoff, J.; Alvarado-Gilis, C.; Keim, J.P.; Alcalde, J.A.; Vargas-Bello-Pérez, E.; Gandarillas, M. Consumer preferences and sensory characteristics of eggs from family farms. Poult. Sci. 2020, 99, 6239–6246. [Google Scholar] [CrossRef]
- Ortiz, D.; Lawson, T.; Jarrett, R.; Ring, A.; Scoles, K.L.; Hoverman, L.; Rocheford, E.; Karcher, D.M.; Rocheford, T. Biofortified orange corn increases xanthophyll density and yolk pigmentation in egg yolks from laying hens. Poult. Sci. 2021, 100, 101117. [Google Scholar] [CrossRef]
- Van Den Brand, H.; Parmentier, H.K.; Kemp, B. Effects of housing system (outdoor vs cages) and age of laying hens on egg characteristics. Br. Poult. Sci. 2004, 45, 745–752. [Google Scholar] [CrossRef]
- Nimalaratne, C.; Wu, J. Hen egg as an antioxidant food commodity: A review. Nutrients 2015, 7, 8274–8293. [Google Scholar] [CrossRef]
- Martínez-Sánchez, V.; Pérez-Gálvez, A. Chapter 12—Microalgal Carotenoids for Food and Feed Applications. In Handbook of Food and Feed from Microalgae; Jacob-Lopes, E., Queiroz, M.I., Maroneze, M.M., Zepka, L.Q., Eds.; Academic Press: Cambridge, MA, USA, 2023; pp. 133–145. ISBN 978-0-323-99196-4. [Google Scholar]
- Mendonça, C.X.; Almeida, C.R.M.; Mori, A.V.; Watanabe, C. Effect of dietary vitamin A on egg yolk retinol and tocopherol levels. J. Appl. Poult. Res. 2002, 11, 373–378. [Google Scholar] [CrossRef]
- Frigg, M.; Broz, J. Relationships between vitamin A and vitamin E in the chick. Int. J. Vitam. Nutr. Res. Int. Z. Vitam.-Ernahrungsforschung J. Int. Vitaminol. Nutr. 1984, 54, 125–133. [Google Scholar]
- Sklan, D.; Donoghue, S. Vitamin e response to high dietary vitamin A in the chick. J. Nutr. 1982, 112, 759–765. [Google Scholar] [CrossRef] [PubMed]
- Iqbal, Y.; Ponnampalam, E.N.; Cottrell, J.J.; Suleria, H.A.R.; Dunshea, F.R. Extraction and characterization of polyphenols from non-conventional edible plants and their antioxidant activities. Food Res. Int. 2022, 157, 111205. [Google Scholar] [CrossRef] [PubMed]
- Gonzalez-Becerra, K.; Barron-Cabrera, E.; Muñoz-Valle, J.F.; Torres-Castillo, N.; Rivera-Valdes, J.J.; Rodriguez-Echevarria, R.; Martinez-Lopez, E. A balanced dietary ratio of n-6:n-3 polyunsaturated fatty acids exerts an effect on total fatty acid profile in RBCs and inflammatory markers in subjects with obesity. Healthcare 2023, 11, 2333. [Google Scholar] [CrossRef]
- Simopoulos, A.P. The importance of the ratio of omega-6/omega-3 essential fatty acids. Biomed. Pharmacother. Biomed. Pharmacother. 2002, 56, 365–379. [Google Scholar] [CrossRef]
- Kop-Bozbay, C.; Akdag, A.; Bozkurt-Kiraz, A.; Gore, M.; Kurt, O.; Ocak, N. Laying performance, egg quality characteristics, and egg yolk fatty acids profile in layer hens housed with free access to chicory- and/or white clover-vegetated or non-vegetated areas. Anim. Open Access J. 2021, 11, 1708. [Google Scholar] [CrossRef]


| Guaranteed Analysis | |
|---|---|
| Crude Protein (Min) | 16.00% |
| Lysine (Min) | 0.85% |
| Methionine (Min) | 0.35% |
| Crude Fat (Min) | 3.50% |
| Crude Fiber (Max) | 9.00% |
| Calcium (Min) | 3.25% |
| Calcium (Max) | 3.75% |
| Phosphorus (Min) | 0.70% |
| Salt (Min) | 0.25% |
| Salt (Max) | 0.75% |
| Selenium (Min) | 0.3 ppm |
| Vitamin A (Min) | 4000 IU/lb |
| Vitamin D3 (Min) | 1500 IU/lb |
| Parameter | Sept | Oct | Nov | Dec | p-Value 2 |
|---|---|---|---|---|---|
| Egg weight (g) | 53.39 ± 6.69 b 1 | 57.73 ± 6.70 a | 60.38 ± 4.94 a | 57.31 ± 4.24 ab | <0.001 |
| Shell weight (g) | 5.28 ± 0.79 c | 5.45 ± 0.82 bc | 5.93 ± 0.41 ab | 6.12 ± 0.49 a | <0.001 |
| Yolk weight (g) | 12.02 ± 1.88 c | 13.15 ± 1.65 bc | 13.88 ± 1.22 ab | 14.73 ± 1.09 a | <0.001 |
| Dried yolk weight (g) | 6.10 ± 0.99 b | 6.71 ± 0.93 ab | 7.11 ± 0.69 a | 7.31 ± 0.61 a | <0.001 |
| Albumin weight (g) | 36.10 ± 4.71 b | 39.13 ± 4.92 ab | 40.57 ± 3.99 a | 36.46 ± 3.26 b | <0.001 |
| Albumin height (μm) | 7.04 ± 1.44 ab | 7.73 ± 1.13 a | 6.63 ± 1.09 b | 5.55 ± 0.99 c | <0.001 |
| Haugh unit | 85.07 ± 9.43 ab | 88.29 ± 6.51 a | 80.56 ± 7.65 b | 73.81 ± 7.34 c | <0.001 |
| Yolk color fan 3 | 7.33 ± 1.88 b | 8.38 ± 2.80 ab | 8.79 ± 0.88 a | 9.54 ± 1.38 a | 0.001 |
| Colorimeter 4 (L) | 68.86 ± 2.98 a | 66.07 ± 3.94 b | 67.68 ± 1.21 ab | 65.78 ± 2.35 b | <0.001 |
| Colorimeter (a) | 14.58 ± 5.02 b | 17.74 ± 6.33 ab | 18.20 ± 1.56 a | 17.34 ± 3.33 ab | 0.026 |
| Colorimeter (b) | 60.57 ± 3.78 b | 69.83 ± 4.75 a | 61.46 ± 3.69 b | 59.52 ± 4.10 b | <0.001 |
| Parameter | Sept | Oct | Nov | Dec | p-Value 2 |
|---|---|---|---|---|---|
| Egg weight (g) | 57.71 ± 3.43 b 1 | 57.45 ± 12.11 b | 63.9 ± 7.01 a | 65.68 ± 6.26 a | 0.001 |
| Shell weight (g) | 5.16 ± 0.60 b | 5.4 ± 0.68 ab | 5.70 ± 0.70 a | 5.65 ± 80 ab | 0.018 |
| Yolk weight (g) | 13.83 ± 1.44 c | 15.45 ± 2.21 b | 16.1 ± 1.77 ab | 17.14 ± 1.89 a | <0.001 |
| Dried yolk weight (g) | 7.00 ± 0.79 c | 7.70 ± 1.15 bc | 8.24 ± 0.87 ab | 8.60 ± 1.02 a | <0.001 |
| Albumin weight (g) | 38.72 ± 2.92 ab | 36.63 ± 11.78 b | 42.1 ± 5.67 a | 41.88 ± 4.38 ab | 0.023 |
| Albumin height (μm) | 6.24 ± 0.91 b | 5.9 ± 1.31 b | 7.31 ± 1.51 a | 5.79 ± 0.89 b | <0.001 |
| Haugh unit | 78.91 ± 6.47 ab | 76.32 ± 10.91 b | 83.47 ± 10.15 a | 73.02 ± 7.41 b | 0.001 |
| Yolk color fan 3 | 3.92 ± 1.64 a | 3.54 ± 2.13 a | 4.13 ± 2.47 a | 4.00 ± 1.62 a | 0.768 |
| Colorimeter 4 (L) | 71.94 ± 2.98 a | 71.57 ± 2.21 a | 67.21± 4.51 b | 71.52 ± 2.63 a | <0.001 |
| Colorimeter (a) | 9.63 ± 3.73 a | 6.94 ± 3.57 b | 9.98 ± 4.17 a | 6.88 ± 2.59 b | 0.002 |
| Colorimeter (b) | 54.07 ± 5.92 a | 49.52 ± 8.36 a | 50.49 ± 7.23 a | 52.34 ± 5.85 a | 0.113 |
Disclaimer/Publisher’s Note: The statements, opinions and data contained in all publications are solely those of the individual author(s) and contributor(s) and not of MDPI and/or the editor(s). MDPI and/or the editor(s) disclaim responsibility for any injury to people or property resulting from any ideas, methods, instructions or products referred to in the content. |
© 2025 by the authors. Licensee MDPI, Basel, Switzerland. This article is an open access article distributed under the terms and conditions of the Creative Commons Attribution (CC BY) license (https://creativecommons.org/licenses/by/4.0/).
Share and Cite
Adams, J.; Van Duinen, R.; Sergin, S.; Bitler, C.A.; Fenton, J.I. Geographical Variations in Egg Nutrient Density: A Comparative Study of Sustainable Layer Hen Systems in Ohio and Indiana in Late Fall and Early Winter Months. Sustainability 2025, 17, 3208. https://doi.org/10.3390/su17073208
Adams J, Van Duinen R, Sergin S, Bitler CA, Fenton JI. Geographical Variations in Egg Nutrient Density: A Comparative Study of Sustainable Layer Hen Systems in Ohio and Indiana in Late Fall and Early Winter Months. Sustainability. 2025; 17(7):3208. https://doi.org/10.3390/su17073208
Chicago/Turabian StyleAdams, Julianna, Rachel Van Duinen, Selin Sergin, Chad A. Bitler, and Jenifer I. Fenton. 2025. "Geographical Variations in Egg Nutrient Density: A Comparative Study of Sustainable Layer Hen Systems in Ohio and Indiana in Late Fall and Early Winter Months" Sustainability 17, no. 7: 3208. https://doi.org/10.3390/su17073208
APA StyleAdams, J., Van Duinen, R., Sergin, S., Bitler, C. A., & Fenton, J. I. (2025). Geographical Variations in Egg Nutrient Density: A Comparative Study of Sustainable Layer Hen Systems in Ohio and Indiana in Late Fall and Early Winter Months. Sustainability, 17(7), 3208. https://doi.org/10.3390/su17073208