Article

New Energy Demonstration City Policy and Corporate Green Innovation: From the Perspective of Industrial and Regional Spillover Effect

1
School of Finance and Economics, Jiangsu University, Zhenjiang 212013, China
2
School of Management, Jiangsu University, Zhenjiang 212013, China
3
Department of Human Resource and Business Strategy, Akenten Appiah-Menka University of Skills Training and Entrepreneurial Development, Kumasi 45703, Ghana
*
Author to whom correspondence should be addressed.
Sustainability 2025, 17(7), 3179; https://doi.org/10.3390/su17073179
Submission received: 3 March 2025 / Revised: 29 March 2025 / Accepted: 31 March 2025 / Published: 3 April 2025

Abstract

:
The new energy transition creates favorable opportunities for popularizing green technologies, while the new energy demonstration city (NEDC) policy provides pivotal platforms for propelling China’s energy transition. Using panel data for listed companies in China, this study ascertains the impact of the NEDC policy on green innovation. The results indicate that the NEDC policy has a positive effect on fostering corporate green innovation. The beneficial impact of the policy is primarily attributed to heightened R&D investment, enhanced human capital, and the mitigation of financial constraints. The NEDC policy exerts a more pronounced influence on green innovation for non-state-owned enterprises, high-energy-consuming enterprises, and those located in the mid-west or in non-resource-based cities. Further, the NEDC policy exhibits negative spillover effects across regions, but positive spillover effects within industries. The regional spillover effects exhibit heterogeneity, with inhibitory effects being more significant in the eastern regions and non-resource-based cities.

1. Introduction

For decades, China’s rapid economic expansion has been predominantly fueled by intensive factor inputs and resource-driven growth patterns. This extensive development model, characterized by high energy consumption and environmental costs, has impeded the sustainable transformation of China’s economy. As the Chinese economy transitions into a new era of high-quality development, green innovation (GI) has emerged as a critical strategic pillar as the combination of ecological civilization construction and innovation-driven development, driving the shift towards a more sustainable, resource-efficient, and environmentally friendly growth paradigm. However, GI faces two realistic challenges: on the one hand, it demands a longer period for research and development, as well as facing uncertain risks and returns. Market entities are therefore less interested in high-risk green innovation [1]. On the other hand, green technology R&D requires a large amount of capital and confronts strong financing constraints, which is unfavorable to the emergence of GI [2]. Thus, for innovation entities, the key to improving GI lies in addressing both the “motivation” and “capital” issues simultaneously.
Against the backdrop of green and sustainable development, renewable energy has garnered widespread attention due to its dual advantages of environmental sustainability and infinite renewability. The United Nations Sustainable Development Goals explicitly call for ensuring access to affordable, reliable, sustainable, and modern energy. These international commitments underscore the global consensus on clean energy as a fundamental driver for achieving sustainable development and addressing environmental challenges. As a major energy producer and consumer, China initiated the construction of the New Energy Demonstration City (NEDC) in 2014 to advance its sustainable development. Since the establishment of the NEDC project, it has received scholarly attention with much focus on regional pollution reduction, green economic growth, and energy utilization. The NEDC policy improves environmental quality and low-carbon development, which is reflected in the significant suppression of industrial sulfur dioxide, wastewater [3,4], and carbon dioxide emissions [5,6]. It also benefits economic development [7,8]. Additionally, the policy is conducive to energy efficiency [9,10] and energy structure transformation [11,12,13].
The NEDC project can be considered as a combination of a series of environmental regulations and offers new solutions to deal with the challenges of GI. Appropriate environmental regulations can produce an “innovation compensation” effect, promoting the occurrence of GI behaviors [14]. Several studies have explored the impact of the NEDC policy on GI and its underlying mechanisms. Song et al. found that the NEDC policy has incited an upgrading of the local urban industrial structure, subsequently boosting corporate GI [15]. By promoting cutting-edge R&D, nurturing innovation-friendly industrial conditions, and improving environmental outcomes, the NEDC policy significantly elevates urban green technological innovation capabilities [16]. Chen et al. revealed that the NEDC policy promotes urban GI efficiency by optimizing industrial structure, reducing resource dependence, and gathering innovative elements [17]. Zhang et al. demonstrated that the NEDC policy fosters GI by easing financing constraints, incentivizing innovation efforts, and shaping a favorable market landscape [18].
Nevertheless, the NEDC policy’s potential spillovers have been the subject of limited research. There has been less focus on how the NEDC policy influences individual firms, nor has the policy’s cross-regional and cross-sectoral spillover effects been systematically verified. Such spillover effects may materialize as either demonstration effects [19,20] or siphon effects [21,22]. The development dividends gained by policy-implementing areas may generate knowledge and technology spillovers in adjacent areas through inter-regional interactions and economic linkages. Conversely, the superior developmental ecosystems of these policy hubs may trigger resource convergence—drawing capital, talent, and infrastructure investments from peripheral regions—thereby exacerbating inter-regional inequalities. Wang et al. clarify that the policy not only successfully diminishes local carbon emissions, but also shows notable spillover effects, contributing to carbon reduction in adjacent cities [23]. Yang et al. also find that the NEDC policy has produced positive spatial spillover effects, promoting energy transformation in neighboring cities [24].
To this end, the Chinese A-share listed companies are investigated with a focus on looking at the influence of the NEDC policy on corporate GI. This paper endeavors to address the following inquiries: (1) What is the impact of NEDC policy on enterprise green technology innovation? (2) Through what channels does the NEDC policy influence the GI of micro-enterprises? (3) Does the impact of the policy on GI vary according to the characteristics of the enterprises and their external environment? (4) Does the NEDC policy exert spillover effects at both the regional and industrial levels? This paper includes the following marginal contributions: Firstly, the subjects of GI are micro-enterprises. The research used listed companies as samples to clarify the role of macro policies on micro-entities, filling the gap in previous research that predominantly focused on the NEDC policy’s economic growth and environmental improvement from a macro perspective. Secondly, with the NEDC policy falling to the ground, diverse market participants pour into the new energy sector, thereby enriching green innovation elements for enterprises. This paper proposes a theoretical framework for analyzing the underlying mechanism. Investment-driving, talent-supporting, and capital-pulling represent the proposed framework. Finally, the NEDC policy may influence the allocation of production factors, including capital, labor, and technology, resulting in resource redistribution. We further probed whether the NEDC policy generates a demonstration or siphon effect at the regional and industrial level and whether this impact varies in the same way.
The organization of the remaining sections is as follows: Section 2 presents a literature review and outlines theoretical mechanisms; Section 3 details methodologies and data; Section 4 discusses benchmark regression results, robustness testing, and heterogeneity analysis; Section 5 verifies transmission channels and spillover effects; and Section 6 offers conclusions and recommendations.

2. Policy Background and Theoretical Analysis

2.1. Policy Background

Designated as experimental hubs for novel policy, demonstration cities constitute a cornerstone of China’s adaptive governance framework, characterized by decentralized policy experimentation. Under this mechanism, the central government selectively delegates authority to a limited number of municipalities to experiment with policies prior to nationwide implementation. The purposes are to evaluate the feasibility and acceptability of policy objectives and identify optimal implementation instruments and institutional pathways. Pilot policies streamline consensus-building processes that typically accompany agenda-setting, while simultaneously mitigating institutional adaptation costs and systemic risks inherent in abrupt large-scale policy deployment.
In a strategic move to accelerate the transformation of energy production and consumption patterns, China launched the New Energy Demonstration Cities (NEDC) program in 2014. This initiative was designed to serve as a comprehensive platform for integrating renewable energy development with sustainable urban planning. Eighty-one cities are designated as pilot zones for pioneering urban new energy utilization. These cities are tasked with operationalizing renewable energy strategies at scale, embedding clean energy technologies into urban infrastructure and governance. By establishing these demonstration zones, China is poised to foster technological innovation in clean energy and elevate the share of renewable energy in urban energy consumption.

2.2. Theoretical Analysis and Hypothesis

The new energy demand shock, financial incentives, and industrial agglomeration generated by the NEDC policy have positive externalities on GI.GI is highly uncertain and complex and companies must speculate on expected demand, and complementary investments from upstream and downstream partners or competitors to determine their own innovation strategies. The expansion of clean energy markets reduces this uncertainty [25]. Tax exemptions and investments in renewable energy also lead to more green technology patent applications [26]. Moreover, the agglomeration of new energy industries promotes the formation of GI achievement trading and innovation risk-sharing mechanisms among enterprises, creates efficient resource supply-demand matching to reduce search costs for innovative resources, and facilitates the dissemination of cutting-edge green technologies and knowledge accumulated [27]. GI is also contingent on firm-specific characteristics and locational contexts. For example, state-owned enterprises and non-state-owned enterprises differ markedly in R&D investment patterns owing to variations in ownership structure, operational priorities, and societal obligations. High-energy-consuming firms, constrained by substantial energy requirements and stringent regulatory pressures, may exhibit higher green innovation momentum compared to low-energy-intensity peers. And regional disparities in economic development and resource availability also compound green innovation inequalities. Therefore, we propose the following hypothesis:
Hypothesis 1.
The NEDC policy enhances corporate GI, and exhibits heterogeneous effects depending on firm characteristics and locational attributes.
The swift advancement of new energy industries largely relies on substantial R&D investments, which maintain an intimate and reciprocal relationship with technological innovation [26]. Companies in pilot cities are inclined to boost their R&D investments to achieve long-term benefits and harvest new energy development dividends based on the assumption that “technology will not be forgotten” and cost-benefit analysis [28]. The conspicuous preferences from governments, combined with the nascent development of new energy industries, bolster enterprises’ internal motivation to pursue green innovation endeavors [29,30]. Accordingly, we propose the following hypothesis:
Hypothesis 2.
The NEDC policy promotes corporate GI by increasing R&D investment.
Human capital is the core resource for enterprises, determining the technology and knowledge absorption capability. More talents provide impetus for the generation of innovative ideas and the growth of innovation efficiency. The spatial agglomeration of new energy industries breaks down barriers to talent mobility and forms a “reservoir” of high-skilled talents in pilot areas with comparative advantage. Such an arrangement accelerates the accumulation and reserve of human capital in enterprises and reduces their costs for personnel search and skill training. Through sustained collaboration and knowledge exchange, highly skilled professionals assimilate cutting-edge expertise and propagate innovative concepts, thereby catalyzing both original breakthroughs and systemic integration in green technology [31]. People with higher education levels also place greater emphasis on using clean energy instead of fossil energy to alleviate environmental pressure [32]. Hence, we propose the following hypothesis:
Hypothesis 3.
The NEDC policy promotes corporate GI by optimizing human capital.
Due to a lack of investment funds, corporate GI gets stagnant [33]. The NEDC policy enables enterprises to reduce risks and increase economic returns for GI through financial assistance, fiscal subsidies, and tax incentives [34,35]. The green orientation of the policy can arouse the enthusiasm of market entities by transmitting green signals to markets. This procedure alleviates information asymmetry and guides the flow of social funds to the new energy sector. The establishment and improvement of financing platforms suitable for distributing new energy further reinforces this role. According to the preceding discussion, we propose the following hypothesis:
Hypothesis 4.
The NEDC policy promotes corporate GI by alleviating financing constraints.
Location-oriented policies can produce spillover effects [36]. As an exogenous policy targeting specific regions, the NEDC policy will trigger cross-regional redistribution of production resources [37]. Labor and capital innovation factors typically shift from neighboring cities to policy-advantaged demonstration cities. Some enterprises may also relocate to demonstration cities to gain policy benefits. This resource concentration potentially hinders GI in peripheral cities, resulting in a siphon effect. Meanwhile, market competition motivates non-demonstration enterprises to emulate demonstration cities’ GI practices, ultimately elevating their innovation performance. This is known as the demonstration effect of NEDC policy.
Industry-level impacts emerge as intricate production linkages transmit policy shocks across economic sectors, reshaping micro-entities’ operational patterns [38]. Enterprises dynamically adjust GI strategies through dual channels: behavioral adaptations driven by peer influence within industrial networks, and knowledge diffusion via labor mobility and vertically coordinated supply chains. Non-demonstration enterprises progressively enhance GI capabilities through learning-by-doing approaches involving experiential refinement, technical assimilation, and collaborative knowledge exchange [39]. This technology spillover enhances the overall green innovation capability of the industry, which is called the peer effect and learning effect, respectively. See Figure 1 for details. Variations in firm ownership types, industry characteristics, and regional disparities may induce spatially and industrially asymmetric spillover effects of the NEDC policy. Based on the above analysis, we propose the following hypothesis:
Hypothesis 5.
The NEDC policy generates spillover effects across regions and industries, with their intensity varying due to differences in firm attributes and geographical contexts.

3. Research Design

3.1. Model Setting

Difference-in-Differences (DID) method is a quasi-experimental design commonly used to estimate causal effects by comparing changes over time between a treatment group (e.g., firms in NEDC) and a control group (e.g., firms in non-demonstration cities). The article demonstrates via the applied DID approach, the impact of the NEDC policy on corporate GI. The baseline regression model is constructed as follows:
G I i t = α + β N E D C i t + γ C O N T R O L i t + λ i + θ t + ε i t  
where i , t represents firms and years, respectively, G I i t is measured by green patents, N E D C i t represents the NEDC policy dummy variable, C O N T R O L i t represents a combination of control variables, λ i and θ t represent individual and time-fixed effects, ε i t represents the random error term. α is a constant term, β and γ represent the estimated parameters. β is the core efficiency we are concerned about. If β   is significantly positive, the NEDC policy is conducive to the GI of enterprises.
To delve deeper into the mechanisms by which the NEDC policy impacts corporate GI, the following mediation effect models are constructed:
M i t = α 0 + β 0 N E D C i t + γ 0 C O N T R O L i t + λ i + θ t + ε i t
where M i t denotes mediation variables, while the remaining variables retain their previous definitions. The Bootstrap approach is adopted to confirm the mediating effects.
We do not include businesses from pilot cities in our study. Instead, we use businesses from non-demonstration cities as research samples to see if their GI levels would go up because they are close to demonstration cities or work in the same industry as demonstration businesses. The regional spillover effects model is as follows:
G I i t = α + β 1 S P I L L O V E R i t + γ C O N T R O L i t + λ i + θ t + ε i t
The industrial spillover effects model is as follows:
G I i t = α + β 2 I N D R A T I O j t + γ C O N T R O L i t + λ i + θ t + ε i t
where G I i t represents green innovation levels of enterprise i in year i , encompassing overall green patents, green invention patents (GIP), and green utility model patents (GUP).   S P I L L O V E R i t is a regional spillover variable. When a city is adjacent to a demonstration city in an administrative division and after 2014, the S P I L L O V E R i t value of enterprises located within the city is set to 1, otherwise it is set to 0. I N D R A T I O j t is an industry spillover variable, where the I N D R A T I O j t value of a certain enterprise in industry j in year t is the ratio of the number of demonstration enterprises to the total number of enterprises in that industry. Others have the same meanings as in previous equations.

3.2. Variable Selection

3.2.1. Dependent Variable

So far, researchers have mostly used two methods to figure out GI: (1) the green innovation efficiency index, which is the ratio of green innovation output to its total input [40]; and (2) the number of green patents that are applied for, granted, or cited [41,42]. Referring to previous research [43,44], the natural logarithm of the number of green patent applications plus one is adopted as a proxy for corporate GI to circumvent the time lag of green patent grants caused by cumbersome application and approval procedures.

3.2.2. Core Explanatory Variable

The variable representing the NEDC policy is constructed using the interaction term of regional dummy and time dummy variables, that is, N E D C i t = t r e a t i × y e a r t . If a city is an NEDC, enterprises in that city take the value of 1, that is, t r e a t i = 1 , and vice versa, set to 0; y e a r t serves as a dummy variable for the implementation time of the NEDC policy, assigning a value of 1 for years 2014 and beyond, otherwise, the value is 0.

3.2.3. Mediation Variables

To explore the underlying mechanisms through which the NEDC policy affects corporate GI, this study focuses on three key mediating variables: corporate R&D investment, human capital, and financing constraints. These variables are selected to capture the essential pathways—technological advancement, workforce expertise, and financial accessibility—through which the policy may drive innovation outcomes.

3.2.4. Control Variables

Referring to the existing research [10,15], a series of control variables are included in the model to mitigate omitted variable bias, including firm size (size), cash asset ratio (cash), return on assets (roa), asset-liability ratio (lev), asset structure (asset), tobin’s Q value (tobin), operating capacity(revenue). All variable names, abbreviations, and definitions are summarized in Table 1.

3.3. Data Sources

The research sample consists of A-share listed companies in Shanghai and Shenzhen over the period from 2009 to 2020. Enterprise data are obtained from the National Intellectual Property Administration, the CSMAR database, the Wind database, and listed company annual reports. City data are sourced from the China City Statistical Yearbook. To guarantee the reliability of the study, the raw data are processed as follows: (1) Exclude continuously loss-making companies (i.e., ST, *ST, and PT companies). (2) Delete listed companies with severely missing data during the sample period. (3) Exclude companies in Beijing, Jiaxing, Jinan, Foshan, and Kunming, as these cities only set up pilots in one district. (4) Exclude all financial/insurance companies and service companies since GI activities mainly exist in manufacturing and other polluting industries. (5) Conduct linear interpolation for some missing values. Descriptive statistics are shown in Table 2.

4. Empirical Analysis

4.1. Baseline Results

Table 3 shows the regression results without control variables (Model 1) and with control variables added stepwise (Models 2–8). According to the result in Model 1, the coefficient for the NEDC term is 0.059 without any control variables and achieves statistical significance at the 5% level. After sequentially incorporating control variables, the coefficients associated with the NEDC term in Models 2–8 consistently remain statistically significant and positive at the 5% level. These suggest that the NEDC policy promotes corporate GI, and Hypothesis 1 is confirmed.

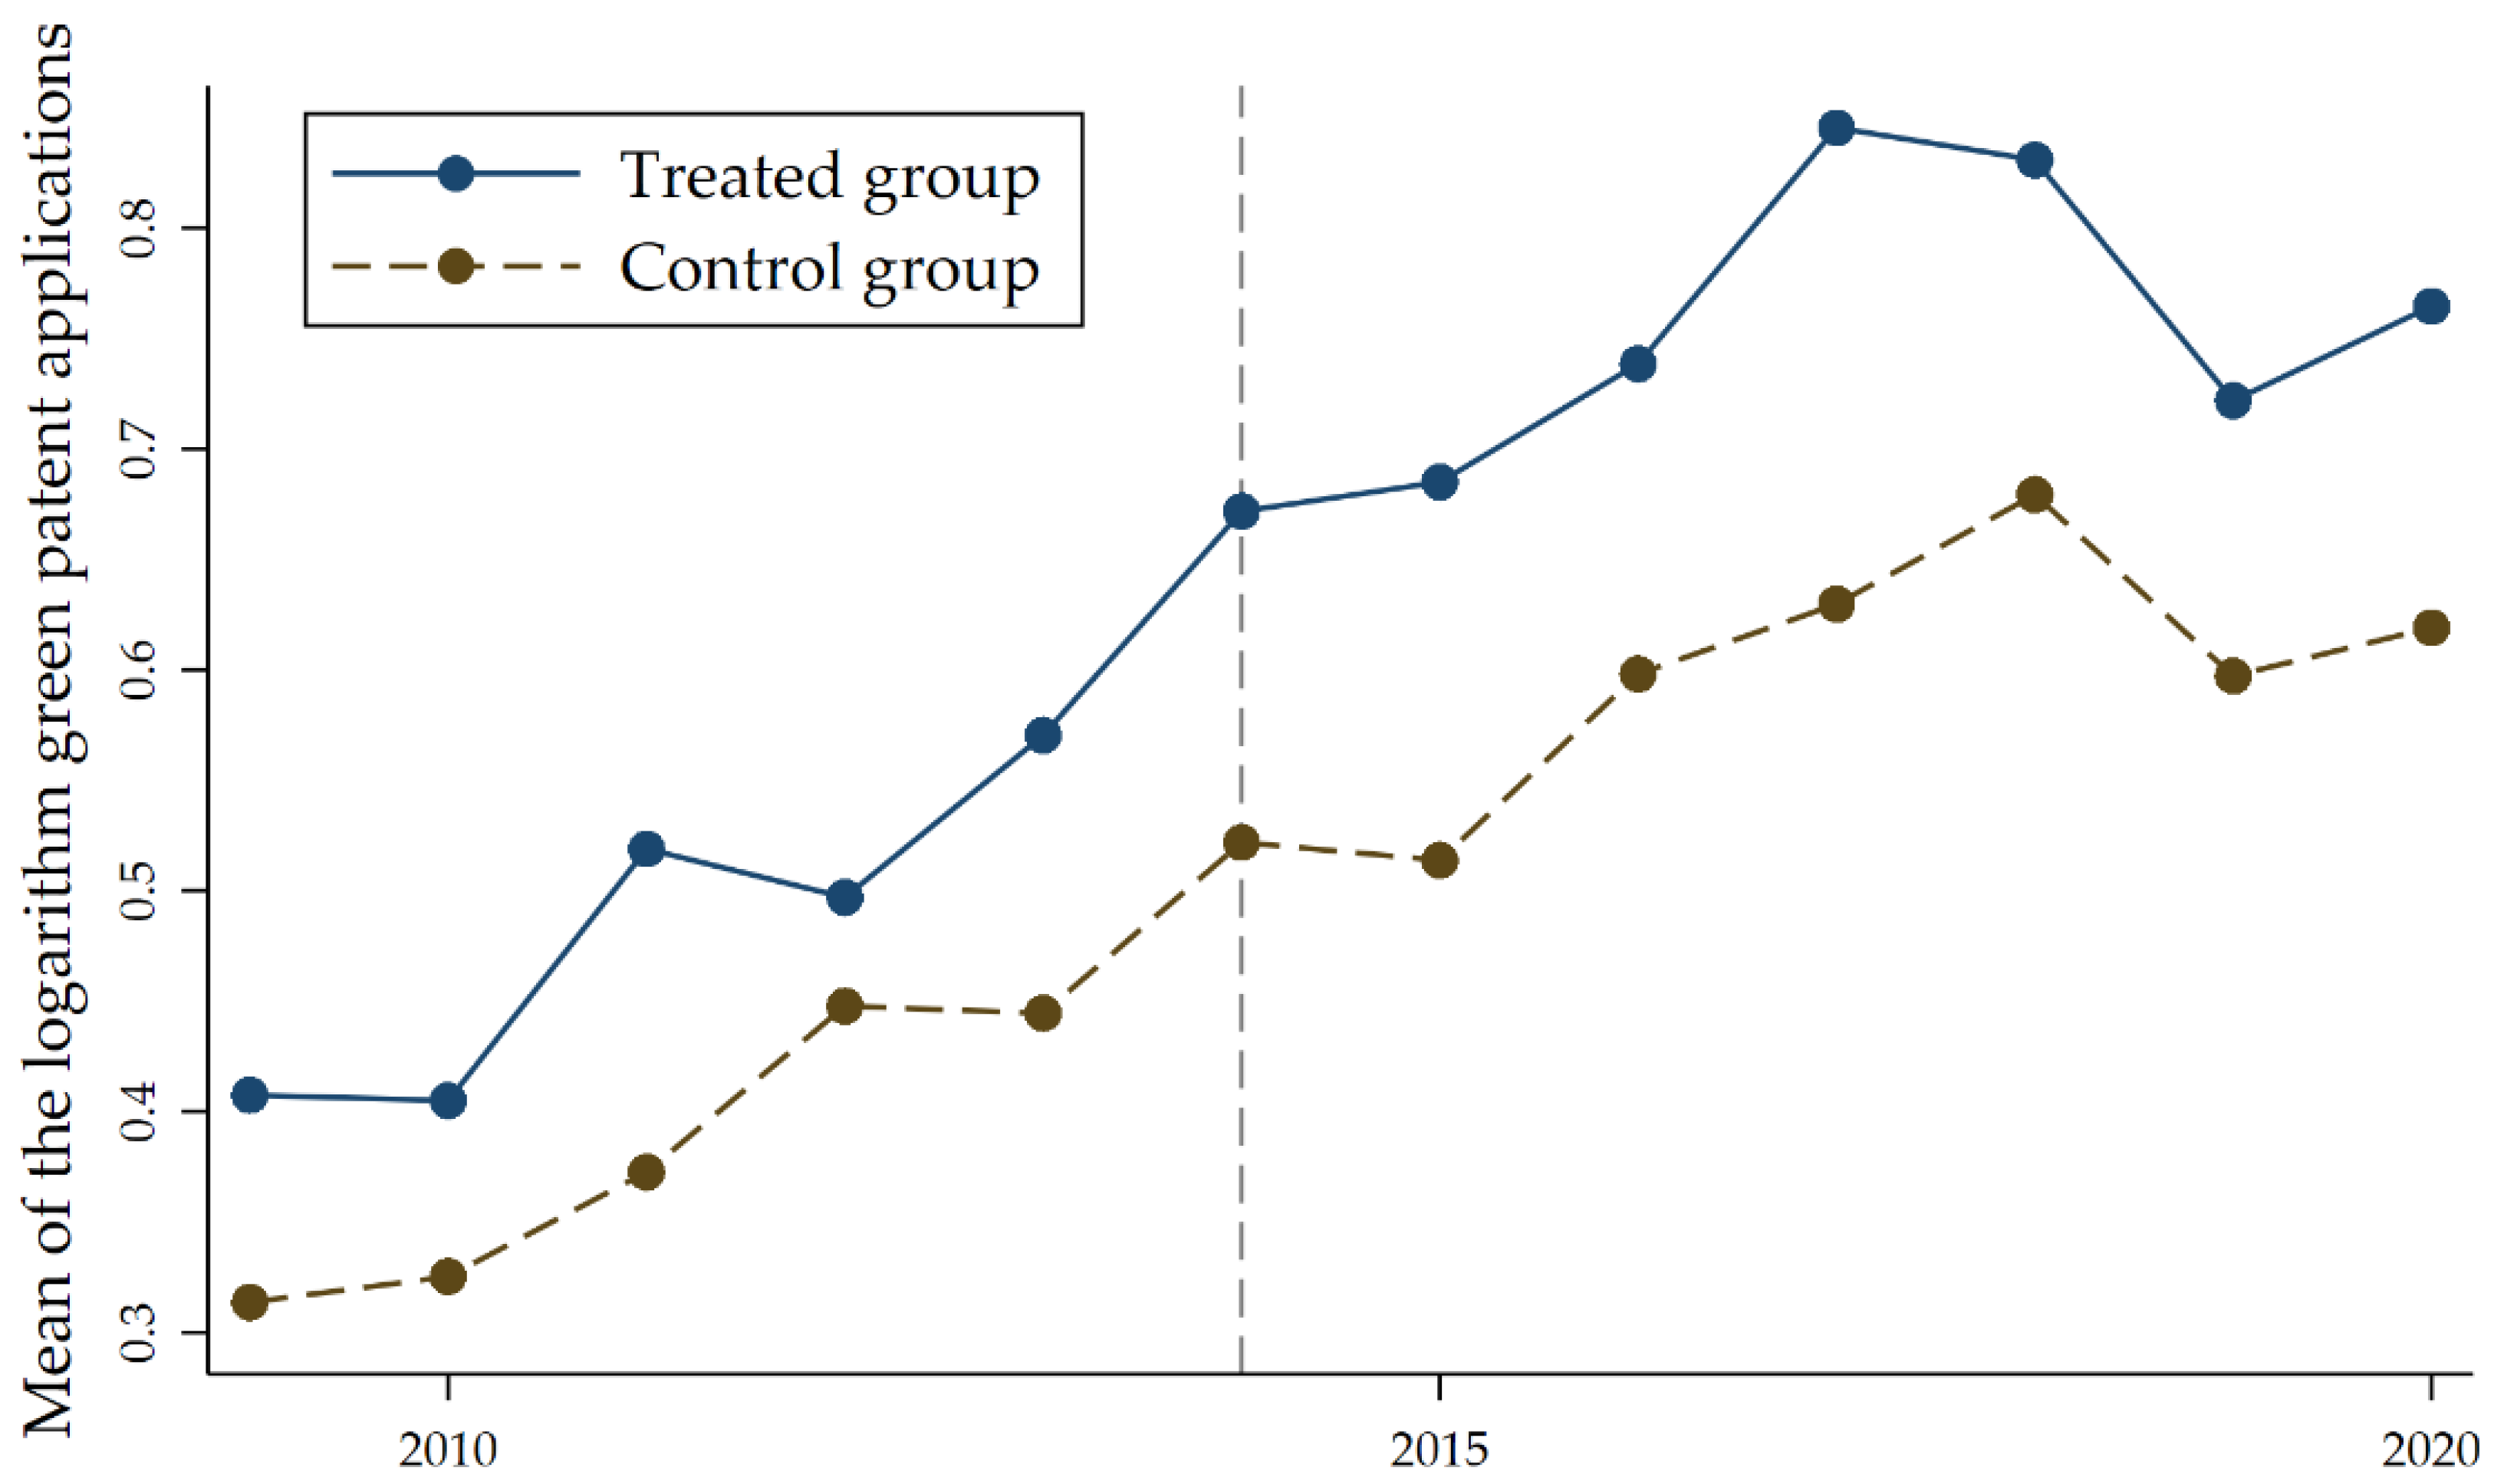
4.2. Parallel Trend Analysis

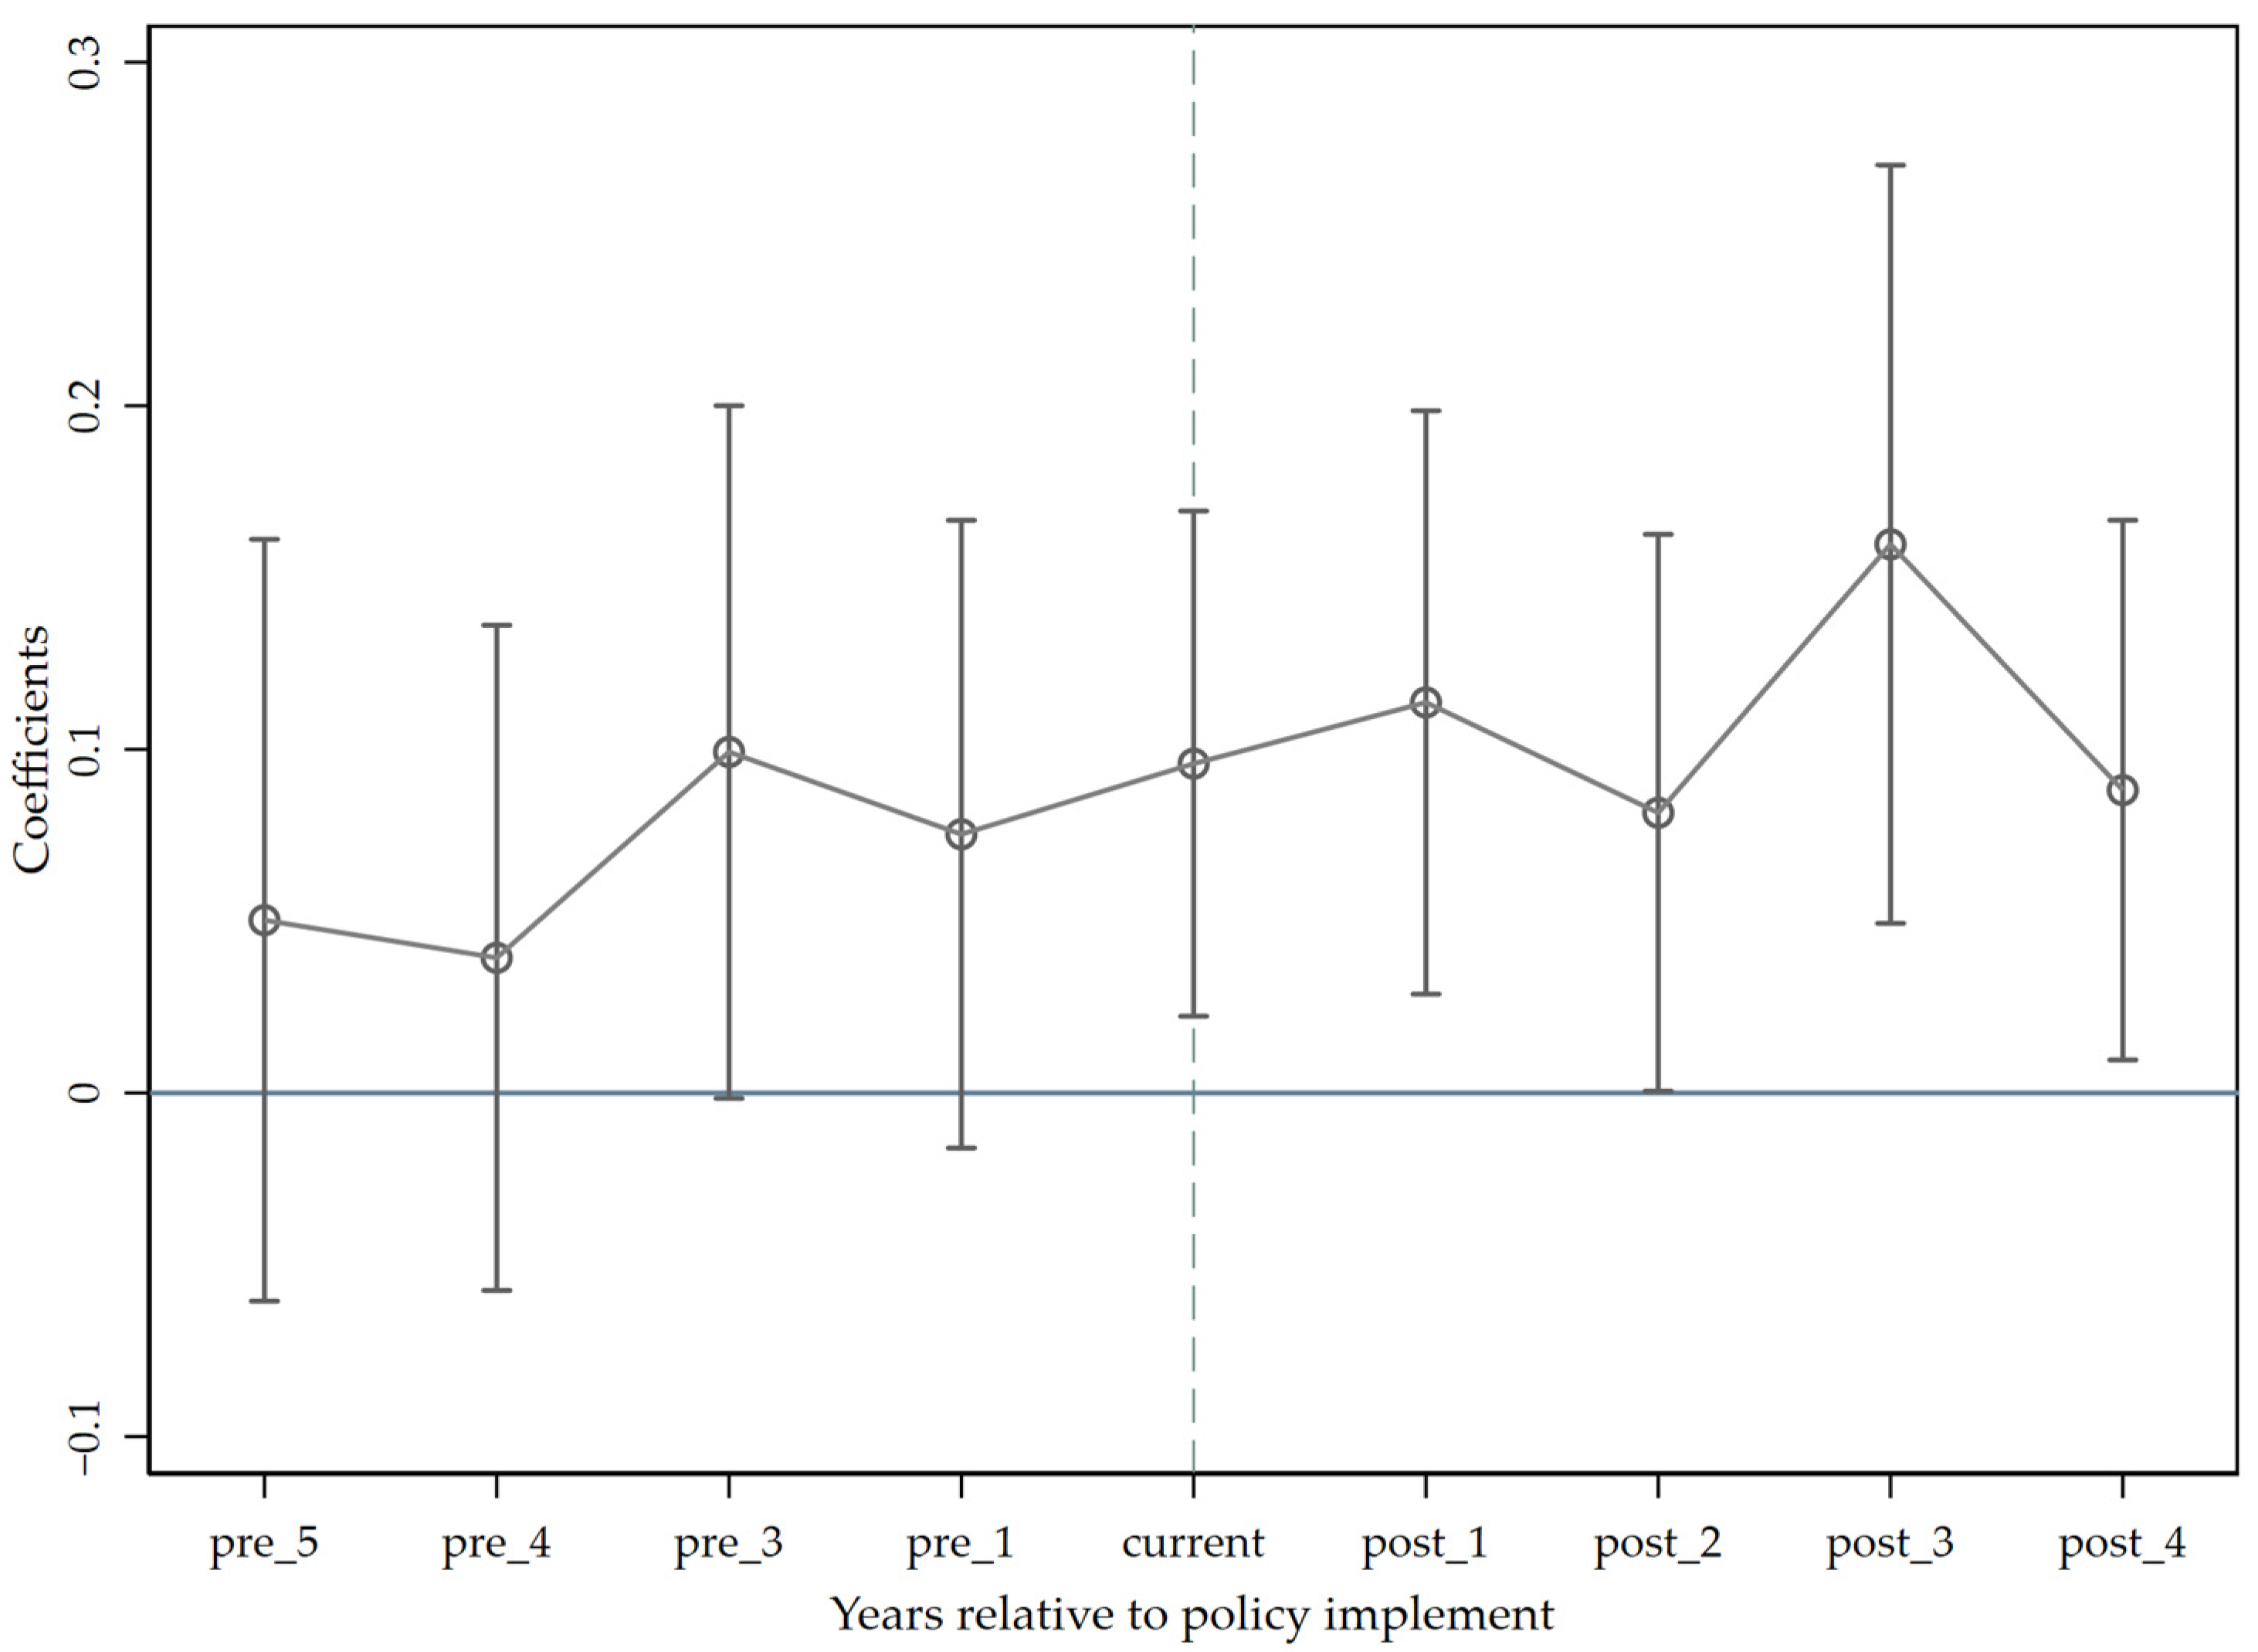
4.2.1. Parallel Trend Test

The DID model needs a parallel trend hypothesis to make sure that the estimates are correct. This means that businesses’ green patent applications in pilot and non-pilot cities should have the same growth trend if there are no policy shocks. As shown in Figure 2, prior to the policy implementation, enterprises’ green patent applications in demonstration cities were marginally greater than those in non-demonstration cities, with both trends roughly parallel. After policy implementation, the gap in green patent applications between enterprises in pilot and non-pilot cities expands.

4.2.2. Policy Dynamic Effects

Benchmark regressions provide insight into the average variation of outcome variables across the sample period, but they fail to capture the nuanced effects of policy interventions occurring at various time points. Taking the NEDC policy’s possible lag and dynamic continuity into account, we use the event study method from Deschênes et al. [45] to test the policy’s dynamic effects and come up with the following regression equation:
G I i t = α + t = 5 , t 2 4 β k N E D C i t k + γ C O N T R O L i t + λ i + θ t + ε i t
where N E D C i t k represents the NEDC policy dummy variable, setting k = year − 2014. When k = 0, it represents the year the policy was implemented, and when k takes negative (positive) values, it represents the years before (after) the policy implementation. βk is the regression coefficient in relation to the baseline year, reflecting the disparity between demonstration cities and non-demonstration cities in corresponding years. Other variables have the same meanings as in the previous equation. Using k = −2 as the baseline period for event analysis, this paper assesses the dynamic and enduring impacts of the NEDC policy by examining both the magnitude and statistical significance of βk over time.
Figure 3 clearly shows that the coefficients that existed before the NEDC policy was put into place are not statistically significant. This confirms that different businesses had similar numbers of green patent applications before the policy was put in place. By contrast, regression coefficients after 2014 are significantly positive.

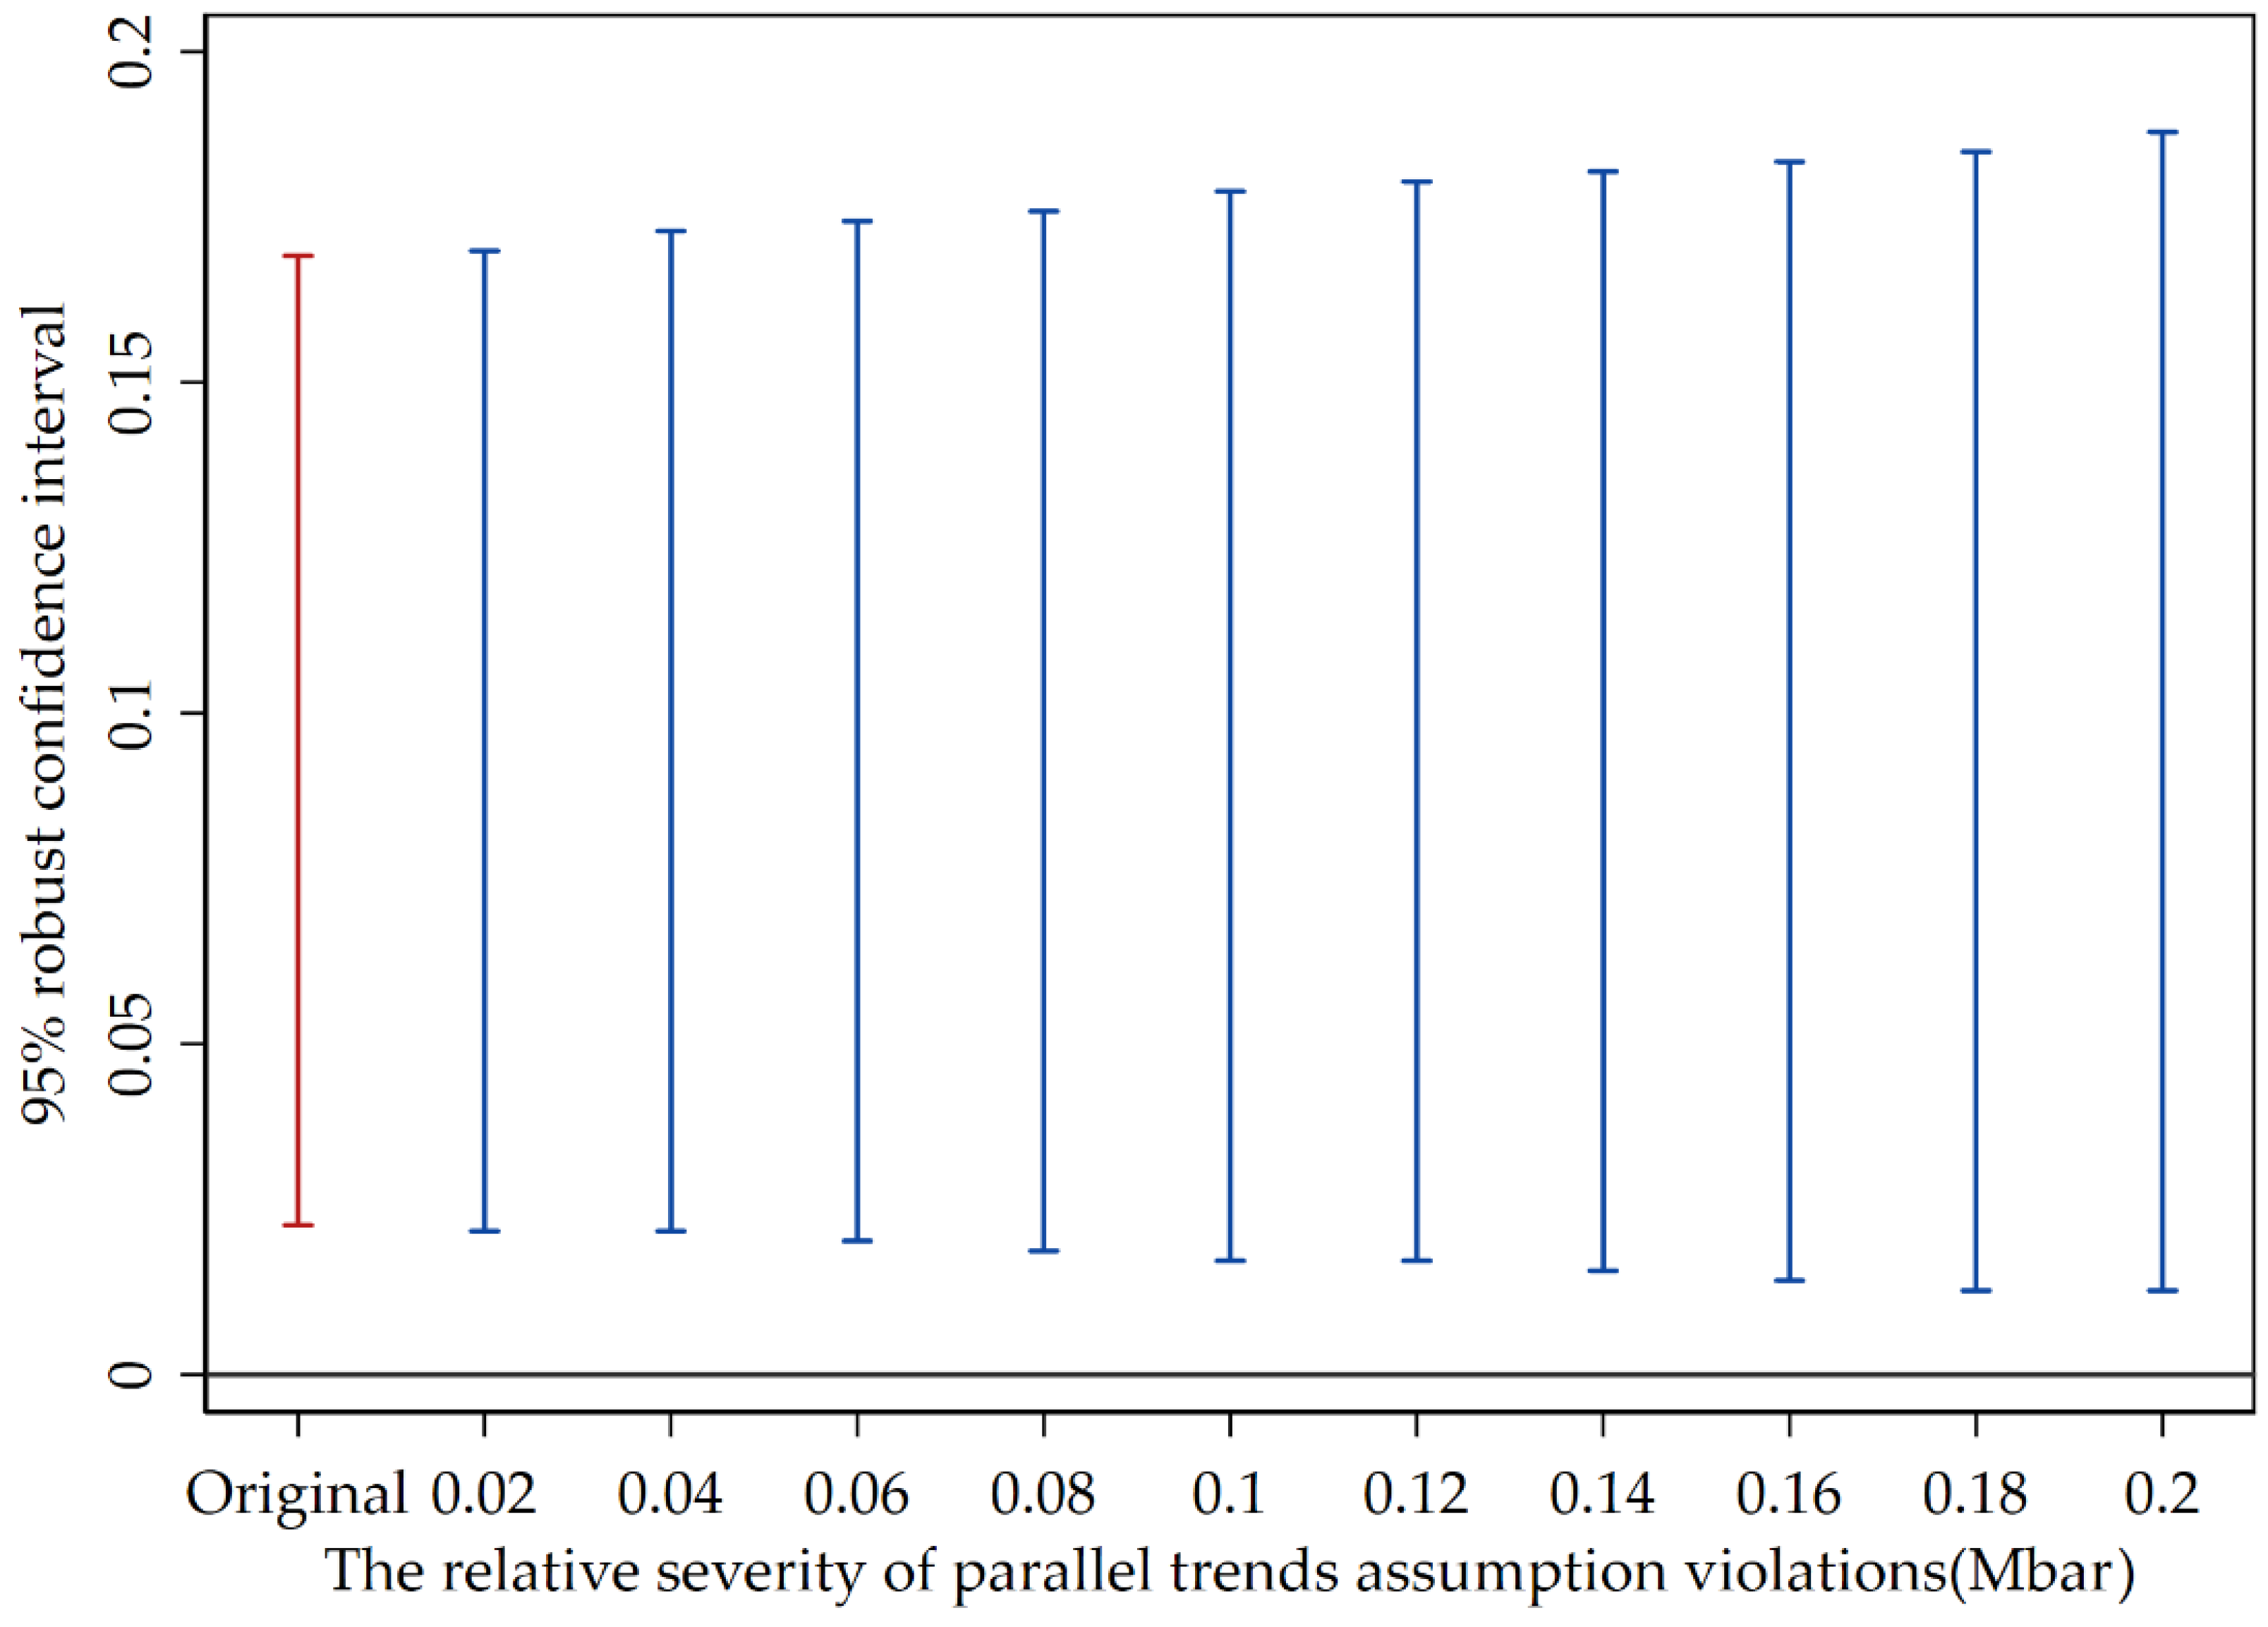
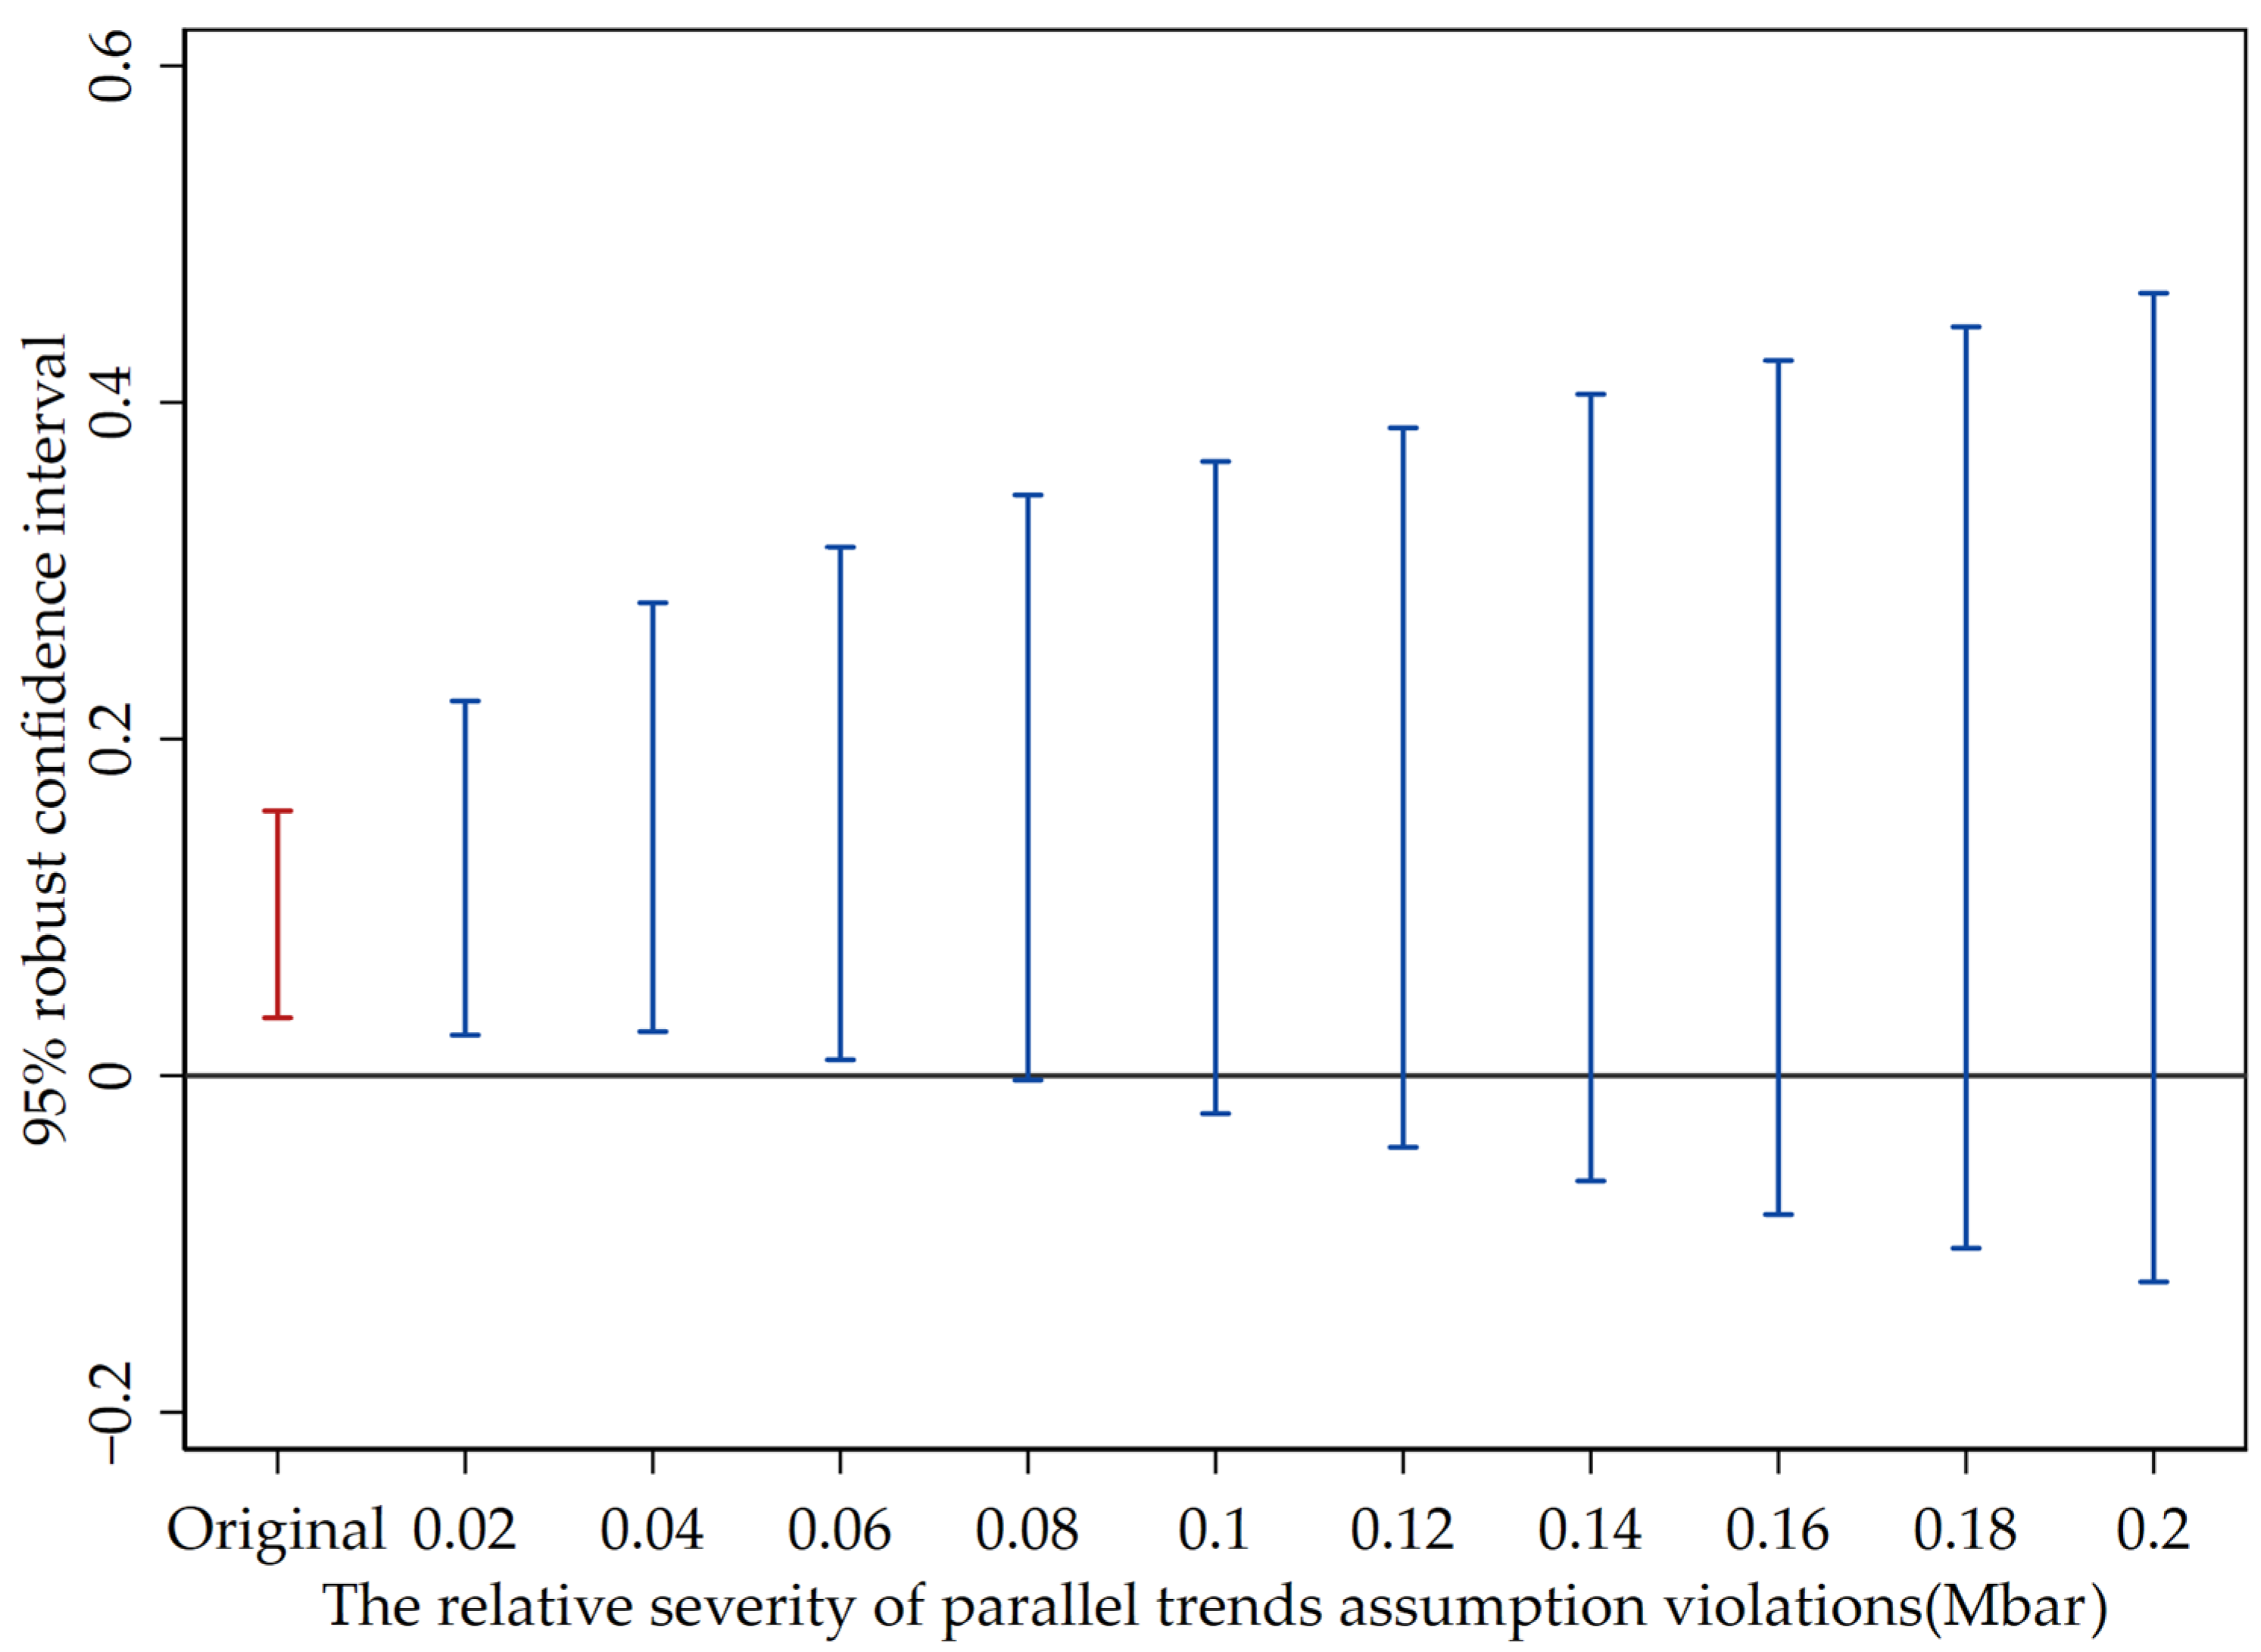
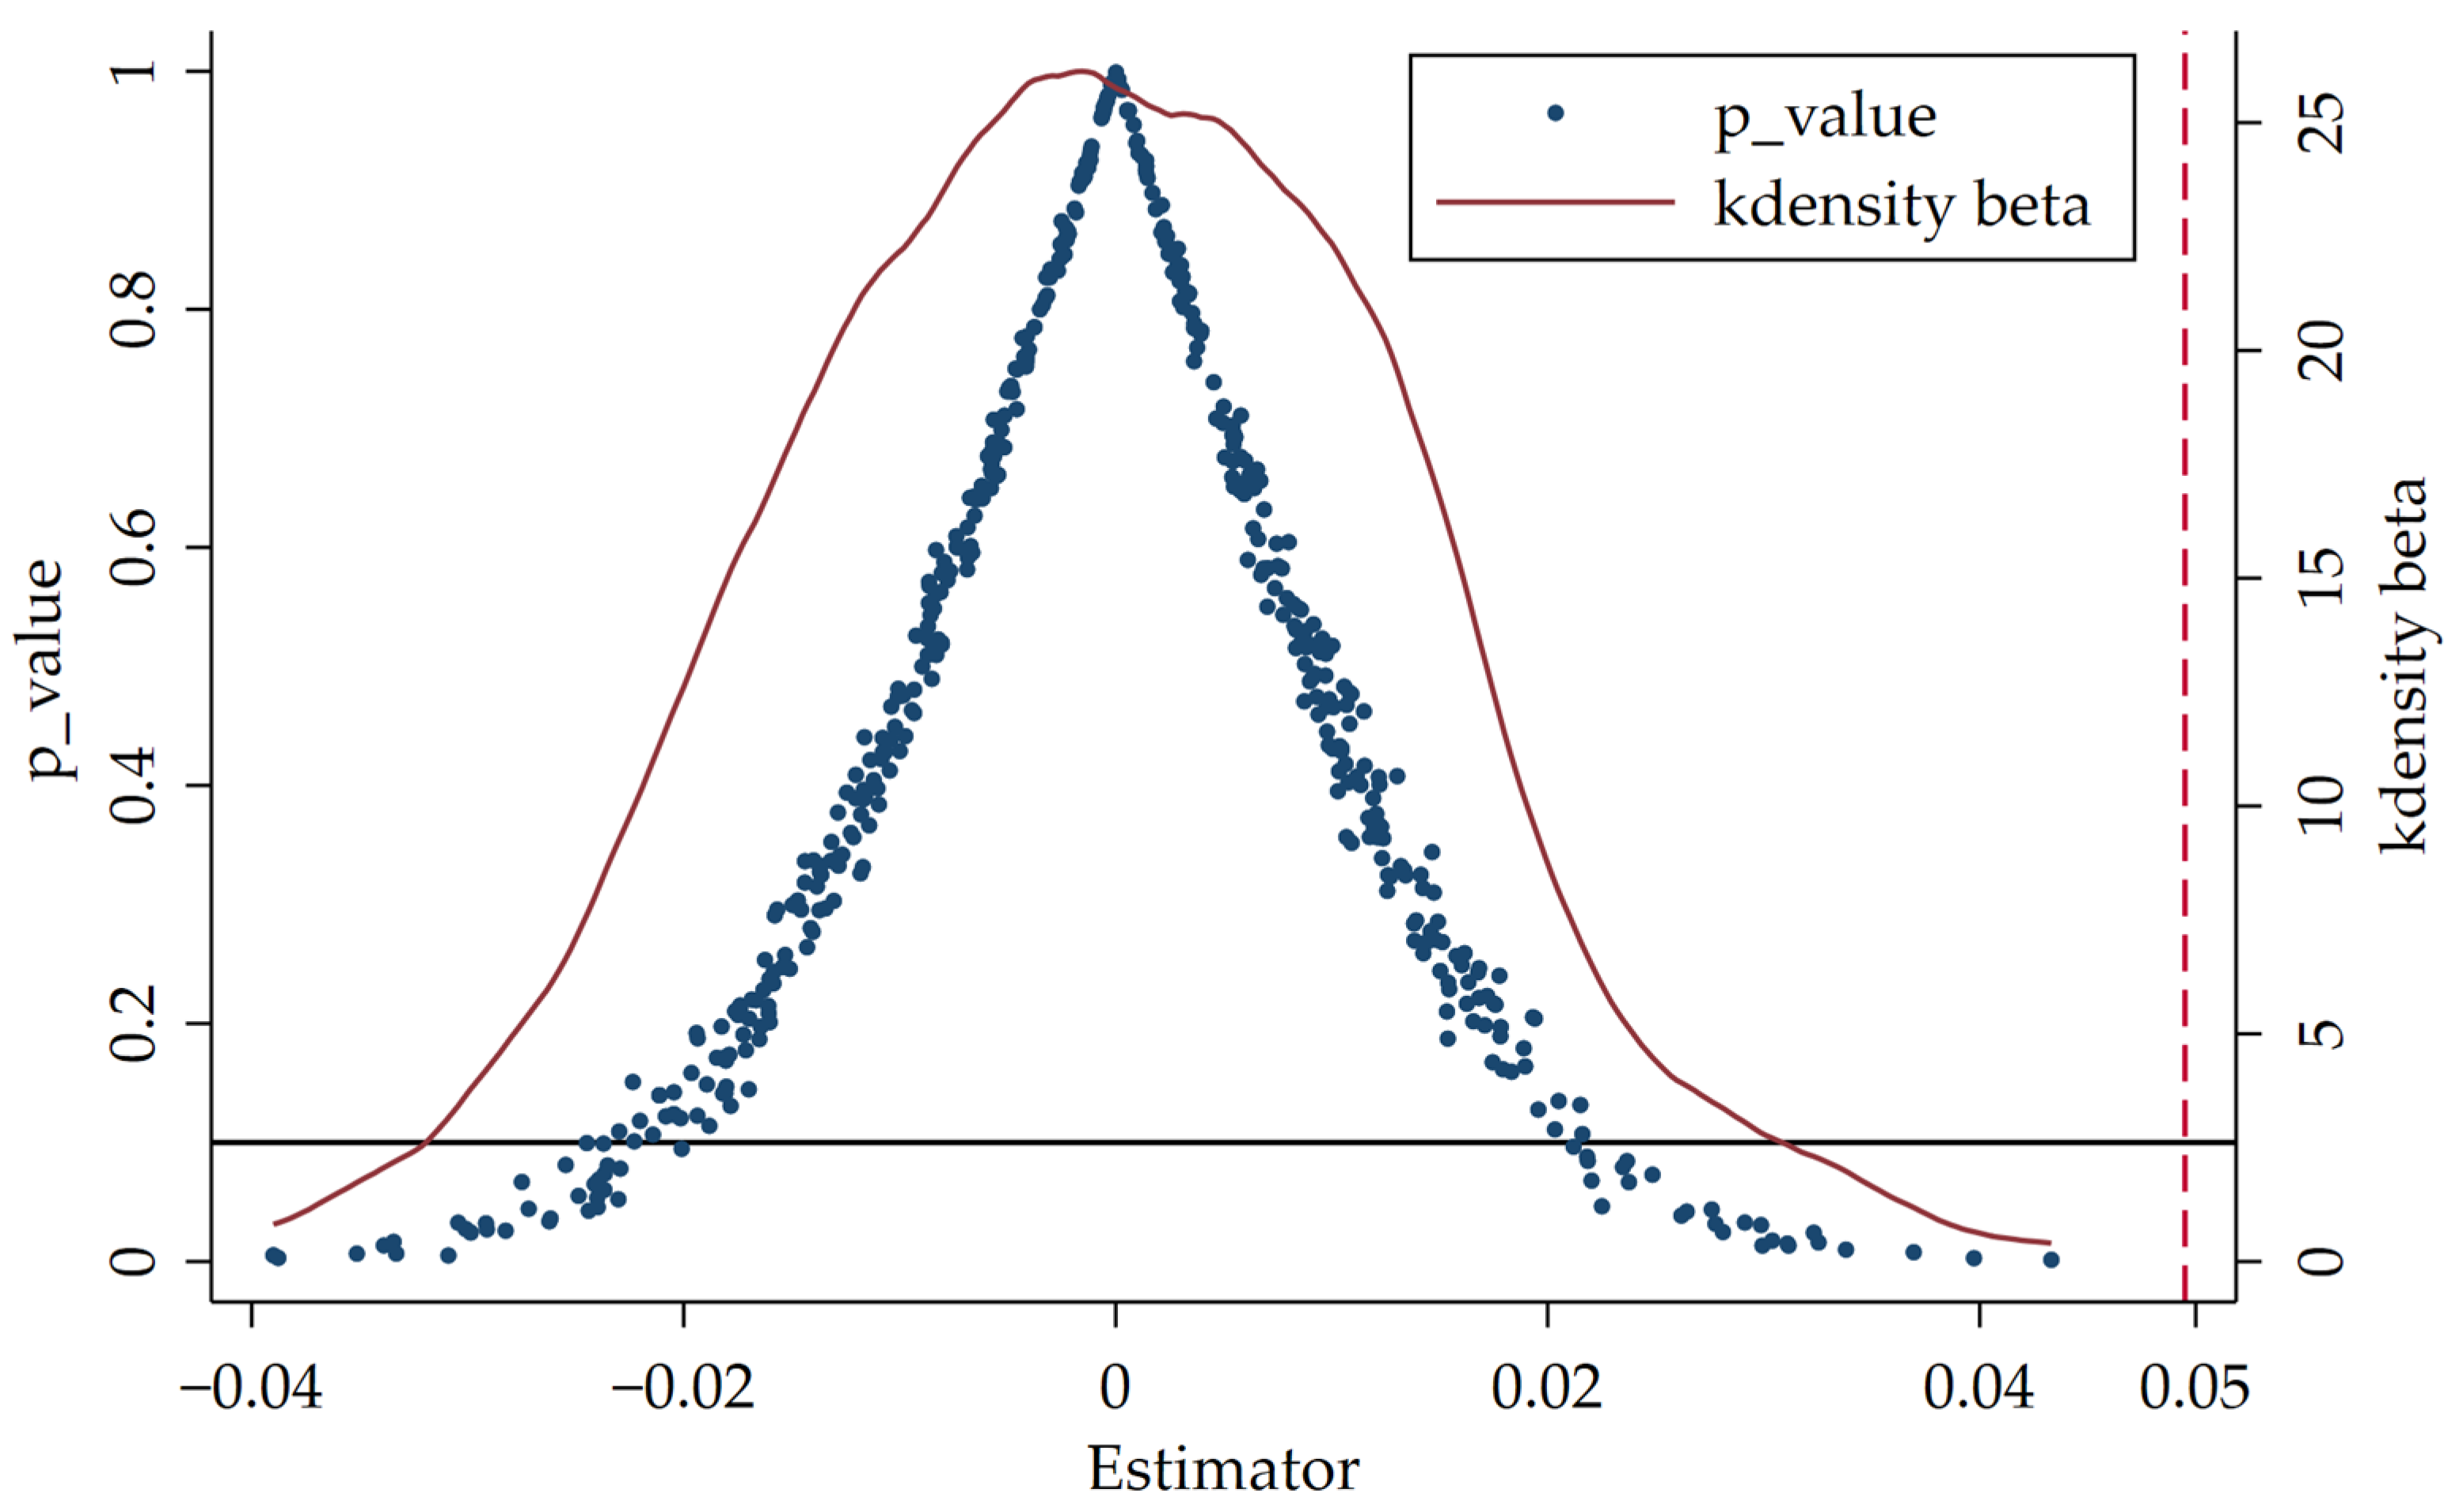
4.2.3. Sensitivity Analysis

However, Roth et al. put forward that traditional pre-treatment tendency tests cause estimation bias [46]. To test what would happen if the parallel trend hypothesis is not true, sensitivity analysis of parallel trends can be conducted by estimating confidence intervals of post-treatment point estimates [47]. Usually, relative deviation degree limitation and smooth limitation are used for testing, with the idea that the difference between the parallel trends before and after treatment is smaller than the difference between them after treatment, or that they do not differ too much from the linear extrapolation trend before treatment.
Following Biasi and Sarsons [48], this paper establishes a maximum deviation degree of 1 standard error, as shown in Figure 4 and Figure 5. The vertical axis in the figures is robust confidence intervals of treatment effects when the parallel trend is not met to a certain extent, and the horizontal axis indicates the degree of non-compliance with parallel trends. Under relative deviation degree limitations, even if the deviation degree of the parallel trend post-treatment is 20% higher than pre-treatment, the impact of the NEDC policy on the GI of companies remains positive at the 95% confidence level. This eliminates the possibility of biased results due to the failure to satisfy the parallel trends assumption. Under smooth limitations, when the deviation degree pre-treatment is 6%, the policy’s effect on GI remains consistent, reinforcing the reliability of the findings. This suggests that the policy effects are not driven by data bias or model specification issues. In summary, sensitivity analysis indicates that even in the presence of certain economic or environmental fluctuations before and after the policy implementation, the NEDC policy can still effectively promote GI behavior in enterprises.

4.2.4. Placebo Test

By randomly selecting the same number of pilot enterprises to construct a “pseudo-policy dummy variable”, a placebo test is conducted to verify if random factors affect the results after policy intervention. First, 500 random samples are drawn, and then 500 estimates are obtained based on Equation (1). Figure 6 illustrates that most coefficient estimates derived from random sampling cluster around zero, with the majority of their corresponding p-values exceeding 0.1. Conversely, the red dashed line representing the benchmark regression’s estimate falls outside the distribution, thus passing the placebo test.

4.3. Robustness Tests

4.3.1. PSM-DID

When using the DID method for model estimation, sample selection bias interferes with policy evaluation. This paper re-estimates the model using PSM-DID. Based on the idea of propensity score matching (PSM), we use control variables as enterprise identification characteristics and employ the nearest neighbor matching method to conduct PSM-DID estimation. Balance tests indicate a good matching effect. Results in Model (1) of Table 3 reveal that the coefficient for the NEDC term stands at 0.037 and is statistically significant at the 10% level, underscoring the robustness of the baseline results.

4.3.2. System GMM

The System GMM approach alleviates potential endogeneity concerns through its use of lagged variables as instruments. The estimated results indicate that the p-value (0.888) of AR (2) is greater than 0.1, passing the autocorrelation test. Meanwhile, both the Sargan and Hansen test p-values surpass 0.1, passing the over-identification test. Model (2) of Table 3 shows that after alleviating endogeneity issues, the coefficient for the NEDC term undergoes a significant uptick and is significant at the 1% level, proving the benchmark results are effective.

4.3.3. Variable Exchange

Economic development, institutional environment, and others may affect corporate GI. Therefore, the natural logarithm of urban per capita GDP, industrial structure (the ratio of the tertiary industry to the secondary industry), and the intensity of environmental regulation (the proportion of environmental protection-related word frequency in government work reports) are included as control variables in the model. Model (3) of Table 4 shows that the estimator for the NEDC term remains a notable positive value, and the previous conclusions still hold.
To eliminate confounding factors affecting both green patents and patent applications, this paper employs the ratio of green patents to total patent applications (GPR) to replace the original dependent variable for regression. The results in Model (4) of Table 4 indicate that the NEDC policy continues to have a notably positive influence on the proportion of green patent applications.

4.3.4. Adjustment of Research Samples

Taking the timeliness of the policy and the impacts of different datasets into account, we redefined the sample period to span from 2010 to 2018 and subsequently repeated the regression analysis. The result of Model (2) in Table 5 identifies that the coefficient for the NEDC term is notably positive at the 5% level, which aligns with the main results.
In addition, due to the advantages of municipalities directly under the central government and sub-provincial cities in economic development, talent aggregation, and technological accumulation, these cities were excluded for re-estimation of the research sample. The outcome in Model (3) of Table 5 reports that the NEDC policy still improves enterprises’ GI.
Lastly, to prevent outliers in the data from causing regression results to be inconsistent, we apply a 1% level truncation to the original variables. It can be seen from Model (4) of Table 5 that the size, direction, and statistical significance of the estimator after truncation are in accordance with benchmark regression results.

4.3.5. Excluding Interference from Other Policies

To make sure that other environmental laws do not get in the way of finding the cause, we regressed the model by adding policy dummy variables. These were energy-consuming right trading pilots (ERT), comprehensive innovation reform pilot zones (CIR), and comprehensive demonstration cities for energy conservation and emission reduction fiscal policies (ECER) that were in place during the sample period. It can be observed from Models (1)–(3) of Table 6 that the value of the NEDC term stays basically unchanged, and the direction and significance remain the same. This evidence illustrates that the effect is immune from these three policies, further validating the robustness of previous results.

4.4. Heterogeneity Analysis

4.4.1. Heterogeneity of Corporate Attributes

Enterprises’ ownership leads to differences in environmental responsibility and innovation willingness. Regression is conducted separately for state-owned enterprises and non-state-owned enterprises. The results in Models (1)–(2) of Table 7 show that the NEDC policy is fully utilized to increase innovation output for non-state-owned enterprises, but performs poorly for state-owned enterprises. A potential explanation could be that state-owned enterprises grasp the lifeline of the national economy and show greater advantages in resource allocation. Therefore, they are insensitive to regulatory constraints and innovation incentives for the NEDC policy. On the contrary, non-state-owned enterprises bear responsibility for their profits and losses, and are more susceptible to environmental regulations in production processes. By improving their GI levels, they aim to achieve a balanced outcome that optimizes both economic and environmental performance. In addition, non-state-owned enterprises possess stronger subjective initiative and greater flexibility compared to state-owned enterprises. They are more sensitive to information and more likely to carry out institutional reforms and resource resets in response to external environmental changes.
Enterprises in high-energy-consuming industries are more prone to the influence of the NEDC policy. The paper categorizes the sample into six high-energy-consuming industries and the cleaning industry, and then re-regress separately. The results in Models (3) and (4) of Table 7 suggest that the regression coefficient in high-energy-consuming industries is positive at the 5% significance level, whereas the estimator in the cleaning industry is insignificant. It proves that the NEDC policy is highly targeted and can effectively constrain the high-energy-consumption behavior of enterprises. High-energy-consuming enterprises have a high demand for energy and face more severe energy constraints. They are therefore willing to innovate to improve traditional energy technologies and develop renewable energy technologies, securing technological dividends and making up for the energy pressure faced in the production process.

4.4.2. Heterogeneity of Corporate Location Characteristics

External environmental characteristics, such as geographical location and factor endowments, can also lead to differences in policy effectiveness. We divide the locations of enterprises into eastern and mid-west regions, resource-based and non-resource-based cities to examine this difference.
We infer from Models (1) to (4) of Table 8 that the NEDC policy encourages corporate GI in mid-west regions and non-resource-based cities. The possible reasons for the above heterogeneity are that comparatively, the economic development and industrial structure of mid-west regions are slower than those of eastern regions. Simultaneously, rich natural resources in mid-west regions grant them the advantages of developing renewable energy such as geothermal and biomass energies. Therefore, when confronted with the dual challenges of the traditional energy crisis and ecological environment protection, enterprises in the mid-west regions show a relatively higher inclination to participate in innovation activities. Additionally, non-resource-based cities tend to prioritize the development of renewable energy due to higher energy consumption costs attributable to resource scarcity. However, resource-based cities mainly focus on the extraction and processing of natural resources, such as forests and minerals. They lack the development and application of clean energies like solar and wind. Also, their overreliance on local natural resources steers them towards a single industrial structure and inadequate technical talents. The outcome could be a waste of resources and a resource mismatch. When this happens, it becomes difficult for such a region to meet new energy development spearheaded by technology and capital. To an extent, this constrains green innovation behaviors.

4.5. Mechanism Analysis

This study tests mediating effects based on model (2) set forth earlier, and verifies the robustness of mediating effects through the Bootstrap method. Results are shown in Table 9.
Model (1) shows a significant coefficient value of 0.065 as the impact of the NEDC policy on enterprise R&D investment. The likely reason behind the outcome here is that high standards for new energy technologies in demonstration cities have forced companies to increase their investments in R&D activities. As time goes by, the beneficial effects of heightened R&D intensity on GI become increasingly apparent, hence, research hypothesis 2 has been validated.
Model (2) implies that the NEDC policy dramatically increases the proportion of enterprise technical personnel, and the mediating effects tested by the bootstrap method reached 0.025. With optimization of human capital, knowledge spillover and technology diffusion attached to high-skilled talents are integrated into the production process, which improves the quality of GI outputs. The theoretical hypothesis 3 holds true.
The coefficient of the NEDC item in Model (3) displays a notably negative value. The policy has ensured an effective supply of external capital and rational allocation of financial resources by mobilizing the enthusiasm of various market entities to invest in new energy sectors. And this alleviates the problem of financing restrictions and high adjustment costs for enterprises’ GI as a result of market information asymmetry. Theoretical hypothesis 4 has been validated.

5. Spillover Effects Analysis

The NEDC policy’s effectiveness depends on the interaction between the external objective environment and internal subjective conditions. Will such a pilot policy, after effectively promoting GI in demonstration cities, drive the GI of enterprises in neighboring cities and the same industry? To answer the question, this paper conducts an in-depth analysis of the regional and industry spillover effects of the NEDC policy.

5.1. Regional Spillover Effects

From the results in Models (1)–(3) of Table 10, the NEDC policy restrains GI in neighboring cities looking at negative coefficient values for green invention patents and green utility model patents. This implies that the demonstration cities have created a siphon effect on neighboring cities by leveraging the advantages of subsidies, financial support, and other benefits brought about by the pilot policy. They attract talents, funds, technologies, and industries from neighboring cities while transferring pollution-intensive and high-energy-consuming enterprises to their peripheral cities, thereby constricting GI in surrounding cities [16].
Inhibitory effects of the NEDC policy on corporate GI in nearby cities show a heterogeneity impact under geographical location and resource endowment. From Table 11 and Table 12, the adverse regional spillover effects of the policy are more evident in eastern and non-resource-based cities. Compared to cities in the mid-west, demonstration cities in the east are more concentrated and have relatively developed economies and complete infrastructure. But energy distribution between these cities is uneven, and there is greater energy competition pressure. In addition, green innovation environments in the mid-west are inferior to those in eastern regions, and innovation generally focuses on utility model patents with low technological levels. In contrast with resource-based cities, non-resource-based cities have greater demands and higher degrees of development and utilization for renewable energy. Moreover, resource-based cities commonly suffer from the resource curse and are unwilling to use new energy. By and large, eastern cities and non-resource-based cities, due to their urban characteristics and policy preferences, have greater siphon effects on innovation factors in non-pilot cities.

5.2. Industrial Spillover Effects

However, spillover effects at the industry level are exactly the opposite. The full sample analysis results in Models (1)–(3) of Table 13 show that the core variable’s coefficients are significant. This means that as the number of pilot businesses grows, so does the GI of other businesses in the same industry. The NEDC project has stimulated the “mentoring” function of enterprises. Through interaction and negotiation within the industry, enterprises in demonstration cities have produced positive spillover effects on GI among peers. Therefore, the proposed hypothesis 5 has been validated.
Next, we conduct a heterogeneity analysis to examine the effects of industrial spillover. The results in Table 14 and Table 15 indicate that positive industrial spillover is almost unaffected by enterprise ownership and energy consumption. For the fact that companies in the same industry are faced with similar external environmental conditions, they often make green innovation decisions based on internal and external balance and development opportunities. GI that is below the general level is easily noticed by external stakeholders and the public. This eventually arouses public concerns. For the sake of their own survival and development, enterprises actively seek convergence with the average level of GI to avoid potential risks. This manifests as non-demonstration enterprises at an information disadvantage optimizing their decision-making process and improving the feasibility of innovative strategies by imitating demonstration enterprises [49]. Companies pay attention to peer enterprises with high-level green innovation. Corporate GI behaviors often converge competitively due to limited decision-making time. When enterprises in demonstration cities achieve high expected returns through GI, enterprises in non-demonstration cities actively adjust their own plans based on the green innovation decisions of demonstration enterprises to maintain competitive balances and behavioral effectiveness. The gap between enterprises in green technologies at the early stage of new energy development is relatively small, making it easier for knowledge and technology spillover within the industry. In summary, both state-owned and non-state-owned enterprises, as well as clean and high-energy-consuming enterprises, reflect the industrial spillover effects of the NEDC policy.
As evidenced by the empirical results, the growing demand for new energy has served as a powerful catalyst for advancements in GI. On the one hand, the widespread adoption of new energy necessitates efficient and cost-effective technological support, which directly drives the research and development of green technologies. On the other hand, the expansion of the new energy industry provides a vast market space for green technology innovation. This demand-driven effect stimulates enterprises to increase their R&D investments in both the new energy and green technology sectors. And the confirmed spillover effects of the NEDC policy suggest that policymakers should mitigate siphon effects within regions and harness demonstration effects across industries to maximize green innovation synergies.

6. Conclusions and Implications

6.1. Conclusions

Based on the panel data of A-share listed companies in China from 2009 to 2020, this paper has discovered that the NEDC policy improves GI, as evidenced by various robustness checks. Moreover, this effect is more pronounced in non-state-owned enterprises and high-energy-consuming industries. Similarly, companies located in central and western regions, as well as non-resource-based cities, derive greater benefits from the policy. NEDC compels enterprises to transition towards a cleaner direction characterized by low energy consumption and low pollution, thereby stimulating their intrinsic motivation for GI. This phenomenon manifests through three primary mechanisms. The widespread application of new energy necessitates efficient technological support, which in turn pressures enterprises to increase their R&D investment. A series of preferential measures accompanied by the NEDC policy attracts a multitude of technical talents to the field of new energy, enriching the human resources available for enterprises. And the policy guides social capital flows into new energy production or energy transition companies, alleviating the financing constraints faced by enterprises. More importantly, the policy inhibits corporate GI in neighboring cities while encouraging GI among firms within the same industry. The negative regional spillover effects vary, manifested as significant in the eastern region and non-resource-based cities. But there is no difference in industrial positive spillovers under different equity properties and energy consumption levels of enterprises. Building upon existing research, this paper further enriches the mechanism of the role of the NEDC policy on corporate GI, and reveals the spillover effects of the NEDC policy at the regional and industry levels. Although policy environments and market conditions vary greatly among countries, the green innovation effects and spillover effects of energy transition policies discovered in this article still provide references for other countries and regions to formulate similar policies.

6.2. Policy Implications

Drawing from the above conclusions, the following suggestions are proposed:
(1)
The scope of the policy should be expanded and institutional systems improved. The NEDC policy redounds to a green transition of energy production and consumption at the city level, as well as the application of green technologies at an enterprise level. Based on the existing practical experiences, successful cases to form replicable models for more cities should be shared. Demonstration cities should vigorously supervise to ensure that policy tilt measures such as special funds, subsidies, and tax reductions are implemented. They should also actively introduce talent exchange programs, continuously improve market investing and financing mechanisms, and increase transparency and accessibility of financing channels to stimulate more investments in green technologies.
(2)
Empirical results indicate that the green innovation effects and spillover effects of the NEDC policy are highly sensitive to corporate attributes and location characteristics. Corporate characteristics and their external environments should therefore be fully considered when formulating and implementing differentiated policies that meet local characteristics and enterprise realities. This would maximize the effectiveness of the NEDC policy on GI. There should be an improvement in the policy’s monitoring and evaluation system to continually enhance policy flexibility and applicability.
(3)
The NEDC policy has negative regional spillover effects and positive industrial spillover effects. Therefore, when formulating the policy, the “beggar-thy-neighbor” effect should be avoided whilst leveraging the role model effect to form cooperation mechanisms between the demonstration and surrounding cities. Such an approach would promote regional coordinated green development. There should be a consolidation and expansion of the advantages formed by the NEDC policy. By radiating and promoting the experiences and practices to other sectors, a multiplier effect on corporate GI would be produced.

6.3. Limitation and Further Research

Although this paper presents a detailed exploration of the NEDC policy and corporate TFP, it has the following gaps. First, the scope of the study is confined to the sample of Chinese A-share listed companies from 2009 to 2020 owing to limited data availability. Further research could extend the specific time frame to investigate long-term effects and incorporate B-shares, H-shares, etc., to enhance the generalizability of the study. Secondly, a more detailed analysis is needed of how specific industries respond differently to the NEDC policy and the mechanisms of spillover effects. Future research can conduct heterogeneity analysis by segmenting industries and exploring spillover mechanisms from innovative factors such as human resources and capital. Thirdly, green patent applications may not fully capture the qualitative aspects of GI. For example, innovative green institutional concepts may not be reflected in patents, while some green patents may fail to be applied in practice due to a lack of economic viability or challenges in mass production. Future research could refine patent categorization, such as distinguishing between energy-saving patents and energy-substitution patents, or adopt metrics like the citation counts of green patents to measure GI more precisely. Finally, more robustness tests like instrumental variable methods and machine learning approaches can be performed.

Author Contributions

Conceptualization, C.W.; Formal analysis, M.C.; Investigation, M.C.; Data curation, Y.L.; Writing—original draft, M.C.; Writing—review & editing, C.W. and C.N.M.; Supervision, C.W.; Funding acquisition, Y.L. All authors have read and agreed to the published version of the manuscript.

Funding

This research was funded by National Natural Science Foundation of China (71803068), China Postdoctoral Science Foundation (2023M731371), National Statistical Science Research Project (2024LY041), Natural Science Foundation of the Higher Education Institutions of Jiangsu Province (24KJB630003), Humanities and Social Sciences Youth Foundation, Ministry of Education (23YJC790096).

Institutional Review Board Statement

Not applicable.

Informed Consent Statement

Not applicable.

Data Availability Statement

The raw data supporting the conclusions of this article will be made available by the authors on request.

Conflicts of Interest

The authors declare no conflict of interest.

References

  1. Zhang, Y.; Li, X.; Xing, C. How Does China’s Green Credit Policy Affect the Green Innovation of High Polluting Enterprises? The Perspective of Radical and Incremental Innovations. J. Clean. Prod. 2022, 336, 130387. [Google Scholar] [CrossRef]
  2. Li, Y.; Chu, E.; Nie, S.; Peng, X.; Yi, Y. Fintech, Financing Constraints and Corporate Green Innovation. Int. Rev. Financ. Anal. 2024, 96, 103650. [Google Scholar] [CrossRef]
  3. Wang, S.; Ma, L. Does New Energy Demonstration City Policy Curb Air Pollution? Evidence from Chinese Cities. Sci. Total Environ. 2024, 918, 170595. [Google Scholar] [CrossRef]
  4. Yang, X.; Zhang, J.; Ren, S.; Ran, Q. Can the New Energy Demonstration City Policy Reduce Environmental Pollution? Evidence from a Quasi-Natural Experiment in China. J. Clean. Prod. 2021, 287, 125015. [Google Scholar] [CrossRef]
  5. Chai, J.; Tian, L.; Jia, R. New Energy Demonstration City, Spatial Spillover and Carbon Emission Efficiency: Evidence from China’s Quasi-Natural Experiment. Energy Policy 2023, 173, 113389. [Google Scholar] [CrossRef]
  6. Che, S.; Wang, J.; Chen, H. Can China’s Decentralized Energy Governance Reduce Carbon Emissions? Evidence from New Energy Demonstration Cities. Energy 2023, 284, 128665. [Google Scholar] [CrossRef]
  7. Lin, B.; Xu, C. Reaping Green Dividend: The Effect of China’s Urban New Energy Transition Strategy on Green Economic Performance. Energy 2024, 286, 129589. [Google Scholar] [CrossRef]
  8. Wang, Q.; Yi, H. New Energy Demonstration Program and China’s Urban Green Economic Growth: Do Regional Characteristics Make a Difference? Energy Policy 2021, 151, 112161. [Google Scholar] [CrossRef]
  9. Cheng, Z.; Yu, X.; Zhang, Y. Is the Construction of New Energy Demonstration Cities Conducive to Improvements in Energy Efficiency? Energy 2023, 263, 125517. [Google Scholar] [CrossRef]
  10. Liu, X.; Wang, C.; Wu, H.; Yang, C.; Albitar, K. The Impact of the New Energy Demonstration City Construction on Energy Consumption Intensity: Exploring the Sustainable Potential of China’s Firms. Energy 2023, 283, 128716. [Google Scholar] [CrossRef]
  11. Zhou, A.; Wang, S.; Chen, B. Impact of New Energy Demonstration City Policy on Energy Efficiency: Evidence from China. J. Clean. Prod. 2023, 422, 138560. [Google Scholar] [CrossRef]
  12. Hou, Y.; Yang, M.; Ma, Y.; Zhang, H. Study on City’s Energy Transition: Evidence from the Establishment of the New Energy Demonstration Cities in China. Energy 2024, 292, 130549. [Google Scholar] [CrossRef]
  13. Zhang, Q.; Huang, X.; Xu, Y.; Bhuiyan, M.A.; Liu, P. New Energy Demonstration City Pilot and Green Energy Consumption: Evidences from China. Energy Rep. 2022, 8, 7735–7750. [Google Scholar] [CrossRef]
  14. Porter, M.E.; Linde, C.V.D. Toward a New Conception of the Environment-Competitiveness Relationship. J. Econ. Perspect. 1995, 9, 97–118. [Google Scholar] [CrossRef]
  15. Song, Y.; Pang, X.; Zhang, Z.; Sahut, J.-M. Can the New Energy Demonstration City Policy Promote Corporate Green Innovation Capability? Energy Econ. 2024, 136, 107714. [Google Scholar] [CrossRef]
  16. Liu, C.; Tang, C.; Liu, Y. Does the Transformation of Energy Structure Promote Green Technological Innovation? A Quasi–Natural Experiment Based on New Energy Demonstration City Construction. Geosci. Front. 2024, 15, 101615. [Google Scholar] [CrossRef]
  17. Chen, M.; Su, Y.; Piao, Z.; Zhu, J.; Yue, X. The Green Innovation Effect of Urban Energy Saving Construction: A Quasi-Natural Experiment from New Energy Demonstration City Policy. J. Clean. Prod. 2023, 428, 139392. [Google Scholar] [CrossRef]
  18. Zhang, Z.; Luo, C.; Zhang, G.; Shu, Y.; Shao, S. New Energy Policy and Green Technology Innovation of New Energy Enterprises: Evidence from China. Energy Econ. 2024, 136, 107743. [Google Scholar] [CrossRef]
  19. Abban, O.J.; Rajaguru, G.; Acheampong, A.O. The Spillover Effect of Economic Institutions on the Environment: A Global Evidence from Spatial Econometric Analysis. J. Environ. Manag. 2025, 373, 123645. [Google Scholar] [CrossRef]
  20. Nikou, V. Spatial Interdependence and Cross-Border Spillover Effects in the Ecological Footprint of Consumption: The Role of Inclusive Policies and Public Procurement. J. Clean. Prod. 2025, 494, 144992. [Google Scholar] [CrossRef]
  21. Stiewe, C.; Xu, A.L.; Eicke, A.; Hirth, L. Cross-Border Cannibalization: Spillover Effects of Wind and Solar Energy on Interconnected European Electricity Markets. Energy Econ. 2025, 143, 108251. [Google Scholar] [CrossRef]
  22. Attílio, L.A. Spillover Effects of Climate Policy Uncertainty on Green Innovation. J. Environ. Manag. 2025, 375, 124334. [Google Scholar] [CrossRef]
  23. Wang, X.; Long, R.; Sun, Q.; Chen, H.; Jiang, S.; Wang, Y.; Li, Q.; Yang, S. Spatial Spillover Effects and Driving Mechanisms of Carbon Emission Reduction in New Energy Demonstration Cities. Appl. Energy 2024, 357, 122457. [Google Scholar] [CrossRef]
  24. Yang, J.; Wang, J.; Wang, W.; Wu, H. Exploring the Path to Promote Energy Revolution: Assessing the Impact of New Energy Demonstration City Construction on Urban Energy Transition in China. Renew. Energy 2024, 236, 121437. [Google Scholar] [CrossRef]
  25. Nesta, L.; Vona, F.; Nicolli, F. Environmental Policies, Competition and Innovation in Renewable Energy. J. Environ. Econ. Manag. 2014, 67, 396–411. [Google Scholar] [CrossRef]
  26. Yang, Y.; Nie, P. Subsidy for Clean Innovation Considered Technological Spillover. Technol. Forecast. Soc. Change 2022, 184, 121941. [Google Scholar] [CrossRef]
  27. Li, T.; Shi, Z.; Han, D.; Zeng, J. Agglomeration of the New Energy Industry and Green Innovation Efficiency: Does the Spatial Mismatch of R&D Resources Matter? J. Clean. Prod. 2023, 383, 135453. [Google Scholar] [CrossRef]
  28. Wu, J.; Zuidema, C.; Gugerell, K. Experimenting with Decentralized Energy Governance in China: The Case of New Energy Demonstration City Program. J. Clean. Prod. 2018, 189, 830–838. [Google Scholar] [CrossRef]
  29. Lin, B.; Zhu, J. Determinants of Renewable Energy Technological Innovation in China under CO2 Emissions Constraint. J. Environ. Manag. 2019, 247, 662–671. [Google Scholar] [CrossRef]
  30. Qi, X.; Guo, Y.; Guo, P.; Yao, X.; Liu, X. Do Subsidies and R&D Investment Boost Energy Transition Performance? Evidence from Chinese Renewable Energy Firms. Energy Policy 2022, 164, 112909. [Google Scholar] [CrossRef]
  31. Hu, G.-G. Is Knowledge Spillover from Human Capital Investment a Catalyst for Technological Innovation? The Curious Case of Fourth Industrial Revolution in BRICS Economies. Technol. Forecast. Soc. Change 2021, 162, 120327. [Google Scholar] [CrossRef]
  32. Ozcan, B.; Danish; Temiz, M. An Empirical Investigation between Renewable Energy Consumption, Globalization and Human Capital: A Dynamic Auto-Regressive Distributive Lag Simulation. Renew. Energy 2022, 193, 195–203. [Google Scholar] [CrossRef]
  33. Yu, C.H.; Wu, X.; Zhang, D.; Chen, S.; Zhao, J. Demand for Green Finance: Resolving Financing Constraints on Green Innovation in China. Energy Policy 2021, 153, 112255. [Google Scholar] [CrossRef]
  34. Luo, G.; Liu, Y.; Zhang, L.; Xu, X.; Guo, Y. Do Governmental Subsidies Improve the Financial Performance of China’s New Energy Power Generation Enterprises? Energy 2021, 227, 120432. [Google Scholar] [CrossRef]
  35. Wen, H.; Lee, C.-C.; Zhou, F. How Does Fiscal Policy Uncertainty Affect Corporate Innovation Investment? Evidence from China’s New Energy Industry. Energy Econ. 2022, 105, 105767. [Google Scholar] [CrossRef]
  36. Lu, Y.; Wang, J.; Zhu, L. Place-Based Policies, Creation, and Agglomeration Economies: Evidence from China’s Economic Zone Program. Am. Econ. J. Econ. Policy 2019, 11, 325–360. [Google Scholar] [CrossRef]
  37. Ciżkowicz, P.; Ciżkowicz, M.; Pękała, P.; Rzońca, A. The Effects of Polish Special Economic Zones on Employment and Investment: Spatial Panel Modelling Perspective. J. Econ. Geogr. 2017, 17, 571–605. [Google Scholar] [CrossRef]
  38. Jiang, M.; Yu, X.; Xu, J.; Wu, Z.; Shen, X.; Zhong, G. Exploring the Emission Spillover Effects in Production Networks under Carbon Trading Market: Insights into Complementary and Competitive Industries. Environ. Impact Assess. Rev. 2025, 110, 107720. [Google Scholar] [CrossRef]
  39. Yang, F.; Cheng, Y.; Yao, X. Influencing Factors of Energy Technical Innovation in China: Evidence from Fossil Energy and Renewable Energy. J. Clean. Prod. 2019, 232, 57–66. [Google Scholar] [CrossRef]
  40. Wang, Z.; Zhang, T.; Ren, X.; Shi, Y. AI Adoption Rate and Corporate Green Innovation Efficiency: Evidence from Chinese Energy Companies. Energy Econ. 2024, 132, 107499. [Google Scholar] [CrossRef]
  41. Peng, D.; Kong, Q. Corporate Green Innovation under Environmental Regulation: The Role of ESG Ratings and Greenwashing. Energy Econ. 2024, 140, 107971. [Google Scholar] [CrossRef]
  42. Zhao, M.; Fu, X.; Du, J.; Cui, L. Optimal Environmental Investment Strategies for Enterprise Green Technology Innovation: An Empirical Study Based on Multiple Drive Models. J. Environ. Manag. 2024, 370, 122624. [Google Scholar] [CrossRef]
  43. Zhong, Z.; Peng, B. Can Environmental Regulation Promote Green Innovation in Heavily Polluting Enterprises? Empirical Evidence from a Quasi-Natural Experiment in China. Sustain. Prod. Consum. 2022, 30, 815–828. [Google Scholar] [CrossRef]
  44. Li, H.; Su, Y.; Ding, C.J.; Tian, G.G.; Wu, Z. Unveiling the Green Innovation Paradox: Exploring the Impact of Carbon Emission Reduction on Corporate Green Technology Innovation. Technol. Forecast. Soc. Change 2024, 207, 123562. [Google Scholar] [CrossRef]
  45. Deschênes, O.; Greenstone, M.; Shapiro, J.S. Defensive Investments and the Demand for Air Quality: Evidence from the NOx Budget Program. Am. Econ. Rev. 2017, 107, 2958–2989. [Google Scholar] [CrossRef]
  46. Roth, J.; Sant’Anna, P.H.C.; Bilinski, A.; Poe, J. What’s Trending in Difference-in-Differences? A Synthesis of the Recent Econometrics Literature. J. Econom. 2023, 235, 2218–2244. [Google Scholar] [CrossRef]
  47. Rambachan, A.; Roth, J. A More Credible Approach to Parallel Trends. Rev. Econ. Stud. 2023, 90, 2555–2591. [Google Scholar] [CrossRef]
  48. Biasi, B.; Sarsons, H. Flexible Wages, Bargaining, and the Gender Gap. Q. J. Econ. 2022, 137, 215–266. [Google Scholar] [CrossRef]
  49. Tan, X.; Yan, Y.; Dong, Y. Peer Effect in Green Credit Induced Green Innovation: An Empirical Study from China’s Green Credit Guidelines. Resour. Policy 2022, 76, 102619. [Google Scholar] [CrossRef]
Figure 1. Theoretical framework.
Sustainability 17 03179 g001
Figure 2. Parallel trend test.
Sustainability 17 03179 g002
Figure 3. Dynamic effect test.
Sustainability 17 03179 g003
Figure 4. Sensitivity test for parallel trends under constraints of relative deviation degree.
Sustainability 17 03179 g004
Figure 5. Sensitivity test for parallel trends under smoothing constraints.
Sustainability 17 03179 g005
Figure 6. Placebo test.
Sustainability 17 03179 g006
Table 1. Variable definitions.
VariableSymbolDefinition
Dependent variablesGreen technology innovationGINatural logarithm of the number of green patent applications plus one
GIPNatural logarithm of the number of green invention patent applications plus one
GUPNatural logarithm of the number of green utility model patent applications plus one
Independent variableNEDC policy variableNEDCIf the enterprise is located at a new energy demonstration city, the value is 1, and vice versa is 0
Mediation variablesR&D investmentRDINatural logarithm of corporate R&D expenditures
Human capitalTechNatural logarithm of the technical personnel count
Financing constraintFC indexA synthetic index built from firm size, profitability, liquidity, cash flow generating ability, solvency, trade credit over total assets, net tangible asset ratio
Control variablesFirm sizesizeNatural logarithm of total assets
Cash asset ratiocashProportion of net cash flow to total assets
Return on assetsroaProportion of net profit to average total assets
Asset-liability ratiolevProportion of total liabilities to total assets
Asset structureassetProportion of fixed assets to total assets
Tobin’s Q valuetobinProportion of market value to replacement cost of capital.
Operating capacityrevenueNatural logarithm of operating income
Table 2. Descriptive statistics of the variables.
VariablesObsMeanSDMinMax
GP14,2800.5400.95007.070
GIP14,2800.3700.79006.620
GUP14,2800.3300.70006.050
NEDC14,2800.1590.36601
size14,28022.111.27016.4127.55
cash14,2800.1700.140−0.0200.950
roa14,2800.0600.070−1.0300.770
lev14,2800.4100.2000.0100.990
asset14,2800.2300.15000.950
tobin14,28021.4000.03031.40
revenue14,28021.471.43014.3527.53
RDI14,28017.681.6307.72023.67
Tech14,2805.9501.240010.49
FC index14,2800.5100.28001
Table 3. Baseline regression results.
(1)(2)(3)(4)(5)(6)(7)(8)
NEDC0.059 **
(2.42)
0.050 **
2.07)
0.051 **
(2.08)
0.051 **
(2.08)
0.051 **
(2.09)
0.050 **
(2.07)
0.051 **
(2.07)
0.049 **
(2.03)
size 0.111 ***
(6.95)
0.112 ***
(7.00)
0.112 ***
(6.99)
0.113 ***
(6.67)
0.115 ***
(6.75)
0.112 ***
(6.51)
0.092 ***
(4.35)
cash 0.048
(0.91)
0.048
(0.90)
0.045
(0.76)
0.065
(1.04)
0.057
(0.91)
0.062
(0.98)
roa 0.013
(0.18)
0.012
(0.17)
0.017
(0.24)
0.023
(0.32)
0.005
(0.07)
lev −0.007
(−0.11)
−0.009
(−0.14)
−0.015
(−0.23)
−0.024
(−0.38)
asset 0.089
(1.10)
0.091
(1.12)
0.087
(1.07)
tobin −0.009 **
(−1.98)
−0.010 **
(−2.13)
revenue 0.023 *
(1.70)
Constants0.532 ***
(83.84)
−1.931 ***
(−5.45)
−1.959 ***
(−5.51)
−1.959 ***
(−5.51)
−1.966 ***
(−5.38)
−2.044 ***
(−5.47)
−1.941 ***
(−5.15)
−2.015 ***
(−5.38)
Firm FEYesYesYesYesYesYesYesYes
Time FEYesYesYesYesYesYesYesYes
City-industry FEYesYesYesYesYesYesYesYes
Observations14,28014,28014,28014,28014,28014,28014,28014,280
Adjusted R20.6480.6500.6500.6500.6500.6500.6500.650
Note: * p < 0.1, ** p < 0.05, *** p < 0.01; The value in parentheses represents the value of t.
Table 4. Results of model and variable exchange.
PSM-DID
(1)
System GMM
(2)
Add Regional Variables
(3)
Change Dependent Variable
(4)
NEDC0.064 **
(2.19)
0.200 ***
(1.99)
0.052 **
(2.18)
0.009 *
(1.96)
Constants−2.050 ***
(−4.22)
−4.125
(−0.55)
−1.988 ***
(−4.06)
0.014
(0.16)
Control variablesYesYesYesYes
Firm FEYesYesYesYes
Time FEYesYesYesYes
City-industry FEYesYesYesYes
Observations779013,09014,28014,280
Adjusted R20.648 0.6500.404
Note: * p < 0.1, ** p < 0.05, *** p < 0.01; The value in parentheses represents the value of t.
Table 5. Results of expected effect and adjusted sample.
Change
Time Scope
(2)
Remove
Special Samples
(3)
Data
Truncation
(4)
NEDC0.060 **
(2.32)
0.072 **
(2.18)
0.052 **
(2.16)
Constants−2.580 ***
(−4.90)
−1.025 **
(−2.36)
−1.824 ***
(−4.51)
Control variablesYesYesYes
Firm FEYesYesYes
Time FEYesYesYes
City-industry FEYesYesYes
Observations10,701871614,280
Adjusted R20.6810.6250.636
Note: ** p < 0.05, *** p < 0.01; The value in parentheses represents the value of t.
Table 6. Results of excluding interference from other policies.
(1)(2)(3)
NEDC0.049 **
(2.01)
0.045 *
(1.92)
0.048 *
(1.96)
ERT0.030
(1.27)
CIR 0.069 ***
(3.27)
ECER 0.028
(0.86)
Constants−2.016 ***
(−5.38)
−1.985 ***
(−5.36)
−2.020 ***
(−5.39)
Control variablesYesYesYes
Firm FEYesYesYes
Time FEYesYesYes
City-industry FEYesYesYes
Observations14,28014,28014,280
Adjusted R20.6500.6510.650
Note: * p < 0.1, ** p < 0.05, *** p < 0.01; The value in parentheses represents the value of t.
Table 7. Heterogeneity results of corporate attributes.
Non-State-Owned
(1)
State-Owned
(2)
Clean
(3)
High Energy Consuming
(4)
NEDC0.083 ***
(3.12)
−0.012
(−0.26)
0.029
(1.04)
0.140 **
(2.44)
Constants−2.963 ***
(−6.71)
−1.580 **
(−2.36)
−2.492 ***
(−5.77)
0.386
(0.41)
Control variablesYesYesYesYes
Firm FEYesYesYesYes
Time FEYesYesYesYes
City-industry FEYesYesYesYes
Observations9130515011,8072473
Adjusted R20.6000.7130.6660.553
Note: ** p < 0.05, *** p < 0.01; The value in parentheses represents the value of t.
Table 8. Heterogeneity results of corporate location characteristics.
Eastern
(1)
Mid-West
(2)
Non-Resource-Based
(3)
Resource-Based
(4)
NEDC0.018
(0.66)
0.115 ***
(2.65)
0.055 **
(1.99)
−0.002
(−0.03)
Constants−2.504 ***
(−5.79)
−0.705
(−1.12)
−2.414 ***
(−6.03)
1.226
(1.20)
Control variablesYesYesYesYes
Firm FEYesYesYesYes
Time FEYesYesYesYes
City-industry FEYesYesYesYes
Observations9617466312,3371943
Adjusted R20.6600.6300.6650.528
Note: ** p < 0.05, *** p < 0.01; The value in parentheses represents the value of t.
Table 9. Results of mechanism analysis.
(1)
R&D Investment
(2)
Human Capital
(3)
Financing Constraint
NEDC0.065 **
(2.43)
0.034 *
(1.67)
−0.009 **
(−1.97)
Constants1.507 ***
(2.65)
−8.660 ***
(−21.03)
4.215 ***
(33.96)
Bootstrap: d0.092 ***0.141 ***0.161 ***
Bootstrap: r0.073 ***0.025 ***0.004 ***
Control variablesYesYesYes
Firm FEYesYesYes
Time FEYesYesYes
City-industry FEYesYesYes
Observations14,28014,28014,280
Adjusted R20.8440.8740.868
Note: * p < 0.1, ** p < 0.05, *** p < 0.01; The value in parentheses represents the value of t.
Table 10. Results of full sample analysis on regional spillover effects.
(1)
GI
(2)
GIP
(3)
GUP
SPILLOVER−0.063 ***
(−2.60)
−0.044 **
(−2.21)
−0.056 ***
(−3.05)
Constants−1.050 **
(−2.57)
−1.250 ***
(−3.78)
−0.592 *
(−1.93)
Control variablesYesYesYes
Firm FEYesYesYes
Time FEYesYesYes
City-industry FEYesYesYes
Observations10,38510,38510,385
Adjusted R20.6420.6390.572
Note: * p < 0.1, ** p < 0.05, *** p < 0.01; The value in parentheses represents the value of t.
Table 11. Results of regional spillover effects under geographic heterogeneity.
EasternMid-west
(1)
GI
(2)
GIP
(3)
GUP
(4)
GI
(5)
GIP
(6)
GUP
SPILLOVER−0.081 ***
(−2.84)
−0.069 ***
(−2.93)
−0.045 **
(−2.09)
−0.008
(−0.19)
0.030
(0.87)
−0.075 **
(−2.39)
Constants−1.411 ***
(−3.05)
−1.710 ***
(−4.53)
−0.713 **
(−2.00)
0.219
(0.28)
0.408
(0.68)
−0.209
(−0.35)
Control variablesYesYesYesYesYesYes
Firm FEYesYesYesYesYesYes
Time FEYesYesYesYesYesYes
City-industry FEYesYesYesYesYesYes
Observations715771577157322832283228
Adjusted R20.6540.6470.5920.6140.6220.518
Note: ** p < 0.05, *** p < 0.01; The value in parentheses represents the value of t.
Table 12. Results of regional spillover effects under resource endowment heterogeneity.
Non-Resource-BasedResource-Based
(1)
GI
(2)
GIP
(3)
GUP
(4)
GI
(5)
GIP
(6)
GUP
SPILLOVER−0.057 **
(−2.06)
−0.047 **
(−2.13)
−0.049 **
(−2.37)
−0.077
(−1.24)
−0.002
(−0.03)
−0.092 *
(−1.87)
Constants−1.564 ***
(−3.60)
−1.517 ***
(−4.24)
−1.033 ***
(−3.19)
2.536 *
(1.85)
0.579
(0.63)
2.492 **
(2.23)
Control variablesYesYesYesYesYesYes
Firm FEYesYesYesYesYesYes
Time FEYesYesYesYesYesYes
City-industry FEYesYesYesYesYesYes
Observations88368836883615491541549
Adjusted R20.6560.6540.5870.5490.5150.482
Note: * p < 0.1, ** p < 0.05, *** p < 0.01; The value in parentheses represents the value of t.
Table 13. Results of full sample analysis on industrial spillover effects.
Variables(1)
GI
(2)
GIP
(3)
GUP
INDRATIO1.770 ***
(5.32)
1.345 ***
(4.52)
1.221 ***
(4.95)
Constants−1.268 ***
(−3.05)
−1.413 ***
(−4.19)
−0.753 **
(−2.42)
Control variablesYesYesYes
Firm FEYesYesYes
Time FEYesYesYes
City-industry FEYesYesYes
Observations10,38510,38510,385
Adjusted R20.6430.6400.573
Note: ** p < 0.05, *** p < 0.01; The value in parentheses represents the value of t.
Table 14. Results of industrial spillover effects under heterogeneity of equity nature.
Non-State-OwnedState-Owned
(1)
GI
(2)
GIP
(3)
GUP
(4)
GI
(5)
GIP
(6)
GUP
INDRATIO2.489 ***
(4.94)
1.838 ***
(4.19)
1.681 ***
(4.25)
1.252 ***
(3.09)
1.046 ***
(2.70)
0.803 ***
(2.80)
Constants−2.033 ***
(−3.99)
−1.905 ***
(−5.04)
−1.458 ***
(−3.44)
−1.469 *
(−1.86)
−2.275 ***
(−3.24)
0.119
(0.21)
Control variablesYesYesYesYesYesYes
Firm FEYesYesYesYesYesYes
Time FEYesYesYesYesYesYes
City-industry FEYesYesYesYesYesYes
Observations644364436443394239423942
Adjusted R20.6620.5350.5070.7260.7170.641
Note: * p < 0.1, *** p < 0.01; The value in parentheses represents the value of t.
Table 15. Results of industrial spillover effects under heterogeneity of energy consumption levels.
CleanHigh Energy Consuming
(1)
GI
(2)
GIP
(3)
GUP
(4)
GI
(5)
GIP
(6)
GUP
INDRATIO1.720 ***
(4.94)
1.300 ***
(4.12)
1.233 ***
(4.67)
2.042 **
(2.07)
1.666 **
(2.17)
0.796
(1.07)
Constants−1.701 ***
(−3.55)
−1.716 ***
(−4.73)
−1.127 ***
(−2.95)
0.975
(0.86)
0.583
(0.61)
0.838
(1.00)
Control variablesYesYesYesYesYesYes
Firm FEYesYesYesYesYesYes
Time FEYesYesYesYesYesYes
City-industry FEYesYesYesYesYesYes
Observations845684568456192919291929
Adjusted R20.6600.6560.5900.5560.5510.479
Note: ** p < 0.05, *** p < 0.01; The value in parentheses represents the value of t.
Disclaimer/Publisher’s Note: The statements, opinions and data contained in all publications are solely those of the individual author(s) and contributor(s) and not of MDPI and/or the editor(s). MDPI and/or the editor(s) disclaim responsibility for any injury to people or property resulting from any ideas, methods, instructions or products referred to in the content.

