Abstract
This study employs a thorough methodology to define water sustainability criteria for the development of new pig farms on the karst aquifer of Yucatan, Mexico. The integrated approach entails a field campaign to assess water quality from the aquifer (wells and cenotes) and effluents from designated pig farms to evaluate adherence to environmental regulations, alongside the utilisation of an extensive pig farm database that includes pig populations by the municipality in Yucatan. The water sustainability of pig farming in Yucatan was analysed by evaluating the nitrogen greywater footprint and water pollution levels for this municipality sector. The intensive pig farming practices in Yucatan significantly contribute to water contamination through nutrient runoff, namely nitrogen and phosphorus. Moreover, the breach of environmental regulations concerning pig farm effluents is demonstrated. This highlights the urgent need to regulate and monitor the expansion of new pig farms in Yucatan. Results introduce evidence-based criteria and their thresholds for achieving water sustainability in the pig sector at the municipal level (Pigs/ha = 1.0 and WPL < 1.1). This facilitated a concerted effort between national and state authorities to limit the proliferation of pig farms in order to safeguard the aquifer’s water quality.
1. Introduction
Globally, growing populations and rising economies are leading to an increasing demand for animal-based foods. Pigmeat is currently the most consumed meat globally, even exceeding the consumption of poultry meat [1]. This is also ascribed to a series of policies and trade agreements aimed at liberalising economies and increasing production; however, it has also carried severe implications for the environment [2,3].
The livestock industry demands huge amounts of land and water resources to produce feed crops. Studies have shown that it consumes a third of the total volume of water used in agriculture [4] and a fifth of the virtual water used in agriculture [4]. In pig farms, while the direct annual consumption of water is anticipated to be relatively small in comparison to that of human freshwater use [5,6], a large portion of the detrimental water impacts relate to poor management of the animal excreta, which contains large amounts of undigested organic matter and mineral nutrients [7,8]. Thus, the poor management of the excreta has serious impacts on water quality as it contributes to pollution and eutrophication of surface waters, groundwater, and coastal marine ecosystems [9]. It is, therefore, recognised that in areas of the world experiencing intense water stress, industrialised pig production may exacerbate water scarcity [10].
The degradation of water quality due to pig manure is a significant environmental concern [11]. The primary pollutants associated with pig manure include nitrogen (N) and phosphorus (P), which in excess lead to the eutrophication of water bodies, resulting in harmful algal blooms and deterioration of aquatic ecosystems [12,13]. This, in turn, may also lead to the loss of human health and biodiversity [14,15,16,17].
In some countries, pig farming is one of the leading contributors to water pollution, primarily due to the high nutrient load from manure [18]. The intensive production techniques employed in pig farming often result in slurry management practices that fail to adequately treat waste before it is applied to land or discharged into water bodies [19]. This situation is aggravated by the fact that many farms lack effective waste management systems, leading to nutrient runoff during rainfall events [20]. Therefore, to improve the overall sustainability of pig farming operations, it is necessary to control nutrient loads to the environment and implement effective manure management strategies [21].
Studies indicate that the effective reduction of pig farm contamination in certain nations is accomplished via environmental decentralisation, emission trading systems, circular economic models, sophisticated manure management, and technological advancements in feed and agricultural practices [22,23]. The transfer of intensive livestock operations from regions with high pig density to areas free of livestock production is recognised to diminish the emission intensity of pollutants from pig farming; however, such relocation policies elevate the risk of groundwater contamination in the prospective development regions [24].
Consequently, in water-sensitive areas with significant pig production, there is a distinct necessity for comprehensive spatial planning of livestock farms that considers environmental and socioeconomic limitations, with an emphasis on water pollution.
Current methodologies for establishing water sustainability criteria to regulate pig farm expansion encompass ecological compensation systems [25], multi-criteria decision-making frameworks [26,27,28], water footprint assessments [29], and sustainability assessment tools that incorporate economic, environmental, and social dimensions at the farm level [30].
The formulation of performance indicators is a common approach for assessing water sustainability in agricultural systems [31,32]. Water indicators have focused on evaluating the water footprint of agricultural production, specifically on green and blue water consumption [33].
Stakeholder engagement is also important for creating and enforcing sustainability standards and criteria [33], as it fosters collaborative decision-making in water distribution and encourages compliance with sustainability practices that may restrict pig farm expansion in water-scarce areas [34].
Mexico, ranking seventh among the top pig-producing countries on the planet [35], has seen a relocation of pig farming operations from the centre to southern states, where there are richer feed resources and large environmental capacity. Indeed, in the Mexican state of Yucatan, where the largest Mexican karst aquifer is located, there is a registered exponential expansion of pig farms in several municipalities. However, in several communities of the state, this intensive pig farming has raised local opposition due to the environmental concerns associated with both the number of pig farms and their waste management strategy [36,37,38]. In addition, the Yucatan aquifer, characterised by its karst geology, is particularly vulnerable to contamination from agricultural practices, including pig farming. Therefore, concerns are focused on water contamination primarily due to the management of pig manure. Indeed, recent studies in the region have indicated that the continuous disposal of untreated wastewater and the application of nitrogen-rich fertilisers contribute to elevated nitrate concentrations in groundwater, often exceeding permissible limits for human consumption [39,40,41].
The Yucatan aquifer is in an unsustainable state of water contamination due to the direct release of pollutants into the environment [39]; the absence of suitable treatment systems in pig farms may make the situation worse. Thus, it is imperative to implement appropriate management techniques and public policies that safeguard the aquifer and promote water sustainability in municipalities where pig farming is occurring. It is essential to develop an evidence-based set of regulations to control pig farming in Yucatan since the region’s extensive pig farming operations greatly contribute to water contamination.
This study establishes evidence-based criteria to reduce aquifer contamination and enhance water sustainability in Yucatan’s pig farming sector. A water sustainability framework is utilised to govern the formation of new pig farms throughout all municipalities in the state, identifying which municipalities are appropriate for such operations and which are restricted from further pig farm expansion. This analysis employs a census of the pig population in intensive farms and a high-quality dataset augmented by data gathered from an extensive field campaign conducted in 2022. Additionally, a sustainable limit on the pig population per hectare concerning water pollution is determined at the municipal level, employing the concepts of water pollution levels [41] and greywater footprint [42]. This initiative seeks to govern substantial economic activity inside the state to safeguard water quality and foster a healthy environment.
2. Study Area and Methodology
2.1. Study Area Location
The Mexican state of Yucatan is situated in the northern region of the Yucatan Peninsula and consists of 106 municipalities with a population of 2,320,898, which accounts for 1.8% of the national populace. As per [43], the urban population of the state constitutes 89% of the total, and the rural population accounts for merely 14%. The most populous municipalities are the capital, Mérida, with 995,129 inhabitants, followed by Kanasín with 141,939, Valladolid with 85,460, and Tizimín with 80,672 inhabitants. Figure 1 displays a map illustrating the population density of the state at the municipal level. The political boundary of municipalities is depicted, with the colour scale representing population density per hectare for each municipality. The region with the highest population density is located in municipalities surrounding the city of Merida, indicated by the darkest green. The Yucatan peninsula is located around 20°30′ latitude N and 87°40′ longitude W.
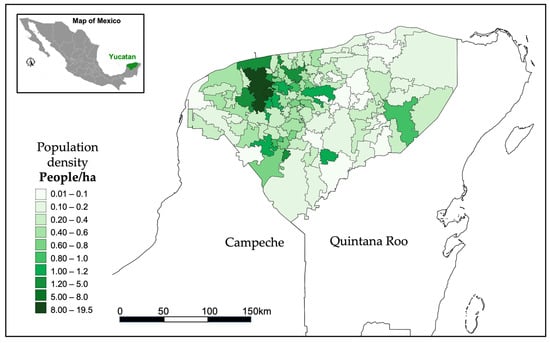
Figure 1.
Population density per municipality in the state of Yucatan (people/ha).
In Yucatan, the primary supply of freshwater for the population and all economic activities in the state is groundwater derived from the aquifer of the Yucatan Peninsula in the absence of surface flows. This aquifer is the largest karst system in Mexico, distinguished by its high permeability and exceptional geological and hydrological characteristics. This encompasses a sophisticated system of subterranean conduits and chambers featuring multiple sinkholes referred to as “cenotes”, which constitute the Ring of Cenotes [44,45]. These factors contribute to complex flow dynamics, including potential flow reversals and interactions between fresh and saline waters near the coast, along with the high hydraulic conductivity; these features highlight the aquifer’s vulnerability to contamination and the need for careful management.
The Yucatan Peninsula aquifer is an unconfined aquifer situated under karstified limestone formations, covering an area of roughly 124,409 km2. The aquifer rests above a stratum of brackish water that stretches from the seashore to several tens of km inland [46]. The maximum depths are situated to the east of the aquifer at 30 m and diminish towards the coastline. In the urban vicinity of Merida, the depth varies from 4 to 8 m. The water families comprise a blend of groundwater and marine water, wherein freshwater mixes with seawater. The aquifer’s waters are primarily bicarbonate-calcium (HCO3-Ca), while those of the salt wedge are characterised by chlorinated-sodium (Cl-Na).
Infiltration inside the Yucatan aquifer is critical and serves as its primary source of recharge. Given the karstic characteristics of the region and the development of secondary permeability due to the dissolution of limestone, the rainwater that permeates the aquifer system and the water–rock interactions, which involve mineral dissolution, influence the water’s properties, leading to elevated concentrations of Ca, Mg, and bicarbonates that may occasionally surpass the acceptable hardness thresholds for water supply [47]. The aforementioned qualities render the Yucatan aquifer particularly susceptible to groundwater contamination (wells and cenotes), exacerbated by economic activities such as agriculture and cattle farming, which serve as sources of pollution.
At the same time, the Yucatan aquifer is the largest reservoir of freshwater in Mexico; according to official data from the National Water Commission, it has a natural recharge of 21,813 hm3/yr with an annual availability of 2386.82 hm3/yr [48]. However, it is particularly vulnerable to contamination from agricultural practices, including pig farming. Figure 2 illustrates the geographical distribution of the Yucatan aquifer, which comprises three southern states of Mexico: Campeche, Yucatan, and Quintana Roo. Additionally, sinkholes connected with the Ring of Cenotes are indicated (marked by the green dots). The white arrows in the figure depict the main direction of the regional groundwater flow [47]. The entire state of Yucatan is encompassed by the aquifer.
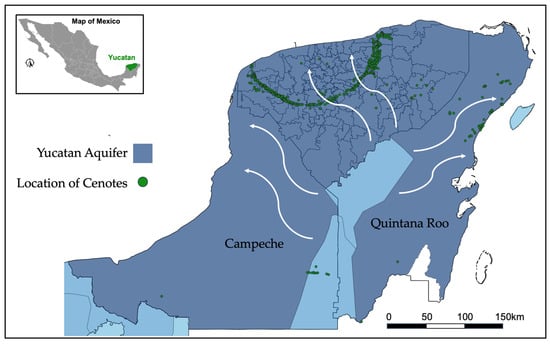
Figure 2.
Geographical location of the Yucatan aquifer and the Ring of Cenotes (shown by green dots and main regional groundwater flow: white arrows).
2.2. Pig Farms in Yucatan
The state of Yucatan ranks as the third-largest national producer of pork, resulting in a proliferation of pig farms around the region, varying in scale from tiny operations to large-scale facilities housing over 30,000 pigs each. However, until the year 2023, there was no Federal or state record regarding the number and scale of pig farms installed. Furthermore, recent studies indicate that the substantial volumes of wastewater generated by their operations are inadequately treated, resulting in water pollution and environmental damage [49]. This has sparked an increasing movement against industrial pig farms in Yucatan, motivated by social and environmental concerns [50]. The main objection stems from the intention to preserve the aquifer and advocate for sustainable agricultural practices.
Consequently, the Secretariat of Environment and Natural Resources of the Federal Government of Mexico resolved to conduct a census on the number of farms and pigs per farm at the local level. This provides an initial assessment of the geographical extent of this activity on the state and its impact on aquifer contamination [51]. Results from this work identified as many as 506 geographical locations in the state with pig farms. The census detailing the number of pigs per farm was developed in partnership with the state’s swine production sector, identifying 120 active pig farms with varying pig populations. Figure 3a Illustrates the geographical distribution of pig farms throughout the Yucatan state, marked by red dots. For clarity, the political division of municipalities is also depicted; the colour scale represents pig density per hectare and municipality. In addition, Figure 3b presents the geographical location of pig farms alongside the pig density per capita in each municipality of Yucatan. According to this database, in 2023, the total number of pigs in the Yucatan state was 584,702.
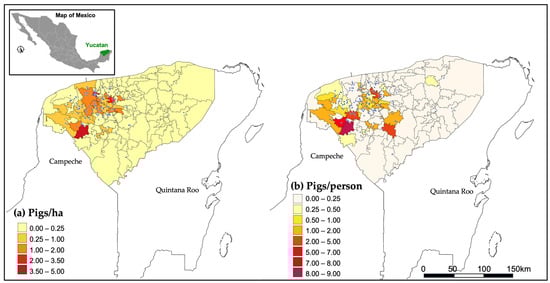
Figure 3.
In Yucatan: (a) pigs/hectare by municipality and (b) pigs/person by municipality; blue dots in both panels show location of pig farms.
2.3. Methodology
This study employs an integrated approach that involves acquiring water quality measurements from selected wells and cenotes to assess the current water quality in the state. Additionally, in collaboration with representatives from the state’s swine sector, 10 distinct industrial farms were chosen for an analysis of their water discharge. The selection of these farms was based on their possession of an official wastewater discharge permit and the implementation of operational treatment systems. They were also amenable to revising their treatment system for further modifications if required. Another criterion for selecting this set of farms was their spatial dispersion; hence, some farms were situated near areas of environmental fragility, such as the Ring of Cenotes. The exercise was completely voluntary for the swine sector seeking to achieve water sustainability in their operations. This was conducted to assess the sector’s compliance with environmental regulations. Finally, utilising the pig population record in Yucatan, this study provides an estimation of the nitrogen greywater footprint for this sector by municipality, together with the corresponding water pollution levels. This is done to establish a classification that facilitates the determination of water sustainability thresholds, which define the suitability of establishing new pig farms in each municipality within the state.
2.3.1. Measurements of Water Quality in Wells and Cenotes
A field campaign was conducted to evaluate the water quality features of the Yucatan’s aquifer. For this, several samples were taken in groundwater wells and cenotes in the state with particular emphasis on the physicochemical and microbiological parameters. The selection of wells and cenotes sampled in this study was conducted with the following considerations: Static water level, flow orientation (radial, directed towards the coast) and proximity to swine operations (taking into account the population of pigs housed). The chosen 22 water wells and 19 cenotes are extensively scattered, encompassing regions that vary according to their level of exposure to human activity, specifically, non-affected, semi-urban regions with pig industry presence, urban regions, urban regions with pig industry presence, and coastal regions. The diverse selection of sites provides a distinct characterisation, distinguishing locations influenced by the pig industry, as well as urban, semi-urban, and remote regions.
Figure 4a illustrates selected cenotes for the field sampling of water quality (green dots) alongside the cenotes belonging to the Ring of Cenotes system (blue dots) and the location of nearby pig farms in the region (red diamonds). Photographic evidence of the cenotes is also depicted.
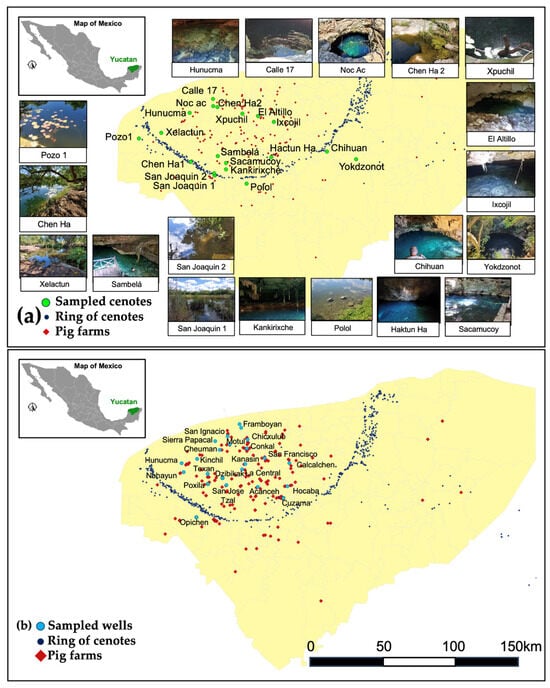
Figure 4.
Geographical location of sampled wells (a) and cenotes (b) in Yucatan alongside pig farms (red diamonds) and cenotes belonging to the Ring of Cenotes system (darker blue dots).
The sampled cenotes are categorised according to the orientation of regional flows; six are situated in the northwest zone (Pozo1, Hunucma, Calle 17, Noc ac and Chen Ha2), three in the east zone (Xpuchil, El Altillo and Ixcojil), six in the south zone (Chen Ha1, San Joaquin 2, San Joaquin 2, Sambela and Sacamucoy), and four in a designated reference zone (Polol, Hactun ha, Chihuan, Yokdzonot), where the influence of pig farms is less significant. On the other hand, Figure 4b presents the geographical location of wells revised for water quality (light blue dots) alongside the cenotes belonging to the Ring of Cenotes system (blue dots) and the location of nearby pig farms in the region (red diamonds).
The sample collection procedure for water wells adhered to the requirements of the Mexican norm [52], which outlines the sanitary protocols for sampling and the techniques for sample collection in relation to environmental health and water for human consumption. The evaluation of cenotes was performed in accordance with standard [53], which outlines comprehensive criteria and recommendations for sampling in surface water bodies to determine their physical, chemical, and bacteriological characteristics.
The parameters pH, electrical conductivity (EC), temperature, total dissolved solids (TDSs), dissolved oxygen (DO), and salinity in cenotes were measured using a calibrated and verified multiparametric probe. An isolation cell was utilised for these well-related metrics.
For parameters such as total phosphorous, ammoniacal nitrogen, NO3, nitrite nitrogen, chlorides, colour, biochemical demand of oxygen, chemical oxygen demand, sulphate ions, fluorides, Ca, Mg, K, Na, total coliforms and E. coli, samples were collected and analysed at the water quality laboratory of the Mexican Institute of Water Technology, accredited by the Mexican Accreditation Entity, A.C. (EMA) and approved by the National Water Commission (CONAGUA), in compliance with the stipulations of Standard [54], which verifies that the laboratory and its personnel fulfil the technical competence criteria for delivering technically valid test results. These parameters were analysed for the water samples from the 22 wells and 19 cenotes.
2.3.2. Monitoring of Wastewater Effluents in Industrial Pig Farming
In partnership with the Secretariat of Sustainable Development of Yucatan and the state’s swine sector, ten pig farms engaged in breeding, weaning, fattening, or complete cycles with operational treatment systems were selected to assess their wastewater discharge and compliance with environmental regulations.
Some of the selected farms are situated near environmentally sensitive areas, such as Ramsar sites, whereas others are located at a considerable distance from these vulnerable regions. Table 1 presents the farms that consented to participate in this exercise, along with additional information regarding farm type and discharge volume. The sampling of all pig farms occurred in October 2022.

Table 1.
Summary characteristics of farms in which effluent was monitored in this study.
A comprehensive examination of the wastewater treatment system was performed at each farm. The tour was led by representatives from the environmental sector alongside personnel from the farm being visited. A questionnaire was distributed to collect data on the farm and the treatment system. The wastewater treatment systems in the chosen pig farms consisted of a pumping station that collects all wastewater, one or more biodigesters with retention times of approximately 30 days, a facultative lagoon, and a disinfection system comprising a contact tank for chlorine dosing.
Samples were obtained from four locations within the treatment system during the visit, including (1) Pumping station for raw water. (2) Effluent from the anaerobic biodigester. (3) Effluent from the stabilisation lagoon or lagoon system. (4) Effluent from the contact tank.
The wastewater treatment systems employed by the ten participating farms predominantly adhere to this treatment sequence, exhibiting minor variations. Certain farms incorporate processing units for the separation of suspended solids, employing mechanised methods (e.g., drums or rotating screens) or hydraulic systems (i.e., solid separation tanks). All treatment facilities analysed incorporate the four stages of treatment relevant to sampling. Wastewater samples were collected instantaneously, as wastewater is delivered in pulses. More precisely, flow occurs during the washing (flushing) of pig excreta rather than being continuous throughout the day. Each sump has sufficient storage capacity to hold the washings (flushes) produced during roughly 24 h of pig farm operation, thus functioning as a homogenisation tank. Figure 5 illustrates the geographical distribution of selected pig farms within the state of Yucatan (brown dots) alongside sampled cenotes (green dots) and cenotes belonging to the Ring of Cenotes system (blue dots).
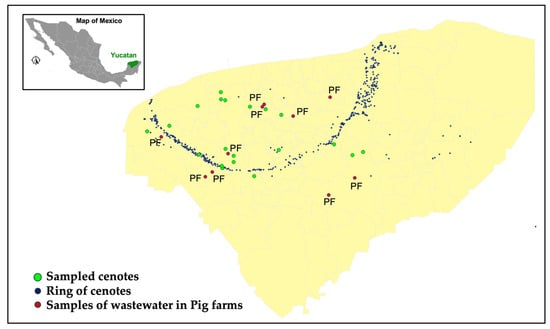
Figure 5.
Geographical location of sampled effluents in selected pig farms (red dots); blue dots: cenotes belonging to the Ring of Cenotes system and green dots: locations of sampled cenotes.
At each sampled location, the parameters stated in the environmental norm [55] were analysed; these are temperature, pH, and colour obtained from direct measurements; biochemical demand of oxygen (BDO) using a traditional BOD5 analysis; chemical oxygen demand (COD), total phosphorus, and total nitrogen using UV-Vis spectroscopy; fats and oils measured through a validated gravimetric method using water–fat extraction; total suspended solids measured through a gravimetric approach, and toxicity evaluation using a bioassay employing a specific technique associated with Vibrio fischeri.
The samples were taken and preserved in compliance with the relevant Mexican Standards (NMX) for water analysis. The samples were also analysed at an accredited Water Quality laboratory of the Mexican Institute of Water Technology.
It is important to clarify that the effluent measurements at the ten pig farms were not performed to evaluate the greywater footprint of these facilities. This assessment was performed to ascertain whether the farms selected by the swine industry complied with environmental standards. Furthermore, a new regulation establishing a more severe standard for this category of effluents recently went into effect in Mexico.
2.3.3. Definition of Nitrogen Greywater Footprint and Water Pollution Level Linked to Pig Farms at the Municipality Level
The main environmental concern associated with pig farms in Yucatan is the pollution of the karst aquifer. The increasing number of pig farms in the state has caused social concerns regarding water quality degradation, highlighting the necessity to regulate this activity to safeguard the aquifer’s water quality. An adult pig generates, based on its size and weight, between four and ten times the waste produced by an adult human [56], prompting careful consideration of this activity.
Many nations worldwide have implemented governmental policies to promote the advancement of ecologically sustainable business practices for this industry. The focus concerning pig farms is on setting pollution criteria, particularly with the nitrogen and phosphorus concentrations in animal manure [57,58]. The levels of nitrogen and phosphorus in aquatic ecosystems are identified as one of the nine planetary boundaries that require our attention to achieve environmental sustainability [59].
Anthropogenic loads of these elements are defined by inputs from agriculture, domestic, and industrial sources. According to [42], it is possible to define the anthropogenic loads of nitrogen and phosphorus to the environment through the concept of greywater footprint (GWF), namely:
where Load represents the nitrogen generated in pig manure, measured in kg/yr, while Cnat =1.5 mg/L indicates the natural nitrogen concentration in the Yucatan aquifer, particularly in regions with minimal anthropogenic impact (estimated from the average nitrogen concentration of 20 pristine cenotes).
GWF = Load/(Cmax − Cnat)
Ref. [58] estimates the average nitrogen load at 18 kg/year per pig. Pig manure contains nitrogen, phosphate, and potassium; nevertheless, nitrogen has the greatest contaminant load. Thus, the greywater footprint methodology in this research is developed utilising data related to this pollutant.
On the other hand, the water pollution level (WPL) can be defined as the ratio of nitrogen load to the natural flow of the water aquifer. Given the absence of surface flows in Yucatan, this flow corresponds to the natural recharge value for the aquifer, thus:
where RMU represents the unitary recharge per municipality in the state of Yucatan. The official data indicate that the yearly aquifer recharge is 21,813 hm3/yr. Assuming the aquifer covers a surface area of 124,409 km2, the state’s unitary recharge is RU = 175,336 m3/km2. Multiplying this unitary value by the area of each municipality in square kilometres will yield the RMU, which enables the evaluation of water renewal capacity at the municipal level.
WPL = GWF/RMU
Consequently, if WPL > 1, it indicates that the municipality is experiencing a condition of water unsustainability due to the manure load from pigs raised inside its boundaries. This suggests that the aquifer’s water renewal capacity has been exceeded, resulting in the accumulation of nitrogen and the degradation of water quality.
As shown in (Equation (1)), to evaluate the degree of water contamination at the municipal level, it is essential to establish a maximum nitrogen concentration threshold for the aquifer and the state’s cenotes (Cmax). Ref. [60] provided for nitrogen in rivers a Cmax value of 3.0 mg/L. In this study, the results of this proposed value and another one are more permissive (Cmax = 10 mg/L) to see the sensitivity of the results to this variable.
3. Results and Discussion
This section will present the findings regarding water quality measurements in wells and cenotes, providing a summary of the current condition of water quality in the aquifer. Furthermore, findings from the analysis of wastewater discharges from selected pig farms will be presented to determine the industry’s adherence to environmental regulations. Additionally, the nitrogen greywater footprint and water contamination levels by municipality will be provided. Ultimately, thresholds for water sustainability that determine the suitability for establishing additional pig farms in each municipality within the state will be presented.
3.1. Water Quality in Wells and Cenotes
Results for the main parameters measured in the 22 wells are shown in Table 2, specifically for pH, electric conductivity, dissolved oxygen, and temperature. The pH measurements for the sampled wells range from 5.8 to 8.2 UpH, with an average of 7.1 UpH, demonstrating that these values are within the acceptable range.
Electrical conductivity (EC) measures the concentration of dissolved salts or ionic activity in a solution, indicating its capacity to conduct electricity, which varies with temperature and is intrinsically associated with the characteristics of the dissolved materials. EC is recognised as a surrogate for total dissolved solids (TDSs) [61,62]. The conversion factor for waters within the Yucatan aquifer may vary between 0.50 and 0.75 due to its karstic characteristics. In this study, a standard conversion factor of 0.71 is used, as it is frequently utilised in research [63,64]. The EC values reported for selected wells vary from 744 to 3908 (µS/cm), corresponding to a TDS range of 528 to 2775 ppm. Elevated levels of electrical conductivity are observed in wells situated southwest of Merida and near the coast, indicating a significant presence of dissolved salts in these regions. Conversely, values decrease significantly in wells situated to the east of Merida.
Table 2.
Overview of primary parameters measured in situ for water wells in Yucatan. Note: EC and TDS values indicated in red exceed the permissible limit for drinking water, as determined by the Mexican standard [65].
Table 2.
Overview of primary parameters measured in situ for water wells in Yucatan. Note: EC and TDS values indicated in red exceed the permissible limit for drinking water, as determined by the Mexican standard [65].
| No. | Well Name | pH | EC (µS/cm) | TDS (ppm) | Dissolved Oxygen (mg/L) | T (°C) |
|---|---|---|---|---|---|---|
| 1 | Franboyan | 8.2 | 1577.4 | 1119.9 | 2.0 | 28.2 |
| 2 | Chicxulub | 7.1 | 1150.5 | 816.8 | 2.9 | 28.4 |
| 3 | Conkal | 7.3 | 1125.6 | 798.8 | 7.4 | 27.5 |
| 4 | Sierra Papacal | 7.1 | 2432.5 | 1727.1 | 1.7 | 29.8 |
| 5 | San Ignacio | 7.0 | 3908.0 | 2774.7 | 1.8 | 28.2 |
| 6 | Cheuman | 7.5 | 1709.5 | 1213.7 | 5.2 | 27.8 |
| 7 | Kanasin | 7.0 | 1166.5 | 828.2 | 5.0 | 27.4 |
| 8 | La Central | 7.2 | 1185.4 | 841.6 | 5.7 | 28.5 |
| 9 | Acanceh | 7.1 | 1148.6 | 815.5 | 6.3 | 27.4 |
| 10 | Cuzama | 7.1 | 1142.4 | 811.1 | 7.7 | 28.8 |
| 11 | Hocaba | 7.0 | 1199.2 | 851.4 | 5.5 | 27.4 |
| 12 | Opichen | 5.8 | 2990.0 | 2122.9 | 6.6 | 28.2 |
| 13 | Poxila | 7.0 | 1737.3 | 1233.5 | 4.1 | 27.8 |
| 14 | Dzibikak | 7.0 | 968.8 | 687.8 | 3.2 | 27.7 |
| 15 | Texan Palomeque | 6.9 | 1135.8 | 806.4 | 4.2 | 27.6 |
| 16 | Hunucma | 7.0 | 1366.4 | 970.1 | 4.2 | 27.6 |
| 17 | Kinchil | 7.1 | 1813.8 | 1287.8 | 4.7 | 27.8 |
| 18 | Nohuayun | 7.1 | 1683.2 | 1195 | 3.9 | 28.4 |
| 19 | San Jose Tzal | 7.0 | 1371.1 | 973.5 | 5.9 | 28.6 |
| 20 | Cacalchen | 7.4 | 744.0 | 528.2 | 7.4 | 29.4 |
| 21 | Motul | 7.0 | 1076.0 | 763.9 | 6.1 | 27.5 |
| 22 | San Francisco | 6.9 | 1265.6 | 898.6 | 4.9 | 27.4 |
On the other hand, levels of dissolved oxygen in the groundwater of Yucatan are primarily determined by the region’s karst geology, the mixing of different water sources, and the hydrological dynamics influenced by rainfall and climatic events. The solubility of oxygen in freshwater ranges from 14.6 mg/L at 0 °C to roughly 7 mg/L at 35 °C under 1 atm pressure. In saline conditions, the solubility of oxygen is diminished. This explains why wells situated near the coast and north of Merida exhibit low dissolved oxygen levels.
In the evaluation of water quality in the 19 selected cenotes, we examined in situ field parameters, including electrical conductivity (EC), temperature, and salinity, as well as physicochemical parameters, such as chlorides, biochemical oxygen demand (BOD), chemical oxygen demand (COD), sulphate ions, total dissolved solids (TDSs), and turbidity.
The analysis examined the presence of minerals, including fluorides, Ca, Mg, K, and Na, along with microbiological parameters, such as total coliforms and Escherichia coli. We also quantified variables such as fats and oils and active chemicals in Methylene Blue; however, the recorded values were below the method’s quantification limit and are therefore not reported.
In consideration of their presence in pig manure, we also quantified nitrite nitrogen, ammoniacal nitrogen, and total phosphorus, comparing the recorded values with those specified in the National Water Commission’s water quality criteria for the safeguarding of aquatic life. Table 3 provides a summary of all reported values for these parameters in all cenotes.
Table 3.
Summary of all reported values for field parameters, nutrients, physicochemical, minerals, and microbiological parameters in cenotes.
Figure 6 presents the reported values across all cenotes, a geographical distribution, ammoniacal nitrogen, nitrite nitrogen, and total phosphorus. Pig farming activities directly correlate with results concerning ammoniacal nitrogen, NO3, and total phosphorous, as these elements are present in pig manure. The cenotes located in the northeast zone, where regional groundwater flows, have the most impaired water quality.
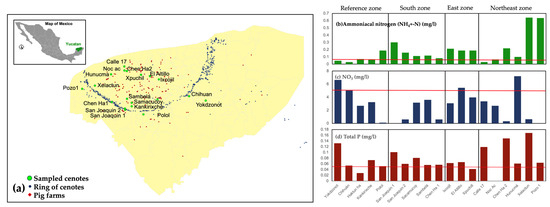
Figure 6.
Measured values across all cenotes. (a) Geographical location. (b) Results for ammoniacal nitrogen; (c) results for nitrite nitrogen; (d) results for total phosphorus; horizontal red line depicts in all panels the permissible limit defined in the norm.
The observed concentrations of ammoniacal nitrogen are not solely attributable to pig farms; they are likely also affected by municipal wastewater discharges, particularly from the city of Merida. However, the existence of industrial pig farms exacerbates the contamination of the aquifer and necessitates regulation and oversight.
To evaluate the impact of pig farms on ammoniacal nitrogen concentration, cenotes were situated upstream and downstream of the major flow direction in the aquifer, considering the regional subterranean flow. Figure 7 illustrates the results with a detailed view of the geographical region of interest, highlighting the locations of the pig farms, the sampled cenotes, and the prevailing regional flow direction (i.e., north). The inner panel of this figure illustrates the concentration of ammoniacal nitrogen in the Kankirixche cenote, situated upstream of five pig farms housing over 2000 pigs each, which adheres to environmental regulations. In contrast, the concentrations downstream of the farms fail to meet environmental standards, exceeding permissible limits by more than 1.5 times. This result suggests that industrial pig farms contribute to increased pollution.
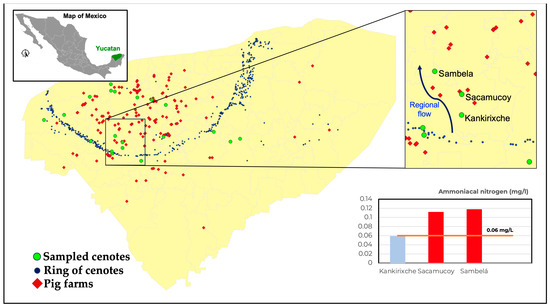
Figure 7.
Detailed geographical view highlighting the locations of the pig farms (red diamonds), sampled cenotes (green dots), and cenotes belonging to the Ring of Cenotes system (blue dots). The insert shows results of ammoniacal nitrogen for Kankirixche cenote located upstream the regional flow (blue arrow) and cenotes Sacamucoy and Sambelá located downstream the flow.
Conversely, Figure 6c illustrates the quantities of nitrates measured in the same cenotes; the horizontal red line depicts the permissible limit (5.0 mg/L) set forth in the water quality recommendations for urban public supply sources. The findings demonstrate that nitrate concentrations predominantly adhere to environmental regulations, attributable to the assimilation of nitrates in cenotes with hydrophilous and riparian vegetation, which then re-enter the food chain. Thus, in this instance, there is no discernible dominant zone for the element’s existence.
Figure 6d provides the data for total phosphorus concentrations, with the horizontal red line denoting the regulatory allowed limit for the protection of aquatic life for this chemical (0.05 mg/L). Results reveal that nearly all cenotes surpass the stated limit, indicating a regional issue of excessive phosphorus in the aquifer that requires attention.
The results in this section concerning samples from wells and cenotes show a diffuse contamination process. Cenotes specifically show signs of pollution from fresh organic waste, mainly derived from diffuse sources of animal effluent, such as pig farms, leading to a prevalence of ammoniacal nitrogen. In summary, the intensive pig farming practices in the Yucatan Peninsula contribute significantly to water contamination through nutrient runoff.
3.2. Wastewater Effluents in Industrial Pig Farms
To ascertain whether the wastewater effluents from large pig farms comply with the pollutant limits specified in Mexican environmental rules, ten farms were selected in collaboration with the state’s pig sector, employing a comparable treatment train of four treatment steps. Wastewater samples were collected instantaneously, rather than being aggregated over time. At each sampled location, the parameters of the norm, including spectral analysis, toxicity, E. coli levels, and helminth eggs, were assessed.
Table 4 presents the results collected from the 10 examined farms, encompassing temperature, pH, colour, biochemical demand of oxygen, chemical demand of oxygen, total phosphorous, fats and oils, total nitrogen, total suspended solids, and toxicity. The table displays values compliant with environmental regulations in black figures, while those in red signify failure to comply. As it is shown, the effluents from pig farms comply with environmental regulations only regarding temperature, pH, and, in most instances, fats and oils. The permissible limits for COD are exceeded by a factor of 7 to 144, while total nitrogen limits are exceeded by a factor of 24 to 1000. Furthermore, parameters including total phosphorus, total suspended solids, and toxicity are also above environmental regulations. All analysed effluents do not comply with official standards, thereby contributing to regional water pollution.
Table 4.
Results of wastewater quality parameters of 10 pig farm final effluents; red numbers indicate lack of compliance with environmental norms.
The non-compliance with environmental regulations concerning water quality in the sampled cenotes and wells, along with the data from pig farm effluents, highlights the critical need to manage and regulate the establishment of more pig farms in Yucatan. Moreover, the urgent obligation to rehabilitate wastewater treatment systems of revised pig farms is evident.
3.3. Evaluation of Nitrogen Greywater Footprint and Water Pollution Level Linked to Pig Farms at the Municipality Level
To preserve the Yucatan aquifer and promote water sustainability within the swine industry, evidence-based criteria are suggested for the establishment of new pig farms in the state. We utilised the municipal-level census of pig farms to calculate the greywater footprint of nitrogen associated with the pig population while also assessing the water pollution level at the municipal level.
Calculating the nitrogen greywater footprint of pig manure was the first step in determining the water pollution level (WPL) generated by pig farms at the municipal level. To determine the amount of nitrogen produced by pigs in each municipality (load in Equation (1)), multiply the average yearly nitrogen production of 18 kg per pig [58] by the number of pigs in each municipality. The nitrogen content in pig manure may fluctuate based on the type and size of pigs on a farm; however, this average value is utilised to produce an initial estimate, serving as an indicator of pig farms’ contribution to groundwater pollution per municipality.
After establishing the nitrogen load, it is essential to determine the maximum concentration value of this element in the aquifer (Cmax in Equation (1)). Subsequently, two values were evaluated for this concentration, the first being the value suggested by [60] with Cmax = 3.0 mg/L, which is double the natural concentration established in this work. However, because there are more livestock operations in the state that contribute to the nitrogen load in the groundwater, a different calculation was taken into consideration with a Cmax = 10 mg/L. This revised estimate accounts for additional nitrogen contributions to the aquifer from other livestock activities. Thus, once the Load and Cmax are established, it is possible to determine the greywater footprint of nitrogen attributable to swine activities at the municipal level over the entire state.
To determine the water pollution level per municipality, Equation (2) is utilised with the nitrogen GWF estimated and the unitary recharge. The flow variable is calculated for each municipality in the state of Yucatan by multiplying the unitary recharge for the aquifer (total recharge/area of the state) by the area of each municipality. This is given that there are no surface flows in the state. Naturally, the municipalities with the most pigs will also have the largest nitrogen greywater footprint. Water renewal capacity in the aquifer is determined by the water pollution level; if WPL < 1, pig farming activities remain within sustainable water limits; if WPL > 1, they are unsustainable, leading to nutrient overload and nitrogen accumulation that deteriorates water quality.
Figure 8 illustrates the findings for WPL across 51 municipalities with pig farms, based on a Cmax = 3.0 mg/L. Municipalities practising sustainable pig farming are illustrated by green (WPL < 0.3), light green (0.3 < WPL < 0.5), and yellow colours (0.5 < WPL < 1), whereas those where pig farming surpasses the aquifer’s water renewal capacity are indicated by orange (1 < WPL < 2), red (2 < WPL < 5), dark red (5 < WPL < 10), and burgundy (WPL > 10). Municipalities with no pig farms are shown in grey. The findings reveal that 26 municipalities within the state, among the 51 engaged in this industry, encounter very critical conditions regarding the water sustainability of the Yucatan aquifer, specifically those with WPL > 2.0. In these municipalities, nitrogen produced by pigs clearly exceeds the water renewal capacity, thereby compromising water quality in the aquifer. Moreover, four municipalities are identified as requiring urgent attention, with 2 < WPL < 1. Lastly, 21 municipalities exhibit a WPL < 1, which indicates conditions of water sustainability.
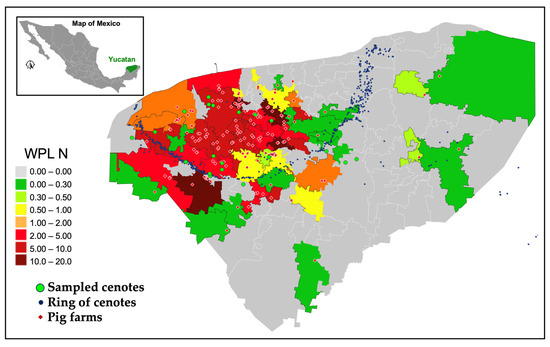
Figure 8.
Nitrogen water pollution level (WPL) per municipality estimated using Cmax = 3.0 mg/L; grey areas identify municipalities with no presence of swine industry.
Conversely, Figure 9 illustrates the outcomes for Cmax = 10 mg/L, indicating municipalities with sustainable swine activity in green (WPL < 0.3), light green (0.3 < WPL < 0.5), and yellow (0.5 < WPL < 1), while those where swine activity surpasses the aquifer’s water renewal capacity are marked in orange (1 < WPL < 2), red (2 < WPL < 5), and dark red (5 < WPL < 10). The results indicate reduced values in the estimated WPL for the 51 municipalities within the state that have swine industry operations. Despite taking into account an increased Cmax value, it is possible to identify communities exhibiting a water contamination level (WPL > 1), which suggests the unsustainability of this activity for the Yucatan aquifer.
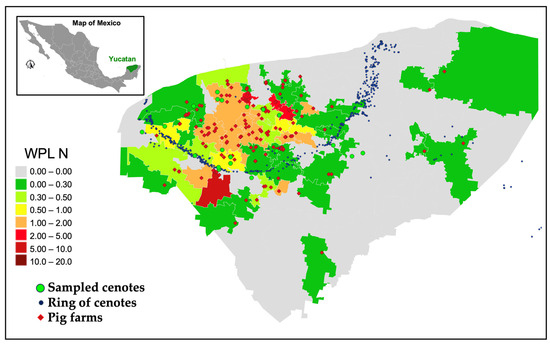
Figure 9.
Nitrogen water pollution level (WPL) per municipality estimated using Cmax = 10.0 mg/L; grey areas identify municipalities with no presence of swine industry.
These findings reveal that four municipalities in the state, out of the 51 engaged in this industrial activity, exhibit severely critical conditions for the water sustainability of the Yucatan aquifer, indicated by a WPL > 2. The findings suggest that for these four municipalities, the authorisation of permits for the establishment of this economic activity in the area should be stopped since it surpasses the nitrogen assimilation capacity of the aquifer by at least double. Conversely, 11 municipalities requiring immediate care are recognised with values ranging 1 < WPL < 2 (orange), while 36 municipalities fall within the sustainable thresholds for this economic activity (WPL < 1).
3.4. Criteria for Sustainable Growth in the Swine Industry
Once the WPL per municipality has been obtained, it becomes feasible to identify municipalities necessitating urgent intervention and those where pig farming can occur without posing a contamination risk to the aquifer.
Authors have proposed sustainability restrictions for the pig industry to facilitate environmental conservation and water quality preservation [66]. In China, a nation characterised by substantial pork consumption and production, the idea of a greywater footprint is increasingly employed to delineate this threshold [67]. In European nations like the Netherlands and Denmark, recognised as significant pork exporters, the establishment of these limits is deemed urgent from an environmental perspective. Recent studies advocate for the utilisation of the number of pigs per hectare at the municipal level, which is a crucial parameter to consider [68,69]. Indeed, a proposed solution in locations with significant pork production is to decrease overall meat production, which again suggests a drop in pig density to release fewer nutrients per unit of land compared to current levels [70]. This clearly involves a limitation on the density of pigs raised per unit area, which is one of the objectives of this study. Conversely, it has been noted that industrialised pig farms prioritise adherence to environmental standards, which leads to frequently neglecting to recognise the necessity for enhancements in production processes [71]. It is unsurprising that most initiatives directed towards achieving or assessing the sustainability of pig farms concentrate on specific operations, advocating enhancements in feed composition, technological efficiency, worker productivity, farm profitability, and risk management [72,73,74]. Consequently, it is the responsibility of local and national governments to assess the cumulative effects of various farms on regional sustainability.
Sustainability standards are now integral to corporate social responsibility [75]. The requirements aim to illustrate a commitment to social equity and environmental conservation, along with the mitigation of related challenges [76]. Governments and non-governmental organisations (NGOs) have advocated for the adoption of standards; however, in certain instances, it remains unclear whether they fulfil their obligations to environmental conservation [77]. Their adoption generally enhances farming practices that foster soil fertility and water conservation and promote biodiversity while simultaneously decreasing environmentally destructive practices. With pig farming operations, studies are mostly focused on the water use of animal products [78].
Sustainability certification may allow local, regional, national, and international organisations representing user communities to assert claims and negotiate for the protection of their water resources and livelihoods [79]. Most studies, however, concentrate on the plot or farm level, failing to account for potential environmental spillovers and landscape-wide effects [80].
Therefore, it is imperative to establish criteria for sustainable production continuity at a regional scale. This study provides criteria for evaluating the water sustainability of the pig industry at the municipal level. These metrics offer production caps that can be adjusted to the environmental conditions of different countries to achieve the sustainability of pig production and can be used to establish water sustainability standards. The two metrics are the density of pigs per hectare and the water pollution level (WPL). The sustainable thresholds for the parameters Pigs/ha and WPL are established to ensure that the aquifer’s water renewal capacity is not surpassed, specifically WPL < 1.1 and Pigs/ha = 1.0. These parameters facilitate the visualisation and classification of municipalities regarding their water sustainability in pig farming. Research demonstrates that governments have utilised many strategies to reduce pollution from pig farms, including the relocation of pig operations, the implementation of pig-cooling systems, zero-waste discharge initiatives, and circular economic models [23,81,82]. This study represents the first example in which guidelines were developed in collaboration with federal and state governments to oversee the expansion of a significant economic activity while preserving the aquifer’s water quality. Additionally, it mitigates potential landscape-level impacts on groundwater contamination resulting from intensive pig farming. In municipalities where WPL > 2, the recommendations include reducing pig density, halting permits for new pig farms, and assessing the adequacy of wastewater treatment facilities at existing farms. In municipalities where 1.1 < WPL < 2.0, it is necessary to upgrade wastewater treatment facilities to meet environmental standards. Furthermore, it was resolved that in towns with high population density, such as Merida and Kanasin, permits for the establishment of new pig farms will be halted.
4. Conclusions
This study presented a comprehensive approach to establishing water sustainability criteria for the establishment of new pig farms in the most important karst aquifer in Mexico. This involved analysing pig farm data and pig populations at the municipal level throughout the state, along with obtaining water quality measurements from specified wells and cenotes to assess the current water quality. Furthermore, to assess the adherence of pig farms to environmental regulations in the state, we evaluated the effluents of 10 selected pig farms within the swine sector. Finally, to ascertain the water sustainability of this activity, we estimated nitrogen greywater footprint and water pollution levels for this sector per municipality.
It was shown that water quality in cenotes indicated an issue of ammoniacal nitrogen pollution, with the most significant contamination in the northwest region, where contamination levels exceed permissible limits by up to tenfold. This phenomenon was related to the aquifer’s regional flow, which predominantly flows northward, facilitating the transport of contaminants in that direction. It was demonstrated that the existence of industrial pig farms exacerbates the contamination of the aquifer and needs regulation. In relation to phosphorous, results revealed that nearly all cenotes surpass the stated limit, indicating a regional issue of excessive phosphorus in the aquifer that requires attention. Therefore, a diffuse contamination process was verified. Cenotes specifically show signs of pollution from fresh organic waste, mainly derived from diffuse sources of animal effluent, such as pig farms, leading to a prevalence of ammoniacal nitrogen. In summary, the intensive pig farming practices in the Yucatan Peninsula contribute significantly to water contamination through nutrient runoff.
The non-compliance with environmental standards regarding pig farm effluents was demonstrated, resulting in the direct release of pollutants into the environment. This underscored the urgent necessity to control and regulate the establishment of more pig farms in Yucatan. Furthermore, the imperative to rehabilitate wastewater treatment systems in pig farms is clear.
This study provided evidence-based indicators to determine the water sustainability of the pig industry at the municipal level: the density of pigs per hectare and the water pollution level (WPL). The sustainable thresholds for the parameters, Pigs/ha and WPL, were established to ensure that the aquifer’s water renewal capacity is not surpassed, specifically WPL < 1.1 and Pigs/ha = 1.0. Notably, these standards were established in collaboration with federal and state governments to regulate the expansion of significant economic activity while preserving the aquifer’s water quality. These actions comprise better management practices to balance economic benefits with environmental preservation.
It should be noted that this type of investigation has not been undertaken in Mexico; thus, it is expected that the guidelines will be beneficial to other state authorities responsible for controlling this economic activity.
Author Contributions
A.P.-A., writing—original draft preparation. Conceptualization, methodology was carried out by A.P.-A. and N.R.-S., C.V.-B., data acquisition and curation. All authors have read and agreed to the published version of the manuscript.
Funding
This research received no external funding.
Data Availability Statement
Data available in a publicly accessible repository. The original data presented in the study are openly available at Zenodo link: https://doi.org/10.5281/zenodo.14813467.
Acknowledgments
We gratefully acknowledge the great support of our field technicians, Jorge Izurieta, Juan García, and Erik G. González.
Conflicts of Interest
The authors declare no conflicts of interest.
Abbreviations
The following abbreviations are used in this manuscript:
| GWF | Greywater footprint |
| WPL | Water pollution level |
| EC | Electric conductivity |
| COD | Chemical oxygen demand |
| TSSs | Total suspended solids |
| TDSs | Total diluted solids |
| PT | Total phosphorous |
| BDO | Biochemical demand of oxygen |
References
- Govoni, C.; Chiareli, D.D.; Luciano, A.; Pinotti, L.; Rulli, M.C. Global assessment of land and water resource demand for pork supply. Environ. Res. Lett. 2022, 17, 074003. [Google Scholar] [CrossRef]
- Wu, L.; Gong, X.; Chen, X.; Hu, W. Compromise effect in food consumer choices in China: An analysis on pork products. Front. Psychol. 2020, 11, 1352. [Google Scholar] [CrossRef]
- Rulli, M.C.; D’Odorico, P.; Galli, N.; Hayman, D.T. Land-use change and the livestock revolution increase the risk of zoonotic coronavirus transmission from rhinolophid bats. Nat. Food 2021, 2, 409–416. [Google Scholar] [CrossRef]
- Hoekstra, A.Y.; Mekonnen, M.M. The water foot print of humanity. Proc. Natl. Acad. Sci. USA 2012, 109, 3232–3237. [Google Scholar] [CrossRef]
- Oki, T.; Kanae, S. Global Hydrological Cycles and World Water Resources. Science 2006, 313, 1068–1072. [Google Scholar] [CrossRef]
- Steinfeld, H.; Gerber, P.; Wassenaar, T.; Castel, V.; Rosales, M.; de Haan, C. Livestock’s Long Shadow; FAO: Rome, Italy, 2006; Available online: http://www.fao.org/docrep/010/a0701e/a0701e00.HTM (accessed on 6 October 2024).
- Schröder, J.J. Revisiting the agronomic benefits of manure; A correct assessment and exploitation of its fertilizer value spares the environment. Bioresour. Technol. 2005, 96, 253–261. [Google Scholar] [CrossRef]
- Sims, J.T.; Bergström, L.; Bowman, B.T.; Oenema, O. Nutrient management for intensive animal agriculture: Policies and practices for sustainability. Soil Use Manag. 2005, 21, 141–151. [Google Scholar] [CrossRef]
- Menzi, H.; Oenema, O.; Burton, C.; Shipin, O.; Gerber, P.; Robinson, T.; Franceschini, G. Impacts of Intensive Livestock Production and Manure Management on the Environment. In Livestock in a Changing Landscape, Volume 1: Drivers, Consequences, and Responses; Island Press: Washington, DC, USA, 2013. [Google Scholar]
- FAO. World livestock: Transforming the Livestock Sector Through the Sustainable Development Goals. Available online: www.fao.org/3/CA1201EN/ca1201en.pdf (accessed on 15 December 2024).
- Wu, H.J.; Wang, S.; Gao, L.M.; Zhang, L.; Yuan, Z.W.; Fan, T.Y.; Wei, K.P.; Huang, L. Nutrient-derived environmental impacts in Chinese agriculture during 1978–2015. J. Environ. Manag. 2018, 217, 762–774. [Google Scholar] [CrossRef]
- Zhang, D.; Wang, X.; Zhou, Z. Impacts of small-scale industrialized swine farming on local soil, water and crop qualities in a hilly red soil region of subtropical China. Int. J. Environ. Res. Public Health 2017, 14, 1524. [Google Scholar] [CrossRef]
- Le, C.; Zha, Y.; Li, Y.; Sun, D.; Lü, H.; Yin, B. Eutrophication of lake waters in China: Cost, causes, and control. Environ. Manag. 2010, 45, 662–668. [Google Scholar] [CrossRef]
- Andretta, I.; Hauschild, L.; Kipper, M.; Pires, P.G.S.; Pomar, C. Environmental impacts of precision feeding programs applied in pig production. Animal 2018, 12, 1990–1998. [Google Scholar] [CrossRef]
- Chung, S.-J.; Balasubramani, B.; Kim, J.T. A Study on CO2 and NH3 Reduction during Composting of Chicken Manure by Activated Carbon Addition. J. Korea Soc. Waste Manag. 2020, 37, 69–75. [Google Scholar] [CrossRef]
- Godfray, H.C.J.; Beddington, J.R.; Crute, I.R.; Haddad, L.; Lawrence, D.; Muir, J.F.; Pretty, J.; Robinson, S.; Thomas, S.M.; Toulmin, C. Food security: The challenge of feeding 9 billion people. Science 2010, 327, 812–818. [Google Scholar] [PubMed]
- Oenema, O.; Oudendag, D.; Velthof, G.L. Nutrient losses from manure management in the European Union. Livest. Sci. 2007, 112, 261–272. [Google Scholar] [CrossRef]
- Latruffe, L.; Desjeux, Y.; Bakucs, Z.; Fertő, I.; Fogarasi, J. Environmental pressures and technical efficiency of pig farms in Hungary. Manag. Decis. Econ. 2013, 34, 409–416. [Google Scholar] [CrossRef]
- Park, J. Operation status and effective operation management model for on-site swine wastewater treatment facilities. Water 2024, 16, 1794. [Google Scholar] [CrossRef]
- Giraldi-Díaz, M.; Castillo-González, E.; Medina-Salas, L.; Cruz, R.; Huerta-Silva, H. Environmental impacts associated with intensive production in pig farms in Mexico through life cycle assessment. Sustainability 2021, 13, 11248. [Google Scholar] [CrossRef]
- USDA-FAS. Pork Production-Top Countries Summary United States Department of Agriculture-Foreign Agricultural Service. 2024. Available online: https://apps.fas.usda.gov/psdonline/app/index.html#/app/downloads (accessed on 1 October 2024).
- Zhang, Z.; Liu, D.; Qiao, Y.; Li, S.; Chen, Y.; Hu, C. Mitigation of carbon and nitrogen losses during pig manure composting: A meta-analysis. Sci. Total Environ. 2021, 783, 147103. [Google Scholar] [CrossRef]
- Shao, H.; Li, B.; Jiang, Y. Effect and Mechanism of Environmental Decentralization on Pollution Emission from Pig Farming—Evidence from China. Sustainability 2023, 15, 8297. [Google Scholar] [CrossRef]
- Bai, Z.; Jin, S.; Wu, Y.; Ermgassen, E.; Oenema, O.; Chadwick, D.; Lassaletta, L.; Velthof, G.; Zhao, J.; Lin, M. China’s pig relocation in balance. Nat. Sustain. 2019, 1, 888. [Google Scholar] [CrossRef]
- Sun, X.; Liu, X.; Zhao, S.; Zhu, Y. An evolutionary systematic framework to quantify short-term and long-term watershed ecological compensation standard and amount for promoting sustainability of livestock industry based on cost-benefit analysis, linear programming, WTA and WTP method. Environ. Sci. Pollut. Res. 2021, 28, 18004–18020. [Google Scholar] [CrossRef] [PubMed]
- Nie, R.; Tian, Z.; Wang, J.; Zhang, H.; Wang, T. Water security sustainability evaluation: Applying a multistage decision support framework in industrial region. J. Clean. Prod. 2018, 196, 1681–1704. [Google Scholar] [CrossRef]
- Radmehr, A.; Bozorg-Haddad, O.; Loáiciga, H. Integrated strategic planning and multi-criteria decision-making framework with its application to agricultural water management. Sci. Rep. 2022, 12, 8406. [Google Scholar] [CrossRef]
- Ruckli, A.; Hörtenhuber, S.; Ferrari, P.; Guy, J.; Helmerichs, J.; Hoste, R.; Hubbard, C.; Kasperczyk, N.; Leeb, C.; Malak-Rawlikowska, A.; et al. Integrative Sustainability Analysis of European Pig Farms: Development of a Multi-Criteria Assessment Tool. Sustainability 2022, 14, 5988. [Google Scholar] [CrossRef]
- Bai, X.; Ren, X.; Khanna, N.; Zhang, G.; Zhou, N.; Bai, Y.; Hu, M. A comparative study of a full value-chain water footprint assessment using two international standards at a large-scale hog farm in China. J. Clean. Prod. 2018, 176, 557–565. [Google Scholar] [CrossRef]
- Picone, C.; Henke, R.; Ruberto, M.; Calligaris, E.; Zucaro, R. A Synthetic Indicator for Sustainability Standards of Water Resources in Agriculture. Sustainability 2021, 13, 8221. [Google Scholar] [CrossRef]
- Repar, N.; Jan, P.; Dux, D.; Nemecek, T.; Doluschitz, R. Implementing farm-level environmental sustainability in environmental performance indicators: A combined global-local approach. J. Clean. Prod. 2017, 140, 692–704. [Google Scholar] [CrossRef]
- Zarei, S.; Bozorg-Haddad, O.; Singh, V.; Loáiciga, H. Developing water, energy, and food sustainability performance indicators for agricultural systems. Sci. Rep. 2021, 11, 22831. [Google Scholar] [CrossRef]
- Lampridi, M.; Sørensen, C.; Bochtis, D. Agricultural Sustainability: A Review of Concepts and Methods. Sustainability 2019, 11, 5120. [Google Scholar] [CrossRef]
- Rouillard, J.; Rinaudo, J. From state to user-based water allocations: An empirical analysis of institutions developed by agricultural user associations in France. Agric. Water Manag. 2020, 239, 106269. [Google Scholar] [CrossRef]
- Eleisegui, P.; Greenfield, P. Drugs, Hormones and Excrement: The Polluting Pig Mega-Farms Supplying Pork to the World. The Guardian, 26 November 2024. Available online: https://www.theguardian.com/environment/2024/nov/25/drugs-hormones-excrement-pig-farms-mexico-water-yucatan (accessed on 26 November 2024).
- Vazquéz, H.L. The Cenote Is My Neighbor: Litigation from Below and More Than Human Ethics of Care Against Meat Extractivism in Mexico. Ph.D. Thesis, Clark University, Worcester, MA, USA, 2023. [Google Scholar]
- Ponette-Gonzalez, A.G.; Fry, M. Pig pandemic: Industrial hog farming in eastern Mexico. Land Use Policy Int. J. Cover. All Asp. Land Use 2010, 27, 1107–1110. [Google Scholar] [CrossRef]
- Fabro, A.; Ávila, J.; Alberich, M.; Sansores, S.; Camargo-Valero, M. Spatial distribution of nitrate health risk associated with groundwater use as drinking water in Merida, Mexico. Appl. Geogr. 2015, 65, 49–57. [Google Scholar] [CrossRef]
- Martínez-Salvador, C.; Moreno-Gómez, M.; Liedl, R. Estimating pollutant residence time and NO3 concentrations in the Yucatan karst aquifer; considerations for an integrated karst aquifer vulnerability methodology. Water 2019, 11, 1431. [Google Scholar] [CrossRef]
- Moreno-Gómez, M.; Martínez-Salvador, C.; Lied, R.; Stefan, C.; Pacheco, J. First application of the integrated karst aquifer vulnerability (ikav) method. potential and actual vulnerability in Yucatan, Mexico. Nat. Hazards Earth Syst. Sci. 2022, 22, 1591–1608. [Google Scholar] [CrossRef]
- Hoekstra, A.; Chapagain, A.; Aldaya, M.; Mekonnen, M. The Water Footprint Assessment Manual: Setting the Global Standard; Routledge: London, UK, 2011. [Google Scholar]
- Mekonnen, M.; Hoekstra, A.Y. Global Gray Water Footprint and Water Pollution Levels Related to Anthropogenic Nitrogen Loads to Fresh Water. Environ. Sci. Technol. 2015, 49, 12860–12868. [Google Scholar] [CrossRef] [PubMed]
- INEGI. Censo de Población y Vivienda 2020; Instituto Nacional de Estadística Geografía e Informática: Aguascalientes, México, 2020.
- Steinich, B.; Marín, L. Determination of flow characteristics in the aquifer of the Northwestern Peninsula of Yucatan, Mexico. J. Hydrol. 1997, 191, 315–331. [Google Scholar] [CrossRef]
- Pacheco, A.; Cabrera, S. Groundwater Contamination by Nitrates in the Yucatan Peninsula, Mexico. Hydrogeol. J. 1997, 5, 47–53. [Google Scholar] [CrossRef]
- Escolero, O.A.; Marín, L.E.; Steinich, B.; Pacheco, J. Delimitation of a hydrogeological reserve for a city within a karstic aquifer: The Merida, Yucatan example. Lanscape Urban Plan. 2000, 51, 53–62. [Google Scholar] [CrossRef]
- Bauer-Gottwein, P.; Gondwe, B.R.N.; Charvet, G.; Marín, L.E.; Rebolledo-Vieyra, M.; Merediz-Alonso, G. Review: The Yucatan Peninsula karst aquifer, Mexico. Hydrogeol. J. 2011, 19, 507–524. [Google Scholar] [CrossRef]
- CONAGUA. Actualización de la Disponibilidad Media Anual De Agua en el Acuífero Península De Yucatan (3105), Estado De Yucatan; Subdirección General Técnica, Gerencia de Aguas subterráneas; Comisión Nacional del Agua: Ciudad de México, México, 2020.
- Bautista, F.; Aguilar, Y.; Gijón, N. Las granjas porcinas en zonas de karst: ¿Cómo pasamos de la contaminación a la sustentabilidad? Trop. Subtrop. Agroecosyst. 2022, 5, 1–23. [Google Scholar] [CrossRef]
- De La Rosa, E.; Cuevas, F.; Loeza, D.; Barreto, M.; García, J. La lucha socioambiental de proyectos alternativos. El caso del cerdo pelón en Yucatan. Ecología Política. Cuad. De Debate Int. 2021, 61, 74–79. [Google Scholar] [CrossRef]
- SEMARNAT. Dictamen Diagnóstico Ambiental de la Actividad Porcícola en Yucatan. Secretaría de Medio Ambiente y Recursos Naturales, Gobierno de México. 2023; 100p. Available online: https://www.gob.mx/semarnat/documentos/dictamen-diagnostico-ambiental-de-la-actividad-porcicola-de-yucatan (accessed on 1 October 2024).
- NOM-230-SSA1-2002; Salud Ambiental. Agua Para uso y Consumo Humano, Requisitos Sanitarios que se Deben Cumplir en los Sistemas de Abastecimiento Públicos y Privados Durante el Manejo del Agua. Procedimientos Sanitarios Para el Muestreo. Secretaría de Salud: Ciudad de México, México, 2005.
- NMX-AA-014-1980; Cuerpos Receptores—Muestreo. Secretaría del Medio Ambiente y Recursos Naturales: Ciudad de México, México, 1980.
- NMX-EC-17025-IMNC-2018; Requisitos Generales para la Competencia de los Laboratorios de Ensayo y Calibración. Secretaría de Economía: Ciudad de México, México, 2018.
- Norma Oficial Mexicana NOM-001-SEMARNAT-2021. Que Establece los Límites Permisibles de Contaminantes en las Descargas de Aguas Residuales en Cuerpos Receptores Propiedad de la Nación. DOF-Diario Oficial de la Federación. (s/f). Gob.mx. Recuperado el 3 de marzo de 2023, de. Available online: https://www.dof.gob.mx/nota_detalle.php?codigo=5645374&fecha=11/03/2022 (accessed on 3 March 2023).
- Food and Water Watch. Factory Farm Nation: 2020 Edition. Food & Water Watch, 12 May 2020. Available online: www.foodandwaterwatch.org/sites/default/files/ib_2004_updfacfarmmaps-web2.pdf (accessed on 15 September 2024).
- Ruddy, B.C.; Lorenz, D.L.; Mueller, D.K. County-Level Estimates of Nutrient Inputs to the Land Surface of the Conterminous United States, 1982–2001; Scientific Investigations Report, 2006, 2006-5012; U.S. Geological Survey: Reston, VA, USA, 2006. Available online: https://pubs.usgs.gov/publication/sir20065012 (accessed on 12 September 2022).
- DEFRA. Protecting Our Water, Soil and Air. 2011. Available online: https://www.gov.uk/government/publications/protecting-our-water-soil-and-air (accessed on 18 January 2024).
- Rockström, J.; Steffen, W.; Noone, K.; Persson, Å.; Chapin, F.S.; Lambin, E.F.; Lenton, T.M.; Scheffer, M.; Folke, C.; Schellnhuber, H.J.; et al. A safe operating space for humanity. Nature 2009, 461, 472–475. [Google Scholar] [CrossRef] [PubMed]
- Liu, C.; Koreze, C.; Hoekstra, A.Y.; Gerbens-Leenes, W. Past and future trends in grey water footprints of anthropogenic nitrogen and phosphorus inputs to major world rivers. Ecol. Indic. 2012, 18, 42–49. [Google Scholar] [CrossRef]
- Walton, N. Electrical Conductivity and Total Dissolved Solids—What is Their Precise Relationship? Desalination 1989, 72, 275–292. [Google Scholar] [CrossRef]
- Hubert, E.; Wolkersdorfer, C. Establishing a conversion factor between electrical conductivity and total dissolved solids in South African mine waters. Water SA 2015, 41, 490–500. [Google Scholar] [CrossRef]
- Delgado, C.; Pacheco, J.; Cabrera, A.; Batllori, E.; Orellana, R.; Bautista, F. Quality of groundwater for irrigation in tropical karst environment: The case of Yucatan, Mexico. Agric. Water Manag. 2010, 97, 1423–1433. [Google Scholar] [CrossRef]
- Zamora-Luria, J.; Perera-Burgos, J.; González-Calderón, A.; Stillman, L.; Leal-Bautista, R. Control of fracture networks on a coastal karstic aquifer: A case study from northeastern Yucatan Peninsula (Mexico). Hydrogeol. J. 2020, 28, 2765–2777. [Google Scholar] [CrossRef]
- NOM-127-SSA1-2021; Agua Para Uso y Consumo Humano. Límites Permisibles de la Calidad del Agua. Secretaría de Salud: Ciudad de México, México, 2021.
- Bai, Z.H.; Ma, L.; Qin, W.; Chen, Q.; Oenema, O.; Zhang, F.S. Changes in Pig Production in China and Their Effects on Nitrogen and Phosphorus Use and Losses. Environ. Sci. Technol. 2015, 48, 12742–12749. [Google Scholar]
- Xie, D.; Zhuo, L.; Xie, P.; Liu, Y.; Feng, B.; Wu, P. Spatiotemporal variations and developtments of waterfootprints of pig feeding and pork production in China (2004–2013). Agric. Ecosyst. Environ. 2020, 297, 106932. [Google Scholar]
- Willems, J.; van Grinsven, H.J.M.; Jacobsen, B.H.; Jensen, T.; Dalgaard, T.; Westhoek, H.; Silleback Krinstensen, I. Why Danish pig farms have far more land and pigs than Dutch farms? Agric. Syst. 2016, 144, 122–132. [Google Scholar]
- Bai, Z.H.; Zhao, J.; Wei, Z.; Jin, X.; Ma, L. Socioeconomic drivers of pig production and their effects on achieving sustainable development goals in China. J. Integr. Environ. Sci. 2019, 16, 141–155. [Google Scholar] [CrossRef]
- Öhlund, E.; Hammer, M.; Björklund, J. Managing conflicting goals in pig farming: Farmers’ strategies and perspectives on sustainable pig farming in Sweden. Int. J. Agric. Sustain. 2017, 15, 693–707. [Google Scholar] [CrossRef]
- Kruger, S.; Bucior, L.; Casagranda, Y.; Santos, P.; Moro, L.; Mores, G. Sustainability assessment of pig production: A study in Santa Catarina, Brazil. Ciência E Nat. 2023, 45, e8. [Google Scholar] [CrossRef]
- Wang, X.; Dadouma, A.; Chen, Y.; Sui, P.; Gao, W.; Jia, L. Sustainability evaluation of the large-scale pig farming system in North China: An emergy analysis based on life cycle assessment. J. Clean. Prod. 2015, 102, 144–164. [Google Scholar] [CrossRef]
- Gunnarsson, S.; Segerkvist, A.; Wallgren, T.; Hansson, H.; Sonesson, U. A Systematic Mapping of Research on Sustainability Dimensions at Farm-level in Pig Production. Sustainability 2020, 12, 4352. [Google Scholar] [CrossRef]
- Rauw, W.; Rydhmer, L.; Kyriazakis, I.; Øverland, M.; Gilbert, H.; Dekkers, J.; Hermesch, S.; Bouquet, A.; Izquierdo, G.; Louveau, I.; et al. Prospects for sustainability of pig production in relation to climate change and novel feed resources. J. Sci. Food Agric. 2020, 100, 3575–3586. [Google Scholar] [CrossRef]
- Sellare, J.; Meemken, E.-M.; Qaim, M. Fairtrade, agrochemical input use, and effects on human health and the environment. Ecol. Econ. 2020, 176, 106718. [Google Scholar] [CrossRef]
- Swinnen, J. Economics and politics of food standards, trade, and development. Agric. Econ. 2016, 47, 7–19. [Google Scholar] [CrossRef]
- Meemken, E.-M. Do smallholder farmers benefit from sustainability standards? A systematic review and meta-analysis. Glob. Food Secur. 2020, 26, 100373. [Google Scholar] [CrossRef]
- Gerbens-Leenes, P.W.; Mekonnen, M.M.; Hoekstra, A.Y. The water footprint of poultry, pork and beef: A comparative study in different countries and production systems. Water Resour. Ind. 2013, 1, 25–36. [Google Scholar] [CrossRef]
- Vos, J.; Boelens, R. Sustainability Standards and the Water Question. Dev. Change 2014, 45, 205–230. [Google Scholar] [CrossRef]
- Meemken, E.; Barrett, C.; Michelson, H.; Qaim, M.; Reardon, T.; Sellare, J. Sustainability standards in global agrifood supply chains. Nat. Food 2021, 2, 758–765. [Google Scholar] [CrossRef] [PubMed]
- Grinsven, H.; Van Dam, J.; Lesschen, J.; Timmers, M.; Velthof, G.; Lassaletta, L. Reducing external costs of nitrogen pollution by relocation of pig production between regions in the European Union. Reg. Environ. Change 2018, 18, 2403–2415. [Google Scholar] [CrossRef]
- Liang, J.; Kayawake, E.; Sekine, T.; Suzuki, S.; Lim, K. Developing zero-discharge pig-farming system: A feasibility study in Malaysia. Anim. Prod. Sci. 2017, 57, 1598–1602. [Google Scholar] [CrossRef]
Disclaimer/Publisher’s Note: The statements, opinions and data contained in all publications are solely those of the individual author(s) and contributor(s) and not of MDPI and/or the editor(s). MDPI and/or the editor(s) disclaim responsibility for any injury to people or property resulting from any ideas, methods, instructions or products referred to in the content. |
© 2025 by the authors. Licensee MDPI, Basel, Switzerland. This article is an open access article distributed under the terms and conditions of the Creative Commons Attribution (CC BY) license (https://creativecommons.org/licenses/by/4.0/).