Article

Spatiotemporal Heterogeneity of Eco-Efficiency of Cultivated Land Use and Its Influencing Factors: Evidence from the Yangtze River Economic Belt, China

1
Sichuan Provincial Engineering Laboratory of Monitoring and Control for Soil Erosion in Dry Valley, School of Geographical Sciences, China West Normal University, Nanchong 637009, China
2
College of Geographic Science, Qinghai Normal University, Xining 810008, China
3
School of Geography and Environment, Liaocheng University, Liaocheng 252000, China
4
General Education College, Chongqing Vocational Institute of Tourism, Chongqing 409000, China
*
Authors to whom correspondence should be addressed.
Sustainability 2025, 17(7), 3070; https://doi.org/10.3390/su17073070
Submission received: 19 February 2025 / Revised: 19 March 2025 / Accepted: 25 March 2025 / Published: 31 March 2025

Abstract

:
For the purpose of providing crucial theoretical support for guaranteeing food security and reaching low-carbon emissions, this study examines the spatiotemporal evolution and influencing factors of the eco-efficiency of cultivated land use (ECLU) across 125 cities in the Yangtze River Economic Belt (YREB) from 2005 to 2022. Utilizing models such as Super-SBM, spatial autocorrelation, standard deviational ellipse, and regionally weighted regression, we investigate the spatiotemporal characteristics and influencing factors. The results indicate that (1) from 2005 to 2022, the overall ECLU in the YREB has shown a notable increase, demonstrating an “N”-shaped trend of “rise-decline-rise”, although trends vary at the city level, with upstream areas exhibiting higher efficiency than downstream and midstream areas. (2) Furthermore, a significant positive correlation exists in the ECLU among the cities, exhibiting pronounced spatial differentiation; the centroid displays a migration trajectory from “southwest-northeast-southwest”, with the long axis of the ellipse consistently oriented in the “southwest-northeast” direction. (3) Additionally, the influencing factors of the ECLU exhibit significant spatial heterogeneity across different years and regions, revealing substantial regional disparities among the cities in the YREB. Future efforts should focus on exploring differentiated regional pathways, increasing investment in agricultural technology, and enhancing farmers’ environmental awareness to promote the improvement of the ECLU.

1. Introduction

Cultivated land, as an essential component of land reserves, provides the essential material resources indispensable for human production and life, ensures national food security, stabilizes social economy, and regulates ecosystems [1,2,3,4,5,6,7,8]. However, because of its rapid socio-economic development and accelerated urbanization process, China, a traditional agricultural powerhouse, is facing more and more significant issues, such as the “non-grain” and “non-agricultural” transformation of cultivated land, the abandonment of cultivated land, and the inefficient and extensive utilization of cultivated land [9,10,11]. This is mainly seen by the ongoing deterioration of the quality and quantity of cultivated land, which results in a major reduction in the amount of such land available [12,13,14,15]. According to the China Natural Resources Bulletin (https://www.gov.cn/, accessed on 28 November 2024), the cultivated land area decreased from 135.385 million hectares in the second national land survey to 127.58 million hectares in 2022. Meanwhile, the research team at the China Agricultural University estimates that as of 2022, the “non-grain” rate of cultivated land in China is approximately 27% (http://www.moa.gov.cn/, accessed on 28 November 2024). Against the backdrop of limited cultivated land resources, the large-scale use of agricultural inputs such as pesticides and fertilizers to ensure food production severely threatens the coordinated development of regional cultivated land ecosystems [8,16,17]. Agriculture inputs including fuel, plastic films, fertilizers, and pesticides have been found to increase greenhouse gas emissions [7,18,19], and China’s agricultural carbon emissions have shifted primarily from livestock to crop production [20]. Statistics show that over the past 30 years, the average annual growth rate of agricultural carbon emissions in China has reached 1.85% [21]. At the same time, an ecological priority requires reducing the use of fertilizers and pesticides, limiting cultivated land use in certain areas, and promoting more eco-friendly and sustainable farming practices. However, in the process of sustainable land use, it is essential to ensure food production and to stabilize national food security on the one hand. On the other hand, farmers aim to achieve economic benefits and agricultural output, which inevitably leads to a conflict between “ecological priority” and sustainable land use. In this context, how to ensure food security while achieving low-carbon emissions and enhancing the ecological efficiency of cultivated land has clearly become an urgent issue that needs to be addressed.
Schaltegger and Sturm introduced eco-efficiency in 1990, defining it as the ratio of the additional value of environmental effect to the added value of economic value [22]. Eco-efficiency effectively evaluates the performance of ecology and socio-economic factors. In recent years, it has gradually been applied to research fields such as agricultural production [23,24,25,26], tourism [27,28,29], and land use [30,31,32]. Nonetheless, there is currently a lack of research on the eco-efficiency of cultivated land use (ECLU) [7,33]. Existing studies primarily focus on three aspects: first, the measurement and evaluation of eco-efficiency, where scholars use methods like the stochastic frontier approach (SFA) [34,35], data envelopment analysis (DEA) [36,37], and the Malmquist index [38,39], incorporating indicators of unintended outputs such as non-point source pollution and carbon emissions to assess ecological degradation. The super-efficiency SBM model, derived from the DEA framework, does not require the prior specification of the model’s specific form or parameter estimation. It effectively overcomes the situation where the efficiency values calculated by the DEA model are equal to 1, thereby allowing for an accurate comparison of efficiency differences among various decision-making units. Second, the spatiotemporal patterns and spatial evolution characteristics of eco-efficiency are examined, with studies increasingly focusing on finer spatial scales, revealing significant regional disparities and a lack of coordination between cultivated land use and ecological protection [40,41,42]. Scholars typically employ spatial autocorrelation models [43,44,45,46], trend surface analysis [33], and spatial spillover effects [47,48,49] to explore these spatial evolution laws. Third, factors influencing eco-efficiency are investigated using geographic detectors and regression models [50], considering perspectives such as socio-economic conditions, agricultural production factors, and the endowment of cultivated land resources.
Although previous researchers have achieved significant results in the field of ECLU, there are still several areas that warrant further exploration. First, when measuring and evaluating eco-efficiency, most scholars consider socio-economic output as desirable output, typically using agricultural output value and total grain output for measurement. Few scholars consider the carbon absorption function of food crops and cash crops, i.e., their carbon sink function. Additionally, while most scholars account for undesirable output, such as carbon emissions due to agricultural inputs, there is limited consideration of non-point source pollution caused by fertilizers and pesticides. Therefore, this study will adopt a three-dimensional perspective—social, economic, and ecological—to consider expected outputs. This approach effectively breaks through the limitations of traditional evaluations that only consider single-dimensional economic output or a dual-dimensional perspective of economic and social factors. Additionally, by considering non-expected outputs from the perspectives of carbon emissions and non-point source pollution, the accuracy of measuring the ECLU will be significantly enhanced. Second, regarding the spatial scale of research, current studies encompass various scales such as provincial, municipal, and county levels, as well as typical areas like major grain-producing regions and border areas, resulting in region-specific conclusions. However, there has been little research on important national strategic areas and pioneering demonstration zones for ecological civilization construction. Third, the influencing factors of ECLU may exhibit regional differences due to varying spatial locations. Existing research primarily employs econometric models for macro-level analyses, lacking insights from a spatial heterogeneity perspective.
Based on the above analysis, this study focuses on the Yangtze River Economic Belt (YREB). The YREB is one of the most dynamic economic regions in China and is also a crucial area for ensuring food security. However, rapid urbanization and industrialization have placed significant pressure on cultivated land resources. Therefore, studying the ECLU in this region is of great practical significance. It selects 125 cities as research units and incorporates the surface pollution and carbon sink functions of cultivated land use into the quantitative assessment of eco-efficiency. This study aims to explore the spatiotemporal characteristics of ECLU, clarify regional disparities, and reveal the influencing factors of eco-efficiency. The specific research includes (1) measuring the eco-efficiency levels of cultivated land use in the YREB from 2005 to 2022 using a Super-SBM model, from multiple scales and perspectives; (2) revealing the spatiotemporal patterns and evolutionary trends of ECLU across cities in the YREB through spatial autocorrelation, standard deviational ellipse, and centroid migration models; (3) exploring the influencing factors of ECLU using geographically weighted regression for each city in the YREB. We hope that these research findings can provide a reference for adhering to the ecological civilization concept of prioritizing ecology and green development in the YREB, ensuring food security, achieving low-carbon emissions, and promoting sustainable agricultural development.

2. Materials and Methods

2.1. Overview of the Research Area

The YREB includes the following areas: the central provinces of Hunan, Hubei, and Jiangxi; the downstream municipalities of Shanghai, Zhejiang, Jiangsu, and Anhui; and the upstream provinces of Yunnan, Guizhou, Sichuan, and the municipality of Chongqing. Its whole land area is 205.23 km2, which makes up 21.4% of the country’s total land area [34] (Figure 1). Agriculture is a vital support for the YREB, serving as a crucial area for food security in China, as well as an important population-bearing and industrial agglomeration zone. Agricultural output value climbed from 768.63 billion yuan in 2005 to 3340.92 billion yuan in 2022, while grain production in the study region increased from 21,185.56 million tons in 2005 to 25,140.86 million tons in 2022. Total nitrogen and total phosphorus concentrations in the YREB have dramatically grown in recent years [51,52]. This is mostly because cultivated land use involves the widespread use of fertilizers and pesticides, which is also one of the main causes of the non-point source pollution produced throughout the process [52,53].

2.2. Data Sources

Our study uses municipal administrative districts in the YREB as research units. The data include socio-economic data, crop yield, geographic spatial data, and land use data. The China Rural Statistical Yearbook, national economic and social development bulletins, and statistical yearbooks of various provinces and cities in the YREB are the main sources of socio-economic data (https://www.stats.gov.cn/sj/ndsj/, accessed on 28 November 2024). The cultivated land data in the land use category are sourced from the National Land Survey Results Sharing Platform (https://gtdc.mnr.gov.cn/Share#/, accessed on 28 November 2024); The Geospatial Data Cloud Platform provides DEM data with a spatial resolution of 30 m (http://www.gscloud.cn/, accessed on 28 November 2024). We use ArcGIS 10.8 to analyze the average elevation and slope. The National Basic Geographic Information Center is the source of information on lakes and rivers in the YREB (http://www.ngcc.cn/, accessed on 28 November 2024), as well as province and municipal administrative borders. It is noteworthy that the YREB includes a total of 130 city-level units, which comprises two municipalities directly governed by the central government. However, due to significant data gaps in five regions—Qianjiang City, Tianmen City, Xiantao City, Enshi Autonomous Prefecture, and Shennongjia Forest District in Hubei Province—these areas have not been included in this study.

2.3. Indicator Construction and Research Framework

2.3.1. Indicator Construction

ECLU essentially refers to achieving the maximum expected output with minimal inputs and minimal unintended outputs [54]. It accurately depicts how cultivated land use and ecological environmental conservation are integrated. In line with previous studies [44,55,56,57], and considering the availability and scientific validity of the indicators, this study examines input factors in the cultivated land planting process from three perspectives: land, labor, and agricultural materials (Table 1). The amount of crops planted is used to measure land, while agricultural labor productivity—which represents the cost of labor inputs needed to produce agricultural, forest, animal husbandry, and fishing output per unit area—is used to measure labor. Agricultural materials are quantified using the pure amount of agricultural plastic film usage, fertilizers, effective irrigation area, agricultural mechanization input, and pesticide usage. Expected outputs are constructed from economic, social, and ecological dimensions, measured by the agricultural output value, total grain yield, and total carbon sequestration of cultivated land. Non-expected outputs include the pure amount of pesticide usage, fertilizers, effective irrigation area, agricultural plastic film usage, and carbon emissions generated during agricultural mechanization. Carbon emissions and non-point source pollution are seen as unexpected outcomes as the use of pesticides, fertilizers, and agricultural plastic films also contributes to non-point source pollution.
  • Calculation of carbon emissions from cultivated land use
The primary sources of carbon emissions during the usage of cultivated land are plastic films, agricultural machinery and tillage, irrigation, fertilizers, and pesticides, according to previous research [40,41,42]. The corresponding carbon emission coefficients are 0.8956 kg C/kg, 4.9341 kg C/kg, 5.18 kg C/kg, 20.476 kg C/hm2, and 312.6 kg C/hm2, respectively. The calculation formula is as follows [40,41,42]:
C = C i = X i × Z i
where C represents the total carbon emissions; Ci represents the carbon emissions from source i; Xi represents the carbon emission coefficient; and Zi represents the consumption amount of source i. In this study, pesticides, irrigation, plastic films, fertilizers, and agricultural machinery and tillage are represented by the pure amount of pesticide usage, effective irrigation area, agricultural plastic film usage, fertilizers, agricultural mechanization, and area of crop sown, respectively. Non-point source pollution during cultivated land usage is mostly caused by chemical fertilizers, pesticides, and agricultural films, according to existing studies [58,59]. Consequently, the following is the computation formula: Fertilizer loss rate x pure amount of fertilizer equals non-point source pollution from fertilizer usage, and the calculation methods for pesticides and agricultural films are similar. Based on previous experiences [60,61], the fertilizer loss rate, pesticide pollution rate, and agricultural film residue rate are set at 0.65, 0.5, and 0.1, respectively.
2.
Calculation of carbon sequestration from cultivated land use
Carbon sequestration from cultivated land use refers to the amount of carbon dioxide absorbed through photosynthesis during the growth of crops. The following is the calculating formula [62,63]:
S = i = 1 i S i = i = 1 i C i G i ( 1 U i ) w i
where S represents the carbon sequestration amount from cultivated land; Si is the carbon absorption amount of crop i; Ci is the carbon absorption rate of crop i; Gi is the yield of crop i; Ui is the moisture content; and wi is the economic coefficient of crop i. In this study, the main crops selected are seven types of staple and economic crops: rice, wheat, corn, tubers, beans, vegetables, and rapeseed. The relevant coefficients for each type of crop can be found in the studies by Tian and Zhang [62] and Fan et al. [63].

2.3.2. Research Framework

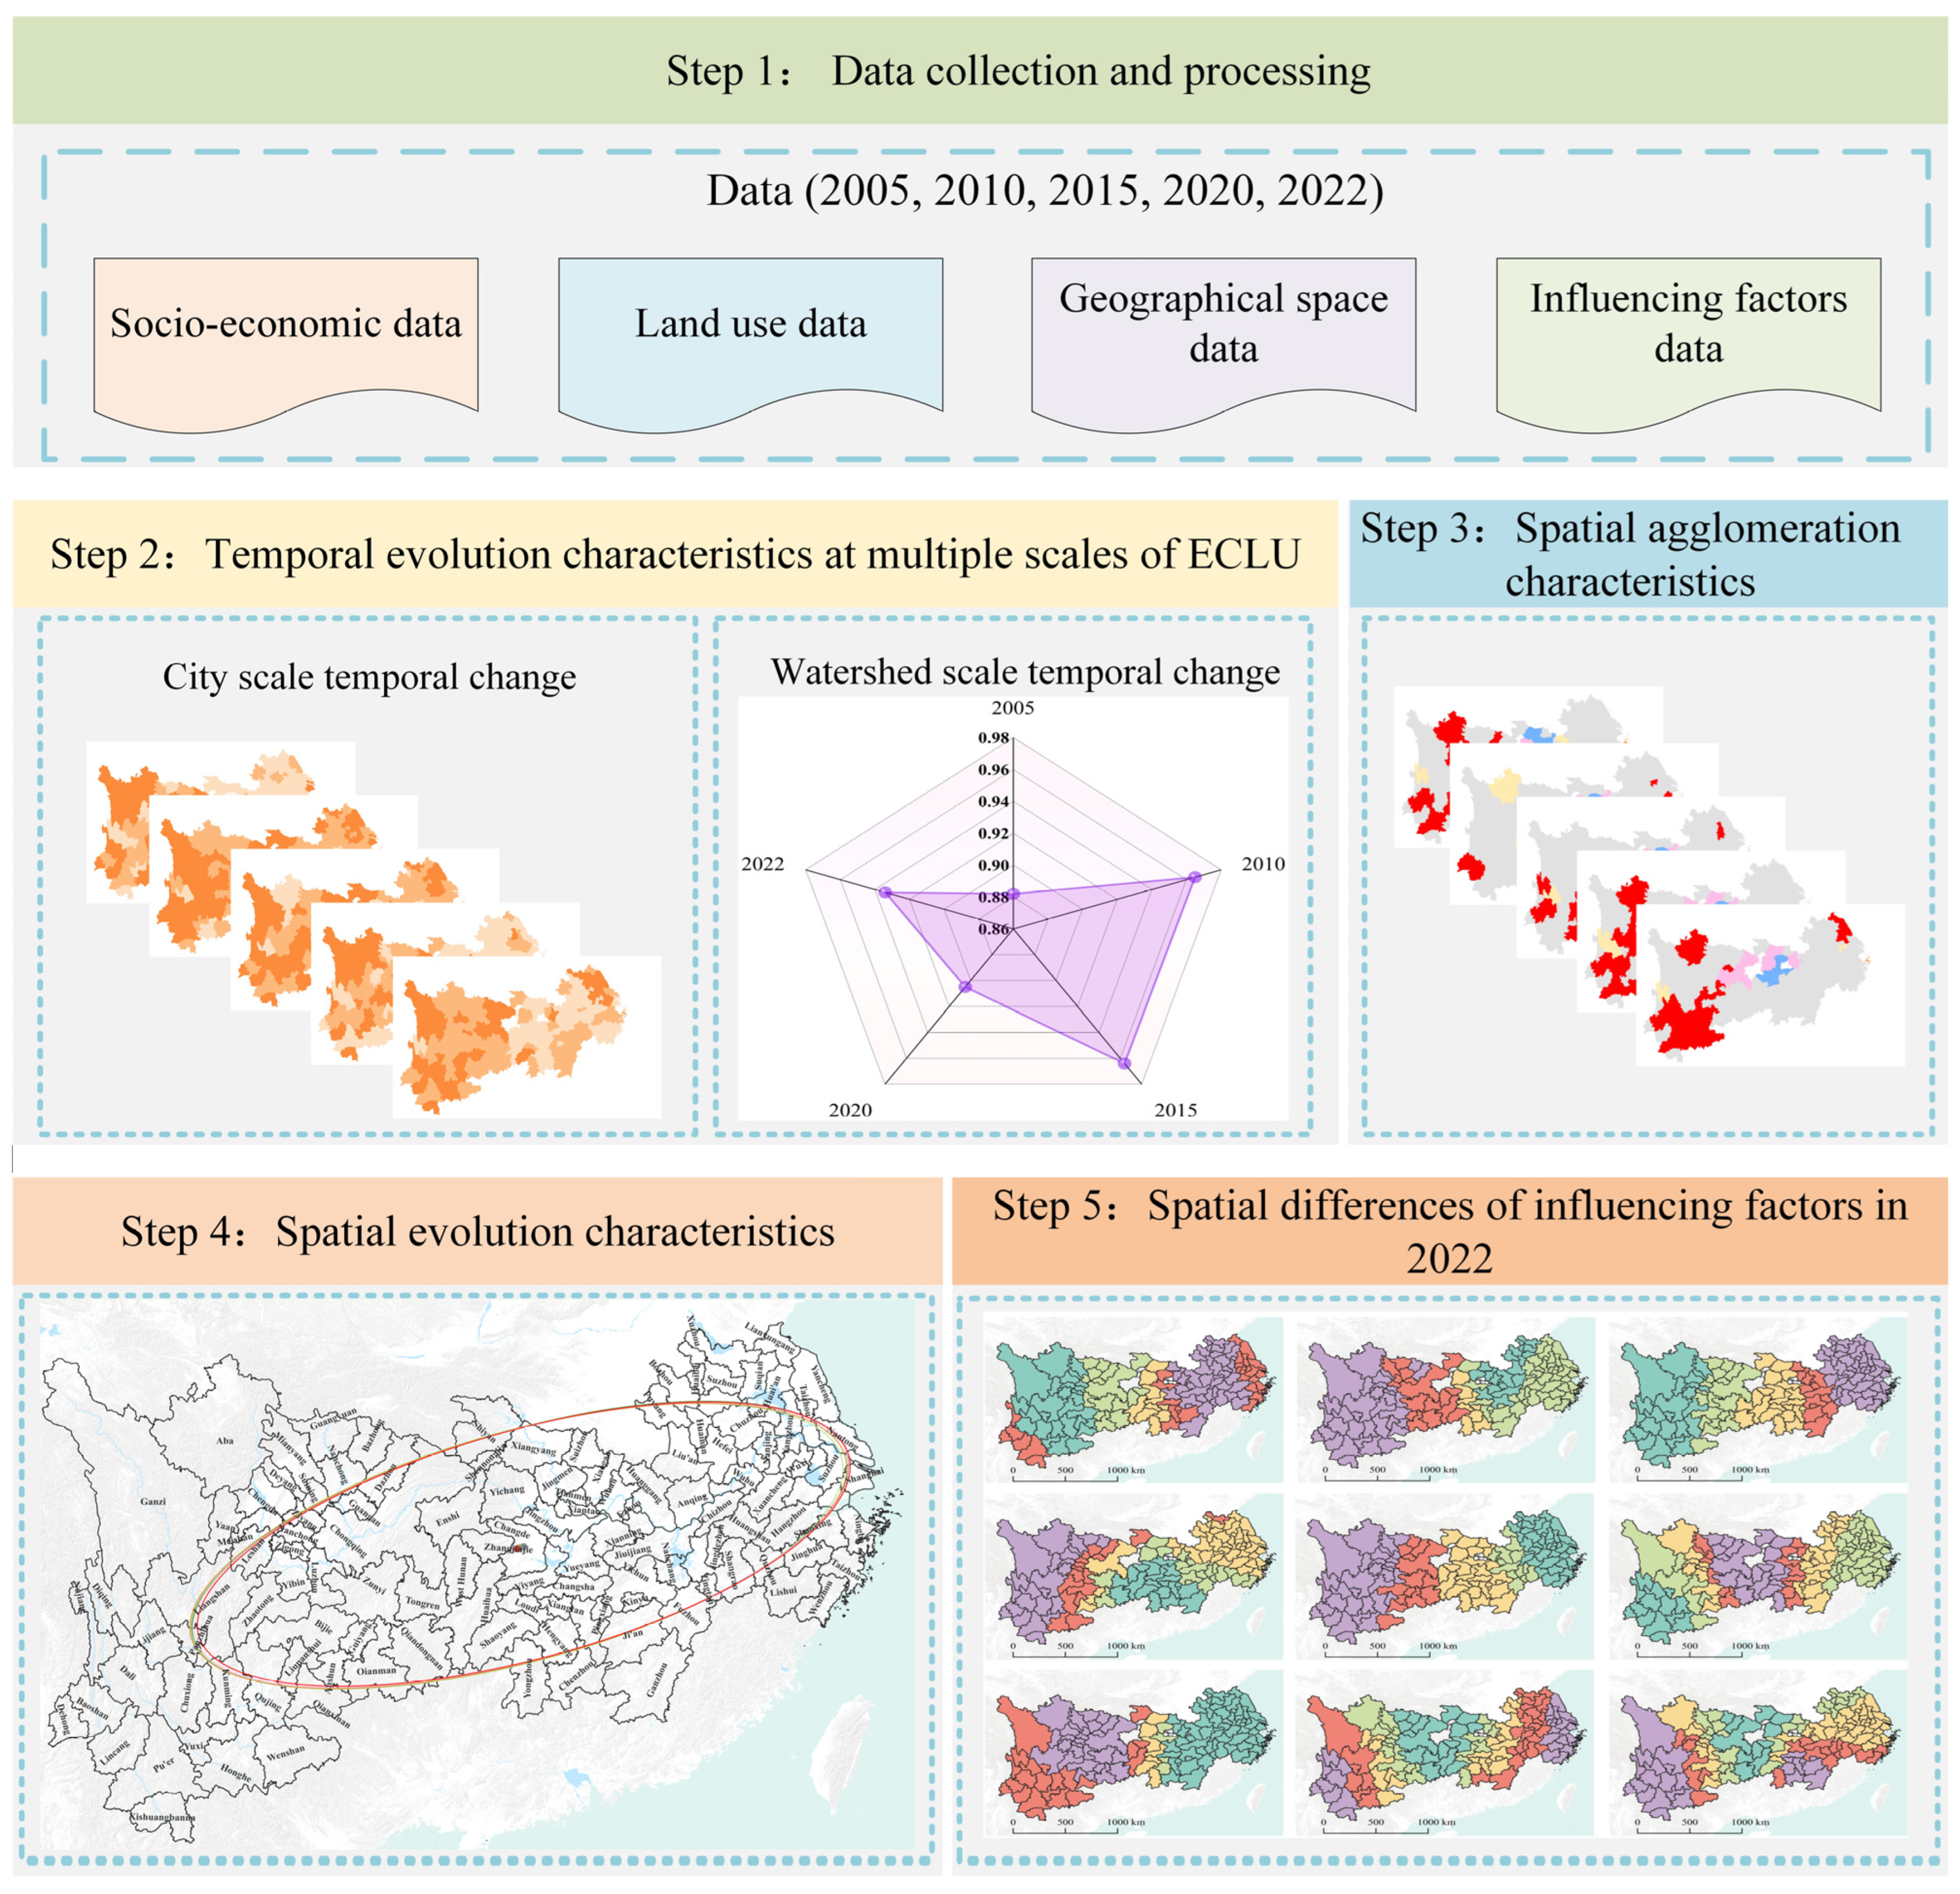
Panel data from 125 YREB cities from 2005, 2010, 2015, 2020, and 2022 served as the basis for this investigation. It investigates the causes of ECLU in the YREB. The following is the research framework (Figure 2):
  • Construct a database of socio-economic factors, land use data, influencing factors, and geographical space;
  • Determine the ECLU in the YREB using the Super-SBM model, then examine its features of temporal evolution across several scales;
  • Apply the spatial autocorrelation model to examine the ECLU’s spatial aggregation features across the YREB’s cities;
  • Analyze the evolution path of the ECLU in each city of the YREB using the standard deviational ellipse model.
  • Employ geographic weighted regression to identify the influencing factors of ECLU.

2.4. Research Methods

2.4.1. Super-SBM Model

The Super-SBM model, proposed by Tone [64], is a derivative of the DEA model. Traditional DEA models assume a monotonic linear relationship between inputs and outputs when analyzing efficiency, serving as a linear programming technique to determine the relative efficiency of decision-making units (DMUs). However, these traditional models struggle to effectively address issues related to undesirable outputs during efficiency measurement. The Super-SBM model not only avoids biases caused by radial and angular measurements but also considers the impact of undesirable output factors in the production process. This model more accurately reflects the essence of efficiency evaluation and effectively addresses problems associated with slack variables and undesirable outputs in the context of cultivated land use [65,66]. Additionally, it can resolve comparison issues among evaluation units with an efficiency score of 1, allowing for a precise ranking of efficiency values among DMUs. Therefore, this study employs this model to calculate the ECLU in various cities of the YREB. The formula is as follows [64]:
ρ * = m i n 1 1 n i = 1 n q i x i k 1 + 1 c 1 + c 2 ( r = 1 p 1 q r + y r k + g = 1 p 2 q g b b r k )
q · t · x k = X γ + q , y k = Y γ q + , b k = B γ + q b
γ 0   q 0   q + 0 q b 0
where ρ* represents the value of ECLU in various cities of the YREB; n, c1, c2 denote the number of inputs, expected outputs, and undesirable outputs for each decision unit, respectively; q, q+, qb represent the slack variables for inputs, expected outputs, and undesirable outputs; xk, yk, bk denote the values of inputs, expected outputs, and undesirable outputs for the decision unit; and γ represents the weight vector.

2.4.2. Spatial Autocorrelation Model

Moran’s I index is used to describe the spatial clustering effect of geographical phenomena, including global spatial autocorrelation and local spatial autocorrelation [67,68]. This study utilizes ArcGIS version 10.8 and GeoDA version 1.22 software to apply Global Moran’s I to explore the overall correlation degree and spatial distribution pattern of ECLU in the YREB. The formula is as follows [69]:
I g = n × i = 1 n j = 1 n ω i j ( x i x ¯ ) ( x j x ¯ ) i = 1 n j = 1 n ω i j i = 1 n ( x i x ¯ ) 2
In the formula, n represents the total number of cities in the study area; xi and xj are the attribute values of evaluation units i and j (where i ≠ j); x ¯ is the mean ECLU for the evaluation units; and ωij is the spatial weight matrix of the study units, indicating the spatial adjacency relationships among the evaluation units. Since the data in this study are based on the ecological efficiency of cultivated land use at the city level, we constructed the spatial weight matrix using geographic adjacency. The value of Ig ranges from [−1] to [1]. When Ig > 0, it indicates a positive correlation, and spatial factors exhibit a clustering distribution; when Ig < 0, it indicates a negative correlation, and spatial factors exhibit a dispersed distribution; when Ig = 0, it indicates a random distribution.
Global Moran’s I primarily presents the spatial distribution characteristics of ECLU across various cities in the YREB. However, it is difficult to reveal spatial local clustering and regional differences. Therefore, it is necessary to further employ Local Moran’s I to determine the spatial clustering characteristics of high and low values of ECLU, clarifying regional spatial differences and the degree of association with neighboring cities. The formula is as follows [70]:
I l = ( x i x ¯ ) j = 1 n ω i j ( x j x ¯ ) 1 n × i = 1 n ( x i x ¯ ) 2
In the formula, Il > 0 indicates that city (prefecture) i has a smaller significance of difference with surrounding neighboring cities, suggesting stronger homogeneity and clustering; conversely, a larger significance of difference indicates weaker homogeneity and clustering.

2.4.3. Standard Deviational Ellipse

The standard deviational ellipse (SDE) was proposed by Lefever in 1926. It is a statistical method that reveals the distribution of geographical spatial elements and can accurately depict the spatial evolution trajectory of these elements. This study employs the SDE and centroid migration analysis methods to reveal the spatial evolution characteristics of ECLU within the YREB, calculating relevant parameters using the spatial statistics module of ArcGIS version 10.8. The formula is as follows [71]:
S D E x = i = 1 n ( x i x ¯ ) 2 n S D E y = i = 1 n ( y i Y ¯ ) 2 n tan θ = i = 1 n x i ¯ 2 i = 1 n y i ¯ 2 + i = 1 n x i ¯ 2 i = 1 n y i ¯ 2 2 + 4 ( i = 1 n x i ¯ y i ¯ ) 2 2 i = 1 n x i ¯ y i ¯ σ x = 2 i = 1 n ( x i ¯ cos θ y i ¯ sin θ ) 2 n σ y = 2 i = 1 n ( x i ¯ cos θ + y i ¯ sin θ ) 2 n
In the formula, SDEx and SDEy represent the coordinates of the centroid of the ellipse for the research subject; xi and yi are the coordinates of the i-th research unit; x ¯ and y ¯ are the centroid coordinates; n is the total number of cities; θ is the angle of the ellipse, indicating the angle formed by the clockwise rotation from true north to the long axis of the ellipse; σx and σy are the standard deviations of the x and y axes, respectively; and x i ¯ and y i ¯ are the coordinate deviations of each research subject’s location from the mean center.

2.4.4. Geographically Weighted Regression

The geographically weighted regression (GWR) model is a spatial analysis technique that incorporates spatial location into parameter regression analysis, allowing for the integration of local dependent and independent variables to obtain the regression coefficients for each explanatory variable at each sample point [72]. To further analyze the impact of influencing factors on ECLU across different geographical spaces, this study employs the GWR model for analysis. The formula is as follows [73]:
y i = β 0 u i ,   v j + k = 1 t β k u i ,   v j x i k + ε i
In the formula, yi represents the ECLU in city i; β0(ui, vj) is the constant term; βk(ui, vj) is the regression parameter for each city in the YREB; t is the number of cities; xik are the explanatory variables affecting the ECLU in each city; and εi is the random error term.

3. Results

3.1. Temporal Characteristics of ECLU in the YREB

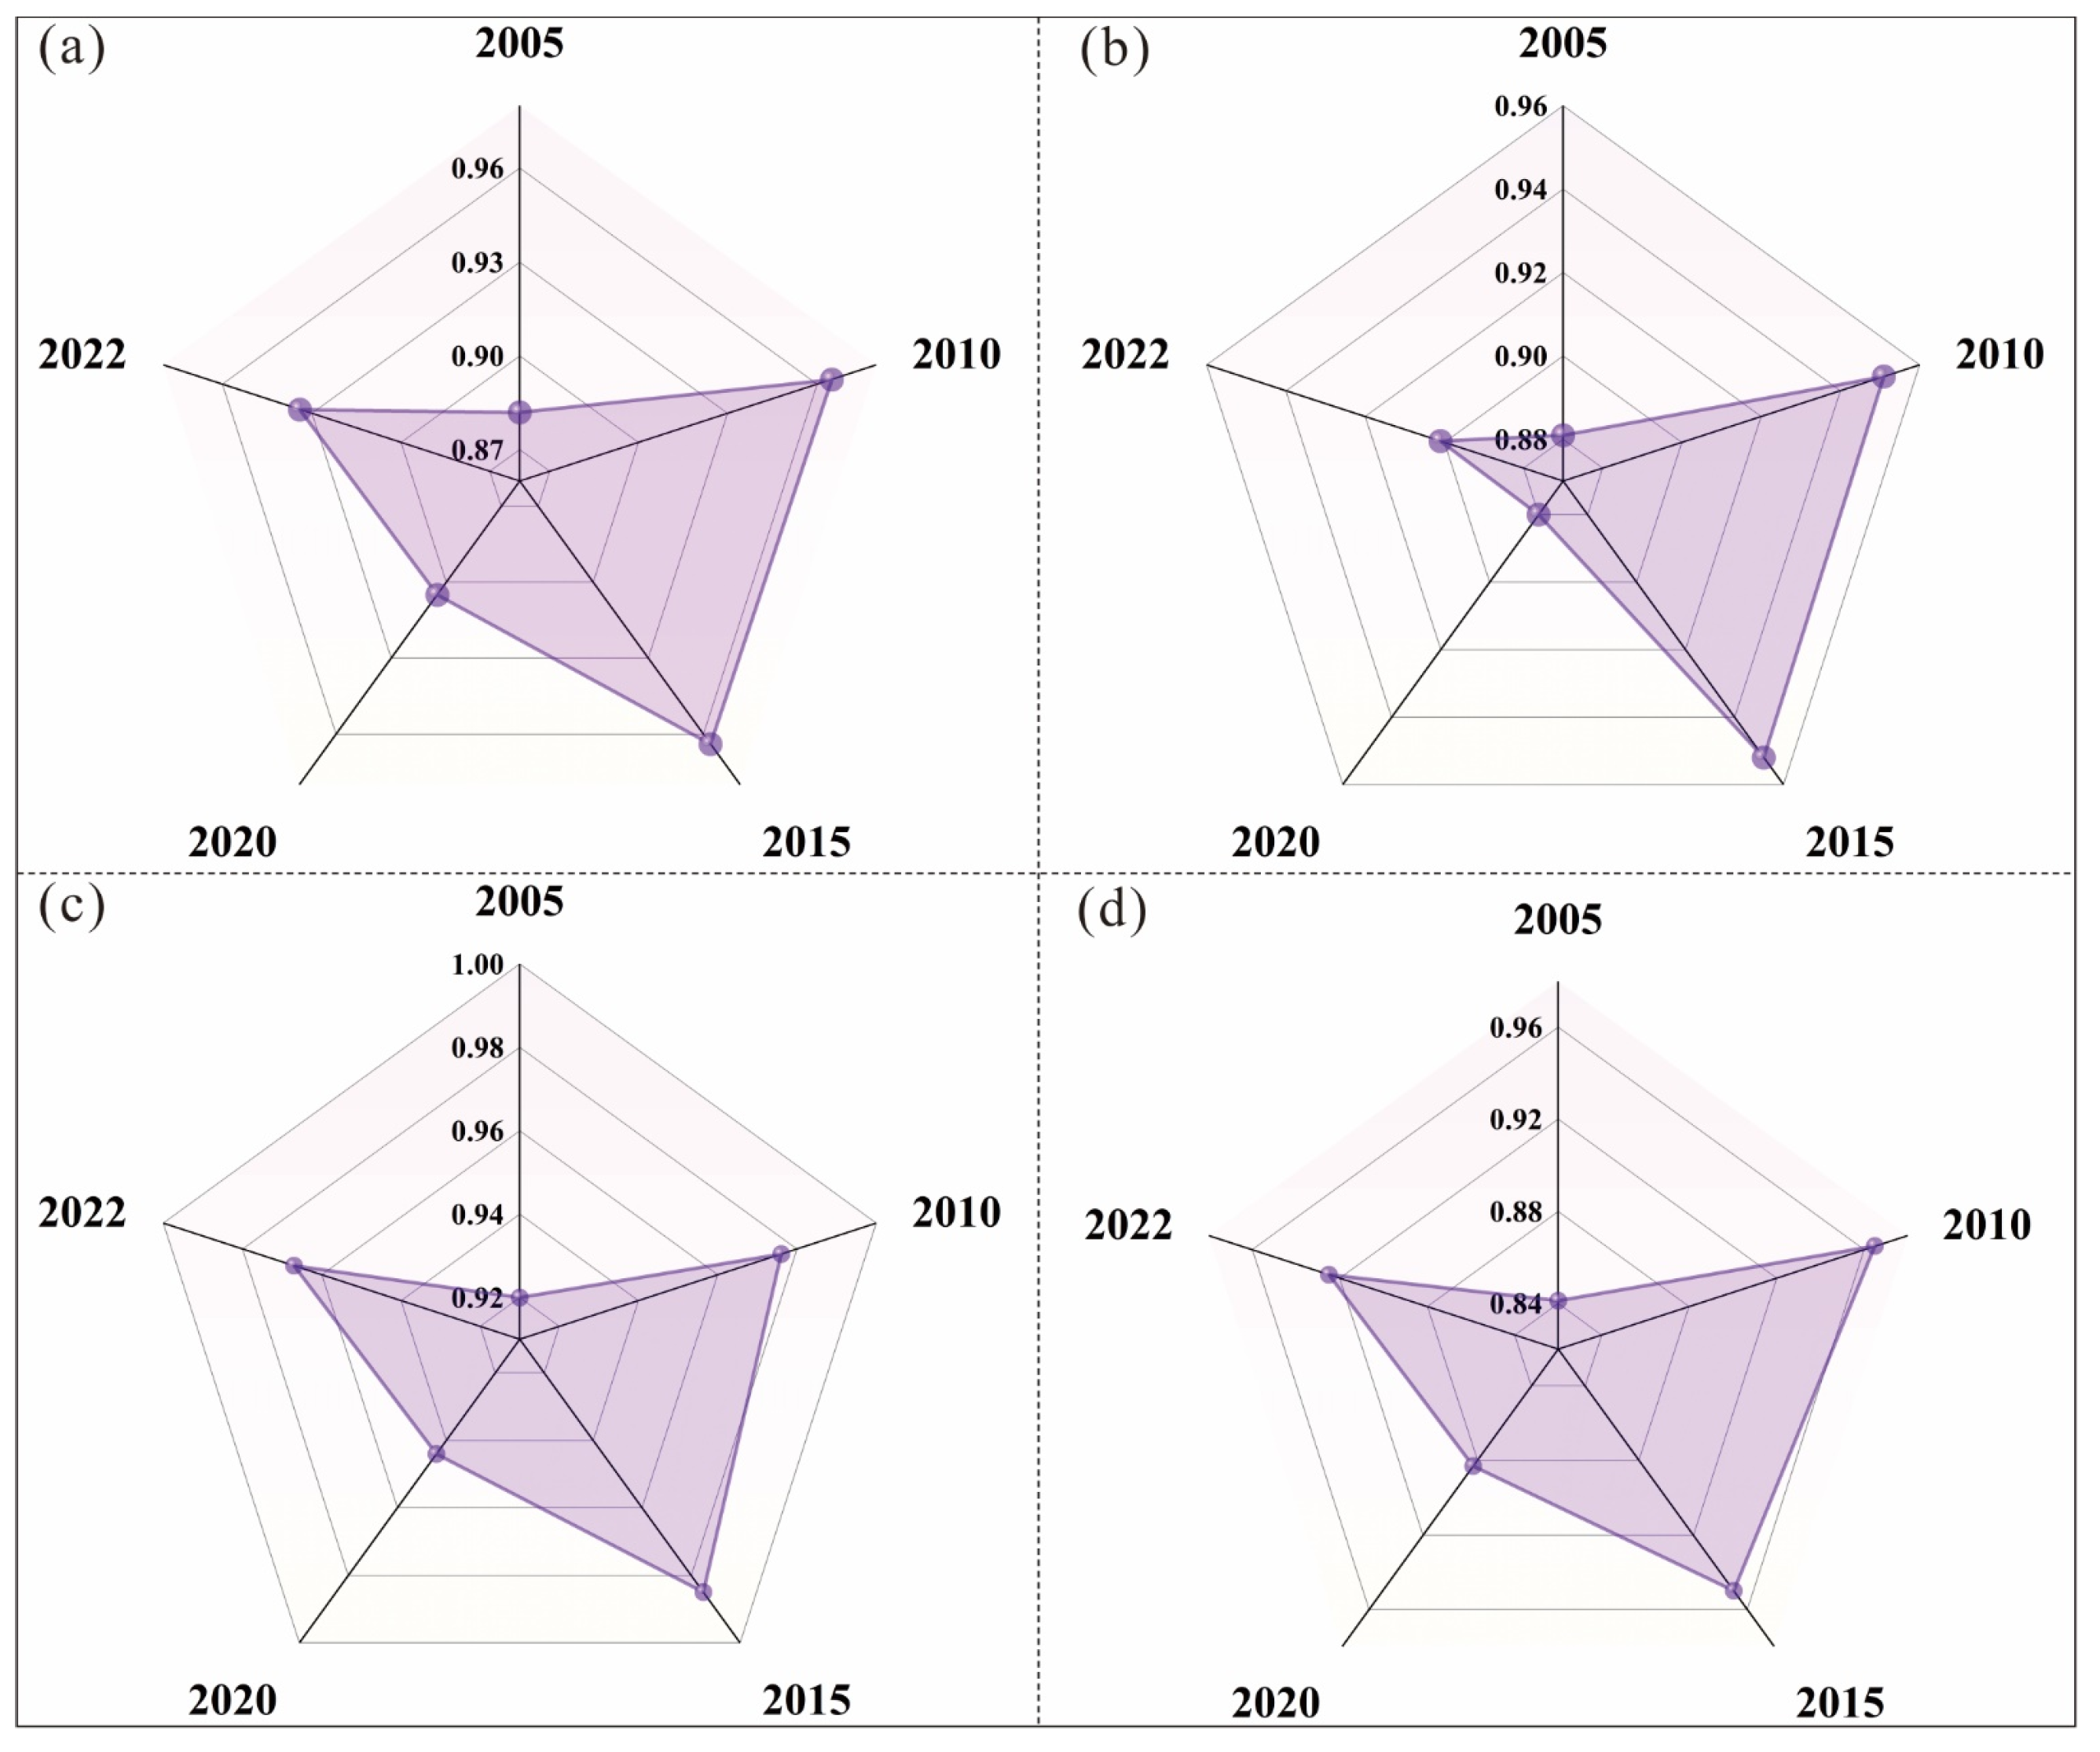
Based on the Super-SBM model, the values of ECLU in the YREB from 2005 to 2022 were calculated (Figure 3a). Drawing on the classification methods of Liu et al. [74] and Tu et al. [75] for measuring efficiency, the ECLU in the YREB is divided into four categories: low efficiency, medium-low efficiency, higher efficiency, and high efficiency zones. Overall, from 2005 to 2022, the ECLU in the YREB has been on the rise, increasing from 0.882 in 2005 to 0.934 in 2022, a growth of 5.81%. The trend shows a “rise-fall-rise” pattern, exhibiting an “N”-shaped change. The overall increase is primarily driven by the combined effects of policy support, technological advancements, and resource optimization that enhance efficiency. The mid-term decline is mainly attributed to rapid urbanization and industrialization, exacerbated agricultural non-point source pollution, and excessive resource development and utilization leading to reduced efficiency. The subsequent rise is due to intensified ecological restoration and governance efforts, the promotion of green agricultural development models, and improved resource management and optimization that contribute to efficiency recovery.
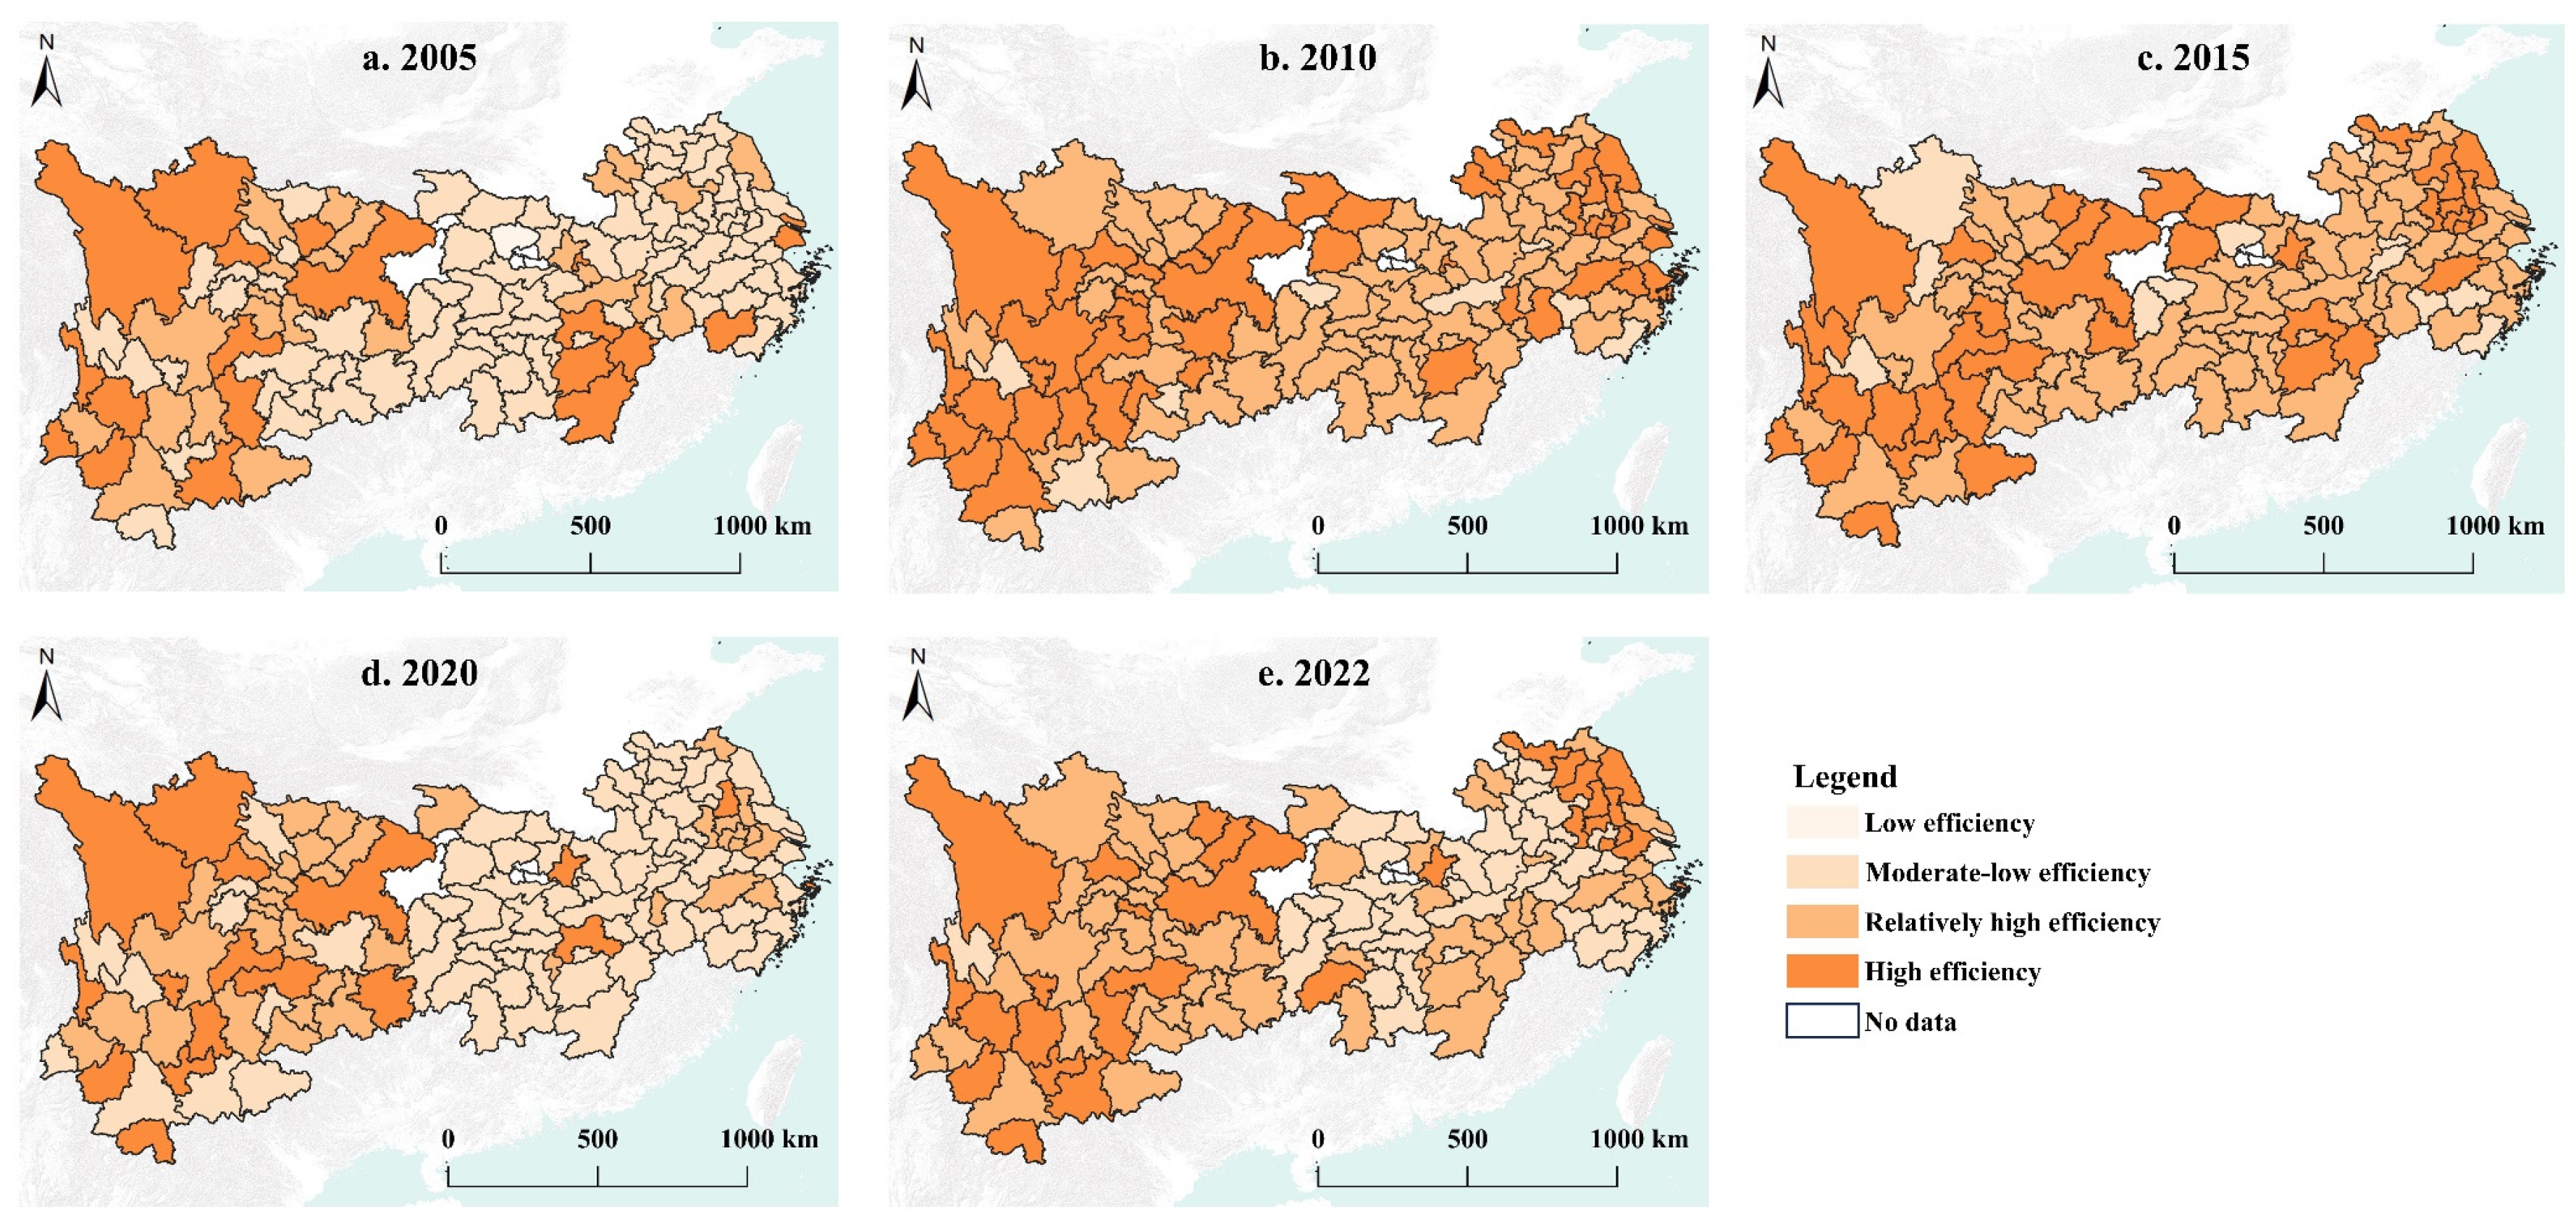
From the perspective of city scale, the ECLU in the YREB have increased, with 102 cities showing an upward trend, accounting for 81.60%, while 23 cities, accounting for 18.40%, are experiencing a decline (Figure 4). In 2005, there were a total of 83 cities in low and medium-low efficiency zones, while only 42 cities were in higher and high-efficiency zones. By 2022, the number of cities in low and medium-low efficiency zones decreased to 42, while those in higher and high-efficiency zones increased to 83. Overall, this indicates a reduction in low and medium-low efficiency cities and an increase in higher and high-efficiency cities. This trend is closely related to the successive introduction of national policies on the protection and utilization of cultivated land resources, along with the emergence of ecological civilization concepts such as “ecological priority, green development” and “jointly promoting the protection of the Yangtze River without large-scale development”. Consequently, the ECLU in the YREB is expected to continue improving.
At the river basin scale, the ECLU in the upper reaches of the YREB grew by an average of 0.29% each year, from 0.920 in 2005 to 0.967 in 2022 (Figure 3b). The ECLU increased at an average yearly growth rate of 0.13% in the middle reaches of the YREB, from 0.881 in 2005 to 0.901 in 2022 (Figure 3c). With an average yearly rise of 0.56%, the ECLU in the lower reaches of the YREB rose from 0.841 in 2005 to 0.925 in 2022 (Figure 3d). In general, the ECLU in the upper, middle, and lower reaches of the YREB is increasing, though at different rates. The observed trend indicates that eco-efficiency is greatest in the upper reaches, followed by the lower reaches, while the middle reaches have the lowest eco-efficiency.

3.2. Spatial Characteristics of ECLU in the YREB

3.2.1. Spatial Correlation Analysis

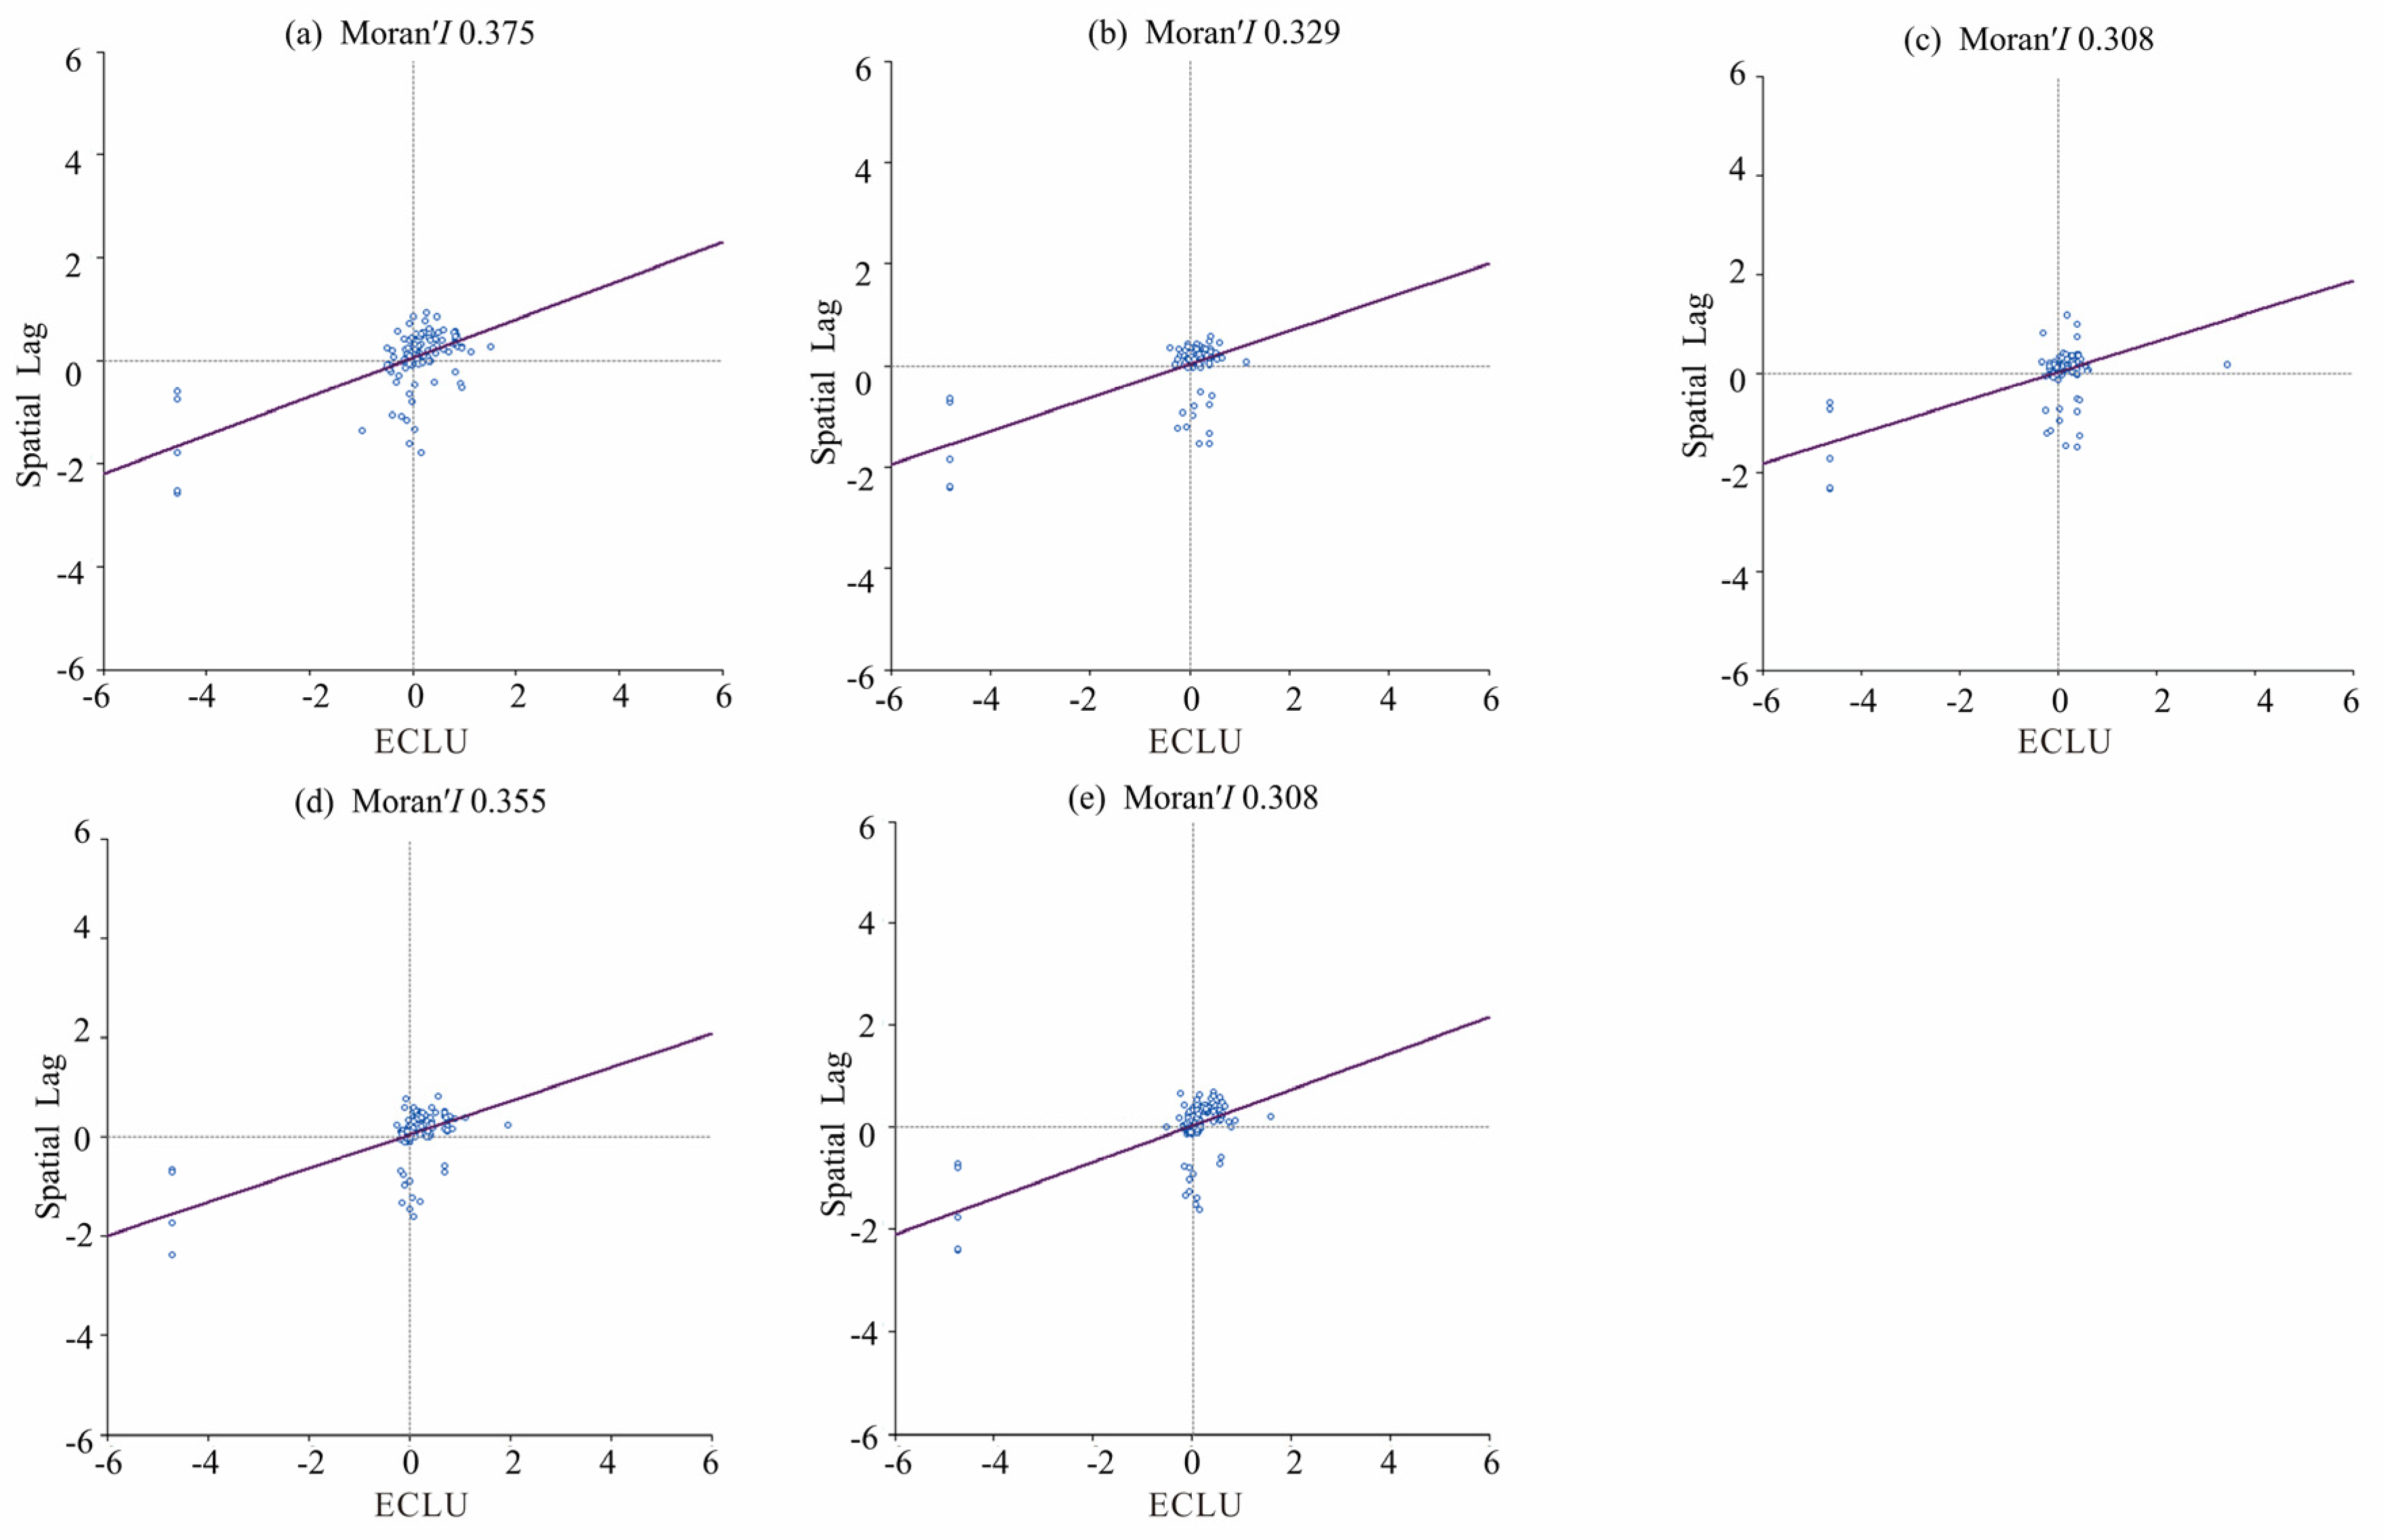
Using Geoda software, the global Moran’s I index for the ECLU in the YREB was computed. During the study period, the index consistently exceeded 0.3 each year and passed the 1% significance test, indicating a significant positive correlation in ECLU among neighboring cities in the YREB. This suggests that the region exhibits spatial clustering characteristics, with more pronounced spatial spillover effects of eco-efficiency in adjacent areas (Figure 5). From the trend of change, the Moran’s I index decreased from 0.375 in 2005 to 0.308 in 2015, then rose to 0.355 in 2022, showing a “V” shaped change pattern. This shows that over the research period, there was a “strong-weak-strong” evolutionary tendency in the global spatial autocorrelation of ECLU in the YREB. The scale of cultivated land use has greatly expanded due to the advancement of agricultural technology and the aggressive application of comprehensive land remediation. This has contributed to the creation of demonstration effects that encourage increases in input-output efficiency in neighboring regions.
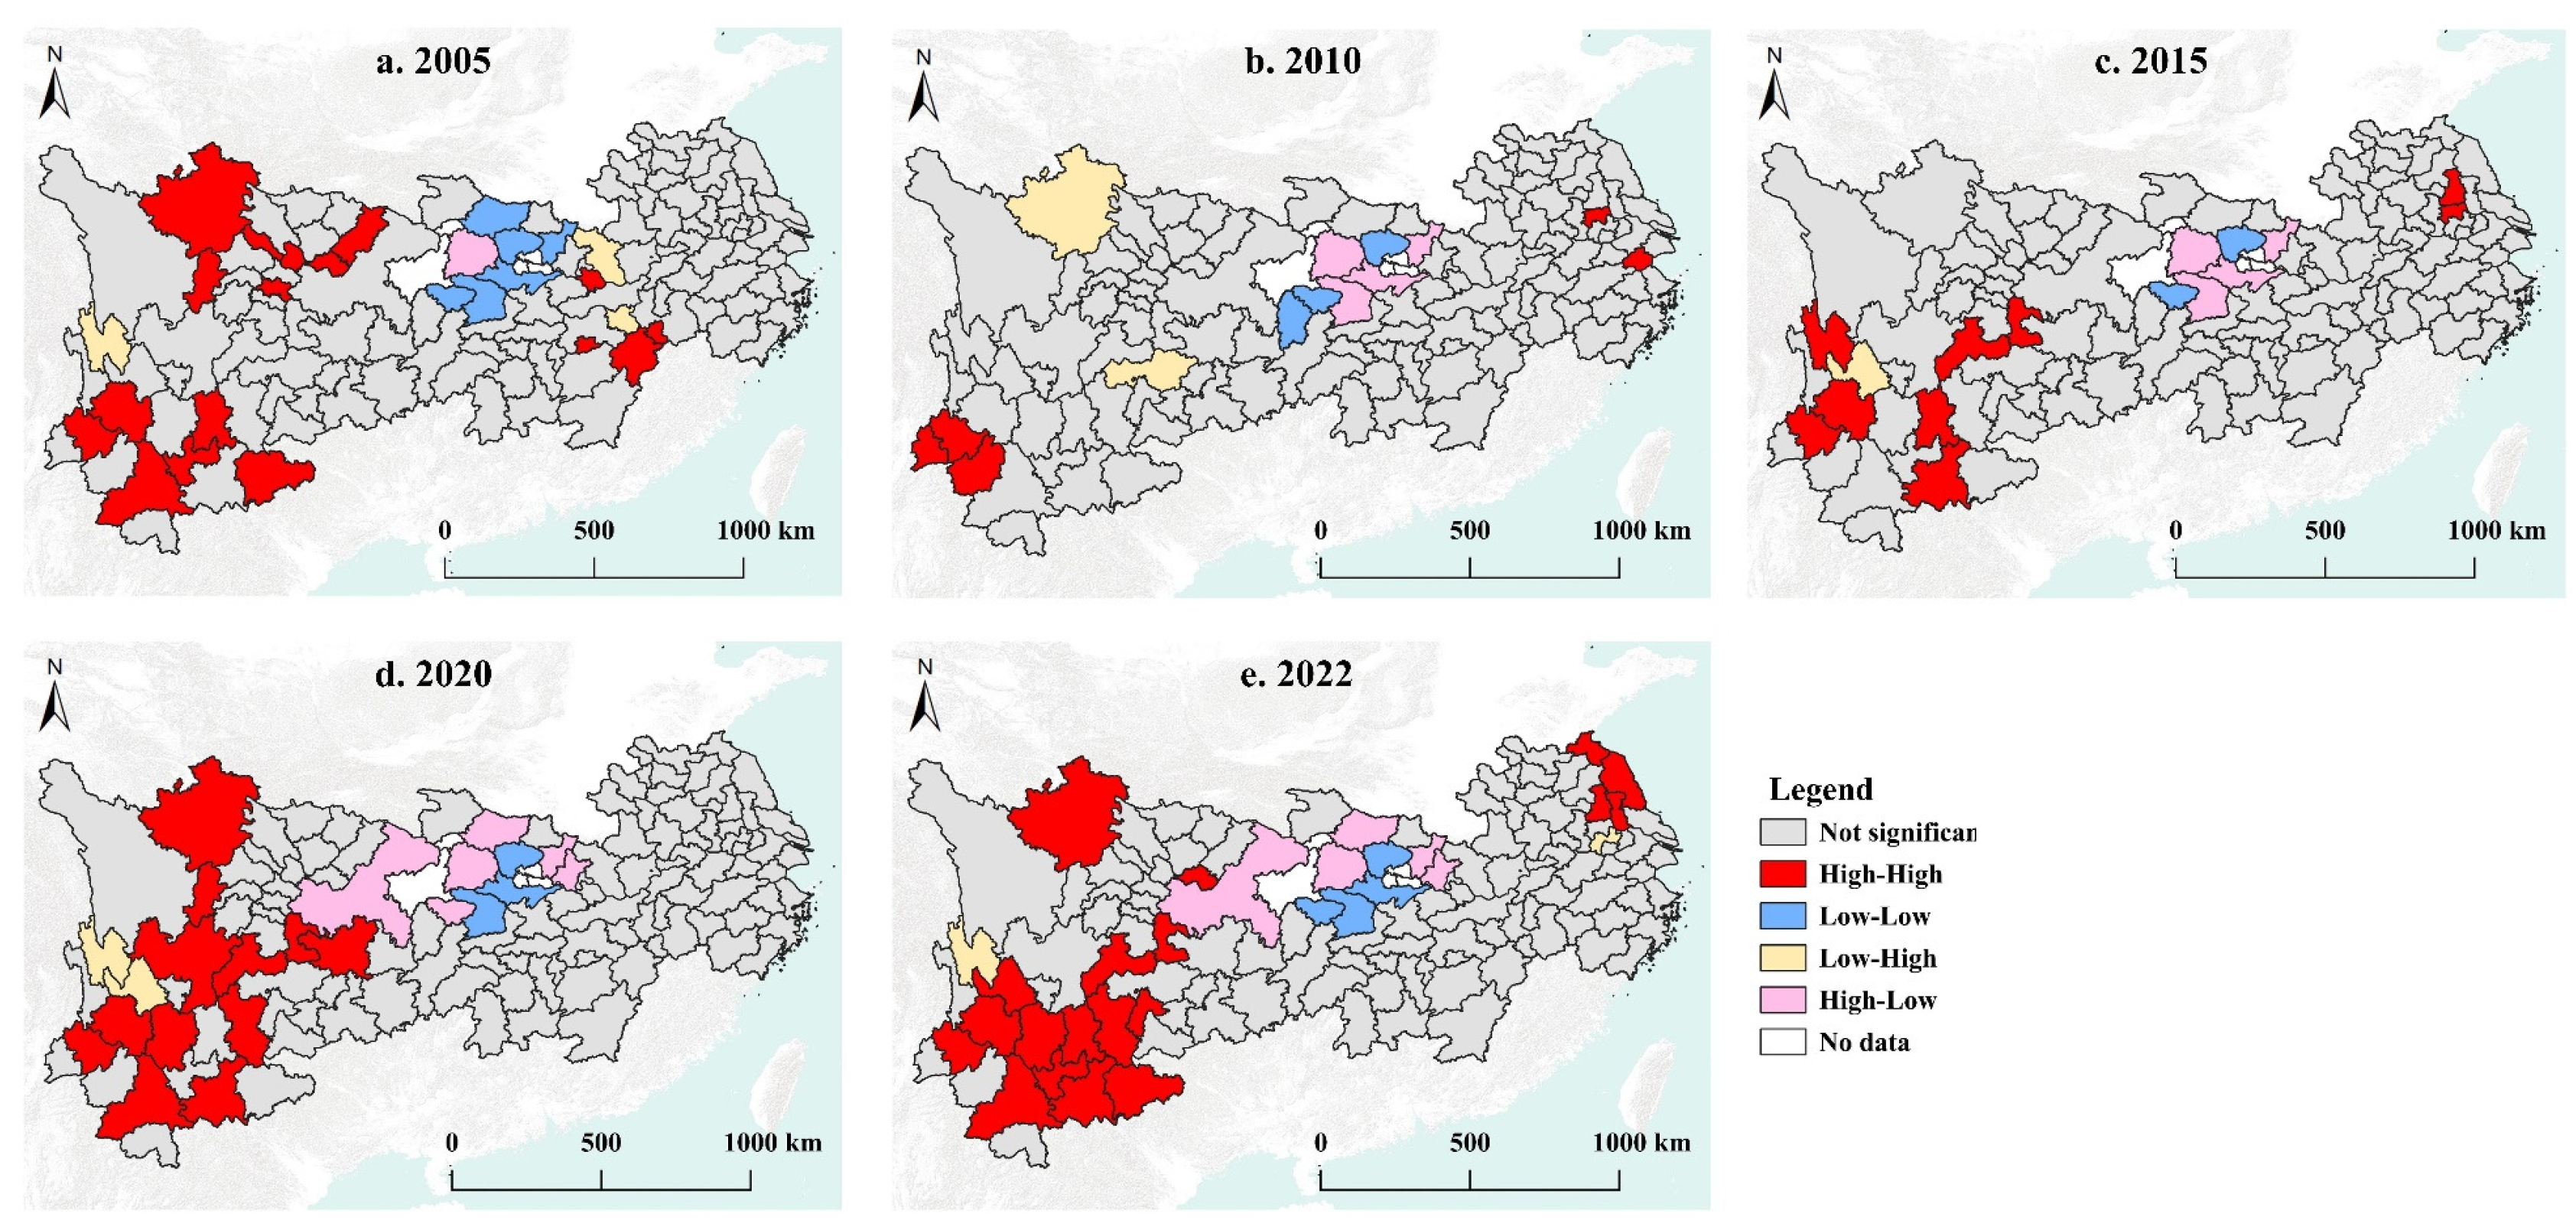
Using the local spatial autocorrelation method, the local evolutionary characteristics of ECLU were analyzed, and the LISA clustering map was created (Figure 6). The YREB’s ECLU showed notable spatial variation patterns during the course of the investigation. Cities with high-high clustering had a tendency of first declining and then growing between 2005 and 2022, which together reflected a “multi-core clustering” trait. The advantages of the upper reaches are particularly pronounced, with high-high clusters exhibiting a certain degree of temporal and spatial continuity, simultaneously driving the development of adjacent areas through a spillover effect. High-high clusters are currently mostly found in northern Sichuan, northeastern Jiangsu, and certain regions of Chuxiong and Yuxi, Yunnan. The high-high cluster formed in the upper reaches of Yunnan and Sichuan is primarily derived from their plateau locations, abundant sunlight and heat, and a prominent phenomenon of concentrated development of economic crops. High investments in agricultural technology and low usage rates of fertilizers, pesticides, and other sources of carbon emissions and non-point source pollution contribute to the formation of high-value areas of ECLU. The number of cities in low-low clusters is decreasing, forming a “single-core clustering” characteristic, mainly distributed in regions like Jingzhou and Jingmen in central Hubei Province. This area has long remained in a low-value cluster for ECLU, possibly falling into the depths of a “poverty trap”. This is primarily due to its location in a major grain-producing area, where extensive use of pesticides, fertilizers, agricultural films, and mechanization has resulted in high levels of unwanted outputs, such as carbon emissions and non-point source pollution, significantly reducing eco-efficiency. High-low clusters and low-high clusters exhibit a coexistence of centralization and decentralization. For example, Chongqing, located in the upper reaches, is in a high-low cluster and is currently in a “echo effect” stage, attracting the inflow of surrounding factors, leading to a developing trend of low-high clusters in some nearby areas.

3.2.2. Migration of Spatial Center of Gravity

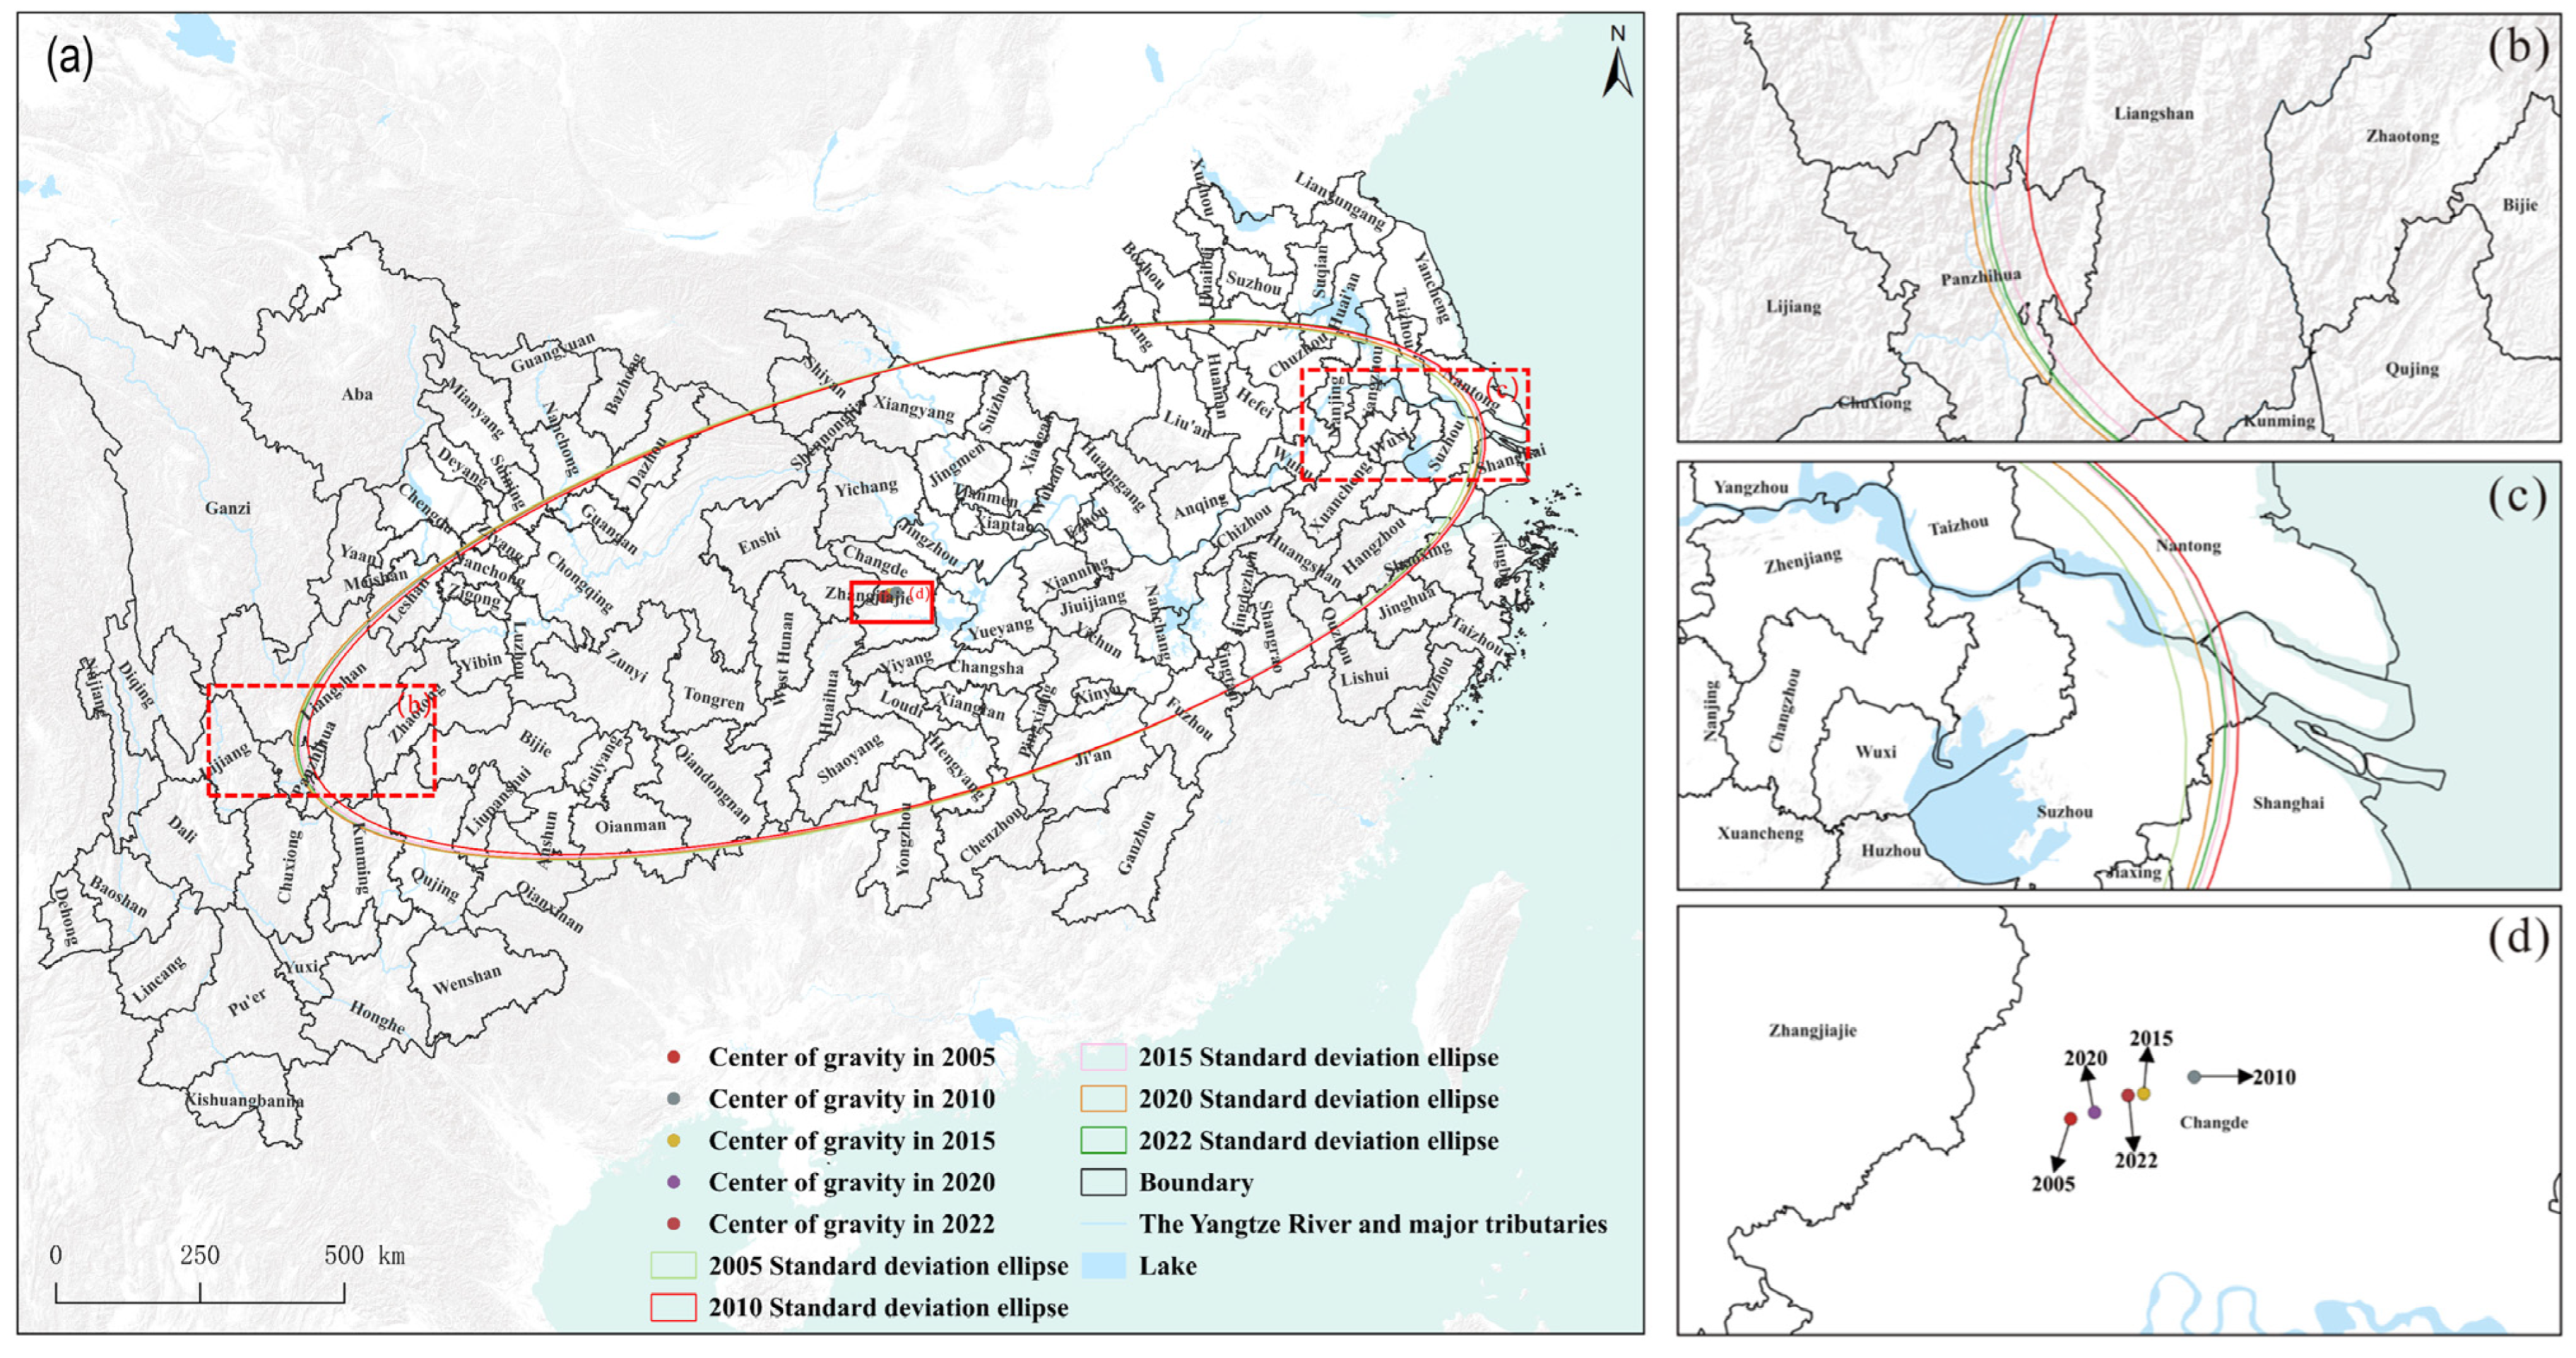
Based on SDE and the evolution of the center of gravity, the evolutionary patterns of ECLU in the YREB were further explored (Figure 7). From 2005 to 2022, the migration trajectory of the center of gravity for ECLU showed a path of southwest-northeast-southwest return (Figure 7d). The ECLU in the YREB showed a changing development condition over the research period, with a reduction followed by a rise that resembled a “N” shape. Notably, there were more cities in the southwest region experiencing efficiency growth, indicating a clear high-high clustering trend, which significantly impacts the spatial distribution pattern. The main reasons for this trend include the introduction of policies aimed at effectively linking the consolidation and expansion of poverty alleviation achievements with rural revitalization. Many areas in the study region have been lifted out of poverty, and cooperation and support between the eastern and western regions have greatly increased. There has been a rise in agricultural technology investments, adjustments in agricultural industrial structures, and the implementation of reduction and efficiency enhancement actions for pesticides and fertilizers. Additionally, policies such as “dual support for intelligence and aspirations” during the poverty alleviation period have gradually raised farmers’ awareness of green and low-carbon production. This has allowed the southwest region, particularly Yunnan Province, to fully leverage its natural resource endowments, resulting in a significant clustering of high ECLU, which in turn has led to the observed southwest-northeast-southwest migration of the center of gravity. However, overall, the center of gravity remains located within Changde, Hunan.
The shape of the SDE indicates a high degree of flatness, with the major axis displaying a “southwest-northeast” directional distribution (Figure 7b,c). This suggests that the ECLU in cities of the YREB primarily follows a “southwest-northeast” spatial pattern. High-value areas are mostly distributed along this “southwest-northeast” direction, while low-value areas tend to be located in the “northwest-southeast” direction, demonstrating significant spatial heterogeneity. Notably, the northeast direction of the ellipse is situated in the plain areas of the middle and lower reaches of the YREB, adjacent to the Huang-Huai-Hai Plain, which is an important grain-producing base in China. The flat terrain and abundant water resources in this region are conducive to large-scale farming, thereby enhancing the ECLU.

3.3. Analysis of Influencing Factors on ECLU in the YREB

The ECLU is influenced by various factors. Drawing on relevant studies [23,33,34,48,76,77,78] and considering the actual conditions of the YREB, this study constructs an indicator system for influencing factors from four dimensions: natural conditions, socio-economics, cultivation intensity, and resource endowments (Table 2). For natural conditions, the average slope (X1) and average elevation (X2) are selected; for the socio-economic aspect, per capita GDP (X3), per capita disposable income of the rural population (X4), and urbanization rate (X5) are chosen; cultivation intensity includes the cropping intensity index (X6) and cultivated land reclamation rate (X7); resource endowments are represented by per capita sown area of crops (X8) and per capita cultivated land area (X9). Before conducting the GWR model, each influencing factor is standardized using the range method to eliminate dimensionality. Furthermore, to investigate multicollinearity among factors, we set the Variance Inflation Factor (VIF) threshold to less than 7.5, considering the characteristics of the data and research objectives. We employed IBM SPSS Statistics 22 (https://www.onlinedown.net/soft/1227737.htm, accessed on 28 November 2024) for Ordinary Least Squares (OLS) linear regression analysis to diagnose factors with VIF values below 7.5, thereby eliminating multicollinearity among factors. Ultimately, we established nine influencing factors for geographically weighted regression. Using GWR4 software (https://gwrtools.github.io/, accessed on 28 November 2024), we used the ecological efficiency of cultivated land use in the Yangtze River Economic Belt as the dependent variable. The spatial weighting function was selected as Gaussian with AICc bandwidth methods, and modeling was conducted on an annual basis. The residual squares, Sigma, and AICc values were all relatively small (Table 2), indicating that the model fit was satisfactory. The regression model parameters for ECLU in the YREB show R2 values of 0.317, 0.237, 0.525, 0.436, and 0.459, indicating a lower fit in the early stages and a higher fit later on. However, the significance of most influencing factors across cities is high, suggesting that the results are representative.

3.3.1. Impact of Natural Conditions on ECLU

Average slope (X1) and average elevation (X2) were selected to represent natural conditions. During the study period, both average slope and average elevation had a negative impact on the ECLU in the YREB. This suggests that the ECLU steadily declines with increasing elevation and slope. Elevated slope exacerbates soil nutrient depletion by increasing the likelihood of soil erosion and water loss. Pesticides and fertilizers are used much more often to guarantee grain output, which has an impact on eco-efficiency. Higher elevation adversely affects the availability of resources such as light, heat, and water, thereby indirectly increasing the inputs required for cultivated land use and impacting its eco-efficiency.

3.3.2. Impact of Socio-Economic Factors on ECLU

Per capita GDP (X3), per capita disposable income of the rural population (X4), and urbanization rate (X5) are used to represent the level of socio-economic development. Per capita GDP consistently has a positive impact on eco-efficiency, though the degree of influence is decreasing. Constant increases in GDP per capita ultimately flow back into agriculture, boosting technology investments in the utilization of cultivated land and encouraging efficiency gains. The impact of per capita disposable income on eco-efficiency fluctuates; it was positive only in 2010 and negative in other years. As per capita disposable income increases, farmers become more aware of environmental protection, but this also encourages them to increase production inputs. However, limited personal capacity affects the improvement of eco-efficiency. The urbanization rate fluctuates and has recently shown a negative impact, as urbanization accelerates the transformation of cultivated land use in the YREB, leading to significant land occupation or loss and reducing the effective supply of cultivated land, thereby affecting eco-efficiency.

3.3.3. Impact of Cultivation Intensity on ECLU

The cropping intensity index (X6) and cultivated land reclamation rate (X7) were used to represent cultivation intensity. The cropping intensity index was negative in 2015 and 2022 but positive in other years. This is mainly due to repeated cultivation of the same plot in the same year, which can increase yield and output efficiency. However, the impact may be lessened if tillage frequency is increased and if pesticides, fertilizers, and agricultural films are used, as these practices may result in undesirable outcomes. Due mainly to the increased reclamation rates that enable intensive and large-scale management of cultivated land, the impact of the rate of reclamation of cultivated land on eco-efficiency is continuously positive and exhibits a fluctuating growth pattern.

3.3.4. Impact of Resource Endowments on ECLU

Per capita sown area of crops (X8) and per capita cultivated land area (X9) are used to represent resource endowments. Initially, per capita sown area of crops had a positive impact, but this turned into a negative in later years, indicating that while an increase in sown area initially promotes large-scale and intensive management, it can negatively affect eco-efficiency once a certain scale is reached. Per capita cultivated land area is negative only in 2020, while being positive in other years, though the degree of impact is decreasing. This suggests that increasing the area per person contributes to increased eco-efficiency; but, in recent years, a significant number of young workers have left the region in search of employment, leaving behind elderly agricultural populations, which lessens the total impact.

3.3.5. Spatial Heterogeneity of Influencing Factors on ECLU by City

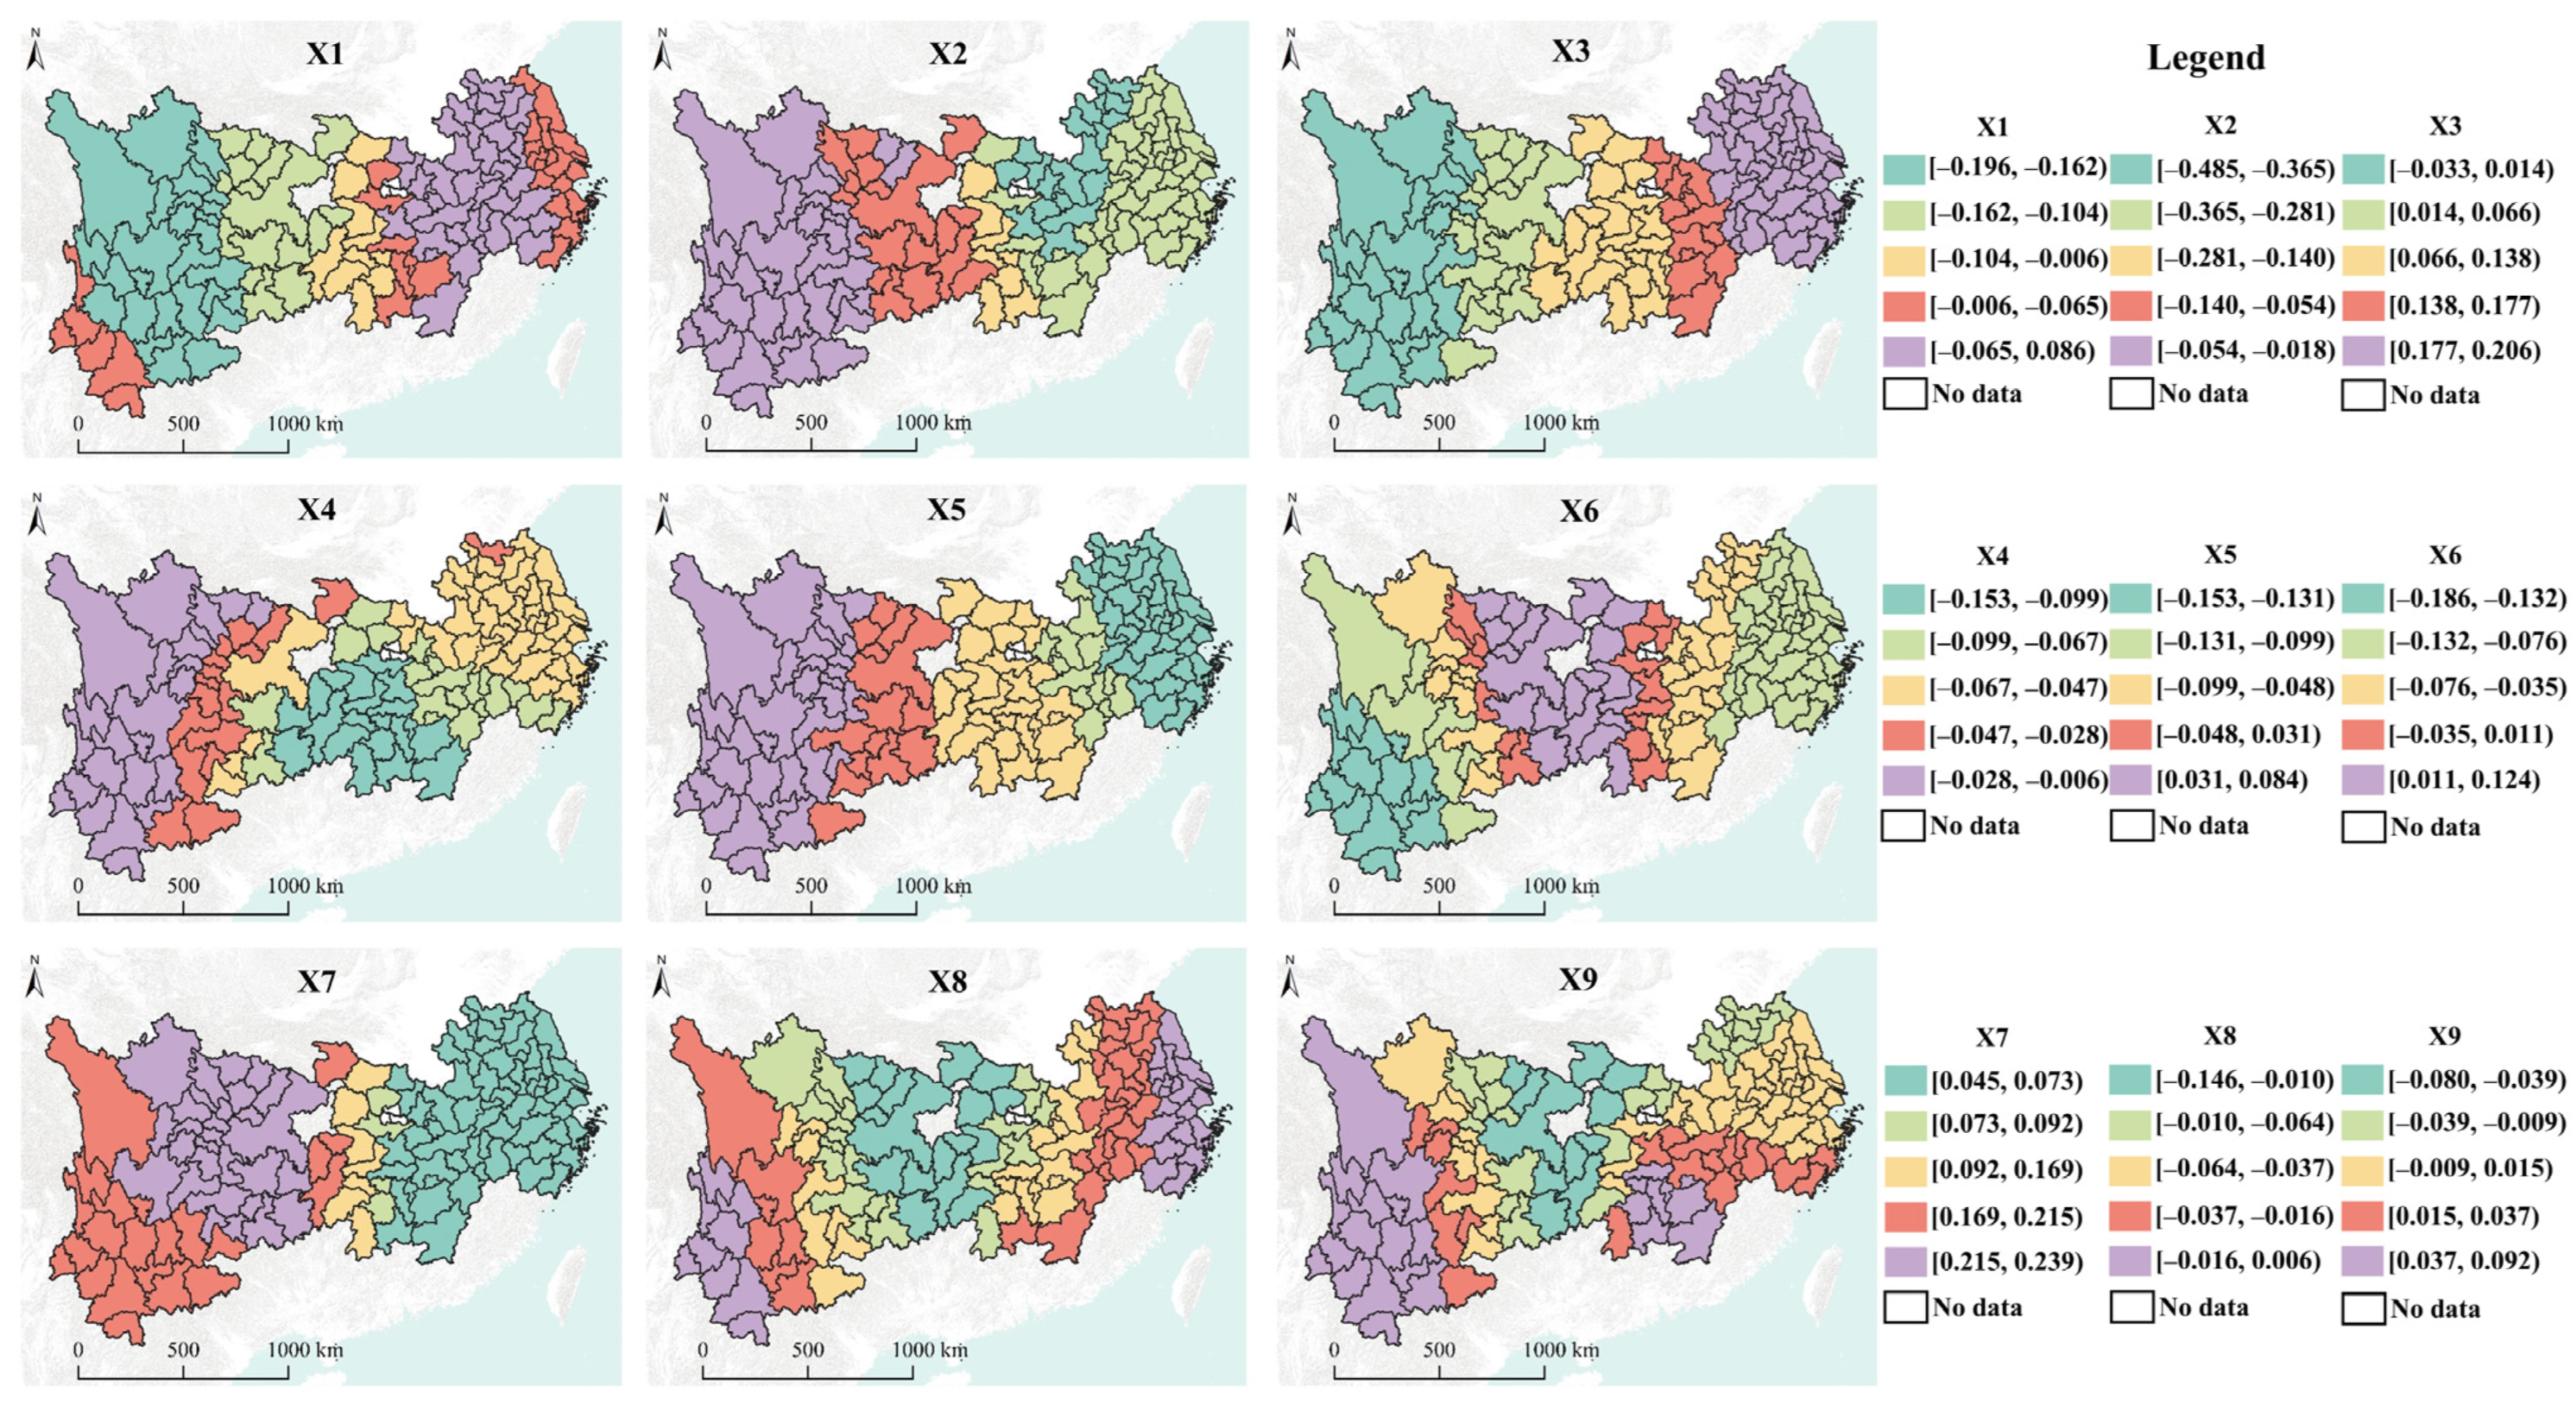
The visualization results (Figure 8) and regression coefficients of the different influencing factors in 2022 were used to analyze the spatial heterogeneity of these factors’ effects on ECLU in cities. In various YREB areas, eco-efficiency is influenced both positively and negatively by average slope, per capita GDP, urbanization rate, cropping intensity index, per capita cultivated land area, and per capita sown area of crops. In contrast, average elevation and per capita disposable income of rural populations negatively affect eco-efficiency across all cities, while the cultivated land reclamation rate positively impacts eco-efficiency in all cities.

4. Discussion

4.1. Temporal and Spatial Evolution of ECLU and Regional Differences

In the context of strategies such as food security, ecological protection, and rural revitalization, the deepening implementation of new urbanization will undoubtedly pose more severe challenges to cultivated land protection. As a crucial agricultural industrial belt in the country, the YREB faces significant importance in ensuring and enhancing the ecological efficiency of cultivated land use, which is vital for achieving high-quality regional development. The ECLU in different YREB cities is calculated in this study using the Super-SBM. Overall, the eco-efficiency shows a fluctuating upward trend, consistent with the findings of Zhang et al. [79], Zhu and Li [78], and Zhang et al. [74]. Differing from previous research perspectives, this study explores regional differences in eco-efficiency across multiple scales. At the city level, there are more high-efficiency and very high-efficiency cities than low-efficiency and medium-low-efficiency cities, and the total efficiency of the western area is higher than that of the eastern and central regions. At the basin level, the upper reaches of the YREB are more efficient than the lower and middle reaches. This is primarily due to the significant economic differences between the upstream, midstream, and downstream regions. The upstream economy is relatively underdeveloped, but its unique geographical location, abundant sunlight and heat, and important ecological functions, combined with policies for the western development, fiscal transfer payments, and ecological compensation funding, have improved agricultural production conditions and ecological environments, thereby enhancing the ecological efficiency of cultivated land utilization. The downstream regions are economically developed and have high technical levels, enabling them to invest more resources into the efficient use of cultivated land and ecological protection. In contrast, the midstream region has a large agricultural development scale, but with the acceleration of industrial structure adjustment and urbanization, the dilemma of high consumption and high investment to secure food production is difficult to improve, resulting in lower ecological efficiency of cultivated land utilization compared to other areas. This study employs a spatial autocorrelation model to explore the spatial clustering characteristics of ECLU across cities in the YREB. The global Moran’s I index remained above 0.3 throughout the study period, indicating significant spatial clustering. The patterns of high-high clustering and low-low clustering are clearly evident, consistent with the conclusions of Li et al. [80] and Liu et al. [74]. High-high clustering is mainly observed in the upstream region, which stems from two factors: first, its unique geographical location which has led to a prominent phenomenon of large-scale concentrated development of cash crops, with relatively high agricultural technology investment, while the usage rates of fertilizers, pesticides, and other sources that can generate carbon emissions and non-point source pollution are low; second, strong support from policies such as the Western Development Strategy and ecological compensation. In contrast, low-low clustering is primarily concentrated in urban areas of the midstream region. With the acceleration of industrial structure adjustment and urbanization, the cultivated land area in these cities is continuously decreasing. To ensure food production, high-consumption and high-investment cultivation methods have to be adopted, resulting in lower ecological efficiency of cultivated land utilization. Unlike previous studies that used trend surfaces [81] or kernel density [33] methods to explore spatial evolution, this research uses SDE and center of gravity migration to characterize the spatial evolution of eco-efficiency, showing an overall migration direction of “southwest-northeast”, with the center of gravity consistently located in Changde, Hunan. The shift is attributed to advantages in policy support and resource investment in the southwest direction, which enhance the ecological efficiency of cultivated land utilization. In the northeast direction, economic development and advanced technology support efficient use of cultivated land and ecological protection. Conversely, the midstream region experiences reduced cultivated land and high-consumption production methods, leading to lower ecological efficiency. This regional disparity drives the high-value areas to migrate towards the “southwest-northeast” direction. This precise identification of migration direction and center trajectory aids local governments in implementing targeted policies and regional remediation to enhance ECLU.

4.2. Spatial Heterogeneity of Influencing Factors on ECLU

Using the GWR model, this study embeds influencing factors in spatial locations and analyzes the regression coefficients of each factor to reveal their temporal and spatial heterogeneity. In line with the findings of studies by Ma et al. [33], Zhang et al. [79], and Ren et al. [82], research indicates that the direction and extent of effect of different factors on the ECLU vary throughout cities. Because of the notable topographical variations between the eastern, middle, and western parts of China, which are represented by the YREB, this study takes elevation and slope into account as influencing variables, in contrast to previous studies. The findings indicate that in 2022, the lower reaches of the YREB, including Shanghai, Nanjing, and Hefei, are where average slope has the most beneficial influence on eco-efficiency. This is because the terrain is flat and the general slope is low, allowing for greater efficiency within certain slope ranges. Conversely, average elevation consistently has a negative impact, indicating that as elevation increases, eco-efficiency gradually decreases, with regions having large absolute values of regression coefficients primarily located in Hubei and Anhui provinces, where the terrain is flat and elevation differences significantly affect the area. Furthermore, research on the influence of cultivation intensity on eco-efficiency is relatively scarce. Some scholars have used the cropping intensity index, which shows varying impacts on eco-efficiency across cities and generally presents a fluctuating trend, consistent with the conclusions of Ji et al. [83] and Zhao et al. [84]. In terms of cultivation intensity, this study also considers the cultivated land reclamation rate, which has a positive impact across all cities. This is mostly due to the fact that a bigger reclamation scale makes administration and operation more effective, and sensible land use methods may lower the usage of pesticides and fertilizers, minimize pollution from non-point sources, and save the natural environment.

4.3. How Increased Agricultural Productivity Leads to Higher Carbon Emissions

In this study, we measure the ecological efficiency of cultivated land use by considering expected and unexpected outputs, effectively integrating ecological and economic factors. However, the question of how increased agricultural productivity leads to higher carbon emissions warrants reflection. On the one hand, while advancements in agricultural productivity often rely on scientific and technological means, many regions still depend on the increased use of agricultural inputs such as fertilizers and pesticides. The rise in these inputs inevitably releases more greenhouse gases. On the other hand, with the acceleration of urbanization, the scale of construction land continues to expand, cities absorb more rural population, and the issue of rural hollowing becomes severe. To ensure grain production, large-scale mechanized farming is necessary, leading to an increased consumption of diesel, electricity, and other resources, thereby increasing carbon emissions. Additionally, farmers’ pursuit of higher economic returns will inevitably alter crop structures, posing significant challenges for carbon emissions. To effectively balance these relationships, we propose the following strategies: first, actively promote green agricultural technologies to improve resource utilization efficiency and reduce carbon emissions and non-point source pollution. Second, optimize agricultural industry structure, strengthen policy support and guidance, advocate for green agricultural technologies, and raise farmers’ awareness of environmental protection. Third, establish a sound ecological compensation mechanism to provide precise compensation for farmers who incur economic losses due to ecological protection, promoting a positive interaction between ecological conservation and agricultural production.

4.4. Policy Recommendations

We provide the following three suggestions to enhance the ECLU in the YREB based on the examination and debate of the temporal and spatial evolution of ECLU in 125 YREB cities between 2005 and 2022, as well as the existing state of the YREB.
  • Strengthen policy implementation and explore regional development paths. Leverage core cities to drive regional development, fully utilizing the exemplary role of high-high clustering cities such as Sichuan, Yunnan, and Jiangsu to stimulate neighboring areas through a trickle-down effect. For high-high clustering areas, implement a farmland protection compensation mechanism that expands the compensation scope, conducts special compensation, and integrates project compensation. This aims to incentivize farmers to protect farmland and promote green utilization. Additionally, through regional cooperation, facilitate technological exchange and resource sharing to drive joint development in surrounding areas. For low-low clustering areas, actively promote water-saving agricultural technologies, implement initiatives for creating green, high-yield, and efficient farming practices, and pursue zero growth in fertilizer and pesticide usage. Reasonable land use planning should be established, alongside strengthened farmland protection. Furthermore, through policy guidance and financial support, agricultural industrial upgrading and transformation is promoted. In order to generate positive spillover effects from high-efficiency areas to neighboring cities, actively investigate sustainable agricultural development models for low-carbon emissions and high yields in low-low clustering areas in central Hubei, with a focus on cities like Chongqing, Yichang, and Xiangyang. Enhance regulatory oversight in low-high clustering areas and formulate corresponding policies to improve ECLU.
  • Increase technological investment to enhance agricultural technology levels. Strengthen integrated technology research for controlling agricultural non-point source pollution, forming a diversified comprehensive management model. Promote the use of biological pesticides to replace chemical ones and organic fertilizers to replace conventional fertilizers, reducing their usage, decreasing carbon emissions, and addressing non-point source pollution. Increase agricultural technology investment, particularly in internal funding and experimental development expenditure, to drive technological progress in agriculture.
  • Enhance awareness campaigns to improve farmers’ environmental awareness. Utilize multiple channels to promote sustainable land use practices among farmers, strengthening environmental awareness. Encourage reductions in the use of pesticides, fertilizers, and agricultural films through the establishment of environmental reward mechanisms. Promote green farming practices and provide agricultural technology and skill training to improve farmers’ production capabilities and environmental technology levels, thereby enhancing ECLU.

4.5. Research Outlook

This study highlights the spatial-temporal evolution patterns of ECLU across different cities in the YREB from 2005 to 2022, while also identifying the influencing factors. As a result, this study has theoretical implications for attaining sustainable agricultural growth, encouraging low-carbon emissions, and guaranteeing food security. However, given the large number of cities involved and the lengthy time span, and considering data availability, only municipal statistical data, cultivated land use data, and geographic spatial data were used for calculations. Future research will adopt a micro perspective through field surveys, focusing on farmers’ own cultivation behaviors, collecting data, establishing models, and conducting in-depth studies to provide more scientific evidence for sustainable agricultural development. Additionally, the indicator system for influencing factors requires further refinement. In the next phase, factors such as land transfer (scale operation), digital agriculture, and policy intervention will be incorporated into the indicator system to address the current limitations of this study.

5. Conclusions

This study utilizes panel data from 125 cities in the YREB spanning from 2005 to 2022. By employing models such as Super-SBM, spatial autocorrelation, SDE, and GWR, it investigates the evolution characteristics, spatial-temporal patterns, and influencing factors of ECLU, leading to the following main conclusions:
(1)
The ECLU in the YREB demonstrates an “up-down-up” “N”-shaped trend, rising from 0.882 in 2005 to 0.934 in 2022. At the city level, there is a decline in the number of low-efficiency and medium-low efficiency cities, while high-efficiency and very high-efficiency cities are on the rise. At the basin level, the ECLU exhibits a pattern where the upper reaches are greater than the lower reaches, which in turn are greater than the middle reaches.
(2)
In the ECLU between the cities in the YREB, there are notable spatial clustering features. High-high clustering cities show a development trend of first decreasing and then increasing, overall reflecting a “multi-core clustering” feature. The number of low-low clustering cities is decreasing, forming a “single-core clustering” characteristic. The migration trajectory of the eco-efficiency center shows a southwest-northeast-southwest return path, with ellipses displaying a “southwest-northeast” spatial distribution direction.
(3)
Influencing factors from natural conditions, socio-economics, cultivation intensity, and resource endowments exhibit significant spatial heterogeneity in their impacts on the ECLU across different years and regions in the YREB.

Author Contributions

Conceptualization, X.D. and L.J.; methodology, K.Z. and X.D.; software, K.Z. and B.C.; data curation, K.Z. and B.C.; writing—original draft preparation, K.Z. and X.D.; writing—review and editing, B.C. and L.J.; funding acquisition, X.D. and B.C. All authors have read and agreed to the published version of the manuscript.

Funding

This study was supported by funding from the National Science Foundation grants (No. 42201006) of the Chinese Ministry of Science and Technology, the Natural Science Foundation of Sichuan Province (No. 2022NSFSC1177), and the Fundamental Research Funds of China West Normal University (No. 20E031).

Institutional Review Board Statement

Not applicable.

Informed Consent Statement

Not applicable.

Data Availability Statement

Data are contained within the article.

Acknowledgments

We are very grateful to the editors and anonymous reviewers for their comments on this manuscript.

Conflicts of Interest

The authors declare no conflicts of interest.

Abbreviations

The following abbreviations are used in this manuscript:
YREBYangtze River Economic Belt
ELCUeco-efficiency of cultivated land use
SDEstandard deviational ellipse
GWRgeographically weighted regression

References

  1. Viana, C.M.; Freire, D.; Abrantes, P.; Rocha, J.; Pereira, P. Agricultural land systems importance for supporting food security and sustainable development goals: A systematic review. Sci. Total Environ. 2022, 806, 150718. [Google Scholar] [CrossRef]
  2. Wang, Y.; Cheng, L.; Zheng, Y. An Adjusted Landscape Ecological Security of Cultivated Land Evaluation Method Based on the Interaction between Cultivated Land and Surrounding Land Types. Land 2023, 12, 833. [Google Scholar] [CrossRef]
  3. Jiang, G.; Wang, M.; Qu, Y.; Zhou, D.; Ma, W. Towards cultivated land multifunction assessment in China: Applying the “influencing factors-functions-products-demands” integrated framework. Land Use Policy 2020, 99, 104982. [Google Scholar] [CrossRef]
  4. Ma, L.; Long, H.; Tu, S.; Zhang, Y.; Zheng, Y. Farmland transition in China and its policy implications. Land Use Policy 2020, 92, 104470. [Google Scholar] [CrossRef]
  5. Lai, Z.; Chen, M.; Liu, T. Changes in and prospects for cultivated land use since the reform and opening up in China. Land Use Policy 2020, 97, 104781. [Google Scholar] [CrossRef]
  6. Li, X.; Wu, K.; Yang, Q.; Hao, S.; Feng, Z.; Ma, J. Quantitative assessment of cultivated land use intensity in Heilongjiang Province, China, 2001–2015. Land Use Policy 2023, 125, 106505. [Google Scholar] [CrossRef]
  7. Yang, B.; Wang, Z.; Zou, L.; Zou, L.; Zhang, H. Exploring the eco-efficiency of cultivated land utilization and its influencing factors in China’s Yangtze River Economic Belt, 2001–2018. J. Environ. Manag. 2021, 294, 112939. [Google Scholar] [CrossRef]
  8. Wang, X. Managing Land Carrying Capacity: Key to Achieving Sustainable Production Systems for Food Security. Land 2022, 11, 484. [Google Scholar] [CrossRef]
  9. Zhang, Z.; Zheng, L.; Yu, D. Non-Grain Production of Cultivated Land in Hilly and Mountainous Areas at the Village Scale: A Case Study in Le’an Country, China. Land 2023, 12, 1562. [Google Scholar] [CrossRef]
  10. Huang, D.; Lu, Y.; Liu, Y.; Liu, Y.; Tong, Z.; Xing, L.; Dou, C. Multifunctional evaluation and multiscenario regulation of non-grain farmlands from the grain security perspective: Evidence from the Wuhan Metropolitan Area, China. Land Use Policy 2024, 146, 107322. [Google Scholar] [CrossRef]
  11. Li, Q.; Chen, W.; Shi, H.; Zhang, S. Assessing the environmental impact of agricultural production structure transformation—Evidence from the non-grain production of cropland in China. Environ. Impact Assess. Rev. 2024, 106, 107489. [Google Scholar] [CrossRef]
  12. Qu, Y.; Zhan, L.; Wei, C.; Zhang, Q.; Wang, J. Interactive transition of cultivated land and construction land during china’s urbanization: A coordinated analytical framework of explicit and implicit forms. Land Use Policy 2024, 138, 107049. [Google Scholar] [CrossRef]
  13. Liang, C.; Penghui, J.; Wei, C.; Manchun, L.; Liyan, W.; Yuan, G.; Yuzhe, P.; Nan, X.; Yuewei, D.; Qiuhao, H. Farmland protection policies and rapid urbanization in China: A case study for Changzhou City. Land Use Policy 2015, 48, 552–566. [Google Scholar] [CrossRef]
  14. Wang, X.; Hao, J.-Q.; Dai, Z.-Z.; Haider, S.; Chang, S.; Zhu, Z.-Y.; Duan, J.-J.; Ren, G.-X. Spatial-temporal characteristics of cropland distribution and its landscape fragmentation in China. Farming Syst. 2024, 2, 100078. [Google Scholar] [CrossRef]
  15. Li, X.; Zhang, X.; Jin, X. Spatio-temporal characteristics and driving factors of cultivated land change in various agricultural regions of China: A detailed analysis based on county-level data. Ecol. Indic. 2024, 166, 112485. [Google Scholar] [CrossRef]
  16. Tudi, M.; Daniel Ruan, H.; Wang, L.; Lyu, J.; Sadler, R.; Connell, D.; Chu, C.; Phung, D.T. Agriculture Development, Pesticide Application and Its Impact on the Environment. Int. J. Environ. Res. Public Health 2021, 18, 1112. [Google Scholar] [CrossRef]
  17. Penuelas, J.; Coello, F.; Sardans, J. A better use of fertilizers is needed for global food security and environmental sustainability. Agric. Food Secur. 2023, 12, 5. [Google Scholar] [CrossRef]
  18. Li, Y.-l.; Yi, F.-j.; Yuan, C.-j. Influences of large-scale farming on carbon emissions from cropping: Evidence from China. J. Integr. Agric. 2023, 22, 3209–3219. [Google Scholar] [CrossRef]
  19. Nurse, J.; Basher, D.; Bone, A.; Bird, W. An ecological approach to promoting population mental health and well-being—A response to the challenge of climate change. Perspect. Public Health 2010, 130, 27–33. [Google Scholar] [CrossRef]
  20. Dong, X.; Zheng, L.; Lian, H.; Tian, B.; Chen, Z. Temporal and spatial dynamics and drivers of China’s agriculture net carbon sink. J. Soil Water Conserv. 2024, 38, 198–208. [Google Scholar] [CrossRef]
  21. Wen, T.; Sun, P.; Zhang, L. Dynamic Evolution and Regional Pattern of Agricultural Carbon Emissions in China. Econ. Geogr. 2024, 44, 165–175. [Google Scholar] [CrossRef]
  22. Schaltegger, S.; Sturm, A. Ökologische Rationalität: Ansatzpunkte zur Ausgestaltung von ökologieorientierten Managementinstrumenten. Die Unternehm. 1990, 44, 273–290. [Google Scholar]
  23. Fu, J.; Ding, R.; Zhu, Y.-Q.; Du, L.-Y.; Shen, S.-W.; Peng, L.-N.; Zou, J.; Hong, Y.-X.; Liang, J.; Wang, K.-X.; et al. Analysis of the spatial-temporal evolution of Green and low carbon utilization efficiency of agricultural land in China and its influencing factors under the goal of carbon neutralization. Environ. Res. 2023, 237, 116881. [Google Scholar] [CrossRef] [PubMed]
  24. Wang, G.; Shi, R.; Mi, L.; Hu, J. Agricultural Eco-Efficiency: Challenges and Progress. Sustainability 2022, 14, 1051. [Google Scholar] [CrossRef]
  25. Keating, B.A.; Carberry, P.S.; Bindraban, P.S.; Asseng, S.; Meinke, H.; Dixon, J. Eco-efficient Agriculture: Concepts, Challenges, and Opportunities. Crop Sci. 2010, 50, S-109–S-119. [Google Scholar] [CrossRef]
  26. Wilkins, R.J. Eco-efficient approaches to land management: A case for increased integration of crop and animal production systems. Philos. Trans. R. Soc. London Ser. B Biol. Sci. 2008, 363, 517–525. [Google Scholar] [CrossRef]
  27. Gössling, S.; Peeters, P.; Ceron, J.-P.; Dubois, G.; Patterson, T.; Richardson, R.B. The eco-efficiency of tourism. Ecol. Econ. 2005, 54, 417–434. [Google Scholar] [CrossRef]
  28. Cheng, Y.; Zhu, K.; Zhou, Q.; El Archi, Y.; Kabil, M.; Remenyik, B.; Dávid, L.D. Tourism Ecological Efficiency and Sustainable Development in the Hanjiang River Basin: A Super-Efficiency Slacks-Based Measure Model Study. Sustainability 2023, 15, 6159. [Google Scholar] [CrossRef]
  29. Wu, Y.; Xu, A.; Wang, C.; Shi, Y. Spatial and temporal evolution and influencing factors of tourism eco-efficiency in Fujian province under the target of carbon peak. Sci. Rep. 2023, 13, 23074. [Google Scholar] [CrossRef]
  30. Zhang, L.; Xiao, Y.; Guo, Y.; Qian, X. Spatial–temporal distribution and key factors of urban land use ecological efficiency in the Loess Plateau of China. Sci. Rep. 2023, 13, 22306. [Google Scholar] [CrossRef]
  31. Zheng, H.; Wu, Y.; He, H.; Delang, C.O.; Qian, J.; Lu, J.; Yao, Z.; Li, G. Urban land use eco-efficiency and improvement in the western region of China. J. Clean. Prod. 2023, 412, 137385. [Google Scholar] [CrossRef]
  32. Deng, X.; Gibson, J. Sustainable land use management for improving land eco-efficiency: A case study of Hebei, China. Ann. Oper. Res. 2020, 290, 265–277. [Google Scholar] [CrossRef]
  33. Ma, L.; Zhang, R.; Pan, Z.; Wei, F. Analysis of the Evolution and Infuencing Factors of Temporal and Spatial Pattern ofEco-efficiency of Cultivated Land Use among Provinces in China: Based on Panel Data from 2000 to 2019. China Land Sci. 2020, 36, 74–85. [Google Scholar] [CrossRef]
  34. Liu, S.-C.; Lin, Y.-B.; Ye, Y.-M.; Xiao, W. Spatial-temporal characteristics of industrial land use efficiency in provincial China based on a stochastic frontier production function approach. J. Clean. Prod. 2021, 295, 126432. [Google Scholar] [CrossRef]
  35. Maulidiyah, R.; Salam, M.; Jamil, M.H.; Tenriawaru, A.N.; Rahmadanih, S. Examining the effects of input allocation on potato production, production efficiency, and technical inefficiency in potato farming: Evidence from the Stochastic Frontier Model in search of sustainable farming practices. Sustain. Futures 2024, 7, 100218. [Google Scholar] [CrossRef]
  36. Kuang, B.; Lu, X.; Zhou, M.; Chen, D. Provincial cultivated land use efficiency in China: Empirical analysis based on the SBM-DEA model with carbon emissions considered. Technol. Forecast. Soc. Change 2020, 151, 119874. [Google Scholar] [CrossRef]
  37. Zhang, N.; Sun, F.; Hu, Y. Carbon emission efficiency of land use in urban agglomerations of Yangtze River Economic Belt, China: Based on three-stage SBM-DEA model. Ecol. Indic. 2024, 160, 111922. [Google Scholar] [CrossRef]
  38. Macpherson, A.J.; Principe, P.P.; Mehaffey, M. Using Malmquist Indices to evaluate environmental impacts of alternative land development scenarios. Ecol. Indic. 2013, 34, 296–303. [Google Scholar] [CrossRef]
  39. Zhao, Z.; Bai, Y.; Wang, G.; Chen, J.; Yu, J.; Liu, W. Land eco-efficiency for new-type urbanization in the Beijing-Tianjin-Hebei Region. Technol. Forecast. Soc. Change 2018, 137, 19–26. [Google Scholar] [CrossRef]
  40. Lin, X.; Zhang, L.; Wang, M.; Li, J.; Qin, J.; Lin, J. The ecological utility study on carbon metabolism of cultivated land: A case study of Hubei Province, China. J. Environ. Manag. 2024, 365, 121531. [Google Scholar] [CrossRef]
  41. Cao, W.; Zhou, W.; Wu, T.; Wang, X.; Xu, J. Spatial-temporal characteristics of cultivated land use eco-efficiency under carbon constraints and its relationship with landscape pattern dynamics. Ecol. Indic. 2022, 141, 109140. [Google Scholar] [CrossRef]
  42. Yin, Z.; Liu, Y.; Tang, L.; Zhou, W.; Pan, Y. Spatial-temporal evolution of agricultural land utilization benefits and tradeoffs/synergies in the Beijing-Tianjin-Hebei region. Ecol. Indic. 2023, 156, 111110. [Google Scholar] [CrossRef]
  43. Zhou, X.; Wu, D.; Li, J.; Liang, J.; Zhang, D.; Chen, W. Cultivated land use efficiency and its driving factors in the Yellow River Basin, China. Ecol. Indic. 2022, 144, 109411. [Google Scholar] [CrossRef]
  44. Li, X.; Zhao, L.; Chang, X.; Yu, J.; Song, X.; Zhang, L. Spatial and temporal evolution of the eco-efficiency of cultivated land use in the region around Beijing–Tianjin based on the Super-EBM model. Front. Ecol. Evol. 2023, 11, 1297570. [Google Scholar] [CrossRef]
  45. Liu, Q.; Qiao, J.; Han, D.; Li, M.; Shi, L. Spatiotemporal Evolution of Cultivated Land Use Eco-Efficiency and Its Dynamic Relationship with Landscape Pattern Change from the Perspective of Carbon Effect: A Case Study of Henan, China. Agriculture 2023, 13, 1350. [Google Scholar] [CrossRef]
  46. Ke, X.; Zhang, Y.; Zhou, T. Spatio-temporal characteristics and typical patterns of eco-efficiency of cultivated land use in the Yangtze River Economic Belt, China. J. Geogr. Sci. 2023, 33, 357–372. [Google Scholar] [CrossRef]
  47. Zou, X.; Xie, M.; Li, Z.; Duan, K. Spatial Spillover Effect of Rural Labor Transfer on the Eco-Efficiency of Cultivated Land Use: Evidence from China. Int. J. Environ. Res. Public Health 2022, 19, 9660. [Google Scholar] [CrossRef]
  48. Song, G.; Ren, G. Spatial response of cultivated land use efficiency to the maize structural adjustment policy in the “Sickle Bend” region of China: An empirical study from the cold area of northeast. Land Use Policy 2022, 123, 106421. [Google Scholar] [CrossRef]
  49. Wang, H.; Li, Z. Can the digitalization level of agriculture improve its ecological efficiency under carbon constraints: Evidence from China. Heliyon 2024, 10, e26750. [Google Scholar] [CrossRef]
  50. Cheng, C.; Liu, Y.; Liu, Y.; Yang, R.; Hong, Y.; Lu, Y.; Pan, J.; Chen, Y. Cropland use sustainability in Cheng–Yu Urban Agglomeration, China: Evaluation framework, driving factors and development paths. J. Clean. Prod. 2020, 256, 120692. [Google Scholar] [CrossRef]
  51. Pang, A.; Wang, D. Evaluation of agricultural and rural pollution under environmental measures in the Yangtze River Economic Belt, China. Sci. Rep. 2023, 13, 15495. [Google Scholar] [CrossRef] [PubMed]
  52. Chen, T.; Lu, J.; Lu, T.; Yang, X.; Zhong, Z.; Feng, H.; Wang, M.; Yin, J. Agricultural non-point source pollution and rural transformation in a plain river network: Insights from Jiaxing city, China. Environ. Pollut. 2023, 333, 121953. [Google Scholar] [CrossRef] [PubMed]
  53. Wen, G.; Liu, M.; Hu, X.; Zhao, J. Spatial correlation and spatial effect of cultivated land use ecological efficiency in the Dongting Lake Plain. Sci. Geogr. Sin. 2022, 42, 1102–1112. [Google Scholar] [CrossRef]
  54. Wang, J.; Su, D.; Wu, Q.; Li, G.; Cao, Y. Study on eco-efficiency of cultivated land utilization based on the improvement of ecosystem services and emergy analysis. Sci. Total Environ. 2023, 882, 163489. [Google Scholar] [CrossRef]
  55. Zhang, R.; JIao, H. Spatial-temporal pattern differentiation and its mechanism analysis of using efficiency for provincial cultivated land in China. Trans. Chin. Soc. Agric. Eng. 2015, 31, 277–287. [Google Scholar] [CrossRef]
  56. Hou, M.; Yao, S. Spatial-temporal evolution and trend prediction of agricultural eco-efficiency in China: 1978–2016. Acta Geogr. Sin. 2018, 73, 2168–2183. [Google Scholar] [CrossRef]
  57. Li, M.; Tan, L.; Yang, X. The Impact of Environmental Regulation on Cultivated Land Use Eco-Efficiency: Evidence from China. Agriculture 2023, 13, 1723. [Google Scholar] [CrossRef]
  58. Xue, X.; Xie, Y. The Spatial-Temporal Differences and Spatial Convergence of Ecological Efficiency in Cultivated Land Utilization in the Main Grain-Producing Areas of the Yellow River Basin—Evidence from 60 Prefecture-Level Cities. Chin. J. Agric. Resour. Reg. Plan. 2024, 45, 52–65. [Google Scholar] [CrossRef]
  59. Feng, Y.; Peng, J.; Deng, Z.; Wang, J. Spatial-temporal Variation of Cultivated Land’s Utilization Efficiency in China Based n the Dual Perspective of Non-point Source Pollution and Carbon Emission. China Popul. Resour. Environ. 2015, 25, 18–25. [Google Scholar] [CrossRef]
  60. Shang, J.; Ji, X.; Chen, X. Study on the impact of China’s urbanization on agricultural ecological efficiency: Based on panel data of 13 major grain-producing regions in China from 2009 to 2018. Chin. J. Eco-Agric. 2020, 28, 1265–1276. [Google Scholar] [CrossRef]
  61. Wu, X.; Wang, Y.; He, L.; Lu, G. Agricultural Eco-Efficiency Evaluation based on AHP and DEA Model—A Case of Wuxi City. Resour. Environ. Yangtze Basin 2012, 21, 714–719. [Google Scholar]
  62. Tian, Y.; Zhang, J.B. Regional differentiation research on net carbon effect of agricultural production in China. J. Nat. Resour. 2013, 28, 1298–1309. [Google Scholar]
  63. Fan, Z.; Deng, C.; Fan, Y.; Liu, M.; Lu, H.; Zhang, P. Measurement of Eco-Efficiency for Cultivated Land Use and Its Spatial-Temporal Characteristics from the Perspective of “Double Carbon” Target: Taking the Main Grain Producing Areas in the Mid and Lower Reaches of the Yangtze River as an Example. Ecol. Econ. 2023, 39, 119–127. [Google Scholar]
  64. Tone, K. A slacks-based measure of super-efficiency in data envelopment analysis. Eur. J. Oper. Res. 2002, 143, 32–41. [Google Scholar] [CrossRef]
  65. Liu, G.; Najmuddin, O.; Zhang, F. Evolution and the drivers of water use efficiency in the water-deficient regions: A case study on Ω-shaped Region along the Yellow River, China. Environ. Sci. Pollut. Res. 2022, 29, 19324–19336. [Google Scholar] [CrossRef]
  66. Huang, H.; Wang, T. The Total-Factor Energy Efficiency of Regions in China: Based on Three-Stage SBM Model. Sustainability 2017, 9, 1664. [Google Scholar] [CrossRef]
  67. Wang, Y.; Lv, W.; Wang, M.; Chen, X.; Li, Y. Application of improved Moran’s I in the evaluation of urban spatial development. Spat. Stat. 2023, 54, 100736. [Google Scholar] [CrossRef]
  68. Westerholt, R. A Simulation Study to Explore Inference about Global Moran’s I with Random Spatial Indexes. Geogr. Anal. 2023, 55, 621–650. [Google Scholar] [CrossRef]
  69. Moran, P.A.P. Notes on Continuous Stochastic Phenomena. Biometrika 1950, 37, 17–23. [Google Scholar]
  70. Anselin, L. Local Indicators of Spatial Association—LISA. Geogr. Anal. 1995, 27, 93–115. [Google Scholar]
  71. Lefever, D.W. Measuring Geographic Concentration by Means of the Standard Deviational Ellipse. Am. J. Sociol. 1926, 32, 88–94. [Google Scholar] [CrossRef]
  72. Khalid, W.; Kausar Shamim, S.; Ahmad, A. Exploring urban land surface temperature with geospatial and regression modelling techniques in Uttarakhand using SVM, OLS and GWR models. Evol. Earth 2024, 2, 100038. [Google Scholar] [CrossRef]
  73. Brunsdon, C.; Fotheringham, A.S.; Charlton, M.E. Geographically Weighted Regression: A Method for Exploring Spatial Nonstationarity. Geogr. Anal. 1996, 28, 281–298. [Google Scholar] [CrossRef]
  74. Liu, M.; Zhang, A.; Wen, G. Temporal and Spatial Pattern and Evolution Trend of Cultivated Land Use Ecological Efficiency in the Main Grain Producing Areas in the Lower Yangtze Region. China Land Sci. 2021, 35, 50–59. [Google Scholar] [CrossRef]
  75. Tu, Z. The Coordination of Industrial Growth with Environment and Resource. Econ. Res. J. 2008, 2, 93–104. [Google Scholar]
  76. Lee, C.-C.; Qian, A. Regional differences, dynamic evolution, and obstacle factors of cultivated land ecological security in China. Socio-Econ. Plan. Sci. 2024, 94, 101970. [Google Scholar] [CrossRef]
  77. Zhang, L.; Zhu, D.; Xie, B.; Du, T.; Wang, X. Spatiotemporal pattern evolvement and driving factors of cultivated land utilization efficiency of the major grain producing area in China. Resour. Sci. 2017, 39, 608–619. [Google Scholar] [CrossRef]
  78. Zhu, M.; Li, J. Regional Differences in Cultivated Land Utilization Efficiency and ItsInfluencing Factors for Major Grain Producing Areas in China. Bull. Soil Water Conserv. 2024, 44, 206–217. [Google Scholar] [CrossRef]
  79. Zhang, H.; He, Z.; Zhang, L.; Wen, W.; Wang, S.; Ma, Q. Spatiotemporal Evolution Pattern and Influencing Factors of Low CarbonUtilization Efficiency of Cultivated Land in Songnen Plain, Heilongiiang Province During 2005–2020. Bull. Soil Water Conserv. 2024, 44, 335–346. [Google Scholar] [CrossRef]
  80. Li, M.; Xu, J.; Zhang, H.; Zhou, J. Study on the Temporal and Spatial Diferentiation of the Green Utilization Elficiency of CultivateaLand in Rocky Desertilication Area of Guangxi Under ‘Dual Carbon’ Goals. Res. Soil Water Conserv. 2024, 31, 365–374. [Google Scholar] [CrossRef]
  81. Wang, H.; Han, G.; Xie, X. Spatiotemporal Pattern Evolvement Based on the DEA Model and Its Driving Factors of Arable Land Utilization Efficiency of the Southwest Region in China. Resour. Environ. Yangtze Basin 2018, 27, 2784–2795. [Google Scholar] [CrossRef]
  82. Ren, S.; Li, E.; Zhao, J.; Xu, Y. Spatial-temporal Characteristics of Carbon Emissions from Cultivated Land Use in the Yellow River Basin and the Influencing Factors. China Land Sci. 2023, 37, 102–113. [Google Scholar] [CrossRef]
  83. Ji, Z.; Wang, X.; Li, L.; Guan, X.; Yu, L.; Xu, Y. The evolution of cultivated land utilization efficiency and its influencing factors in Nanyang Basin. J. Nat. Resour. 2021, 36, 688–701. [Google Scholar] [CrossRef]
  84. Zhao, Q.; Pan, P.; Wang, X.; Wang, X.; Wang, X.; Li, N.; Wang, X. A study of cultivated land utilization efficiency and its influencing factors in Hebei Province based on DEA-Malmquist index. Arid Zone Res. 2021, 38, 1162–1171. [Google Scholar] [CrossRef]
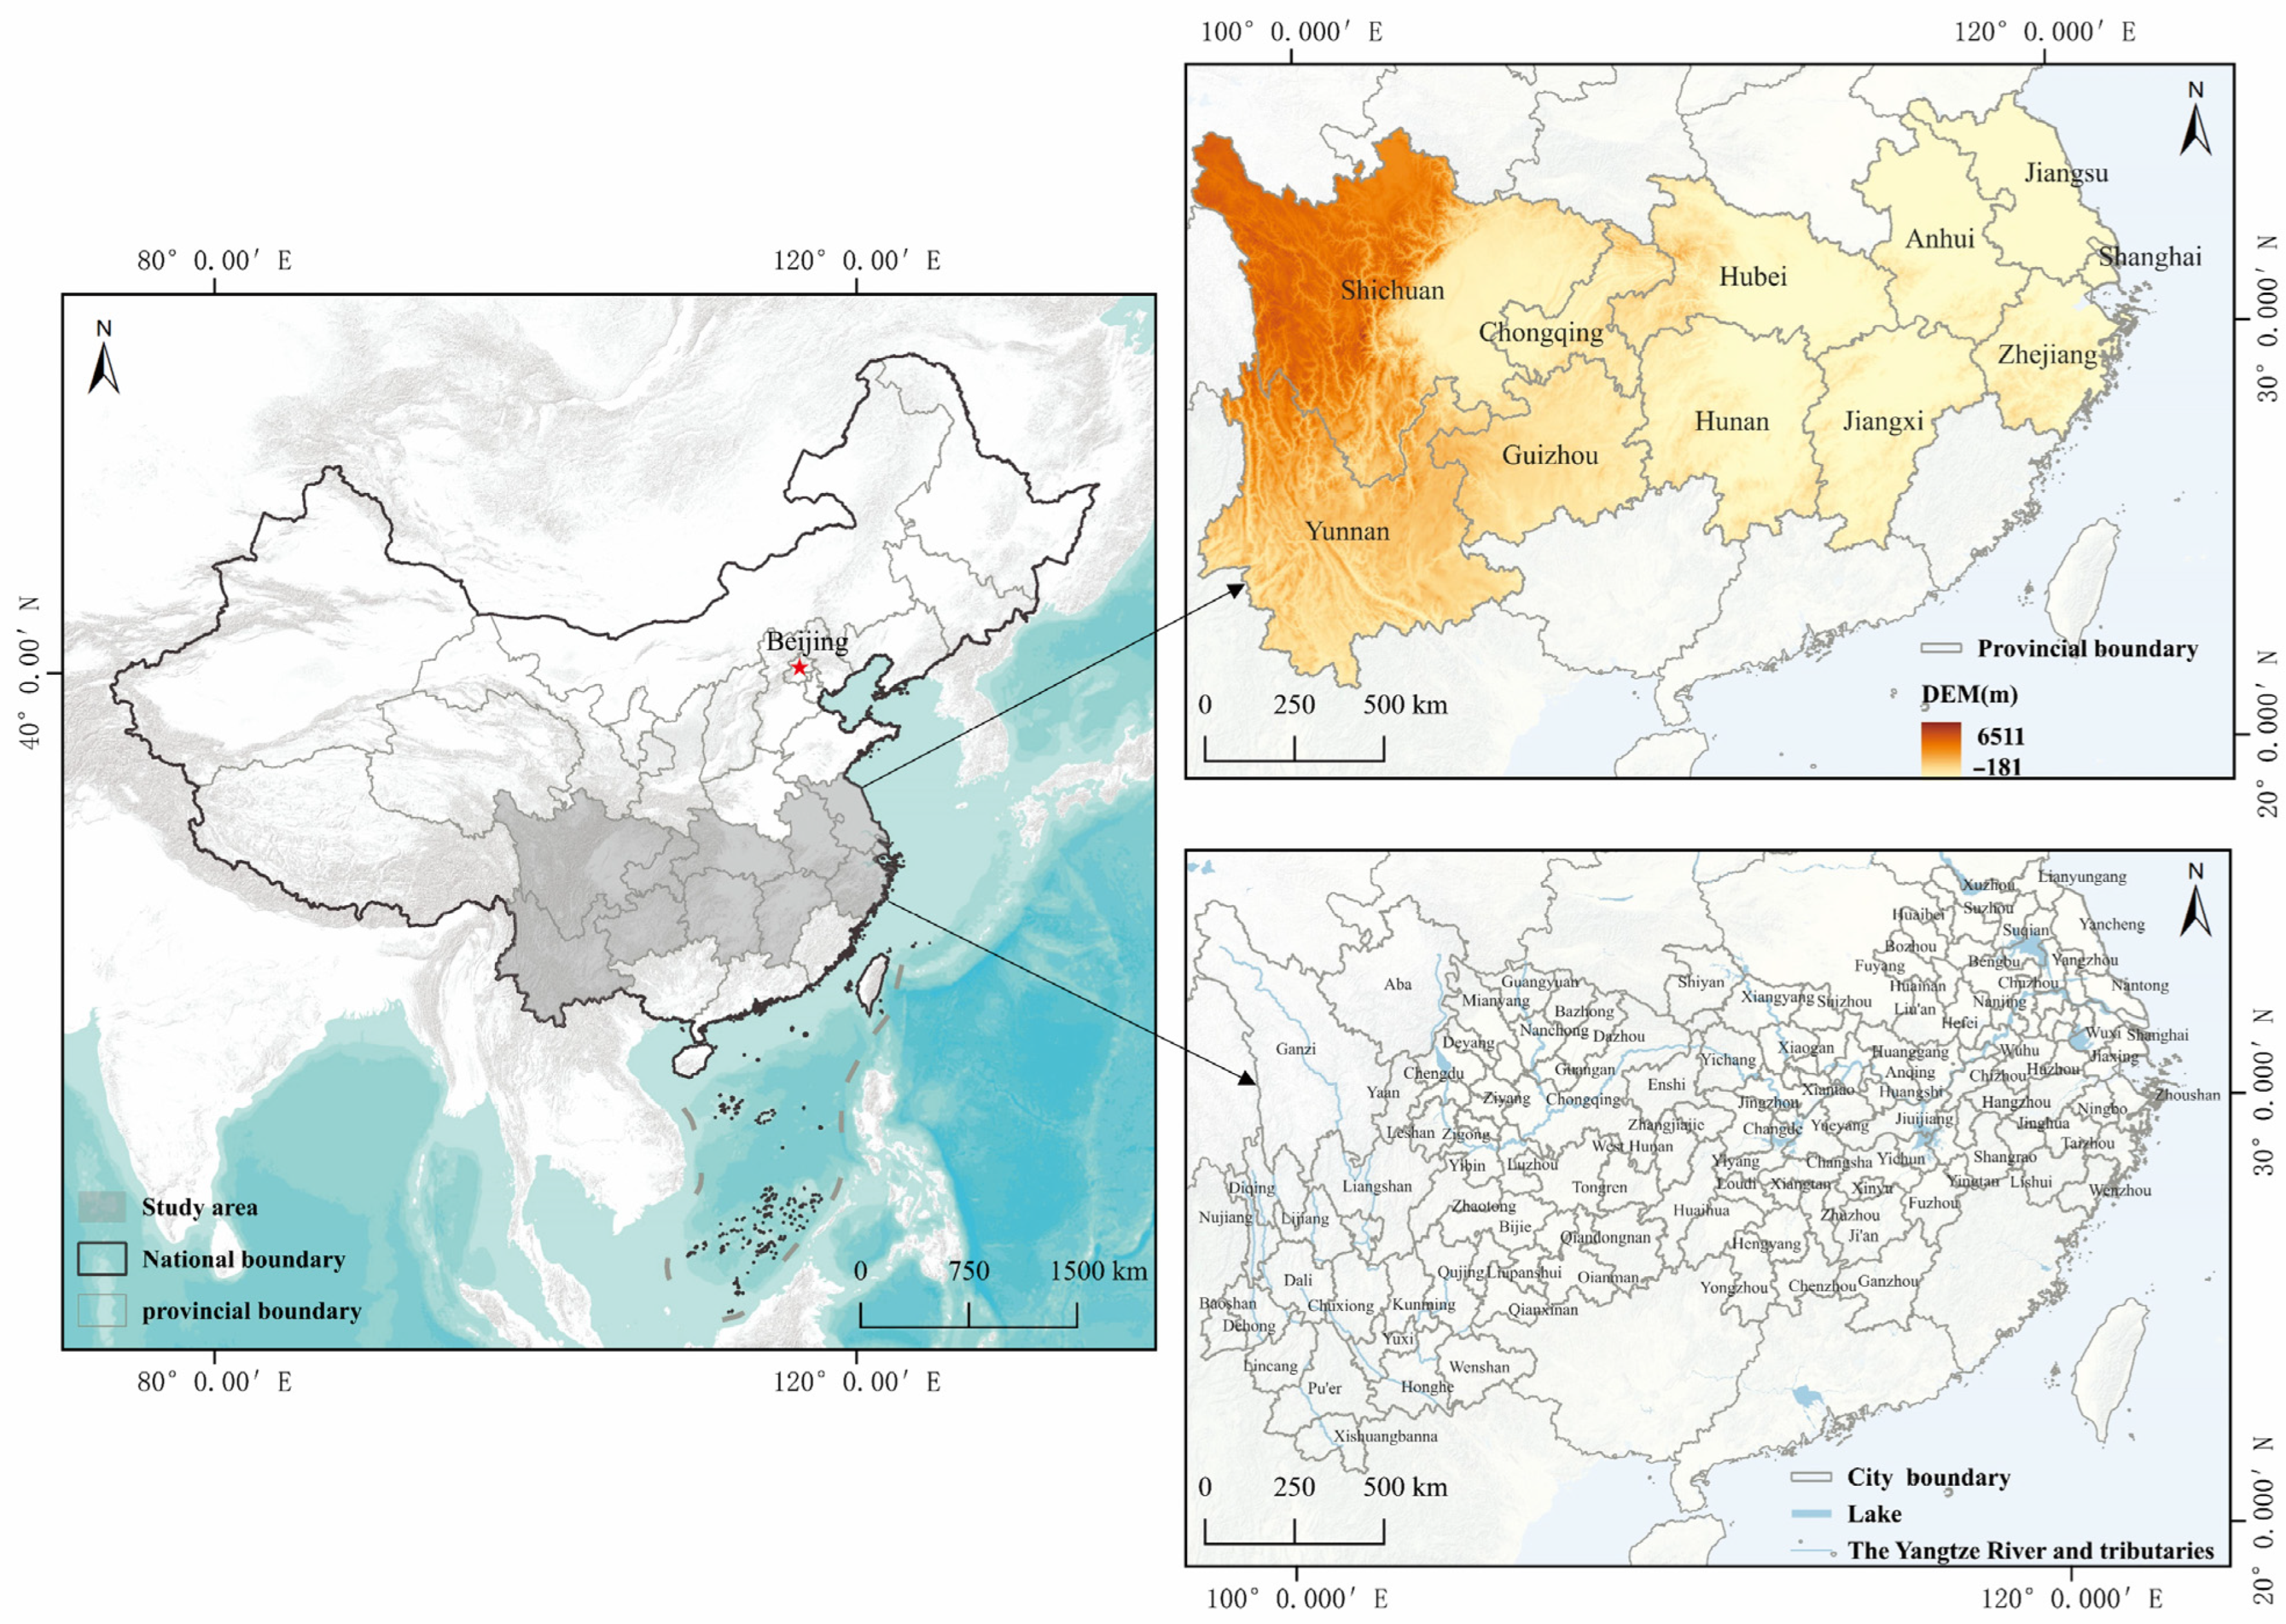
Figure 1. Location map of the study area.
Sustainability 17 03070 g001
Figure 2. Research method framework.
Sustainability 17 03070 g002
Figure 3. Temporal changes in ECLU. (a) Represents the whole YREB; (bd) Represents the Upper, Middle, and Lower Reaches of the YREB, respectively.
Sustainability 17 03070 g003
Figure 4. Changes in ECLU in cities of the YREB from 2005 to 2022.
Sustainability 17 03070 g004
Figure 5. Scatter plot of ECLU.
Sustainability 17 03070 g005
Figure 6. Spatial clustering map of ECLU.
Sustainability 17 03070 g006
Figure 7. (a) is spatial evolution trend of ECLU; (b,c) are enlarged images of the red dotted boxes in (a), respectively; (d) is the migration trajectory of the center of gravity point in the red solid line rectangular box in (a).
Sustainability 17 03070 g007
Figure 8. Spatial differences in influencing factors in 2022.
Sustainability 17 03070 g008
Table 1. Evaluation Index System for ECLU.
ClassesDimensionVariableSpecific IndexUnit
Cultivated
land
input
Land factorCultivated land inputArea of crop sownhm2
Labor factorLabor input costAgricultural labor productivityYuan/Person
Agricultural
materials factor
Fertilizer inputPure amount of fertilizerst
Pesticide inputPesticide uset
Plastic film inputAgricultural plastic film uset
Irrigation inputEffective irrigation areahm2
Mechanization inputAgricultural mechanizationkw
Cultivated
land
output
Expected outputEconomic outputTotal agricultural output value104 Yuan
Social outputTotal grain yieldt
Ecological outputTotal carbon sequestration of cultivated landt
Non-expected outputCarbon sourceCarbon emissions from cultivated land uset
Pollution emissionsNon-point source pollution from
cultivated land use
t
Table 2. GWR model estimation results.
Variable20052010201520202022
X1−0.034~0.021−0.097~−0.051−0.274~0.111−0.171~0.025−0.196~0.086
−0.003 −0.070 −0.045 −0.051 −0.035
X2−0.163~−0.086−0.113~−0.066−0.226~0.072−0.224~−0.109−0.485~−0.018
−0.140 −0.081 −0.134 −0.175 −0.215
X30.193~0.7210.164~0.233−0.136~0.283−0.096~−0.174−0.033~0.206
0.557 0.185 0.134 0.065 0.112
X4−1.310~−0.419−0.088~0.186−0.494~−0.008−0.071~−0.016−0.153~−0.006
−1.054 0.082 −0.185 −0.055 −0.060
X5−0.113~−0.011−0.062~0.015−0.132~0.389−0.058~−0.241−0.153~0.084
−0.063 −0.027 0.024 0.066 −0.055
X60.031~0.101−0.201~0.112−0.683~0.1640.035~0.104−0.186~0.124
0.063 0.024 −0.199 0.061 −0.053
X70.035~0.1170.100–0.157−0.022~0.2600.001~0.1480.045~0.239
0.075 0.127 0.091 0.064 0.129
X80.001~0.133−0.049–0.242−0.158~1.025−0.141~−0.022−0.146~0.006
0.083 0.043 0.280 −0.079 −0.049
X90.096~0.205−0.022–0.267−0.184~1.154−0.052~0.040−0.080~0.09
0.143 0.061 0.286 −0.004 0.010
R20.317 0.2370.5250.4360.459
Residual squares0.497 0.1830.3060.2580.219
Effective number12.182 12.17814.74512.39615.860
Sigma0.068 0.0410.0490.0490.046
AICc−299.800 −424.739−350.936−380.879−388.753
Disclaimer/Publisher’s Note: The statements, opinions and data contained in all publications are solely those of the individual author(s) and contributor(s) and not of MDPI and/or the editor(s). MDPI and/or the editor(s) disclaim responsibility for any injury to people or property resulting from any ideas, methods, instructions or products referred to in the content.