Article

A Multi-Objective Evaluation Tool (MUVT) for Optimizing Inputs in Cropping Systems: A Case Study on Three Herbaceous Crops

by
Pasquale Garofalo
* and
Alessandro Vittorio Vonella
Council for Agricultural Research and Economics, Research Centre for Agriculture and Environment (CREA-AA), Via C. Ulpiani 5, 70125 Bari, Italy
*
Author to whom correspondence should be addressed.
Sustainability 2025, 17(7), 3030; https://doi.org/10.3390/su17073030
Submission received: 20 February 2025 / Revised: 18 March 2025 / Accepted: 27 March 2025 / Published: 28 March 2025
(This article belongs to the Section Resources and Sustainable Utilization)

Abstract

:
This study introduces the Multi-Objective Evaluation Tool (MUVT), developed to optimize resource management in cropping systems by balancing productivity, economic returns, and environmental sustainability. Using MUVT, the research examines three key aspects of irrigation management: the impact of irrigation strategies on agro-environmental parameters (e.g., yield, water use efficiency, and economic performance), the integration of these parameters into a multi-objective framework to identify optimal irrigation volumes, and the ability to adjust irrigation strategies by prioritizing sustainability over productivity. MUVT was tested on three crops—processing tomato, maize, and sugar beet—under varying irrigation scenarios, with the dynamics of certain crop system variables in relation to irrigation management assessed through AquaCrop simulations. Results indicate that optimal irrigation levels range between 400 and 500 mm for maize and tomato and 300 and 400 mm for sugar beet when balancing productivity and sustainability. When environmental sustainability is prioritized, recommended irrigation volumes decrease to 300 mm for maize, 300–400 mm for tomato, and 200 mm for sugar beet. Among the crops analyzed, maize showed the best overall performance, followed by tomato and sugar beet. By systematically evaluating trade-offs between agronomic and environmental factors, MUVT provides a flexible decision-support system, enabling farmers and policymakers to make data-driven decisions for improving resource efficiency while ensuring economic and environmental sustainability.

1. Introduction

The global agricultural landscape is currently grappling with a unique set of challenges, with sustainable crop production remaining central to global food security [1]. As the demand for food and fiber intensifies and natural resources become scarcer, optimization techniques have become increasingly vital in both agricultural and environmental management [2]. These issues are especially critical in arid and semi-arid regions, where water scarcity and the need for precise nutrient management directly affect soil fertility and crop productivity. Research indicates that synchronizing water and nitrogen management through optimization strategies can markedly enhance both crop yield and environmental performance [3]. To support the sustainable development of regional agricultural sectors, it is essential to boost both crop yield and quality in an efficient and eco-friendly manner. Traditional approaches that focus on a single objective often overlook the inherent trade-offs in complex agroecosystems; in contrast, multi-objective frameworks provide a more balanced perspective by simultaneously addressing crop productivity, resource efficiency, and environmental sustainability [3]. Numerous studies have explored the optimal allocation of land, water, and other resources using formal optimization methods [2,4,5]. More recently, alternative analytical techniques based on multi-objective evaluations have emerged, including principal component analysis for mung bean yield components [6], gray correlation analysis for assessing fruit quality [7], and membership function analysis applied to winter bread wheat [8]. Comprehensive multi-objective evaluations have proven effective in determining the viability of different strategies across a range of applications [9]; for instance, optimal irrigation and fertilization strategies for maize [10], apple [11], and potato [12] have been developed by balancing yield, quality, resource efficiency, and environmental benefits. It is important to note that different evaluation models often vary in methodology, data analysis focus, and underlying assumptions. Human factors can further contribute to discrepancies in the results obtained for the same subject, making it challenging to derive an objective analysis from any single method [13]. For example, one study on optimizing nitrogen management and soil treatment for sweet sorghum employed a fuzzy-based expert system where recommendations depended on the subjective weighting of various energy-related variables [14]. To overcome these challenges, some researchers have proposed integrating multiple evaluation models using a combination algorithm—that is, merging results according to specific criteria and rules—to achieve more objective outcomes [7]. In another study, a comprehensive evaluation model that integrated PCA, TOPSIS, GCA, and MFA was applied to determine the best irrigation and nitrogen rates for sugar beet [3]. Despite such integration, differences persisted among treatments because of the unique analytical approaches and data utilization inherent in each method; to address this inconsistency, the ODCA (Overall Difference Combined Evaluation) framework was introduced to reconcile disparate results. Adopting multi-objective evaluation methods in various contexts requires a high level of expertise—not only in understanding the underlying algorithms but also in replicating them using tools like spreadsheet software. The broader adoption of optimization techniques, including multi-objective analyses, depends on streamlining computational processes so that users beyond the original developers can readily grasp and modify the framework according to specific evaluative needs. Fundamentally, these optimization frameworks are designed to harmonize diverse inputs—such as seasonal irrigation volumes or fertilizer doses—to produce favorable outputs like crop yield, water consumption, water use efficiency, and economic returns. A major challenge is standardizing outputs measured in different units (e.g., yield in kg per ha versus water usage in mm) and distilling processed data into clear, interpretable indicators for rapid, effective decision-making. These challenges form the foundation for developing user-friendly tools that enable researchers and practitioners to consciously guide evaluation outcomes based on their specific objectives. Given these challenges, this paper presents the development of a tool—MUVT v. 1.0, (Multi-Objective Evaluation Tool, freely available at: https://github.com/garofalopasquale/MUlti-objective-eValuation-Tool, accessed on 30 January 2025)—designed to analyze various systems (both agricultural and non-agricultural) to identify the optimal strategy in terms of a specific system input. The data processed within MUVT follow a hierarchical structure: at the base are standardized second-degree polynomial regression parameters (which must be provided by the user), while the top level consists of a numerical evaluation score representing the analyzed system. Each hierarchical level provides decision-support information that can be used individually or combined for overall analysis. A key feature of MUVT is its ability to normalize processed data, enabling a comparative evaluation of system variables by assessing how one parameter’s response varies with quantitative changes in the input. Moreover, users can adjust the weight assigned to each variable, thereby optimizing the system by prioritizing certain aspects over others. Beyond detailing the evaluation algorithms and operational framework of MUVT, this paper also presents its application in an agronomic context. Specifically, MUVT was applied to three cropping systems—maize, sugar beet, and processing tomato—to evaluate optimal irrigation regimes and identify the best water supply options from a multi-objective perspective, considering productivity, economic performance, and environmental sustainability. The first operational layer of MUVT, from which all subsequent processing originates, requires specific inputs derived from standardized polynomial regressions between the amounts of a specific factor in the system to be analyzed (such as different seasonal irrigation volumes, which thus represent the independent variable) and the response of the variables potentially affected by varying amounts of this factor (which thus represent the dependent variables). In this study, the possible empirical correlations between seasonal irrigation volumes and the response of the various factors analyzed, explained through second-order standardized regression (from which the statistical parameters to be provided to the first layer of MUVT are derived), were obtained using the AquaCrop simulation model (v. 7.0). AquaCrop was used to simulate eight irrigation scenarios (ranging from severe water stress to surplus conditions) over six growing seasons for spring–summer crops (maize and tomato) and five seasons for autumn-sown sugar beet under typical Mediterranean conditions. The first application of MUVT was based on an equal weighting of all water-related parameters analyzed and was then compared with an alternative scenarios where greater importance was assigned to environmental sustainability over productive performance. The aim of the presented study was to develop and validate the MUVT framework for multi-objective evaluation in agricultural resource management and to demonstrate its practical applicability in optimizing irrigation regimes. The first objective was the derivation of standardized second-degree polynomial regression parameters to feed the first operational layer of the tool; the dataset required to obtain these parameters was generated using simulation data from the AquaCrop model under typical Mediterranean conditions. The second objective was to generate a hierarchical, normalized evaluation assessment to quantify how irrigation management affected water-related parameters, incorporating both numerical and qualitative evaluations. The third objective involved applying the MUVT framework to assess how different seasonal irrigation regimes (chosen independently of those applied in AquaCrop) modulated the response of evaluative variables of system performance and, ultimately, to identify optimal irrigation regimes in three distinct cropping systems, aiming to find the balance point among performance variables, water use efficiency, and environmental sustainability. Finally, the fourth objective was to evaluate and compare outcomes between scenarios where all system variables had equal weight in modulating MUVT’s recommendations and alternative scenarios where greater importance was assigned to environmental sustainability parameters over productive performance.
The practical relevance of this study lies in its ability to provide a user-friendly, adaptable framework for decision-making in agricultural resource management. Unlike traditional models that focus on single-objective optimization, MUVT offers an integrated approach that, as applied in this study, balances yield, efficiency, and sustainability metrics. The findings are particularly valuable for farmers, policymakers, and researchers seeking to optimize agricultural input strategies in resource-limited environments while ensuring economic and environmental viability. By facilitating the assessment of trade-offs between competing factors, MUVT enhances the potential for data-driven, sustainable decision-making in cropping system management.

2. Materials and Methods

2.1. The AquaCrop Model

AquaCrop is a process-based crop model developed by the Food and Agriculture Organization [15] to simulate crop responses to water availability, facilitating the evaluation of water management strategies. Operating on a daily time step, it models the soil–plant–atmosphere continuum by quantifying vertical water fluxes and the interactions between soil moisture, crop development, and atmospheric conditions [16]. The model incorporates key processes such as soil water balance, canopy growth, root development, crop transpiration, and biomass accumulation. It accounts for the influence of environmental factors, including temperature, precipitation, evaporative demand, and atmospheric CO2 concentration, on plant growth and yield formation [17]. AquaCrop adjusts crop growth based on both potential development and the effects of water stress, allowing it to assess the impact of different irrigation regimes on crop performance [18]. In AquaCrop, water enters the system through rainfall and irrigation. However, infiltration efficiency can be reduced by surface runoff when rainfall intensity exceeds soil absorption capacity. Water is lost from the root zone through deep percolation when soil moisture surpasses the field capacity. Conversely, capillary rise can transport water upward to the root zone in dry conditions. Soil evaporation and plant transpiration continuously deplete available water, influencing crop water use efficiency and overall productivity.
Daily crop transpiration (Tri, mm day−1) is calculated as:
T r i = K s × C C × K c × E T 0
where Ks is the soil water stress coefficient, CC is the canopy cover, Kc is the crop coefficient, and ET0 is the reference evapotranspiration.
Aboveground biomass (TDM, t ha−1) is determined by the normalized water productivity coefficient (WP*, g m−2) and cumulative transpiration [19]:
T D M = W P * × i = 1 n T r i E T 0 i
Finally, dry yield (Y, t ha−1) is estimated from the total biomass at maturity and the harvest index (HI, %):
Y = H I × T D M
Soil water stress significantly influences canopy expansion, root growth, stomatal regulation, and reproductive success. When soil moisture drops below critical thresholds, physiological responses such as stomatal closure and reduced transpiration lead to lower biomass accumulation and yield. In severe cases, water stress can trigger early canopy senescence and harvest index reduction, further limiting productivity. These thresholds, expressed as a fraction of the total available water in the root zone, allow AquaCrop to simulate the effects of varying water availability on crop performance, making it a valuable tool for optimizing irrigation strategies.

2.2. Irrigation Management Scenarios

To explore the variability in the cropping systems of three agricultural systems under diverse irrigation conditions and growing seasons as simulated by AquaCrop, the calibrated crop parameter values for running simulations were derived from previous modeling exercises, specifically for maize [20], for sugar beet [21], and for processing tomato [22]. The AquaCrop-derived data were processed to establish standardized second-degree polynomial regressions (see Section 2.3), which quantify how each water-related parameter responds to irrigation. These regressions were pivotal for MUVT’s framework, as their coefficients (β0, βᵢ, βᵢᵢ) and statistical metrics (R2, p-values) were the initial inputs in the framework and then used by the tool to calculate normalized impact scores (StVi and WVi as explained further) for each water-related parameter. These three crops were selected to test the decisional response of MUVT as decision support tool for optimized irrigation strategies, as their growth cycles occur during the spring–summer period in a Mediterranean environment. Indeed, their water requirements to meet evapotranspirative demand are high: ranging from 395 to 768 mm for processing tomato [23], from 200 mm to 842 mm for sugar beet [24], and from 232 mm to 536 mm for maize [25].
A series of in silico irrigation scenarios were simulated using meteorological data recorded from 2015 to 2020 at a weather station located on an experimental farm owned by CREA in Foggia (latitude 41°27′30.42″ N, longitude 15°33′06.77″ E; altitude, 90 m a.s.l.).
The meteorological variables used for these simulations reflect a climate classified as “accentuated thermo-Mediterranean” [26], characterized by winter temperatures below 0° and summer temperatures exceeding 40 °C. The annual rainfall (mean: 550 mm) is predominantly concentrated in the winter months, while class ‘A pan’ evaporation averages 1033 mm annually, with 657 mm occurring from May to August. These meteorological conditions were well suited for setting up irrigation scenarios, due to the high evapotranspirative demand of the environment, reduced precipitation during the growing season, and the need to rely on water supply to meet the water requirements of these three crops. In the simulated scenarios, maize was sown on 1 June, sugar beet on 1 February, and processing tomato was transplanted on 1 May. The simulations were repeated for the years 2015–2020, thus obtaining outcomes for six cropping seasons. A silt-loam soil with the following characteristics: water content at saturation, 46% vol; field capacity, 33% vol; wilting point, 13% vol; and saturated hydraulic conductivity, 575 mm day−1, over a depth of 1.50 m, was used in the simulations.
For the three crops analyzed, the distribution of irrigation water through the AquaCrop simulations was ensured via a drip irrigation system, initially set to an optimal irrigation strategy (Full). This strategy defined irrigation events triggered when 20% of the total available water (TAW) in the root zone was depleted. Starting from a condition where the water demand of the plants was fully met through irrigation, a broad range of seasonal irrigation volumes and the corresponding responses of water-related parameters for the three cropping systems were explored. Five additional scenarios with reduced irrigation inputs and two with volumes exceeding the Full water supply were set up. For the stressed scenarios, the irrigation water volume for each event was reduced by 10% (Irr_10), 20% (Irr_20), 40% (Irr_40), 60% (Irr_60), and finally by 80% (Irr_80) compared to Full. Water supply increments of 20% (Sur_20) and 40% (Sur_40) were instead set as irrigation levels exceeding the Full regime.
The scenarios aimed to derive robust response curves for crop yield, economic returns, water use efficiency and environmental burdens, as a function of seasonal irrigation volumes. While not replicating real-world practices in every aspect, these scenarios provided essential data to parameterize the empirical framework (MUVT). This allowed for conducting a multi-objective analysis that could screen and rank different irrigation scenarios. Ultimately, the analysis aimed to highlight the scenario that best optimized the three cropping systems, identifying the most balanced option in terms of productivity, economic, and environmental performance.

2.3. Development of the Operational Framework Behind MUVT

The effect of irrigation management on the three cropping systems was evaluated using outputs from AquaCrop, classified as primary or derived metrics. The water-related parameters included dry yield (Dry_Y; t ha−1), water use efficiency (WUE; kg mm−1), irrigation water use efficiency (IUE; kg mm−1), blue water footprint (Blue_FP; mm t−1), drainage losses (mm), and net income (Net_Inc; € t−1).
WUE was calculated as the ratio between Dry_Y and the actual evapotranspiration of the crop, while IUE was determined as the ratio between Dry_Y and the seasonal irrigation volume. Blue_FP, which represents the irrigation water used by the crop to produce one unit of Dry_Y (1 kg), was estimated by the ratio between the seasonal irrigation volume and Dry_Y.
Net_Inc was calculated as:
N e t _ I n c = I n c I r r C o s t
where Inc is the income from fresh yield (€ ha−1), obtained for each crop by multiplying the annual fresh production from the AquaCrop simulations by the selling price, which was set to 265 € ha−1 for maize [27], 145 Euro € ha−1 for processing tomato [28], and 304 Euro € ha−1 for sugar beet [29].
For IrrCost, three price thresholds were applied, reflecting a more than proportional increase in the cost of irrigation water as seasonal irrigation volumes increase. For these three thresholds, the variable costs applied by an irrigation consortium in the northern part of the Puglia region were chosen [28].
Specifically: (i) if the seasonal irrigation (as simulated by AquaCrop) did not exceed 200 mm, the irrigation cost was set at 1.2 Euro per mm; (ii) if the seasonal irrigation exceeded 200 mm but remained below 400 mm, the cost for the portion above 200 mm was 1.8 Euro per mm; and finally, (iii) if the seasonal irrigation surpassed 400 mm, the cost for the portion exceeding this threshold increased to 2.4 Euro per mm.
Once the annual values for the different variables to be analyzed for the three cropping systems were attained, based on the eight irrigation scenarios, statistical analyses were conducted to evaluate differences in water-related parameters across irrigation regimes and to parameterize the MUVT framework. A one-way analysis of variance (ANOVA). Post hoc pairwise comparisons of means were carried out using Tukey’s Honestly Significant Difference (HSD) test at a significance level of p < 0.05.
Then, regression analysis (standardized second-order polynomial) was applied to evaluate the relationship between seasonal irrigation volumes and the water-related variables as follows:
Y p = β 0 + β i × X 2 + β i i × X
where Yp represents the numerical response of a specific water-related variable, while X denotes the seasonal irrigation volume (amount), both derived from AquaCrop simulations.
A second-order polynomial was chosen because it is well-suited to modeling the relationships observed in bio-physical systems. Specifically, this form accounts for the effect of the input variable (water supply) through linear terms as a first-order approximation, while also incorporating second-order nonlinearities associated with each evaluated variable. This structure allows for flexibility in capturing or substituting a wide range of response behaviors, including linear trends, parabolic curves, plateaus, exponential growth, and other dynamics.
Equation (5) facilitates the quantification of irrigation’s impact on the variables studied within the cropping system. By using standardized regression coefficients (standardized values are obtained by subtracting the mean of the variable and dividing by the standard deviation of the variable, before performing the regression), it becomes possible to numerically compare the magnitude of this effect, regardless of the scale or type of dependent variables involved. This method allows for an assessment of irrigation’s influence on agricultural system variables without being constrained by measurement units or relationships between them. A higher value of βi or βii (positive or negative) reflects a stronger effect of irrigation on the studied variable, while a higher β0 value indicates significant effects even in the absence of irrigation. Integrating these three parameters into a single index offers a more concise and interpretable measure, making it easier to rank the impact of irrigation on the various variables analyzed, such as performance, water efficiency, and profitability.
To derive a single index for each analyzed parameter, a sequential procedure was applied.
Initially, the significance (α; p-value) of each regressor was assessed. The parameter α represents the probability that changes in the standardized dependent variable are either associated with the variation in the independent variable (seasonal irrigation volume) or unaffected by irrigation practices. Based on the α value, a weight factor for each regressor (WRf) was determined as:
W R f =   1   if   α < 0.001 ; 0.66   if   0.01 > α > 0.001 ; 0.33   if   0.05 > α > 0.01 ;   0   if   α > 0.05
In addition to α, the framework incorporated the coefficient of determination (R2), which measures the goodness of fit of the polynomial model Equation (4). A weight was also assigned to R2 as follows:
W R R 2 =   1   if   R 2 > 0.75 ; 0.5   if   0.75 > R 2 > 0.5 ; 0.25   if   0.5 > R 2 > 0.25 ;   0   if   R 2 < 0.25
where WRR2 represents the weighted value of R2.
The chosen values to assign the impact to α and R2 were determined based on the magnitude of the change in R2 and p-values observed across different thresholds. Specifically, for R2, the transition from 0 to 0.25 does not signify a substantial improvement in model fit, justifying the assignment of a low weight (0.25). Similarly, the incremental shift from 0.25 to 0.5 represents a modest improvement, reflected in a corresponding weight of 0.5. The same principle applies to the transition from 0.5 to 0.75, reflecting a proportionate increase in importance as R2 progresses from 0 to 0.75.
In contrast, an R2 value exceeding 0.75 indicates an excellent fit of the regression model to the analyzed data, warranting the assignment of the maximum weight. This weighting system ensures that the scale aligns proportionately with the model’s explanatory power as indicated by R2, while placing appropriate emphasis on highly significant thresholds.
In the analysis of p-values, the transition between probability thresholds allows for clearer categorization of significance levels (not significant, moderately significant, highly significant, and extremely significant). As a result, the weights (WRf) assigned to each threshold were higher and proportionally distributed (0, 0.33, 0.66, 1) compared to the weights for WRR2.
Subsequently, the standardized score (StVi) for each evaluated variable within each cropping system was calculated using the following formula:
S t V i = W R f i × β 0 + W R f i i × β i + W R f 0 × β i i + W R R 2 × R 2
The resulting StVi, derived from Equation (8), may exceed 1. This could complicate its interpretation. Therefore, to quantify the relative impact of the analyzed variable in connection to water supply, StVi was normalized to a range of 0 to 1 using a sigmoid function:
W V i = 1 1 + E X P k × S t V i b
where k and b are dimensionless coefficients. In this framework, b was determined as follows:
b = i = 1 n S T V i , i o b s 2
where obs represents the number of computed StVi values, while k is a variable spanning from 0 to 10, that enables the adjustment of the StVi’s score sensitivity to irrigation during the calculation of WVi.
Smaller values of k result in greater weighting when StVi is below b, while larger values of k increase the weight when StVi exceeds b (with a value of 5 representing a balanced or average weight).
The WVi was used to assess the impact of irrigation on various parameters. However, the effect of this index provides different results across the variables studied. For instance, a high WVi value had opposing implications for performance and drainage. While an increase in irrigation volume led to a ‘positive’ outcome, as it enhanced yield, an increase in drainage was viewed as ‘negative’. Thus, for variables that had an adverse effect on the overall cropping system (such as drainage and Blue_FP), the WVi was assigned negative values, whereas positive values were attributed to other evaluative parameters. To translate the score into a synthetic judgment, the WVi was classified into categories—“Very strong”, “Strong”, “Moderate”, “Poor”, and “Not significant”—based on its value: above 0.8, between 0.8 and 0.6, between 0.6 and 0.4, between 0.4 and 0.2, or below 0.2, respectively. Additionally, WVi measured the effect of irrigation on individual parameters of the three agricultural systems analyzed, but it did not allow for direct comparisons across different irrigation scenarios.
The operations of MUVT presented so far are based on user-provided input data (R2, α-level, and regressors from the standardized regression), which allow the tool to calibrate the response of subsequent layers to the actual impact that a given input variable (in this study—seasonal irrigation volumes) has on the system variables analyzed (in this study—the water-related parameters).
Indeed, after the auto-calibration of MUVT, the user can assess how changing (and inputting into MUVT) the amounts of a specific variable (such as seasonal irrigation volumes, even different from those used for the regression analysis) affects the standardized and normalized response of the different evaluative system variables, i.e., how the system can improve or worsen in the individual performance of the analyzed variables and compare them with each other.
This assessment is carried out through the output from MUVT of a truth value (TWi) determined using the following calculation:
T W i = β 0 + β i × X 2 + β i i × X × ± W V i
where the WVi could take on positive values (for yield, IUE, WUE, Net_Inc), or negative values (for drainage, Blue_FP), depending on whether irrigation had a positive or negative effect on the analyzed parameter.
It should be noted that the positive or negative value that MUVT assigns to TWi for each processed system variable depends on the “positive” or “negative” input that the user has previously provided to the framework, indicating whether the numerical increase in an evaluative variable (i.e., yield, drainage, Blue_FP for this study, etc.) as the input variable (i.e., seasonal irrigation volume) increases is considered positive (i.e., yield) or negative (i.e., drainage).
While TWi allows for the evaluation of how different amounts of the input variable improve or worsen the individual evaluative system variables, MUVT aggregates each TWi to obtain a multi-objective index (ImobJ) that represents the overall system performance. ImobJ is calculated as:
I m o b j = i = 1 n T W i
Definitively, through this index, the user can assess the required amount of a specific input variable (i.e., seasonal irrigation volume, fertilization, and so on) needed to optimize the system by balancing the response of all the examined variables.
Finally, by modifying the values of k, the optimization of the system can favor specific evaluative aspects over others.
The workflow of the MUVT operation is detailed in Supplementary Material (Figure S1).

3. Results

3.1. Performance of the Cropping Systems Under Variable Irrigation Scenarios

The data presented in this section are derived from simulations using the AquaCrop model, as described in Section 2.2. The response of crop variables (productive and economic performance, water use efficiency, and environmental sustainability) to irrigation scenarios was generated through AquaCrop, while the subsequent levels of analysis (synthetic evaluations, normalized indices) were processed using the MUVT framework.
The response of water-related parameters for the three cropping systems as a function of seasonal irrigation volumes is reported in Table 1. Statistical differences in water-related parameters across seasonal irrigation volumes were verified by one-way ANOVA (Table S1 in Supplementary Material), and pairwise comparisons of means were performed with Tukey’s HSD test (Table 1).
All three crops exhibited yield increases as irrigation shifted from the most water-stressed regime up to Irr_60, ranging from 8.84 t ha−1 to 14.58 t ha−1 for maize, from 8.96 t ha−1 to 13.86 t ha−1 for sugar beet, and from 2.86 t ha−1 to 6.56 t ha−1 for tomato. These yield gains corresponded to irrigation volumes ranging between 63 mm and 379 mm for maize, 57 mm and 341 mm for sugar beet, and 53 mm and 317 mm for tomato, respectively.
Moving towards higher irrigation regimes up to Full, all three crops continued to show productivity increases, although to a lesser extent than those observed in the previously mentioned seasonal irrigation volumes. Under optimal reference conditions, yields stabilized at 14.62 t ha−1, 14.72 t ha−1, and 8.06 t ha−1 for maize, sugar beet, and tomato, respectively. Increasing irrigation volumes did not provide any additional yield benefits; tomato yields remained unchanged compared to the Full regime even with irrigation levels as high as 739 mm, while sugar beet exhibited only negligible increases (with maximum irrigation volumes up to 797 mm), and maize even experienced slight yield reductions (with irrigation volumes reaching 883 mm). All irrigation options up to Full prevented or at least reduced water losses due to drainage. For maize, drainage remained at 0 mm up to Irr_80 (7 mm under Full), ranged between 0 mm (Irr_10) and 3.52 mm (Full) for sugar beet, and varied from 0 mm to 8.08 mm for processing tomato.
Beyond the optimal irrigation threshold, a significant and sudden increase in drainage losses was observed across all cropping systems. In Sur_40, drainage accounted for approximately 25% of the total irrigation supply for the two spring–summer crops (211 mm for maize and 186 mm for processing tomato) and even reached 37% for sugar beet (294 mm). For Blue_FP, the simulations indicated that this environmental sustainability index increased linearly and proportionally across all explored irrigation regimes, with a greater water use (mm) required to produce one unit of yield in processing tomato. Blue_FP values ranged from a minimum of 14.45 mm t−1 under Irr_10 to 65.58 mm t−1 under Full, reaching a maximum of 91.18 mm t−1 under Sur_40.
Maize followed, with Blue_FP values increasing from 7.13 mm t−1 under the most water-stressed regime to 60.42 mm t−1 under the highest water supply (38.66 mm t−1 under Full). Finally, sugar beet showed the best performance for this water-related parameter, with values ranging from 6.35 mm t−1 under Irr_10 to 38.66 mm t−1 under the optimized irrigation regime, reaching a maximum of 53.62 mm t−1 under Sur_40. Moving on to the analysis of IUE, results showed a sharp decline as irrigation supply increased from the lowest level (Irr_10) to Irr_60 for maize (from 140.12 kg mm−1 to 38.51 kg mm−1), sugar beet (from 157.48 kg mm−1 to 40.59 kg mm−1), and processing tomato (from 73.93 kg mm−1 to 21.20 kg mm−1).
Beyond this threshold, further increases in irrigation led to additional decreases in IUE for all three crops. However, this decline was less pronounced compared to the reductions observed under lower irrigation regimes. IUE dropped from 29.05 kg mm−1 to 16.55 kg mm−1 when shifting from Irr_80 to Sur_40 for maize, from 31.88 kg mm−1 to 18.65 kg mm−1 for sugar beet, and from 17.84 kg mm−1 to 10.97 kg mm−1 for tomato. Thus, among the examined crops, processing tomato exhibited the lowest capacity to utilize irrigation water for yield production. Regarding the response of WUE to the applied irrigation regimes, it was less sensitive compared to IUE across all examined crops. In fact, WUE remained relatively stable for maize across all irrigation regimes, ranging from 22.01 kg of dry yield per mm of evapotranspired water (Irr_10) to 23.81 kg mm−1 under optimal water supply, and 23.64 kg mm−1 under Sur_40.
Sugar beet exhibited comparable WUE values to maize, with a slight decrease in this parameter as irrigation supply increased (from 22.58 kg mm−1 to just above 21 kg mm−1, moving from the most water-stressed regime to the most abundant one). Similarly, processing tomato, like maize, showed slight increases in WUE with increasing seasonal irrigation volumes, from a minimum of 9.76 kg mm−1 under the most water-stressed regime to a small increase under Full (13.19 kg mm−1), remaining almost stable even under Sur_40 (13.01 kg mm−1). Finally, for Net_Inc, based on productivity and the price ranges of the applied irrigation volumes, three distinct patterns were observed across all three crops. Increases in water supply under low irrigation management led to a rise in income net of irrigation costs, which was lowest under Irr_10 for all three crops (€2693 ha−1, €13,570 ha−1, and €5788 ha−1 for maize, sugar beet, and processing tomato, respectively), reaching the best value under Irr_60 for maize (€3997), around €21,370 for sugar beet under Irr_80 and Full regimes, and €15,557 under Full for processing tomato (still not far from the value achievable under Sur_20).
Although the two highest irrigation volumes did not result in significant productivity increases across all crops compared to Full, they still ensured Net_Inc higher to those achievable under more water-stressed regimes. This is despite the costs for such management ranging from a minimum of approximately €54 for Irr_10 (averaged across the three cropping systems) to a maximum of around €1600 ha−1 under Sur_40.

3.2. Analysis of Cropping Systems Processed by MUVT

The values of the regressors of the standardized polynomial between the water-related variables and the seasonal irrigation volumes Equation (5), as well as the R2 values and the values of α for each system variable analyzed across the three cropping systems, were derived from the regression between seasonal irrigation volumes and the response of the water-related parameters, as indicated by the outputs of AquaCrop. These values are reported in Table 2, while their conversion Equations (6)–(10) into evaluative and numerical judgment is presented in Table 3.
Regarding the productive performance of the three examined crops, MUVT produced a WVi score based on the standardized regressor values, and the weight assigned to these indices, in conjunction with the significance of the regression model in the final evaluation. This score, equal to 1.00, corresponds to a “Very strong” impact of irrigation on the dynamics of this water-related parameter.
About the environmental sustainability of irrigation, as reflected by the dynamics of drainage and Blue_FP, it was found that, for the first variable, MUVT indicated a “Not significant” impact of irrigation on the two summer crops (maize and tomato) and a “Poor” impact for sugar beet. In contrast, for the second index, the irrigation management exhibited a “Very strong” effect on this water-related variable. The negligible impact of irrigation on drainage, as attributed by MUVT, was because, as highlighted in Section 3.1, seasonal irrigations up to the Full management level did not generate significant water losses by drainage (with the maximum being observed in processing tomato at 8.08 mm). However, in the two extreme regimes (Sur_20 and Sur_40), drainage increased rapidly for all three crops, reaching values up to one third of the irrigation volume. For Blue_FP, a linear and stable increase in this index was observed as the seasonal irrigation volumes increased. This trend justified the WVi value of −1.00 and, consequently, the maximum impact rating. Specifically, it was found that for every mm of irrigation water supplied to the system, the crop consumed unproductively approximately 0.075 mm for maize, 0.078 mm for sugar beet, and about 0.18 mm to produce one kg of dry fruits. The strong dependence of crop productivity on irrigation volumes (IUE) was confirmed by MUVT for all three crops, as evidenced by the “Very strong” rating in correlating the performance of cropping systems with the applied irrigation management. Unlike IUE, the response of the three cropping systems was markedly different regarding the dynamics of WUE as a function of the seasonal irrigation regime.
MUVT’s processing of data on WUE trends relative to water supply resulted in a “Very strong” rating for processing tomato, which dropped to “Moderate” for maize, and ultimately indicated a complete lack of correlation between sugar beet yield and the irrigation regime. Although WUE variability within each crop occurred within narrow ranges, MUVT proved sensitive enough to capture the significance of these variations even within such a restricted range. The differences in WUE response to irrigation regimes can be attributed to several factors. One factor is the duration of the crop cycle—sugar beet can utilize water reserves accumulated from rainfall between autumn and spring, thereby maintaining a more stable water productivity across irrigation regimes. Another factor is root depth; processing tomato has shallow roots, making it more dependent on water supply to regulate its evapotranspiration, in contrast to maize and sugar beet, which are characterized by deeper roots that allow them to explore a greater soil depth in search of water.
Finally, regarding Net_Inc, MUVT indicated a clear (“Very strong”) dependence of net income (after deducting irrigation costs, which were structured into three pricing tiers based on the applied volumes) on irrigation volumes for all the analyzed crops. This was evidenced by the marked increases observed as the irrigation regimes approached the optimal level, although irrigation volumes beyond the Full regime did not yield any further benefit for Net_Inc.

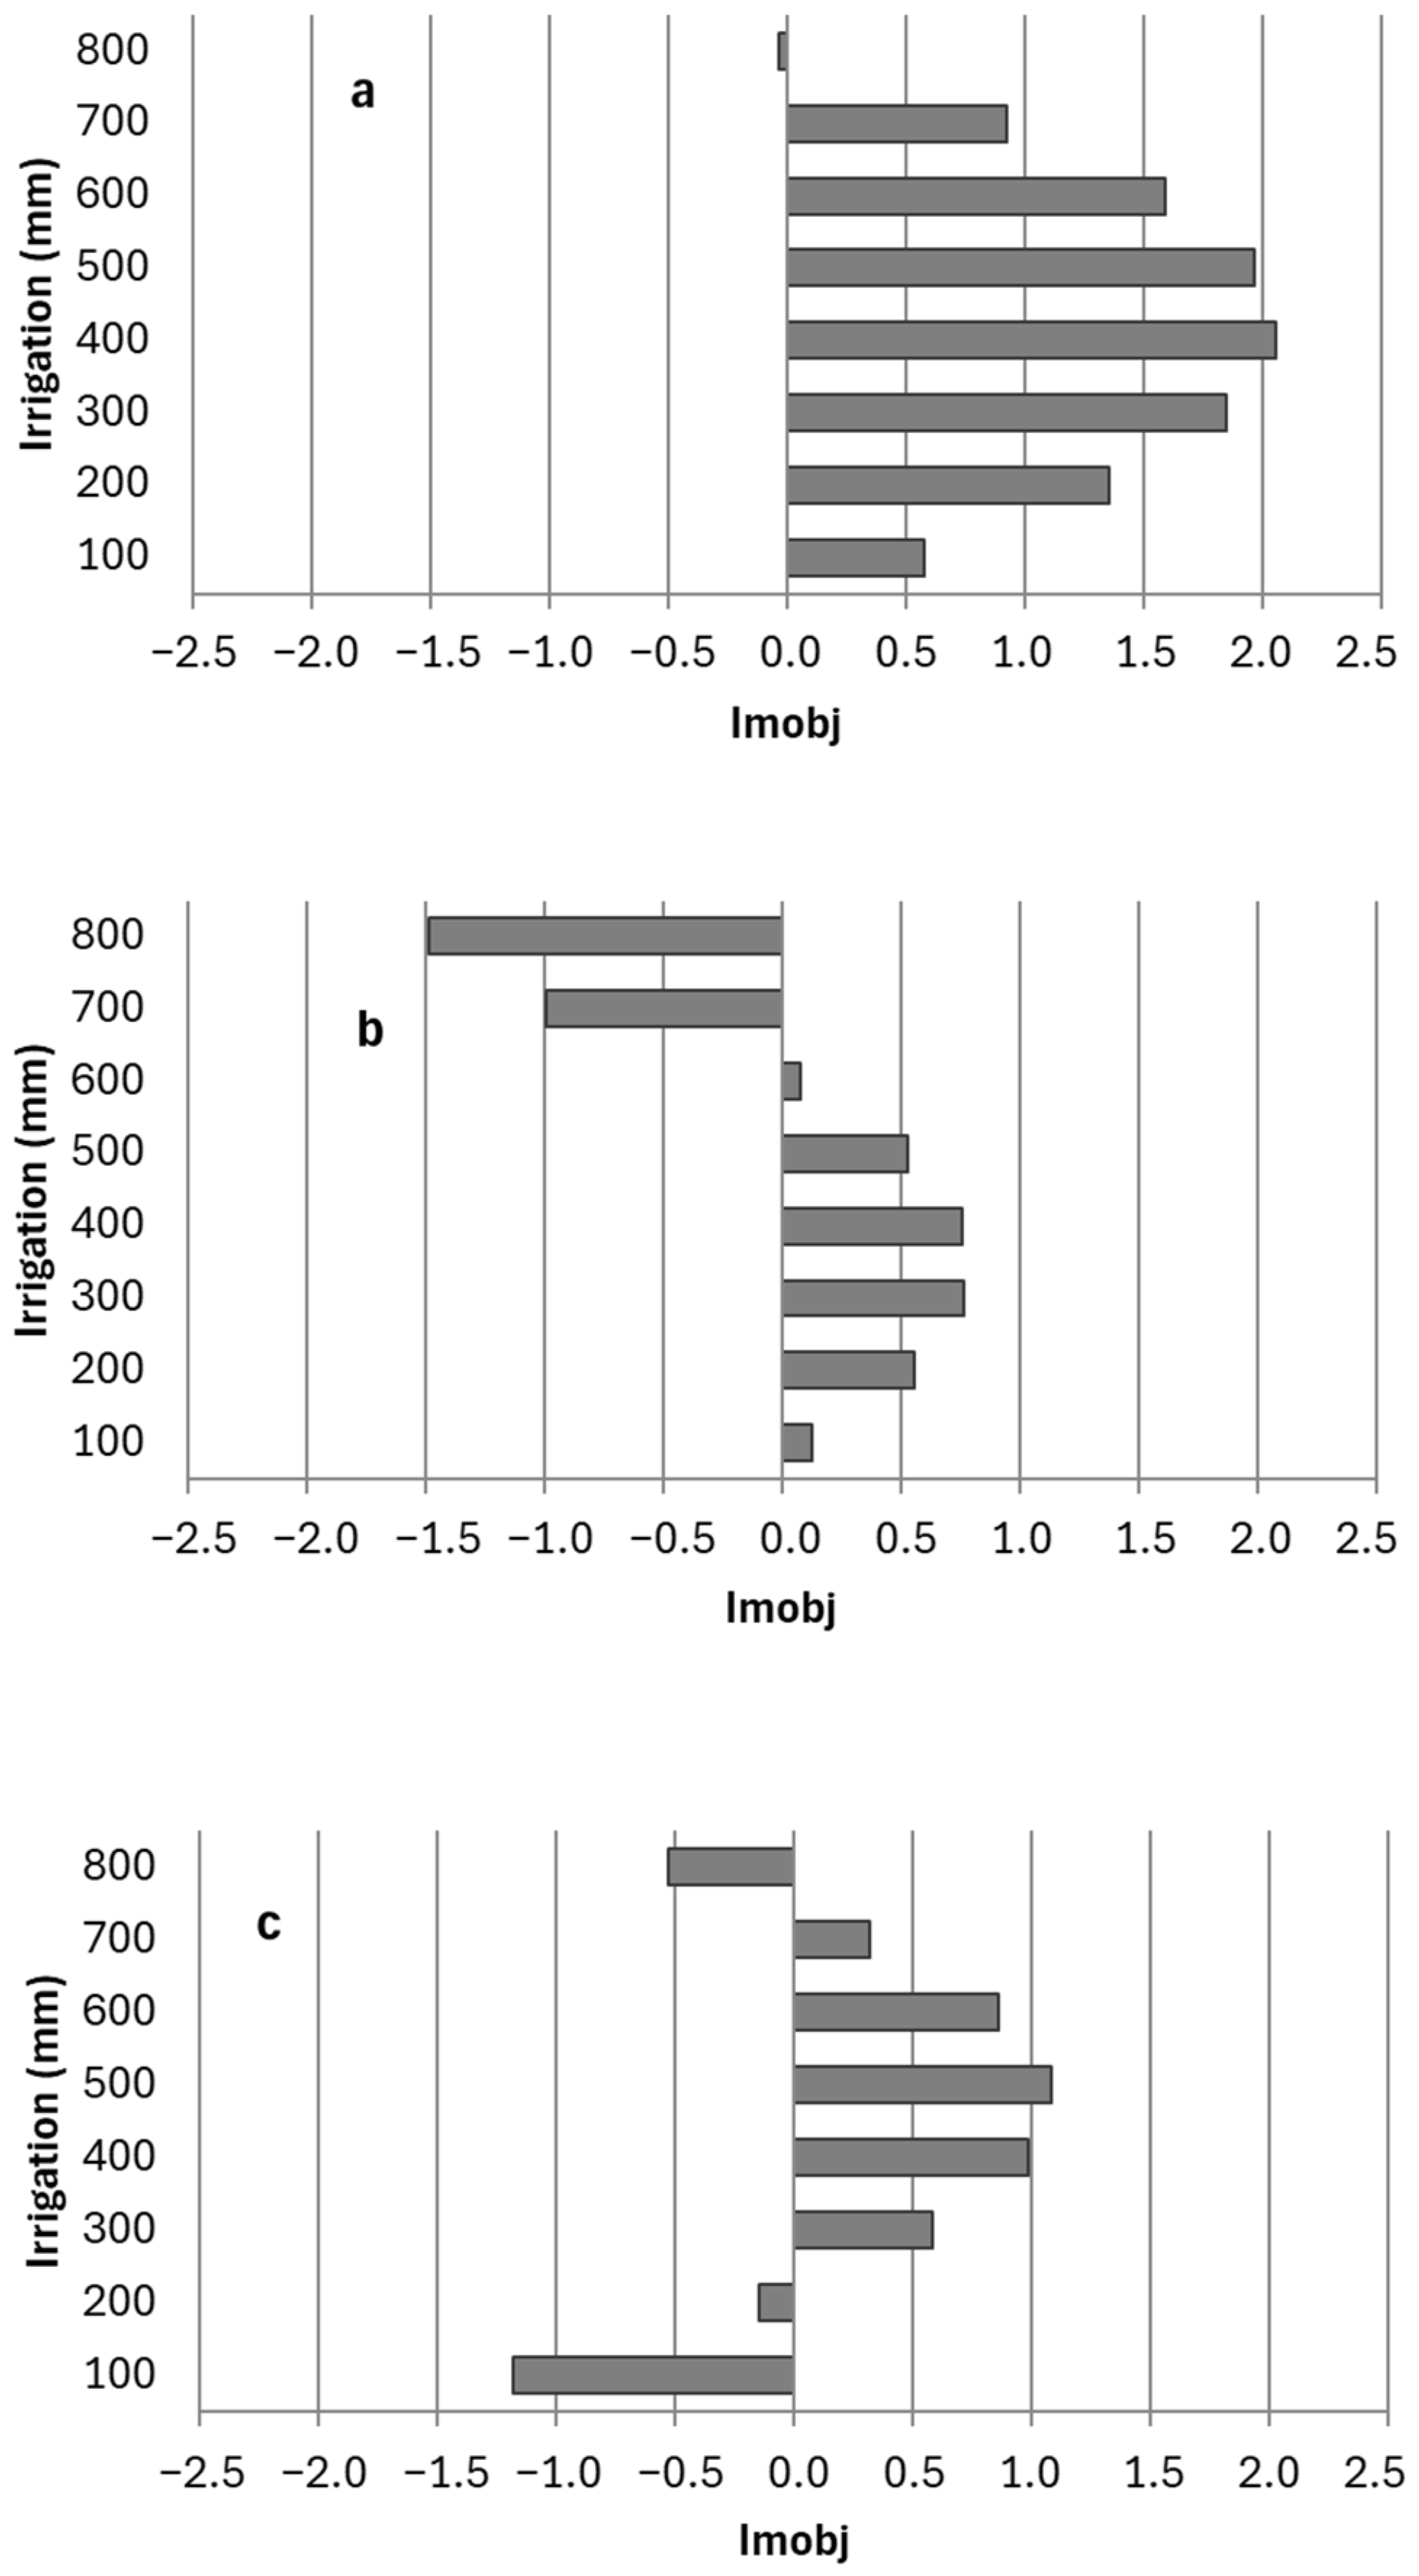
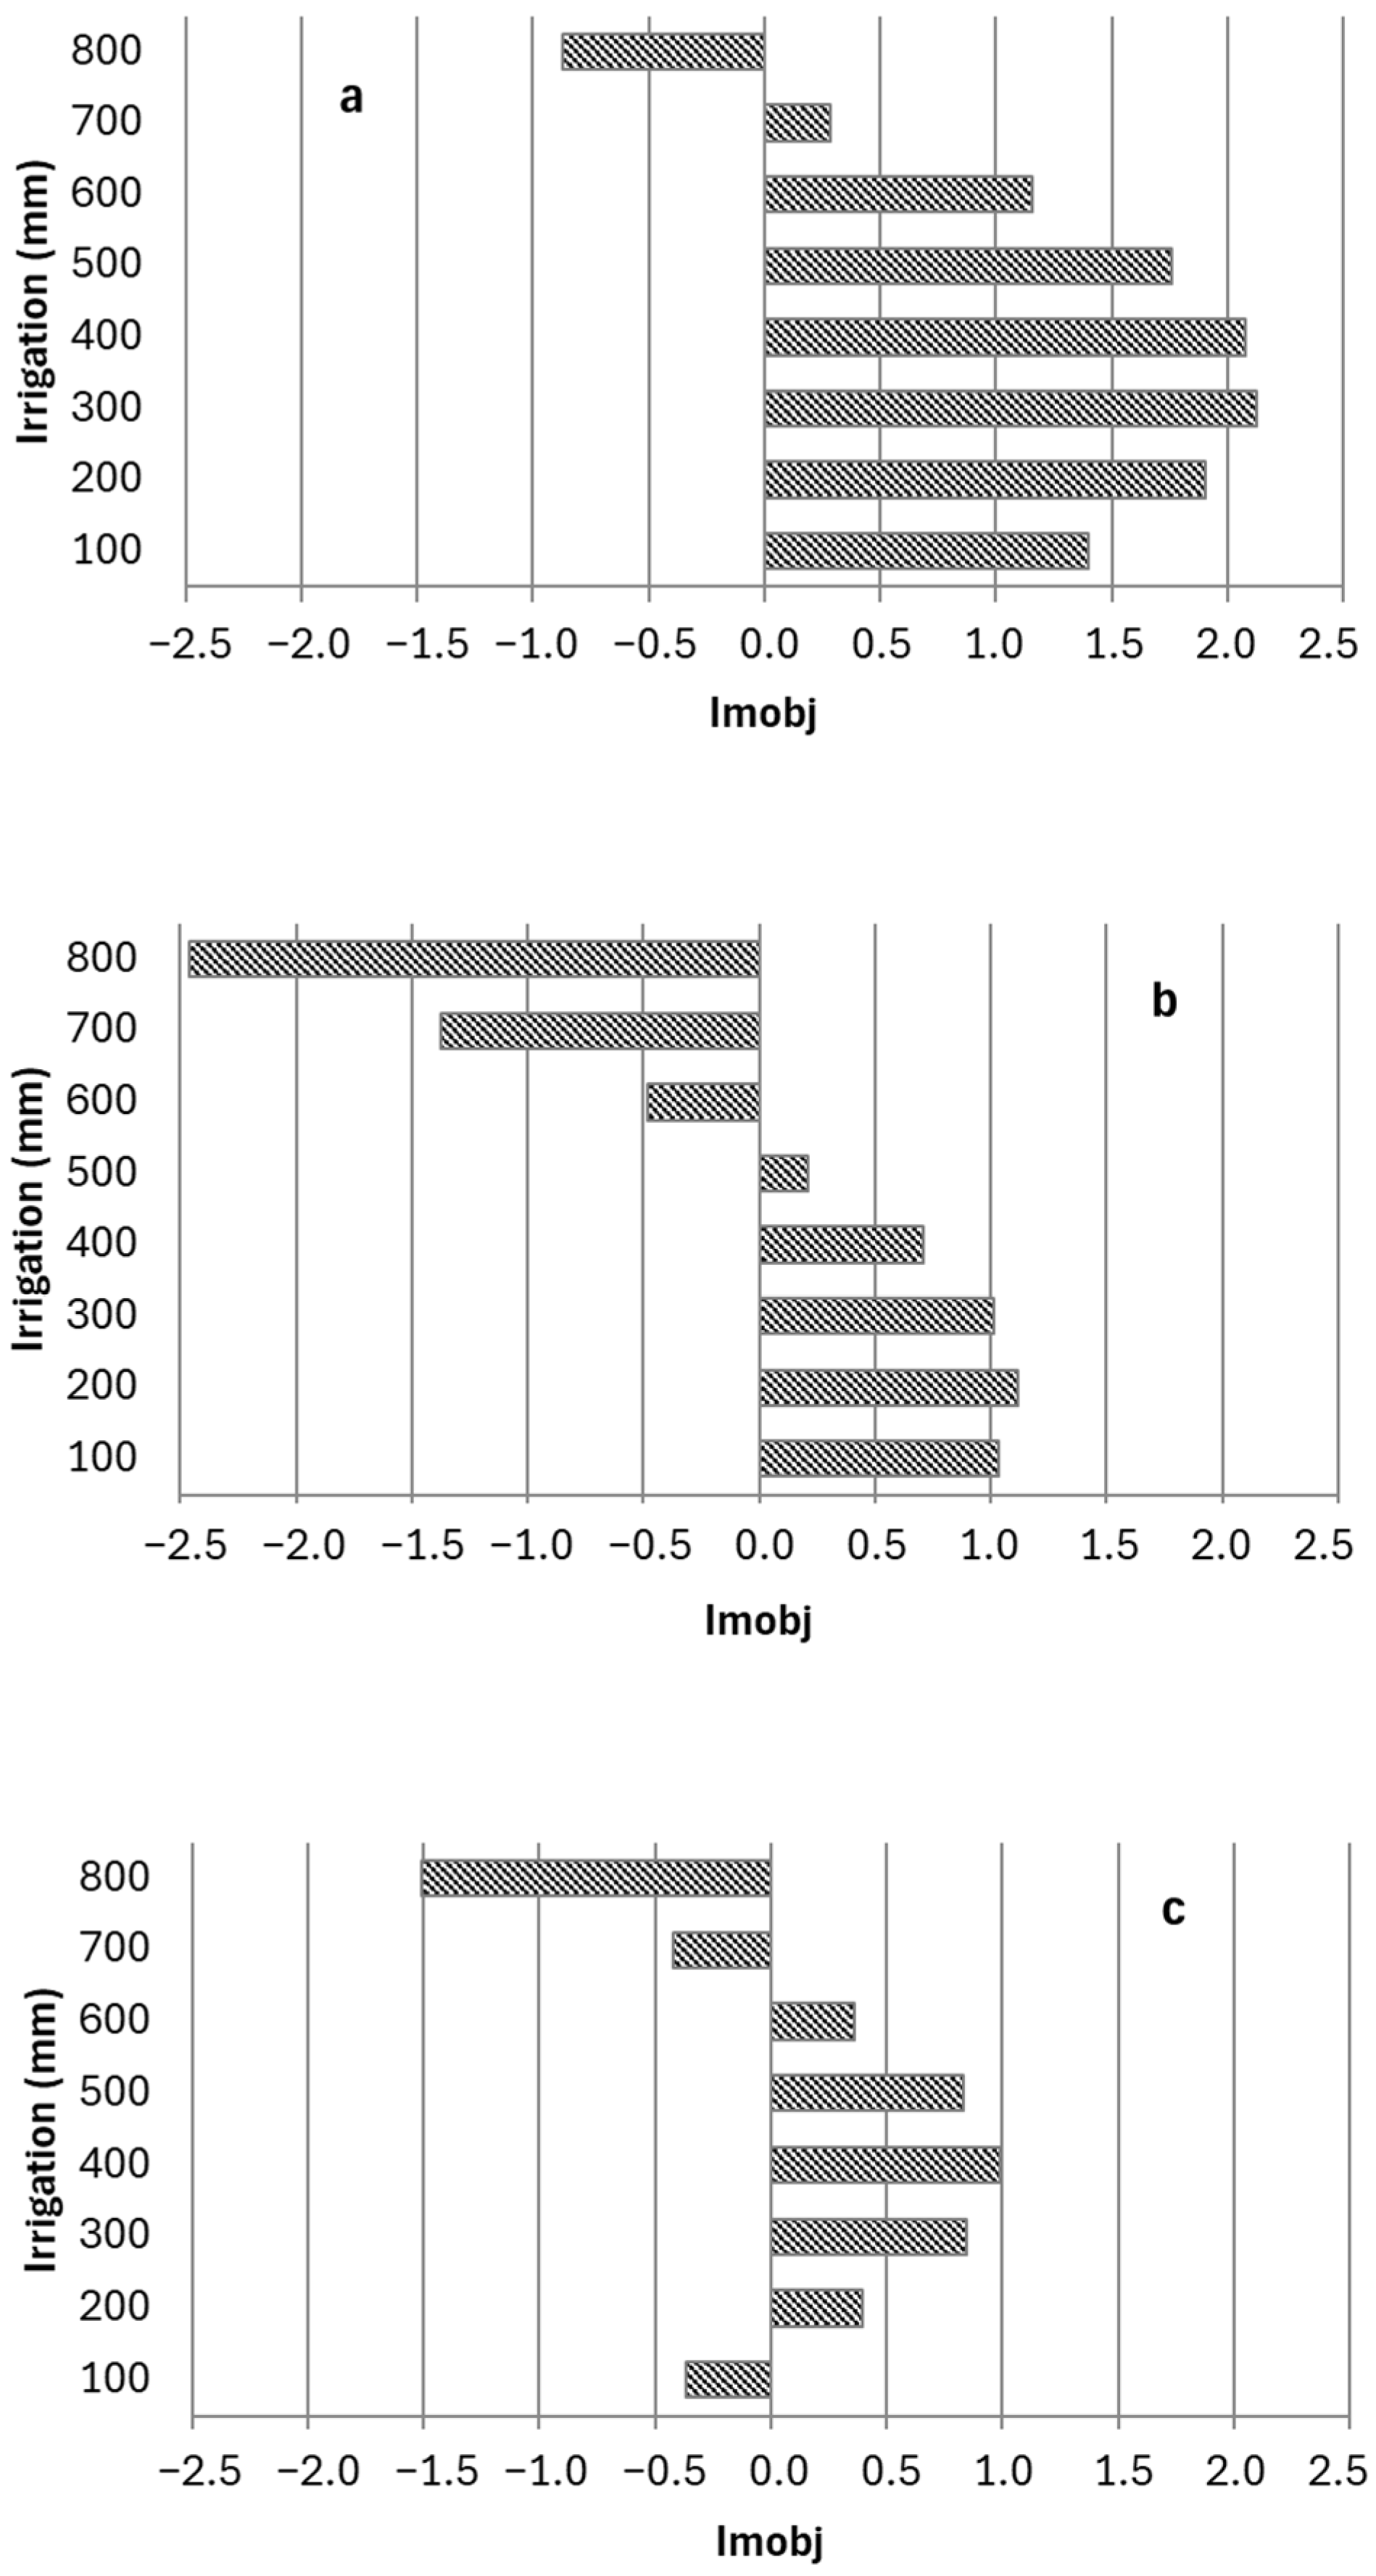
3.3. Multi-Objective Analysis of Maize, Sugar Beet and Processing Tomato

Although MUVT provides both numerical ratings (WVi) and qualitative assessments (ranging from “Very strong” to “Not significant”) regarding the impact of irrigation on water-related parameters, it is also capable of performing a multi-objective evaluation. It does so by modulating the values of TWi (see Equation (11)) based on water supply and by providing a final numerical value (Imobj) that allows for a quick and clear determination of the optimal irrigation regime needed to achieve the best balance among the water-related variables for each cropping system. TWi enabled the assessment of trade-offs among various water-related metrics—such as productivity and economic performance, environmental sustainability and water use efficiency—by assigning scores to each variable, which can then be compared within a given scenario and across different irrigation regimes (in Table 4, the response of Twi is reported as a function of increasing irrigation volumes, which are equal for all three crops analyzed). Unlike raw data, which require separate analysis for each parameter and are often difficult to compare across different cropping systems, TWi provides a standardized, intuitive framework that simplifies interpretation and facilitates informed decision-making. By offering a single, comparable metric, TWi enables rapid assessment of how cropping systems (through the dynamics of their representative parameters) respond to irrigation without the need for complex cross-variable analysis. In addition, the return of a value (TWi) that is weighted based on the actual impact of irrigation on the water-related parameters allows for a comparison within irrigation scenarios and among irrigation scenarios that are free from “noise” that could lead to responses influenced by factors unrelated to irrigation management.
For maize, the TWi scores revealed that at the lowest irrigation volume (100 mm), productivity was severely compromised—both Dry_Y and Net_Inc recorded negative values—although water use efficiency was high, as indicated by Blue_FP (1.19) and IUE (1.34), which in our framework mean that the system is making efficient use of the limited water available. As irrigation increased to 200 mm and 300 mm, performance gradually improved, with Dry_Y reaching 0.03 and Net_Inc rising to 0.96 at 300 mm, highlighting a recovery from water-stressed conditions. Moderate irrigation volumes (400 and 500 mm) further enhanced performance; for example, at 400 mm, Dry_Y reached 0.47 and Net_Inc was 1.40, while at 500 mm these values improved to 0.75 and 1.64, respectively. The optimal performance was observed at 600 mm, where Dry_Y peaked at 0.88 and Net_Inc at 1.68, with WUE at 0.43, and the efficiency indicators remained high (Blue_FP = 0.54; IUE = 0.86). However, when the applied irrigation volume increased beyond 600 mm—to 700 mm and then 800 mm—environmental performance declined: Blue_FP decreased from 0.54 at 600 mm to 0.30 at 800 mm, WUE declined from 0.43 to 0.32, and drainage shifted from nearly neutral (0.01 at 600 mm) to 0.13 at 800 mm.
Processing tomato exhibited a similar trajectory. At the lowest irrigation volumes (100–300 mm), the TWi values for Dry_Y and Net_Inc were negative or marginal (–1.22 and –1.20 at 100 mm, rising to 0.07 and 0.13 at 300 mm). As irrigation increased to 400 mm and 500 mm, both productivity and efficiency indicators improved, and optimal performance was recorded at 600 mm, where Dry_Y peaked at 0.92 and Net_Inc at 0.90, with WUE at 0.77. However, when irrigation was further increased to 700 mm and 800 mm, water use efficiency deteriorated sharply—Blue_FP decreased from −0.94 at 600 mm to −1.35 at 700 mm and further to −1.75 at 800 mm—while WUE declined from 0.77 to 0.40. In parallel, both Dry_Y and Net_Inc declined, and drainage worsened (increasing from −0.02 at 600 mm to −0.31 at 800 mm).
Sugar beet, in contrast, displayed a more gradual response. Under water-stressed conditions at low irrigation volumes (100 mm), TWi values for Dry_Y and Net_Inc were negative, while efficiency was high. As irrigation increased to 200 mm and 300 mm, performance improved steadily—with Dry_Y reaching 0.09 and Net_Inc turning slightly positive. Further improvements were observed at 400 mm and 500 mm, where Dry_Y increased to 0.51 and 0.78 and Net_Inc to 0.59 and 0.82, respectively. The optimum was reached at 600 mm, where Dry_Y and Net_Inc peaked at the highest scores. However, further increases to 700 mm and 800 mm resulted in declines in both yield and net income Twi performance. Notably, WUE remained constant at 0.00 across all irrigation volumes—indicating that water use efficiency in sugar beet was not influenced by irrigation level—while Blue_FP decreased from −0.82 at 600 mm to the worst score at 800 mm and drainage worsened from 0.02 to negative TWi.
These findings confirm that TWi is a rapid, standardized index providing clear and comparable insights into the water-related responses of cropping systems to varying irrigation volumes. While each irrigation regime has its own benefits and drawbacks—as reflected by the different TWi metrics—evaluating these parameters individually (even with TWi) is challenging when attempting to integrate yield, water use efficiency, environmental sustainability, and economic returns into a unified irrigation management approach. To overcome this complexity, the aggregated index Imobj (Figure 1) was employed, offering straightforward and interpretable insights into the impact of different irrigation volumes.
For maize, the Imobj scores improved significantly as irrigation increased from very low levels (around 100 mm, where the Imobj value was approximately 0.57, heavily affected by poor productivity and WUE) to a moderate range. The optimal performance was observed between approximately 400 mm and 500 mm, with peak Imobj reaching around 2.05 at 400 mm. However, when irrigation volumes exceeded this moderate range—approaching 700 to 800 mm—the evaluative index declined, dropping to nearly −0.03 at 800 mm, due to high inefficiency in water use and significant water loss through drainage.
Similarly, sugar beet exhibited a gradual improvement in overall performance as water availability increased. At very low irrigation levels (100 mm), the Imobj value was slightly above 0.1, reflecting a system imbalance that promoted water saving and water use efficiency rather than crop performance. The best performance was achieved in the range of 300 mm to 400 mm, where Imobj scores peaked between 0.76 (300 mm) and 0.77 (400 mm). Beyond this range, particularly at 800 mm, Imobj fell sharply to nearly −1.48, heavily impacted by excessive irrigation water consumption per unit of root yield (Blue_FP).
Processing tomato followed a comparable pattern. The optimal performance for tomato was recorded in the moderate irrigation range of roughly 400 mm to 500 mm, where Imobj values ranged between 0.99 for the former and 1.08 for the latter. In contrast, extremely low irrigation (between 100 mm and 200 mm) resulted in significantly negative Imobj values, reaching −1.18 under the most severe water-stressed scenario, due to compromised productivity and profitability. Conversely, excessive irrigation beyond 600 mm also led to suboptimal performance, with Imobj declining to 0.32 at 700 mm. While this irrigation level still resulted in satisfactory TWi values for productivity and economic returns, it was severely penalized by drainage losses and excessive irrigation water consumption. The Imobj score further dropped to −0.53 under an 800 mm irrigation regime, driven by a worsening sustainability profile related to water saving (with strongly negative TWi values for drainage and Blue_FP) and a decline in dry fruit yield and net income.

4. Discussion

4.1. Challenges and Advances in Agricultural Resource Optimization

The agricultural sector is currently under scrutiny as it faces two major global challenges. On the one hand, the growing global population necessitates an increase in food production [1,30,31]. On the other hand, it is imperative to safeguard increasingly scarce natural resources, such as water [9], and to address the challenges posed by climate change [32,33]. To mitigate these challenges, the agricultural sector can optimize the use of agro-inputs. This optimization helps reduce greenhouse gas emissions [34,35] and minimizes environmental impacts, such as nitrate leaching [36].
For these reasons, resource optimization models and tools for agricultural systems have gained increasing relevance in recent years. Various analytical approaches have been proposed. Some models integrate standalone algorithms for resource allocation [37], while others use fuzzy calculation procedures based on expert weight systems to optimize nitrogen fertilizer application and soil practices [14]. In addition, several decision support systems (DSS) have been developed for managing fertilizers and soil management [38,39,40], and irrigation strategies [41,42,43].
Crop simulation models such as AquaCrop [44], STICS [45], CropSyst [46], and DSSAT [47] have been widely used to evaluate the response of cropping systems to various agro-inputs. For instance, AquaCrop v. 7.0 has been applied to optimize water supply in processing tomato [28] and to evaluate the productivity and water use efficiency of winter wheat [48], alfalfa [49], and forage sorghum [50]. Other models have been used to explore nitrogen dynamics in the soil–plant system [51].
These simulation models offer the advantage of exploring numerous variables. They assess direct parameters such as crop yield, water and nutrient demand, evapotranspiration, soil organic matter dynamics, drainage losses, and water productivity. In addition, they evaluate derived parameters like irrigation use efficiency and water use efficiency. This comprehensive approach enables full control over crop management and a thorough investigation of various input-related parameters. However, two key aspects must be considered when selecting these tools. First, a high level of expertise is required to calibrate and validate the crop models so that they accurately replicate the cropping system’s behavior under different scenarios. Second, the outcomes often focus on individual aspects (e.g., production, drainage, evapotranspiration) and must be further processed to identify the optimal levels of specific inputs for system-wide optimization.
For example, simulated irrigation scenarios using AquaCrop for processing tomato provided multiple variables—including production, economic performance, environmental sustainability, and water use efficiency—which were then processed within a multi-objective analysis [28]. Similarly, CropWat v.8.0 [52] was used to evaluate the effect of irrigation management and various organic fertilizers on olive trees [53]. The data were subsequently processed through an empirical framework to manage irrigation and fertilizer inputs, thereby optimizing the water footprint, productivity, and sustainability of olive groves. While these tools provide valuable insights, they often lack the capacity to integrate multiple conflicting objectives—such as balancing productivity, economic returns, and environmental sustainability—into a single framework. This gap aligns with the primary objective of our study: to develop and validate MUVT as a flexible tool for multi-objective optimization. The results presented in Section 3 demonstrate how MUVT effectively integrates these objectives, providing clear recommendations for optimal irrigation strategies in maize, sugar beet, and processing tomato.

4.2. The Role of MUVT in Multi-Objective Analysis

These studies underscore the need to use algorithms within empirical frameworks for resource optimization also in cropping contexts. Such frameworks are not designed around specific variables, making them highly adaptable to the user’s needs. For instance, multi-objective optimization approaches have been successfully applied to allocate water resources [54], optimize irrigation and fertilization for potatoes [12], and allocate agricultural land use [55,56,57,58]. Recent enhancements to multi-objective algorithms, such as an enhanced NSGA-II for maize irrigation and fertilization scheduling [59], further illustrate this point.
Understanding the flowchart of these complex empirical methodologies and replicating them in spreadsheets can be challenging. MUVT was therefore designed to provide a multi-objective analysis aimed at optimizing the amount of input variables such as mineral or organic fertilization, seasonal irrigation regimes, or even variables not directly linked to agricultural systems. Its purpose is to balance the overall performance of the system under investigation, allowing the user to compare how an input (in quantitative terms) can modify the system’s response for specific output variables and/or by aggregating these outcomes into a single aggregated index. In this study, MUVT was applied to evaluate the response of six water-related parameters across three cropping systems because of applied seasonal irrigation volumes, and to identify the optimal water allocation to achieve an optimal balance among all the investigated variables. Although the tool can process up to 20 outcomes, here we focused on production, economic, and environmental performance.
As indicated in Section 2.3, the MUVT framework is based on the regressors (b), the alpha level (α), and the coefficient of determination (R2) from the second-degree standardized polynomial correlation between the input (at various applied levels) and the system’s response variables. These parameters can be derived using statistical software that incorporates regression analysis. This provides full flexibility for the user in selecting input and output variables and in choosing the methodologies they deem necessary (at different levels of complexity) to obtain these variables, as MUVT is not tied to specific conditions or contexts being examined. In the modeling exercise presented here, the dynamics of variables for maize, sugar beet, and processing tomato in response to applied irrigation regimes were obtained using the AquaCrop model, subsequently subjected to standardized regression analysis, and the corresponding parameters were input into MUVT. However, remaining in the agronomic context, the user can use other methods (e.g., experimental observations, empirical approaches, or different simulation models) to set up the regression analysis to obtain the parameters required for MUVT processing. Once the standardized regression parameters are entered into the tool, MUVT performs real-time calculations and provides an initial numerical assessment of the impact that the input variable in the system has on the output variables (WVi). It then assigns a qualitative judgment—from “Very strong” to “Not significant”—related to what is expressed by WVi (e.g., the impact of seasonal irrigation volumes on specific variables such as Dry_Y, drainage, IUE, etc.). This initial evaluation is crucial because it allows for a preliminary screening of input-related variables, enabling researchers to focus subsequent analyses on those with meaningful correlations while excluding uncorrelated or weakly dependent ones.

4.3. Evaluating System-Wide Optimization with MUVT

Although TWi allows precise evaluations of individual system variables—for example, indicating how much the productive and/or environmental performance may increase or decrease with varying seasonal irrigation regimes (on a scale from 0 to 1, and therefore easily interpretable, Table 4)—it does not, at least not effectively, permit an assessment of the system as a whole. To address this limitation, MUVT aggregates the TWi values for all variables to provide the aggregated index (Imobj). This index reflects the balance between the positive effects (i.e., increased crop production, increased economic return as irrigation volumes increase) and negative effects (i.e., increased drainage and Blue_FP with higher water supply) of the input, thus allowing easy identification of input levels that are considered unsustainable for that system, or conversely, optimize the system’s overall response. When applied to the three cropping systems, Imobj enabled the identification of irrigation scenarios with the poorest performance for each crop. For instance, negative Imobj values were observed for sugar beet when seasonal irrigations exceeded 600 mm and for processing tomato when they exceeded 800 mm (with processing tomato showing negative values even at irrigations below 300 mm). The usefulness of Imobj becomes apparent not only when evaluating the response of a single system as the input variable changes but also when comparing different systems. In the three cropping systems, if one had to select the system with the best balance among productive, economic, and environmental performance, maize exhibited the highest score among all the compared irrigation regimes. This conclusion holds even when the availability of a certain input (e.g., water for irrigation) is limited to specific ranges; for example, if seasonal irrigation volumes could not exceed 300 mm, Imobj would still indicate maize as the preferred cropping system—with aggregated index values of 1.85 for maize, 0.77 for sugar beet, and 0.58 for processing tomato (Figure 1).
Another advantage offered by MUVT is its ability to modulate the output based on variations in the parameter k Equation (9) according to the user’s needs. As described in Section 2.3, k allows for the adjustment of the sensitivity (importance) of one or more system variables to changes in the input variable on a scale from 0 to 10 (higher values result in higher importance). The data reported thus far were based on a balanced k (equal to 5) for all water-related variables, which influenced the values of WVi, TWi, and consequently Imobj.
In addition to presenting the processing algorithms, this study specifically designed MUVT to address the challenges of multi-objective optimization in agricultural systems, as highlighted in the introduction. By simulating different irrigation regimes and evaluating their impacts on productivity, water use efficiency, and environmental sustainability, MUVT provided a comprehensive framework for decision-making. The results presented in Section 3.3, particularly the aggregated index (Imobj), demonstrated how MUVT could identify optimal irrigation levels that balanced competing objectives, such as maximizing yield while minimizing water use and environmental impact.

4.4. Sensitivity Analysis of MUVT with Varying k-Values

To test how the recommendations provided by MUVT could change based on the values of k, an additional analysis was conducted using unbalanced k values among the different water-related parameters. In this configuration, the importance of Dry_Y was significantly reduced (k = 1) and the weight of Net_Inc was slightly reduced (k = 3). In contrast, the weight assigned to environmental performance—both for drainage and Blue_FP as well as for IUE and WUE—was increased by setting k to 10. As a result, the recommendations provided by MUVT underwent variations compared to those obtained using balanced k values (Figure 2). By decreasing the weight of productive and economic performance, scenarios with higher irrigation supplies were further penalized by Imobj. For maize, the score dropped from 0 with balanced k to −0.87 with unbalanced k under seasonal irrigation volumes of 800 mm. For sugar beet, the already negative Imobj values observed at 700 mm (−0.99) and 800 mm (−1.48) with balanced k further decreased to –1.38 and −2.46, respectively, under unbalanced k.
Interestingly, for processing tomato, the adjustment of k to support environmental sustainability over other the performance parameters resulted in an inversion of the Imobj trend under certain seasonal irrigation regimes compared to balanced k. For example, with a water supply of 700 mm, Imobj was positive with balanced k but dropped to −0.42 when k was unbalanced. Conversely, while MUVT configured with balanced k yielded a negative score under seasonal irrigation of 200 mm, using unbalanced k produced a positive value (0.39), indicating how the irrigation management (especially under more extreme regimes) of processing tomato had a greater impact compared to the other two cropping systems.
Based on these results, by comparing the responses with balanced and unbalanced k, MUVT shifted the optimal irrigation regimes for achieving the best optimization of the cropping systems downward, specifically highlighting the best irrigation strategies in this context. For maize, the highest Imobj with balanced k was 2.05 at 400 mm. With unbalanced k, the best score shifted to 2.13 at 300 mm. In the case of sugar beet, the system achieved the Imobj score of 1.03 with the lowest irrigation regime (using unbalanced k), indicating an aggregate performance higher than the score achieved under balanced k when irrigated with 300 mm. Overall, the best performance was observed with a water supply of 200 mm (Imobj = 1.12), when environmental sustainability was prioritized over productive performance.
Similar conclusions were drawn for processing tomato. With balanced weights, the best performance was achieved with an irrigation of 500 mm. With diversified k values, however, the highest score was obtained with a water supply of 400 mm.
Finally, these dynamics demonstrated the broad flexibility of MUVT, which is adaptable to various systems (here, cropping systems were explored). Moreover, it is not confined to a rigid structure but is highly customizable based on the analyzed variables (whose regressions form the foundational basis of the tool’s evaluation process and are independent of its operation). Within these variables, it allows users to modulate MUVT’s assessment based on which aspect of the system they wish to prioritize or optimize.

5. Conclusions

This study introduced and validated the Multi-Objective Evaluation Tool (MUVT) as a robust decision-support system for optimizing irrigation management in cropping systems. In this research, AquaCrop was employed to simulate the dynamics of key parameters related to productive, economic, and environmental performance across three cropping systems—maize, sugar beet, and processing tomato—under varying irrigation volumes. These parameters, derived from simulations, were then used to calibrate MUVT, enabling it to quantitatively assess trade-offs among production, economic performance, and environmental sustainability. The findings highlight that each crop has a distinct optimal irrigation regime. For instance, maize and processing tomato achieve peak performance at irrigation volumes between 400 and 500 mm, while sugar beet performs best at 300–400 mm. These results emphasize the importance of tailoring irrigation strategies to the specific requirements of each crop. Although numerous studies have demonstrated the application of optimization models (using a variety of algorithms) for resource allocation, this work presents a ready-to-use tool that explicitly integrates data processing algorithms into a multi-objective framework. By analyzing the sensitivity of the aggregated performance index (Imobj) to parameter adjustments (via the k-value), the study demonstrates MUVT’s flexibility in accommodating diverse user priorities. This adaptability ensures that irrigation practices can be refined to maximize both yield and environmental outcomes according to specific needs or other specific requirements where defining precise input quantities is necessary to optimize system responses across multiple evaluative variables. The practical implications of this research are significant. MUVT’s ability to provide real-time evaluations of diverse water-related parameters offers a valuable resource for agronomists and decision-makers facing the dual challenges of increasing food production and conserving natural resources. In practice, the tool not only identifies optimal water supply levels but also quantifies the impact of deviations from these levels—critical information for efficient resource management in agriculture. Furthermore, the integrated multi-objective approach underscores the importance of balancing productivity with economic and environmental sustainability. For example, when sustainability is prioritized over production, the recommended irrigation volumes decrease further, which is crucial for the long-term viability of cropping systems. This study demonstrates that a multi-objective framework such as MUVT can effectively balance the trade-offs inherent in irrigation management—or indeed any system where variations in input quantities may lead to conflicting responses among different output variables. By translating a large volume of experimental, simulated, or context-derived data (with MUVT capable of processing up to 20 input variables) into a single aggregated index, the tool provides a coherent link between theoretical insights, empirical data, and practical recommendations for sustainable practices. Future research should focus on extending this approach to additional crops and integrating real field data to further enhance the tool’s predictive capabilities. Additionally, incorporating evaluation parameters such as energy efficiency, economic performance, and broader sustainability metrics could expand its applicability not only in agronomy but also in other fields of study.

Supplementary Materials

The following supporting information can be downloaded at: https://www.mdpi.com/article/10.3390/su17073030/s1, Figure S1: Schematic representation of MUVT operation; Table S1: Analysis of variance (ANOVA) table showing the effects of irrigation regimes on response variable.

Author Contributions

Conceptualization, P.G.; methodology, P.G.; software, P.G.; validation, P.G.; formal analysis, P.G.; investigation, P.G.; resources, P.G. and A.V.V.; data curation, P.G. and A.V.V.; writing—original draft preparation, P.G.; writing—review and editing P.G.; supervision, P.G. All authors have read and agreed to the published version of the manuscript.

Funding

This research received no external funding.

Institutional Review Board Statement

Not applicable.

Informed Consent Statement

Not applicable.

Data Availability Statement

Freely available at: https://github.com/garofalopasquale/MUlti-objective-eValuation-Tool, accessed on 30 January 2025.

Conflicts of Interest

The authors declare no conflicts of interest.

References

  1. United Nations (UN). Transforming Our World: The 2030 Agenda for Sustainable Development; United Nations (UN): New York, NY, USA, 2015. Available online: https://www.un.org/sustainabledevelopment/ (accessed on 1 October 2024).
  2. Singh, A. An overview of the optimization modelling applications. J. Hydrol. 2012, 466–467, 167–182. [Google Scholar] [CrossRef]
  3. Yan, F.; Liu, X.; Bai, W.; Fan, J.; Zhang, F.; Xiang, Y.; Hou, X.; Pei, S.; Dai, Y.; Zeng, H.; et al. Multi-objective optimization of water and nitrogen regimes for drip-fertigated sugar beet in a desert climate. Field Crops Res. 2022, 288, 108703. [Google Scholar] [CrossRef]
  4. Vedula, S.; Mujumdar, P.P.; Sekhar, G.C. Conjunctive use modeling for multicrop irrigation. Agric. Water Manag. 2005, 73, 193–221. [Google Scholar] [CrossRef]
  5. Karamouz, M.; Zahraie, B.; Kerachian, R.; Eslami, A. Crop pattern and conjunctive use management: A case study. Irrig. Drain. 2008, 59, 161–173. [Google Scholar] [CrossRef]
  6. Agbeleye, O.A.; Akinyosoye, S.T.; Adetumbi, J.A. Correlation, path coefficient and principal component analysis of yield components in mung bean [Vigna radiata (L.) Wilczek] accessions. Trop. Agric. 2020, 97, 212–218. [Google Scholar]
  7. Hou, X.H.; Fan, J.L.; Hu, W.H.; Zhang, F.C.; Yan, F.L.; Xiao, C.; Li, Y.P.; Cheng, H.L. Optimal irrigation amount and nitrogen rate improved seed cotton yield while maintaining fiber quality of drip-fertigated cotton in northwest China. Ind. Crop. Prod. 2021, 170, 113710. [Google Scholar] [CrossRef]
  8. Chen, X.J.; Min, D.H.; Yasir, T.A.; Hu, Y.G. Evaluation of 14 morphological, yield-related and physiological traits as indicators of drought tolerance in Chinese winter bread wheat revealed by analysis of the membership function value of drought tolerance (MFVD). Field Crops Res. 2012, 137, 195–201. [Google Scholar] [CrossRef]
  9. Li, M.; Xu, W.; Zhu, T. Agricultural Water Allocation under Uncertainty: Redistribution of Water Shortage Risk. Am. J. Agric. Econ. 2019, 101, 134–153. [Google Scholar] [CrossRef]
  10. Xiao, C.; Zou, H.; Fan, J.; Zhang, F.; Li, Y.; Sun, S.; Pulatov, A. Optimizing irrigation amount and fertilization rate of drip-fertigated spring maize in northwest China based on multi-level fuzzy comprehensive evaluation model. Agric. Water Manag. 2021, 257, 107157. [Google Scholar] [CrossRef]
  11. Zhang, S.; Chen, S.; Hu, T.; Geng, C.; Liu, J. Optimization of irrigation and nitrogen levels for a trade-off: Yield, quality, water use efficiency and environment effect in a drip-fertigated apple orchard based on TOPSIS method. Sci. Hortic. 2023, 309, 111700. [Google Scholar] [CrossRef]
  12. Wang, H.; Cheng, M.; Zhang, S.; Fan, J.; Feng, H.; Zhang, F.; Xiang, Y. Optimization of irrigation amount and fertilization rate of drip-fertigated potato based on analytic hierarchy process and fuzzy comprehensive evaluation methods. Agric. Water Manag. 2021, 256, 107130. [Google Scholar]
  13. Yan, F.L.; Zhang, F.C.; Fan, X.K.; Wang, Y.; Hou, X.H.; He, Q. Optimal irrigation and nitrogen application amounts for spring maize based on evaluation model in sandy soil area in Ningxia. Trans. Chin. Soc. Agric. Eng. 2020, 9, 257–265. [Google Scholar]
  14. Garofalo, P.; Campi, P.; Vonella, A.V.; Mastrorilli, M. Application of multi-metric analysis for the evaluation of energy performance and energy use efficiency of sweet sorghum in the bioethanol supply-chain: A fuzzy-based expert system approach. Appl. Energy 2018, 220, 313–324. [Google Scholar]
  15. Steduto, P.; Hsiao, T.C.; Raes, D.; Fereres, E. AquaCrop—The FAO Crop Model to Simulate Yield Response to Water: I. Concepts and Underlying Principles. Agron. J. 2009, 101, 426–437. [Google Scholar]
  16. Dhouib, M.; Zitouna-Chebbi, R.; Prévot, L.; Molénat, J.; Mekki, I.; Jacob, F. Multicriteria evaluation of the AquaCrop crop model in a hilly rainfed Mediterranean agrosystem. Agric. Water Manag. 2022, 273, 107912. [Google Scholar]
  17. Muroyiwa, G.A.T.M.; Mhizha, T.; Mashonjowa, E.; Muchuweti, M. Evaluation of FAO AquaCrop Model for ability to simulate attainable yields and water use for field tomatoes grown under deficit irrigation in Harare, Zimbabwe. Afr. Crop Sci. J. 2022, 30, 245–269. [Google Scholar]
  18. Raes, D.; Steduto, P.; Hsiao, T.C.; Fereres, E. AquaCrop—The FAO Crop Model to Simulate Yield Response to Water: II. Main Algorithms and Software Description. Agron. J. 2009, 101, 438–447. [Google Scholar]
  19. Wellens, J.; Raes, D.; Fereres, E.; Diels, J.; Coppye, C.; Adiele, J.G.; Ezui, K.S.G.; Becerra, L.-A.; Selvaraj, M.G.; Dercon, G.; et al. Calibration and validation of the FAO AquaCrop water productivity model for cassava (Manihot esculenta Crantz). Agric. Water Manag. 2022, 263, 107491. [Google Scholar]
  20. Paredes, P.; de Melo-Abreu, J.P.; Alves, I.; Pereira, L.S. Assessing the performance of the FAO AquaCrop model to estimate maize yields and water use under full and deficit irrigation with focus on model parameterization. Agric. Water Manag. 2014, 144, 81–97. [Google Scholar]
  21. García-Vila, M.; Morillo-Velarde, R.; Fereres, E. Modeling sugar beet responses to irrigation with AquaCrop for optimizing water allocation. Water 2019, 11, 1918. [Google Scholar] [CrossRef]
  22. Rinaldi, M.; Garofalo, P.; Rubino, P.; Steduto, P. Processing tomatoes under different irrigation regimes in Southern Italy: Agronomic and economic assessments in a simulation case study. J. Agrometeorol. 2011, 3, 39–56. [Google Scholar]
  23. Francaviglia, R.; Di Bene, C. Deficit drip irrigation in processing tomato production in the Mediterranean basin: A data analysis for Italy. Agriculture 2019, 9, 79. [Google Scholar] [CrossRef]
  24. Uygan, D.; Cetin, O.; Alveroglu, V.; Sofuoglu, A. Improvement of water saving and economic productivity based on irrigation with sugar content of sugar beet using linear move sprinkler irrigation. Agric. Water Manag. 2021, 255, 106989. [Google Scholar]
  25. Corbari, C.; Ben Charfi, I.; Mancini, M. Optimizing irrigation water use efficiency for tomato and maize fields across Italy combining remote sensing data and the AquaCrop model. Hydrology 2021, 8, 39. [Google Scholar] [CrossRef]
  26. Emberger, L. Une classification biogéographique des climats. In Recueil des Travaux du Laboratoire Géolo-Zoologique de la Faculté des Sciences de Montpellier; Service Botanique: Montpellier, France, 1955; Volume 7, pp. 3–43. [Google Scholar]
  27. ISMEAmercati. Listino dei Prezzi Alla Produzione Agricola. Available online: https://www.ismeamercati.it/flex/cm/pages/ServeBLOB.php/L/IT/IDPagina/1189 (accessed on 1 October 2024).
  28. Garofalo, P.; Riccardi, M.; Di Tommasi, P.; Tedeschi, A.; Rinaldi, M.; De Lorenzi, F. AquaCrop model to optimize water supply for sustainable processing tomato cultivation in the Mediterranean area: A multi-objective approach. Agric. Syst. 2025, 223, 104198. [Google Scholar]
  29. Agerborsamerci. Listino Prezzi Agricoli. Available online: https://www.agerborsamerci.it/listino/listino.html (accessed on 1 October 2024).
  30. Fullbrook, D. Food as security. Food Secur. 2010, 2, 5–20. [Google Scholar]
  31. Alexandratos, N.; Bruinsma, J. World Agriculture Towards 2030/2050: The 2012 Revision; FAO: Rome, Italy, 2012. [Google Scholar]
  32. Malhi, G.S.; Kaur, M.; Kaushik, P. Impact of climate change on agriculture and its mitigation strategies: A review. Sustainability 2021, 13, 1318. [Google Scholar] [CrossRef]
  33. Shahzad, A.; Ullah, S.; Dar, A.A.; Sardar, M.F.; Mehmood, T.; Tufail, M.A.; Haris, M. Nexus on climate change: Agriculture and possible solutions to cope with future climate change stresses. Environ. Sci. Pollut. Res. 2021, 28, 14211–14232. [Google Scholar]
  34. Nsabiyeze, A.; Ma, R.; Li, J.; Luo, H.; Zhao, Q.; Tomka, J.; Zhang, M. Tackling climate change in agriculture: A global evaluation of the effectiveness of carbon emission reduction policies. J. Clean. Prod. 2024, 468, 142973. [Google Scholar]
  35. Bibi, F.; Rahman, A. An overview of climate change impacts on agriculture and their mitigation strategies. Agriculture 2023, 13, 1508. [Google Scholar] [CrossRef]
  36. Shi, W.; Zhang, Q.; Xie, R.; Sheng, K.; Tan, J.; Wang, Y. Blending loss-control and normal urea maximizes nitrogen utilization of summer maize by mitigating ammonia volatilization and nitrate leaching. Plant Soil 2023, 490, 125–141. [Google Scholar]
  37. Miao, B.L.; Liu, Y.; Fan, Y.B.; Niu, X.J.; Jiang, X.Y.; Tang, Z. Optimization of Agricultural Resource Allocation among Crops: A Portfolio Model Analysis. Land 2023, 12, 1901. [Google Scholar] [CrossRef]
  38. Elia, A.E.; Conversa, G. A decision support system (GesCoN) for managing fertigation in open-field vegetable crops. Part I—Methodological approach and description of the software. Front. Plant Sci. 2015, 6, 319. [Google Scholar]
  39. Garofalo, P.; Parlavecchia, M.; Giglio, L.; Campobasso, I.; Ventrella, D. Developing a software for measuring carbon and water footprint of organic durum wheat cultivation systems: The Smart Future Organic Farming (SFOF) project. In Proceedings of the XXV National Agrometeorology Conference, Matera, Italy, 14–16 June 2023; pp. 100–103. [Google Scholar]
  40. Garofalo, P.; Cammerino, A.R.B. Modeling the performance of a continuous durum wheat cropping system in a Mediterranean environment: Carbon and water footprint at different sowing dates, under rainfed and irrigated water regimes. Agriculture 2025, 15, 259. [Google Scholar] [CrossRef]
  41. Mirás-Avalos, J.M.; Rubio-Asensio, J.S.; Ramírez-Cuesta, J.M.; Maestre-Valero, J.F.; Intrigliolo, D.S. Irrigation-Advisor—A decision support system for irrigation of vegetable crops. Water 2019, 11, 2245. [Google Scholar] [CrossRef]
  42. Urso, G.D.; Michele, C.D.; Bolognesi, S.F. IRRISAT: The Italian on-line satellite irrigation advisory service. In Proceedings of the EFITA-WCCA-CIGR Conference, Turin, Italy, 24–27 June 2013. [Google Scholar]
  43. Bonfante, A.; Monaco, E.; Manna, P.; De Mascellis, R.; Basile, A.; Buonanno, M.; Brook, A. LCIS DSS—An irrigation supporting system for water use efficiency improvement in precision agriculture: A maize case study. Agric. Syst. 2019, 176, 102646. [Google Scholar]
  44. Vanuytrecht, E.; Raes, D.; Steduto, P.; Hsiao, T.C.; Fereres, E.; Heng, L.K.; Vila, M.G.; Moreno, P.M. AquaCrop: FAO’s crop water productivity and yield response model. Environ. Model. Softw. 2014, 62, 351–360. [Google Scholar]
  45. Brisson, N.; Gary, C.; Justes, E.; Roche, R.; Mary, B.; Ripoche, D.; Sinoquet, H. An overview of the crop model STICS. Eur. J. Agron. 2003, 18, 309–332. [Google Scholar]
  46. Stöckle, C.O.; Kemanian, A.R.; Nelson, R.L.; Adam, J.C.; Sommer, R.; Carlson, B. CropSyst model evolution: From field to regional to global scales and from research to decision support systems. Environ. Model. Softw. 2014, 62, 361–369. [Google Scholar]
  47. Jones, J.W.; Hoogenboom, G.; Porter, C.H.; Boote, K.J.; Batchelor, W.D.; Hunt, L.A.; Ritchie, J.T. The DSSAT cropping system model. Eur. J. Agron. 2003, 18, 235–265. [Google Scholar]
  48. Zhang, C.; Xie, Z.; Wang, Q.; Tang, M.; Feng, S.; Cai, H. AquaCrop modeling to explore optimal irrigation of winter wheat for improving grain yield and water productivity. Agric. Water Manag. 2022, 266, 107580. [Google Scholar]
  49. Raes, D.; Fereres, E.; Vila, M.G.; Curnel, Y.; Knoden, D.; Çelik, S.K.; Wellens, J. Simulation of alfalfa yield with AquaCrop. Agric. Water Manag. 2023, 284, 108341. [Google Scholar]
  50. Fazel, F.; Ansari, H.; Aguilar, J. Determination of the most efficient forage sorghum irrigation scheduling strategies in the US Central High Plains using the AquaCrop model and field experiments. Agronomy 2023, 13, 2446. [Google Scholar] [CrossRef]
  51. Silva, L.; Conceição, L.A.; Lidon, F.C.; Patanita, M.; D’Antonio, P.; Fiorentino, C. Digitization of crop nitrogen modelling: A review. Agronomy 2023, 13, 1964. [Google Scholar] [CrossRef]
  52. Smith, M. CROPWAT: A Computer Program for Irrigation Planning and Management; FAO Irrigation and Drainage Paper No. 46; Food and Agriculture Organization: Rome, Italy, 1992. [Google Scholar]
  53. Garofalo, P.; Gaeta, L.; Vitti, C.; Giglio, L.; Leogrande, R. Optimizing water footprint, productivity, and sustainability in southern Italian olive groves: The role of organic fertilizers and irrigation management. Land 2025, 14, 318. [Google Scholar] [CrossRef]
  54. Naghdi, S.; Bozorg-Haddad, O.; Khorsandi, M.; Chu, X. Multi-objective optimization for allocation of surface water and groundwater resources. Sci. Total Environ. 2021, 776, 146026. [Google Scholar]
  55. Kaim, A.; Cord, A.F.; Volk, M. A review of multi-criteria optimization techniques for agricultural land use allocation. Environ. Model. Softw. 2018, 105, 79–93. [Google Scholar]
  56. Miettinen, K.; Mäkelä, M.M. On scalarizing functions in multiobjective optimization. OR Spectr. 2002, 24, 193–213. [Google Scholar]
  57. Memmah, M.M.; Lescourret, F.; Yao, X.; Lavigne, C. Metaheuristics for agricultural land use optimization: A review. Agron. Sustain. Dev. 2015, 35, 975–998. [Google Scholar]
  58. Whittaker, G.; Färe, R.; Grosskopf, S.; Barnhart, B.; Bostian, M.; Mueller-Warrant, G.; Griffith, S. Spatial targeting of agri-environmental policy using bilevel evolutionary optimization. Omega 2017, 66, 15–27. [Google Scholar]
  59. Du, J.; Liu, R.; Cheng, D.; Wang, X.; Zhang, T.; Yu, F. Enhancing NSGA-II algorithm through hybrid strategy for optimizing maize water and fertilizer irrigation simulation. Symmetry 2024, 16, 1062. [Google Scholar] [CrossRef]
Figure 1. Aggregated multi-objective index score (Imobj) in response to seasonal irrigation regimes for maize (a), sugar beet (b) and processing tomato (c), with k = 5 for all water-related parameters.
Sustainability 17 03030 g001
Figure 2. Aggregated multi-objective index score (Imobj) in response to seasonal irrigation regimes for maize (a), sugar beet (b) and processing tomato (c), with unbalanced k for the water-related parameters.
Sustainability 17 03030 g002
Table 1. Response of water-related parameters as a function of irrigation regimes simulated by AquaCrop from 2015 to 2020 for maize, sugar beet (Sbeet), and processing tomato (Tom). Standard deviations are reported in brackets. Sbeet stands for sugar beet and PTom stands for processing tomato. Means followed by different letters are significantly different at p < 0.05 according to Tukey’s honestly significant difference (HSD) test.
CropManIrr.Dry_yDrainageBlue_FPIUEWUENet_Inc
mmt ha−1mmmm t−1kg mm−1kg mm−1€ ha−1
MaizeIrr_1063 (±5) h8.84 (±1.60) d0.00 (±0.00) c7.13 (±1.02) h140.12 (±26.75) a22.01 (±1.61) a2693 (±499) d
Irr_20126 (±10) g10.66 (±1.51) c0.00 (±0.00) c11.84 (±1.60) g84.44 (±9.73) b22.68 (±1.34) a3163 (±466) cd
Irr_40252 (±19) f13.05 (±1.37) b0.00 (±0.00) c19.34 (±1.60) f51.71 (±4.68) c23.47 (±1.12) a3759 (±416) ab
Irr_60379 (±29) e14.58 (±0.50) ab0.00 (±0.00) c25.97 (±0.49) e38.51 (±0.75) cd23.80 (±0.86) a3997 (±138) a
Irr_80505 (±39) d14.67 (±0.34) a0.00 (±0.00) c34.42 (±0.34) d29.05 (±0.32) d23.71 (±0.79) a3787 (±73) ab
Full631 (±49) c14.62 (±0.35) a7.10 (±16.62) c43.15 (±0.62) c23.18 (±0.25) de23.81 (±0.82) a3404 (±197) bc
Sur_20757 (±59) b14.62 (±0.35) a83.13 (±70.94) b51.77 (±0.51) b19.32 (±0.20) de23.63 (±0.82) a3139 (±56) cd
Sur_40883 (±69) a14.62 (±0.35) a210.98 (±77.65) a60.42 (±0.60) a16.55 (±0.17) e23.64 (±0.82) a2820 (±48) d
SbeetIrr_1057 (±8) h8.96 (±1.51) c0.00 (±0.00) c6.35 (±0.80) h157.48 (±18.90) a22.58 (±2.85) a13570 (±2297) b
Irr_20114 (±15) g10.51 (±1.40) c0.67 (±0.82) c10.83 (±1.41) g92.38 (±19.14) b22.94 (±2.27) a15849 (±2129) b
Irr_40228 (±30) f12.58 (±0.97) b1.02 (±1.14) c18.09 (±1.54) f55.28 (±14.78) c22.99 (±1.57) a18851 (±1481) a
Irr_60341 (±45) e13.86 (±0.63) ab2.98 (±0.98) c24.64 (±1.32) e40.59 (±5.35) cd22.77 (±1.25) a20592 (±962) a
Irr_80455 (±60) d14.51 (±0.52) a3.07 (±0.69) c31.37 (±1.35) d31.88 (±2.39) cd22.27 (±1.16) a21368 (±785) a
Full569 (±75) c14.72 (±0.45) a3.52 (±2.81) c38.66 (±1.27) c25.87 (±1.38) d21.22 (±1.09) a21370 (±658) a
Sur_20683 (±90) b14.88 (±0.54) a133.70 (±22.34) b45.90 (±1.23) b21.79 (±0.87) d21.57 (±1.21) a21401 (±808) a
Sur_40797 (±105) a14.86 (±0.58) a293.55 (±50.13) a53.62 (±1.17) a18.65 (±0.79) d21.37 (±1.16) a21056 (±869) a
PTomIrr_1053 (±5) h2.86 (±0.82) d0.00 (±0.00) c14.45 (±3.93) g73.93 (±21.57) a9.76 (±1.38) d5788 (±1684) d
Irr_20106 (±10) g3.74 (±0.86) cd0.00 (±0.00) c32.36 (±7.26) f32.28 (±7.50) b10.36 (±1.30) cd7505 (±1763) cd
Irr_40211 (±19) f4.87 (±0.84) c0.00 (±0.00) c40.66 (±6.84) ef25.19 (±4.29) bc11.26 (±1.00) bc9716 (±1716) c
Irr_60317 (±29) e6.56 (±0.87) b2.27 (±0.94) c47.85 (±6.42) de21.20 (±2.73) bc12.43 (±0.99) ab12960 (±1775) b
Irr_80422 (±39) d7.59 (±0.59) ab4.92 (±1.86) c56.29 (±4.00) cd17.84 (±1.26) bc12.99 (±0.69) a14840 (±1188) ab
Full530 (±49) c8.06 (±0.20) a8.08 (±2.53) c65.58 (±3.38) c15.41 (±1.11) c13.19 (±0.62) a15557 (±506) a
Sur_20634 (±58) b8.06 (±0.21) a110.18 (±23.46) b76.81 (±2.17) b13.03 (±0.36) c13.02 (±0.63) a15333 (±398) ab
Sur_40739 (±68) a8.06 (±0.20) a185.67 (±37.92) a91.18 (±2.59) a10.97 (±0.31) c13.01 (±0.64) ab15060 (±393) ab
Table 2. Regressor values (βs), their corresponding p-values (α), and R-squared (R2) from the second-order regression analysis between seasonal irrigation volumes and the standardized examined variables.
CropVariableParameter
β0βiβiiR2α_β0α_βiα_βii
MaizeDry_Y−2.24−7.83 × 10−69.89 × 10−38.20 × 10−1000
Drainage6.72 × 10−28.63 × 10⁻⁶−5.45 × 10−37.90 × 10−17.29 × 10−100
Blue_FP−1.514.19 × 10−73.18 × 10−39.90 × 10−101.95 × 10⁻²⁰
IUE2.27.10 × 10−6−9.37 × 10−38.40 × 10−1000
WUE−9.22 × 10⁻¹−5.33 × 10−66.28 × 10−32.70 × 10−16.00 × 10−41.02 × 10−21.70 × 10−3
Net_Inc−1.55−1.00 × 10−51.14 × 10−26.40 × 10−1000
SbeetDry_Y−2.11−7.87 × 10−69.70 × 10−38.48 × 10−1000
Drainage−6.84 × 10−21.00 × 10−5−5.99 × 10−38.48 × 10−16.67 × 10−100
Blue_FP−1.564.82 × 10−93.95 × 10−39.90 × 10−109.84 × 10⁻¹⁰
IUE2.159.05 × 10−6−1.05 × 10−28.17 × 10−1000
WUE4.08 × 10−1−1.56 × 10⁻⁶−1.80 × 10−41.40 × 10−12.84 × 10−15.60 × 10−19.36 × 10⁻¹
Net_Inc−2.14−9.17 × 10−61.05 × 10−28.08 × 10−1000
PtomDry_Y−2.08−7.24 × 10−69.34 × 10−39.12 × 10−1000
Drainage−1.50 × 10−11.00 × 10−5−5.56 × 10−38.68 × 10−13.18 × 10−100
Blue_FP−1.54−1.47 × 10−74.23 × 10−39.40 × 10−108.52 × 10⁻¹⁰
IUE1.989.13 × 10−6−1.01 × 10−27.00 × 10−1000
WUE−1.88−7.83 × 10−69.12 × 10−36.70 × 10−1003.00 × 10−4
Net_Inc−2.12−8.26 × 10−61.00 × 10−28.90 × 10−1000
Table 3. Values of the parameters involved in Equations (6)–(9) and the synthetic judgment for the investigated variables in the processing tomato cropping system. Very strong, Strong, Moderate, Poor, and Not significant refer to the impact that irrigation has on the investigated variables.
CropVariableParameterJudgment
WRf0WRfiWRfiiWR_R2STViWVi
MaizeDry_Y1.001.001.001.003.071.00Very strong
Drainage0.001.001.000.750.60−0.11Not Significant
Blue_FP1.000.331.001.002.51−1.00Very strong
IUE1.001.001.001.003.051.00Very strong
WUE1.000.330.660.250.990.47Moderate
Net_Inc1.001.001.000.752.040.99Very strong
SbeetDry_Y1.001.001.001.002.961.00Very strong
Drainage0.001.001.001.000.85−0.30Poor
Blue_FP1.000.001.001.002.55−1.00Very strong
IUE1.001.001.001.002.971.00Very strong
WUE0.000.000.000.000.000.01Not significant
Net_Inc1.001.001.001.002.961.00Very strong
PtomDry_Y1.001.001.001.003.001.00Very strong
Drainage0.001.001.001.000.87−0.17Not significant
Blue_FP1.000.001.001.002.48−1.00Very strong
IUE1.001.001.000.752.521.00Very strong
WUE1.001.001.000.752.391.00Very strong
Net_Inc1.001.001.001.003.021.00Very strong
Table 4. Truth values of normalized index (TWi) for all water-related parameters of the three cropping systems in response to seasonal irrigation regimes.
CropIrrigationParameter
Dry_YDrainageBlue_FPIUEWUENet_Inc
Maize100−1.330.041.191.34−0.16−0.51
200−0.570.070.860.610.060.33
3000.030.080.520.030.220.96
4000.470.080.17−0.410.341.40
5000.750.05−0.18−0.710.411.64
6000.880.01−0.54−0.860.431.68
7000.85−0.05−0.92−0.880.401.52
8000.66−0.13−1.30−0.750.321.16
Sbeet100−1.220.171.161.190.00−1.18
200−0.480.260.760.420.00−0.41
3000.090.290.37−0.170.000.18
4000.510.26−0.03−0.590.000.59
5000.780.17−0.42−0.820.000.82
6000.880.02−0.82−0.870.000.86
7000.83−0.59−1.21−0.730.000.72
8000.62−0.46−1.61−0.420.000.40
Ptom100−1.220.101.121.06−1.04−1.20
200−0.500.150.700.33−0.37−0.45
3000.070.160.28−0.220.150.13
4000.500.13−0.13−0.580.510.56
5000.780.07−0.54−0.770.720.81
6000.92−0.02−0.94−0.770.770.90
7000.91−0.15−1.35−0.590.670.83
8000.76−0.31−1.75−0.230.400.59
Disclaimer/Publisher’s Note: The statements, opinions and data contained in all publications are solely those of the individual author(s) and contributor(s) and not of MDPI and/or the editor(s). MDPI and/or the editor(s) disclaim responsibility for any injury to people or property resulting from any ideas, methods, instructions or products referred to in the content.

