1. Introduction
The global shipping industry has grown significantly over the past several decades because of economic globalization, with the shipping industry accounting for more than 90% of global trade [
1]. However, the rapid growth of global trade has led to a significant increase in the number and size of seagoing ships, which, together with the higher density of waterway traffic flows, has led to a higher probability of marine vehicles being involved in waterway accidents [
2,
3,
4]. More frequent maritime accidents would, thus, result in tremendous economic and environmental damage to both marine vehicles and the marine environment [
5,
6,
7]. Although many safety-enhancing operations have been introduced into the modern shipping industry with the aim of improving the safety level and reducing potential risks, maritime accidents remain a major concern. For example, a disastrous marine accident, the Eastern Star ship sinking, caused more than 400 deaths in 2015 [
8]. In addition, oil and dangerous chemical cargo spill accidents from marine vehicles can have a catastrophic and long-term impact on marine ecosystems and local economies [
9,
10,
11]. A globally reported marine accident, the X-Press Pearl container ship accident, which occurred in May 2021, led to the leakage of more than 1680 tons of nurdles, the increased chemical complexity of which, caused by exposure to chemical substances and combustion, brought enormous challenges for subsequent damage assessments and environmental cleanup efforts [
12], indicating that even the leakage of non-dangerous cargo due to maritime accidents can pose a tremendous threat to the marine environment and ecosystems [
13]. Maritime accidents are usually caused by a combination of complex triggers that might ultimately lead to irreversible environmental, ecological, and economic damage and disastrous loss of human and marine life; thus, maritime safety is becoming an increasingly important concern for the shipping industry, maritime authorities, and the general public. The International Maritime Organization (IMO) has devoted efforts to improving waterway traffic safety through the promulgation of a plethora of maritime laws and regulations [
14,
15].
As an important means of global transportation, multiple risk factors associated with people, ships, the environment, and administration are usually intertwined during the operation of seagoing vehicles, and the combination of these potential risk elements might seriously threaten human lives, property, and the marine environment [
16,
17]. Today, the shipping industry exhibits high efficiency in communicating with the global trading network, yet marine waterway transportation is subjected to both internal and external risk factors, for instance, human-related operations and ocean wind/wave conditions. In addition, the conjunction of the potential risk factors mentioned above can exacerbate the challenges associated with marine transportation safety and maritime waterway management. As a consequence, the efficient evaluation and identification of potential waterway transportation risks, especially concerning the analysis and monitoring of the major contribution of different multiple risk factors to maritime accident-based environmental and economic loss severity, is becoming increasingly indispensable [
18]. Accurate and efficient marine-accident-induced economic loss and environmental impact analysis based on the complex and intricate potential risk factors can help the shipping industry and maritime administration to better grasp which underlying risk elements play a major role in accident-based environmental pollution, further helping environmental protection agencies efficiently identify accident triggers and pre-evaluate the extent of potential damage, enabling them to better take prompt measures to mitigate the effects [
19,
20]. Understanding which risk factors play a dominant role in marine-vehicle-based economic loss assists marine insurance companies in better evaluating the potential marine risks associated with the insurance policies involved so as to set appropriate insurance premiums [
21]. In addition, by predicting and identifying the likelihood of accidents and their associated costs, proactive measures can be taken by shipping companies to better mitigate potential hazards and reduce their exposure to economic losses’ severity [
22].
This study develops an interpretable machine learning framework to predict marine pollution severity and economic losses from maritime accidents while identifying dominant risk drivers, including ship characteristics, human/technical factors, and environmental conditions. Methodologically, it introduces three innovations: (1) a systematic triple-feature-filtering approach (importance ranking, correlation analysis, domain expertise) for robust variable selection; (2) an explainable ML framework leveraging SHAP to quantify the contributions of factors, for instance, ship length, crew size, and accident type; and (3) comparative benchmarking of eight ML models, identifying random forest as optimal for balancing accuracy and interpretability. The findings reveal that human/technical factors, for example, crew size and ship type, dominate over environmental drivers in escalating consequences, challenging traditional assumptions. The study also uncovers actionable thresholds that might amplify pollution risks and provides policy-ready insights for marine insurers (premium adjustments) and environmental agencies (emergency protocols). By bridging predictive analytics with decision-making transparency, this work advances both methodological rigor and practical relevance in maritime risk management.
This study aims to establish an interpretable machine learning (ML) framework for predicting marine pollution severity and economic losses caused by maritime accidents. By integrating a triple feature selection process and the comparative analysis of eight ML models, this research seeks to identify key risk factors—such as vessel characteristics (e.g., ship length, crew size), accident types, and environmental conditions (wind speed, air temperature)—that dominate accident consequences. The findings aim to empower environmental agencies with actionable insights for rapid pollution mitigation and provide insurers with data-driven risk assessment tools to refine policy pricing and damage evaluation.
The remainder of this study is organized as follows:
Section 2 is the literature review,
Section 3 presents the developed methodology with data collection and description,
Section 4 introduces the application and discusses the proposed method, and
Section 5 draws the conclusions.
2. Literature Review
Currently, maritime accident analysis-based studies are primarily focused on risk evaluation, statistical analysis, influencing mechanisms, and accident consequences. For instance, Jin [
19] utilized different machine learning models to evaluate oil tanker accident probabilities and established a risk assessment system by combining measurements of accident probabilities and consequences, greatly contributing to environmental protection. Liu [
2] proposed a Bayesian network model for identifying the potential risk factors of maritime accidents in Chinese coastal waters to provide comprehensive suggestions for maritime administrators. A data-driven marine risk methodology was established to implement casualty analysis of maritime accidents that occur under different operational conditions [
22]. This methodology updates risk factors to improve the accuracy of maritime casualty analysis. For sustainable development and environmental protection, Chen [
23] established an ensemble risk analysis model based on an aggregation of the fuzzy comprehensive evaluation method and analytic network process that can accurately quantify the underlying influence of oil spill accidents in the Arctic. A novel framework for accurately determining the severity of marine accident prediction is established using different machine learning approaches [
24] that effectively analyze the severity of marine accidents. It also emphasizes the promising perspective of employing artificial intelligence (AI) in marine safety assessment and accident reduction. However, most maritime-accident-based research studies primarily focus on potential multiple risk factor analysis for the prediction and identification of the probability of accident occurrence, with limited studies concerned with accident-induced environmental pollution and economic loss severity analysis. Accident-based consequence analysis, especially for marine environment pollution and economic loss analysis, plays an indispensable role in helping environmental protection agencies efficiently identify accident triggers and pre-evaluate the extent of the potential damage, enabling them to better take prompt measures to mitigate the pollution effect. It also assists marine insurance companies to better evaluate the potential marine risks associated with the involved insurance policies so as to set appropriate insurance premiums.
Identifying and evaluating the probability and consequences of maritime accidents is indispensable analysis focused on the safe, green, and intelligent development of the maritime industry [
25]. Employing machine learning in transportation research is becoming of great interest [
26]. A comprehensive accident evaluation system has been developed to analyze potential human factors involved in maritime accidents by utilizing fuzzy aggregation analysis and artificial intelligence methods [
27]. Fan [
28] proposed a Naive Bayesian model to identify the relationship between risk factors and accident types by employing different accident reports. Other studies focused on maritime hazard consequences, with the aim of predicting the potential severity of marine accidents provided an accident occurred in the presence of potential risk factors [
18]. For instance, Wang [
29] developed a risk analysis framework by using neural network and decision tree methods to assess potential risks to determine preventive actions for collision accidents, and Yang [
6] proposed an accident analysis model based on neural network and tree-based machine learning methods by using a geographic information system to determine the spatial distribution of maritime accidents. Fan [
30] proposed a novel object-oriented Bayesian network for evaluating the potential risk of traditional maritime accidents, identifying the major risk factors influencing accidents and further exploring the underlying nonlinear relationships between them. However, most of these maritime accident analysis studies utilized traditional machine learning methods, and traditional machine learning has potential shortcomings in model complexity, data processing capabilities, feature engineering, and other aspects. These drawbacks would limit its ability to handle complex data and provide transparent decision-making. In contrast, interpretable machine learning, by combining deep learning and explanatory approaches, not only improves the accuracy and efficiency of the model but also enhances its transparency and user trust [
31,
32,
33,
34].
A novel multi-scale geographically weighted regression (MGWR) method was employed to analyze the accident dataset from Fujian waters [
35], which contains the potential influences of different risk factors, including spatial heterogeneity, on maritime accident consequences. This study provided promising insights into appropriate measures and policies customized for different navigational waterways. An improved Bayesian network approach was proposed by employing the multiscale scenario analysis theory to assess the maritime safety of strait operation and maintenance. The maritime safety assessment method was developed based on the scenario analysis theory and knowledge element theory (KET) [
36]. Simulation results demonstrated that this proposed model can be utilized as a promising tool to handle the safety assessment of major infrastructure accidents. Although many research studies have focused on the probability of the occurrence of marine accidents, a novel framework was established to accurately estimate the severity of marine accidents. The Light Gradient-Boosting Machine (LightGBM) model was found to have better predictive performance compared with other models, leading to a new research direction employing artificial intelligence (AI) methods in maritime accident prevention and safety assessment tasks [
24]. Maritime accidents usually involve significant human casualties and economic losses. A data-driven framework was developed to analyze 198 different maritime accident reports from the Marine Accident Investigation Branch. It proved that accident type, ship type, ship age, and ship length are key risk factors for accident consequences [
37]. To enhance the accuracy of marine accident severity forecasting, the Integrated Feature Engineering and Balancing model was proposed [
38]. The findings showed that the IFEB can improve the average predictive performance; thus, it provides an effective predictive method for reducing the risk of marine accidents and enhancing maritime safety. Some representative maritime accidents are illustrated in
Figure 1.
In contrast to prior maritime accident studies, which prioritized environmental factors using descriptive statistics or opaque ML models, this research establishes three paradigm shifts: (1) quantitatively demonstrating human/technical factors as dominant drivers of the consequences, challenging conventional environmental determinism; (2) introducing the first explainable ML framework (SHAP + triple feature-filtering) to link factors such as ship length to specific risk escalations in an auditable manner, overcoming black box limitations of earlier ML studies; (3) replacing qualitative safety guidelines with data-driven thresholds (for instance wind speed > 22 knots increases losses). Key achievements include bridging model accuracy and interpretability, creating actionable protocols for insurers/policymakers, and enhancing the human–technology–environment interaction framework, collectively redefining causal hierarchies and decision-making rigor in maritime risk research.
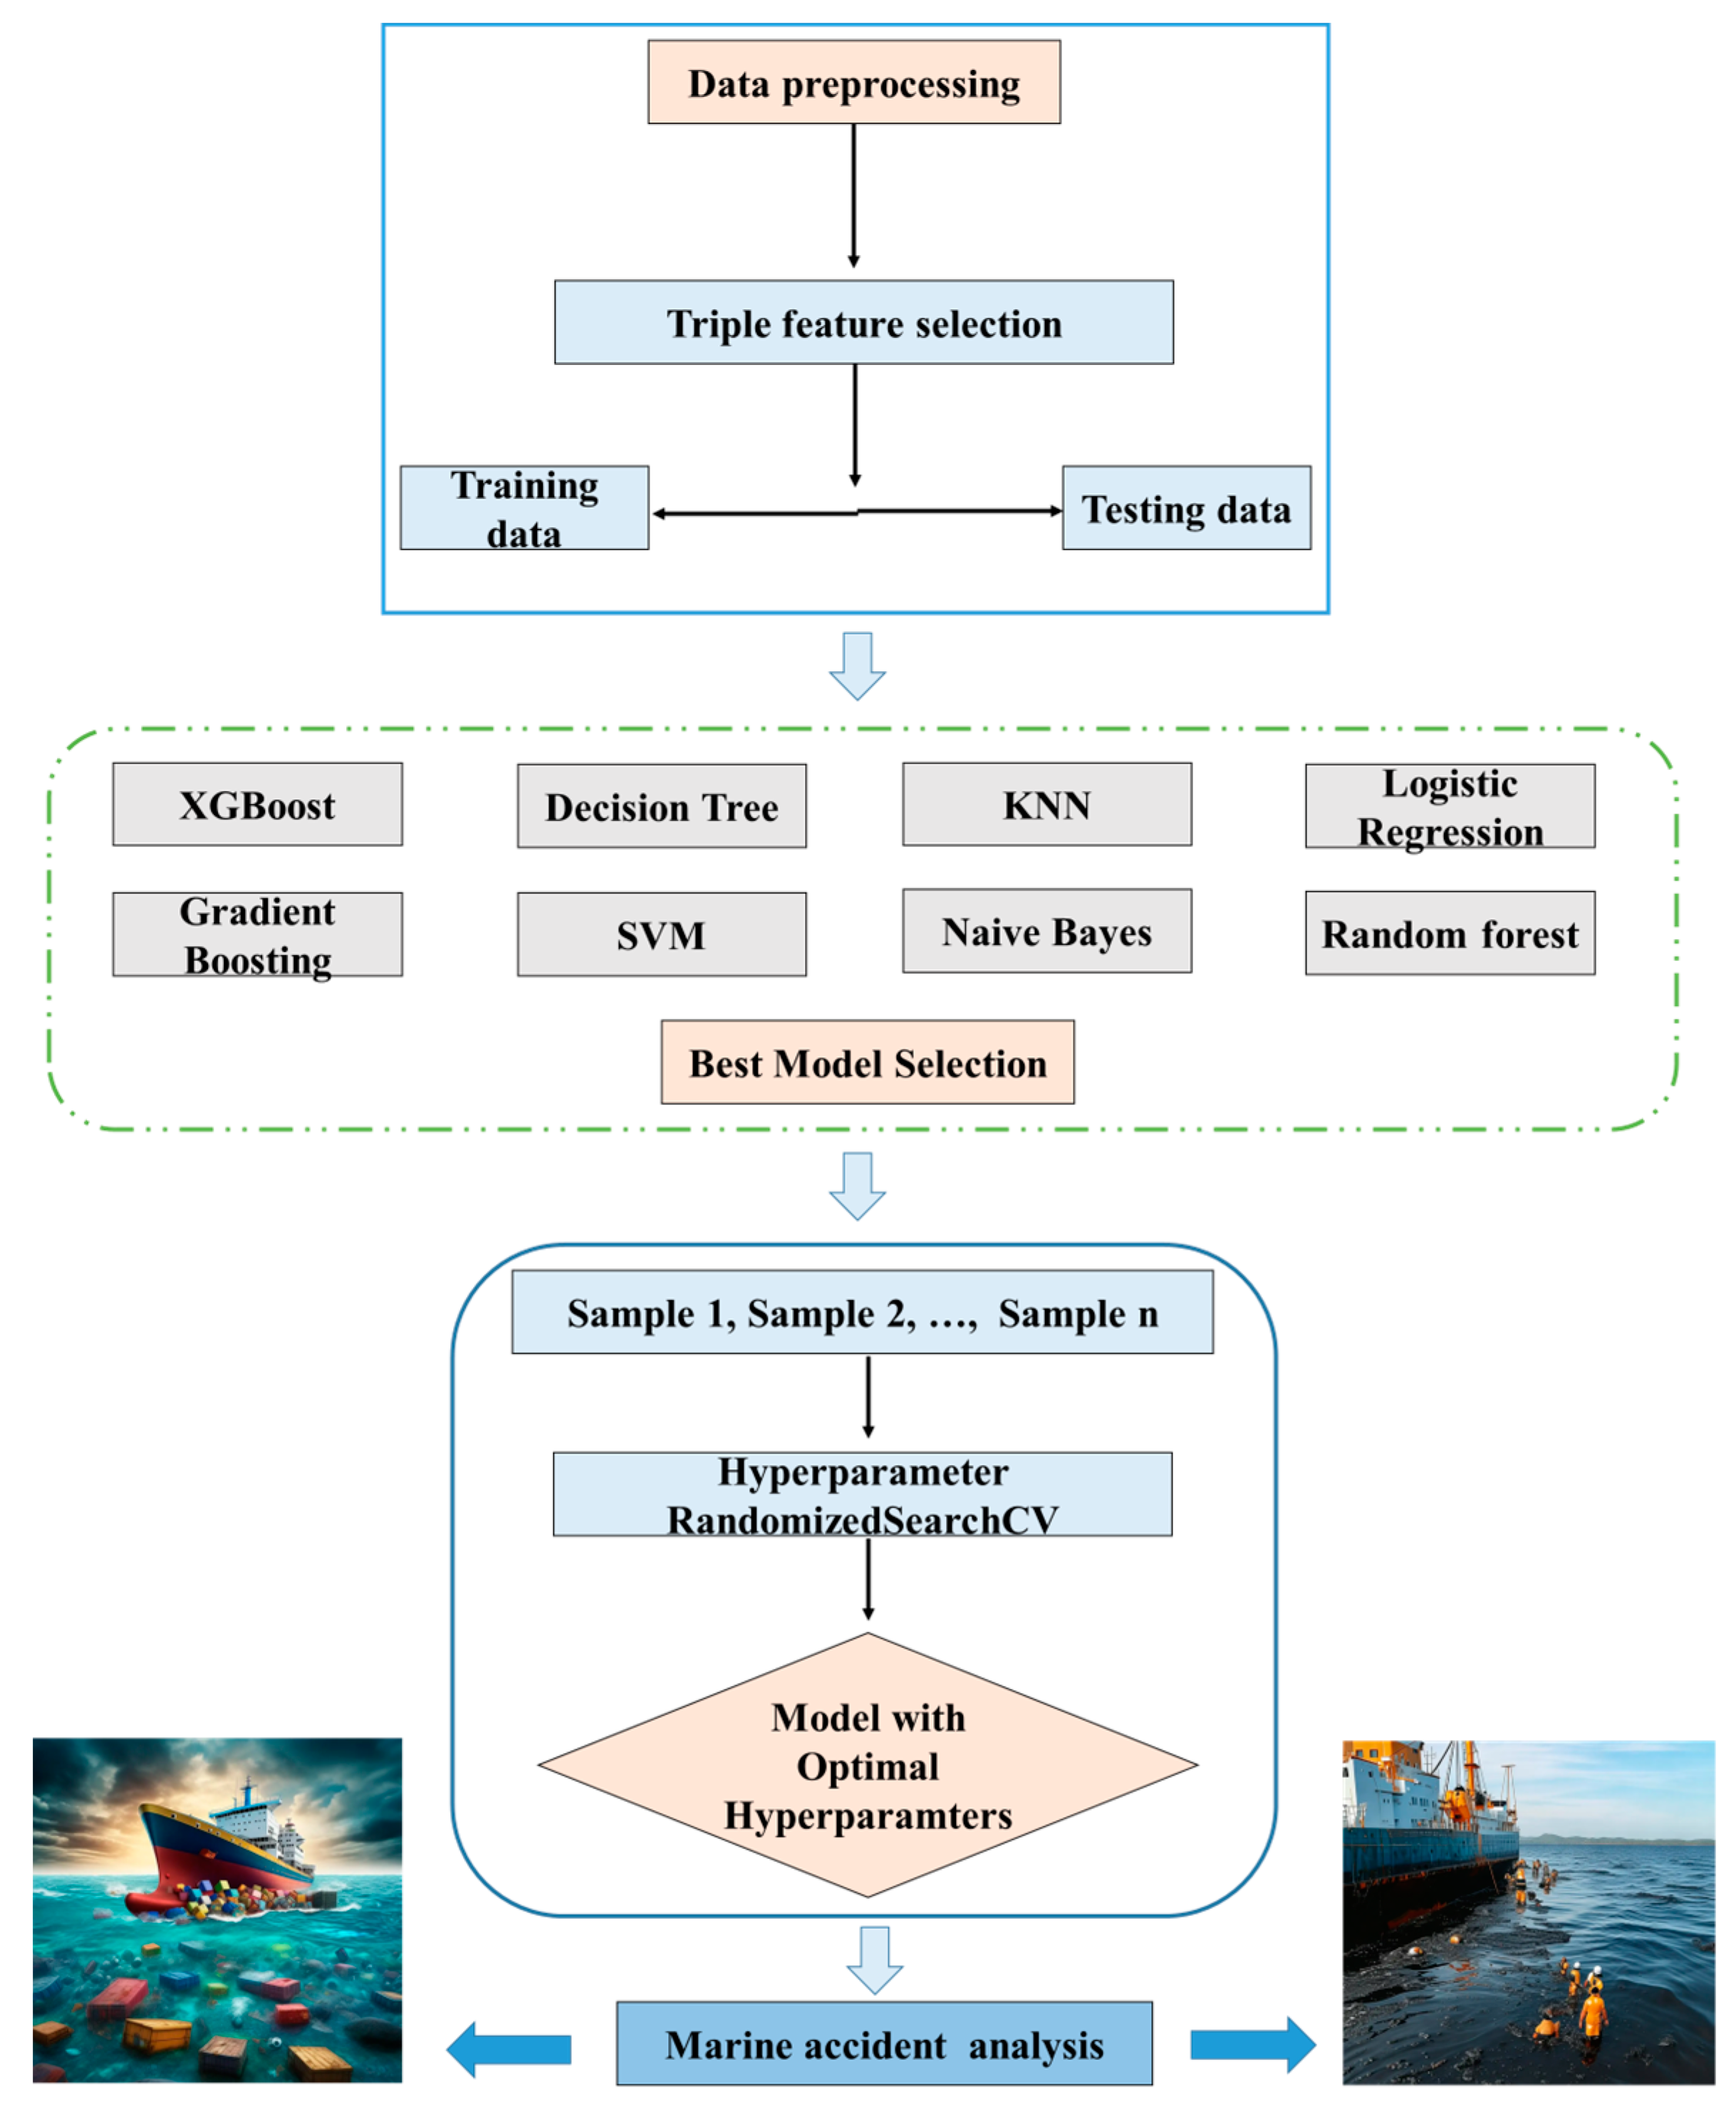
3. Methodology and Dataset
In this study, in order to fill the potential gaps in the aforementioned state-of-the-art literature review, real maritime accident reports were collected and analyzed using the established interpretable framework. The established model was constructed using 8 different machine learning models, and the original dataset was processed using a triple feature selection operation. The detailed dataset and model construction are as follows.
3.1. Dataset and Preprocessing
The dataset employed in this study contains 33 features: 21 numerical features and 12 categorical features. The features include ship attributes, accident types, weather attributes, human factors analysis, classification system, person on board, etc. A total of 595 maritime accident incidences were recorded. We then removed outlier, null, and missing features with less than 50% valid values; for instance, the cost facilities loss and rain state features had more than 50% missing values and were therefore excluded from the analysis. Descriptive statistical analysis of the attribute information was conducted to explore the risk-involved features of marine accidents. Finally, 249 valid records with 29 complete risk-involved features were retained, including 12 numerical features and 17 category features. To clearly illustrate the actual maritime accident dataset used in this study, representative data cases are presented in
Appendix A, with detailed data composition. The collected maritime accident data examples and accident information, including the ship attributes, accident types, weather attributes, human factors analysis, classification system, person on board, etc., are shown in detail in
Figure A1. It should be noted that the original maritime accident data reports were collected worldwide. This worldwide dataset can provide us with forecasting validation of the interpretable model generalization performance for different accidents in different waterways.
3.2. Maritime Accident Analysis
To explore the potential characteristics of maritime accidents, it is important to analyze the initial potential factors that trigger these accidents. Based on our filtered accident records, most of the maritime accidents occurred in the open-sea water regions (
Figure 2). There was also a considerable proportion of accidents in narrow waterways, such as gulfs and canals. The most common maritime accidents are fires or explosions and collisions, accounting for more than a quarter of the total number of accidents. Additional events, including foundering and hull failures and missing data, have been aggregated together under others, accounting for 16.9% of the data. Analysis of the types of shipping vessels involved in maritime accidents, as
Figure 2 displays, indicates that passenger vessels, cargo ships, and towing vessels have relatively high frequencies of accidents, accounting for more than 10% of all accidents, respectively. Fishing ships are involved in the highest quantity of accidents (29.5%), based on our collected dataset [
39]. Fishing ships are considered the riskiest vessel category [
18], which might explain why fishing ship-based accidents account for the highest proportion. It is important to note that, with the development of the shipping industry, the size and number of marine vehicles are greatly increasing, resulting in an obvious and growing frequency of accidents involving seagoing cargo ships [
15].
To investigate the potential impact of the external ocean environment on the severity of injuries, the distribution of accident-based injuries and deaths with respect to navigation visibility and wind speed was analyzed.
Figure 3 presents the results. For the visibility condition, the criterion was split into four categories: good indicates the navigation visibility is more than 5 nautical miles, moderate means the visibility is between 2 and 5 nautical miles, poor means the visibility is between 1 and 2 nautical miles, and less than 1 nautical mile denotes very poor or foggy visibility. Approximately 75% and 60% of persons/crewmembers onboard suffered deadly injuries when the navigation visibility condition was poor or very poor.
To analyze the distribution of deaths and injuries based on wind speed, we classified the wind speed criterion into two: marine accidents occurring during slight or moderate winds (between 0 and 22 knots) and maritime accidents occurring during severe sea states when the wind speed is over 22 knots. The results show that severe sea states with wind speeds exceeding 22 knots can cause much higher deaths (more than 80%), while wind speeds of less than 22 knots can result in 20% deaths and 80% injuries of the persons on board.
Figure 4 illustrates the annual number of deaths and injuries resulting from maritime accidents from 1985 to 2020. The results exhibit a temporal fluctuation, with a significant decrease in 2020, which can be attributed to the impact of the COVID-19 pandemic on the shipping industry (Maritime resilience during the COVID-19 pandemic: impacts and solutions). The number of accident-based deaths and injuries reduced with the decrease in maritime shipping activities.
Human factors play an important role in the occurrence of maritime traffic-related accidents. Since the predictability and interpretability of human behavior are relatively complicated, it is difficult to explore the human factors underlying maritime accidents. Although modern marine vehicles are equipped with advanced technologies, including bridge resource management systems and intelligent e-navigation technology, human-related factors remain a major contributor to the occurrence of incidences. Human failures/errors account for approximately 80% of recorded maritime accidents; thus, investigating human factors plays an indispensable role in accident prevention [
40]. Additionally, it is very important to summarize practical lessons from historical accidents in order to prevent future re-occurrence of similar incidents, events, or accidents in the shipping industry. Recommendations and strategies drawn from maritime accident analyses and investigations may also provide valuable insights into details of potential actions or decisions for stakeholders [
41,
42].
Using our collected marine accident records, we analyzed the cumulative occurrence of human factors (HFACS) in maritime accidents, including the contribution of general human factors to total incidents, grounding incidents, fire and explosion incidents, and collision incidents (
Table 1,
Table 2,
Table 3 and
Table 4, respectively).
The HFACS-MA in
Table 1 denotes human-factor-related management. Concerning the impact of general human and organizational factors on maritime accident occurrence, HFACS-MA-22 and HFACS-MA-5 had the highest involvement in triggering accidents. MA-5 refers to comprehensive assessment and management of ship status, and MA-22 stands for operational and judgmental decision errors of onboard crewmembers. The other abbreviations in the subsequent tables are defined in the collected dataset sources.
The HFACS-Ground in
Table 2 represents human factors involved in grounding accidents.
Table 2 shows that grounding accidents are mainly caused by Ground-2, which is the judgment decisions of crewmembers, and Ground-20, which stands for navigation resource management.
The HFACS-MSS in
Table 3 is human-factor-related ship machinery accidents. The MSS-5 factor, which stands for availability and reliability of equipment and facility resources, is the dominant cause of fire and explosion incidents. MSS-17, which stands for technological environment, also plays an important role in triggering this type of maritime accident.
The HFACS-Coll in
Table 4 denotes human-factor-related collision accidents. The statistical data in
Table 4 demonstrate that ship collision accidents are primarily caused by human-related decision errors. Inappropriate maneuvering actions also contribute to a major part of shipping collision incidents.
Shipping industry accidents usually occur as an interactive chain of events, and the potential subsequent risk factors usually require a long period of time to aggregate. As a consequence, better perception and accurate awareness of the accident-associated risk factors and their occurrence is the best way to ensure improved sustainable maritime safety. Statistical analysis of the collected maritime accident records in this study showed that human-related decisions and judgment errors are the main contributors to maritime accidents. However, the fact that the human element exhibits a complicated socio-technical structure makes it challenging to fully explore the underlying human factors associated with accidents [
43,
44]. Thus, in this study, we concentrate mainly on subjective risk factor analysis and investigate the potential impact of maritime accident-involved subjective factors, focusing specifically on its impacts in relation to environmental and economic loss severity exploration.
3.3. Triple Feature Selections
Different underlying risk factors that have intricate interrelationships play an important role in the occurrence of maritime accidents, and the variability of different risk-involved features could have different consequences. As a result, it is important to establish a more comprehensive feature selection framework that can explore the interactions between different features and determine the contributions of their different states. In order to better preprocess the recorded risk-associated factors and select the features that are most correlated with the occurrence of accidents, we developed a triple feature processing step that could reduce the potential interaction between different features and address the challenges associated with the relationships between features and desired targets [
24].
The three-step feature selection framework was implemented to optimize predictors for environmental pollution and economic loss severity modeling. Firstly, categorical features were filtered using the Chi-square independence test to retain only variables (e.g., industrial sectors, regulatory status) with statistically significant associations (p < 0.05) with pollution occurrence or loss severity. Subsequently, a correlation-based heatmap identified and mitigated multi-collinearity between numerical features (e.g., pollutant concentrations, economic metrics), removing redundant variables (pairwise |r| ≥ 0.8) or combining them into composite indices. Finally, a random forest model quantified feature importance via Gini and permutation metrics, prioritizing predictors (e.g., high-impact emissions, GDP-linked factors) that robustly improved predictive accuracy. This hierarchical approach ensured statistical rigor, reduced dimensionality, and enhanced interpretability by retaining only non-redundant, high-signal features critical to environmental and economic outcomes.
3.3.1. Chi-Square Test
The Chi-square criterion is established according to whether the difference between expected frequencies (E) and observed frequencies (O) is statistically significant [
45]. The underlying characteristics of the aggregated dataset and its specific requirements are usually taken into consideration in order to set the statistical approach to be utilized in the Chi-square methodology. Three different types of Chi-square tests are well established and commonly employed in statistical feature preprocessing: independence test, homogeneity test, and good fit test. The Chi-square independence test is usually utilized to explore whether a statistically significant relationship exists between different variables. One of the main benefits of the Chi-square independence test is that both numerical and categorical data can be processed within its framework [
35]. Thus, the Chi-square independence test is employed in this study to analyze the maritime accident data records with category features in order to better reveal the relationship between different potential risk factors and accident-induced environmental pollution/economic loss severity.
Before applying the Chi-square independence test, we set two general hypotheses [
46]: null hypothesis H0: the recorded feature has no significant relationship with environmental pollution/economic loss severity (these variables are independent); alternative hypothesis Ha: the recorded feature has a significant relationship with environmental pollution/economic loss severity (these variables are dependent). If the derived
p-value is smaller than 0.05 or 5%, we reject the H0 and accept the Ha, and if the calculated
p-value is larger than 0.05 or 5%, we accept the H0 and reject the Ha. The computed
p-values for both accident-based environmental pollution and economic loss severity are shown in
Table 5 and
Table 6.
The Chi-square independence test was employed to validate the presence or absence of a relationship between different category-related features and the occurrence of environmental pollution/economic loss severity. The results of the Chi-square test in
Table 5 indicate that accident type, ship type, and location are dependent on environmental pollution. Similarly, based on the results of the Chi-square test for risk-involved feature contributions to accident-based economic loss severity (
Table 6), we can conclude that the accident-based economic loss severity has similar dependent risk-involved features.
3.3.2. Correlation Heat Map
By revealing high correlations between different variables, the correlation-based heat map can help identify potential multi-collinearity between different factors, which is very useful for the removal or combination of underlying variables. Thus, the correlation-matrix-based heat map was employed in this study as the second feature selection step to remove underlying multi-collinearity in the numerical data records.
The correlation heat map in
Figure 5 shows highly correlated features (with correlation values greater than 0.8), including crew members, passengers, and persons onboard. In statistical analysis, highly correlated features should be removed to avoid mapping issues such as multi-collinearity, which could distort the results and make it difficult to determine the individual effects of each feature on the response variable because of them intertwining. Two or more highly correlated features would provide redundant information, leading to unstable estimates of model parameters and increased standard errors. In addition, including highly correlated factors may cause model overfitting, making the statistical model perform well on the training data but generate poor results on a testing dataset with unseen patterns. Removing these highly correlated features helps to develop a more precise machine learning model with reduced computational complexity and improves its generalizability and predictive performance [
47]. Thus, the crew members and passenger features should be dropped from the raw accident records.
3.3.3. Feature Importance Analysis Based on Random Forecast
In statistical analysis, feature importance can be evaluated using various methodologies [
48]. For instance, the random forest model can automatically derive feature importance values. The importance of each feature was analyzed using the random forest method. The importance ranking plot displayed in
Figure 6 illustrates the classification performance of the model based on different risk factors. As shown in
Figure 6, potential accident-involved features with importance values of less than 0.05 were removed to realize a more accurate classification model. However, one should note that feature importance is different from feature contribution, which usually reflects the category of features with the largest contribution to model performance. Feature contributions can provide an intuitive explanation for the desired target output beyond the identification of potential risk factors.
Based on the developed triple feature selection step, we aggregated seven and nine features as the model input variables for the potential environmental pollution and economic loss severity analysis, respectively.
3.4. Machine Learning Model
A total of eight different machine learning approaches—gradient boosting (XGBoost), decision tree, K-nearest neighbor (KNN), logistic regression, gradient boosting, support vector machine (SVM), naïve Bayes, and random forest—are evaluated with respect to the prediction performance. The performance of the models for environmental pollution and economic loss severity prediction is illustrated in
Table 7 and
Table 8, respectively.
Figure 7 shows the flowchart of the developed approach, which consists of different modules, such as data preprocessing, model prediction and evaluation, data classification, and model interpretation.
3.4.1. Evaluation Metrics
Two commonly employed assessment metrics are selected in this study to evaluate the prediction performance of different baseline models: the F1-measure (F1 score) and the area under the curve (AUC). Both datasets implement a fivefold cross-validation to derive the average of these evaluation metrics for better model performance comparison. Data samples are divided into four parts after completing a prediction task: false positive (
FP), true positive (
TP), false negative (
FN), or true negative (
TN). In this study, precision as an indicator classification is employed to assess the predictive performance of the machine learning model.
Precision is calculated using the formula below:
Recall denotes the accuracy of the positive dataset and indicates that positive classes are labeled accurately and is calculated using the formula below:
The
F1-score is the harmonic mean of the recall and precision metrics and is utilized to evaluate the classification model’s precision using the formula below:
The AUC (area under the curve) is also an assignment metric that calculates the area under the receiver operating characteristic (ROC) curve. The AUC indicator was derived using ROC graph analysis, and the ROC plot was then obtained by showing all possible true and false positive rates with the targeted threshold (use of the area under the ROC curve in the evaluation of machine learning algorithms). The true positive rate (
TPR) and false positive rate (
FPR) are computed as follows:
The AUC value varies from 0 to 1; a value greater than 0.8 indicates good model performance [
49,
50].
At each model training and testing step, the machine learning models established are trained using fivefold cross-validation, and the accuracies of the different models are compared for quantitative evaluation of their performance. The optimal machine learning algorithm is determined based on the derived prediction results. Then, a comparison analysis is implemented to explore different types of machine learning methods on the prediction accuracy. As shown in
Table 7 and
Table 8, the random forest model performs best in both the environmental pollution and economic loss severity classification tasks.
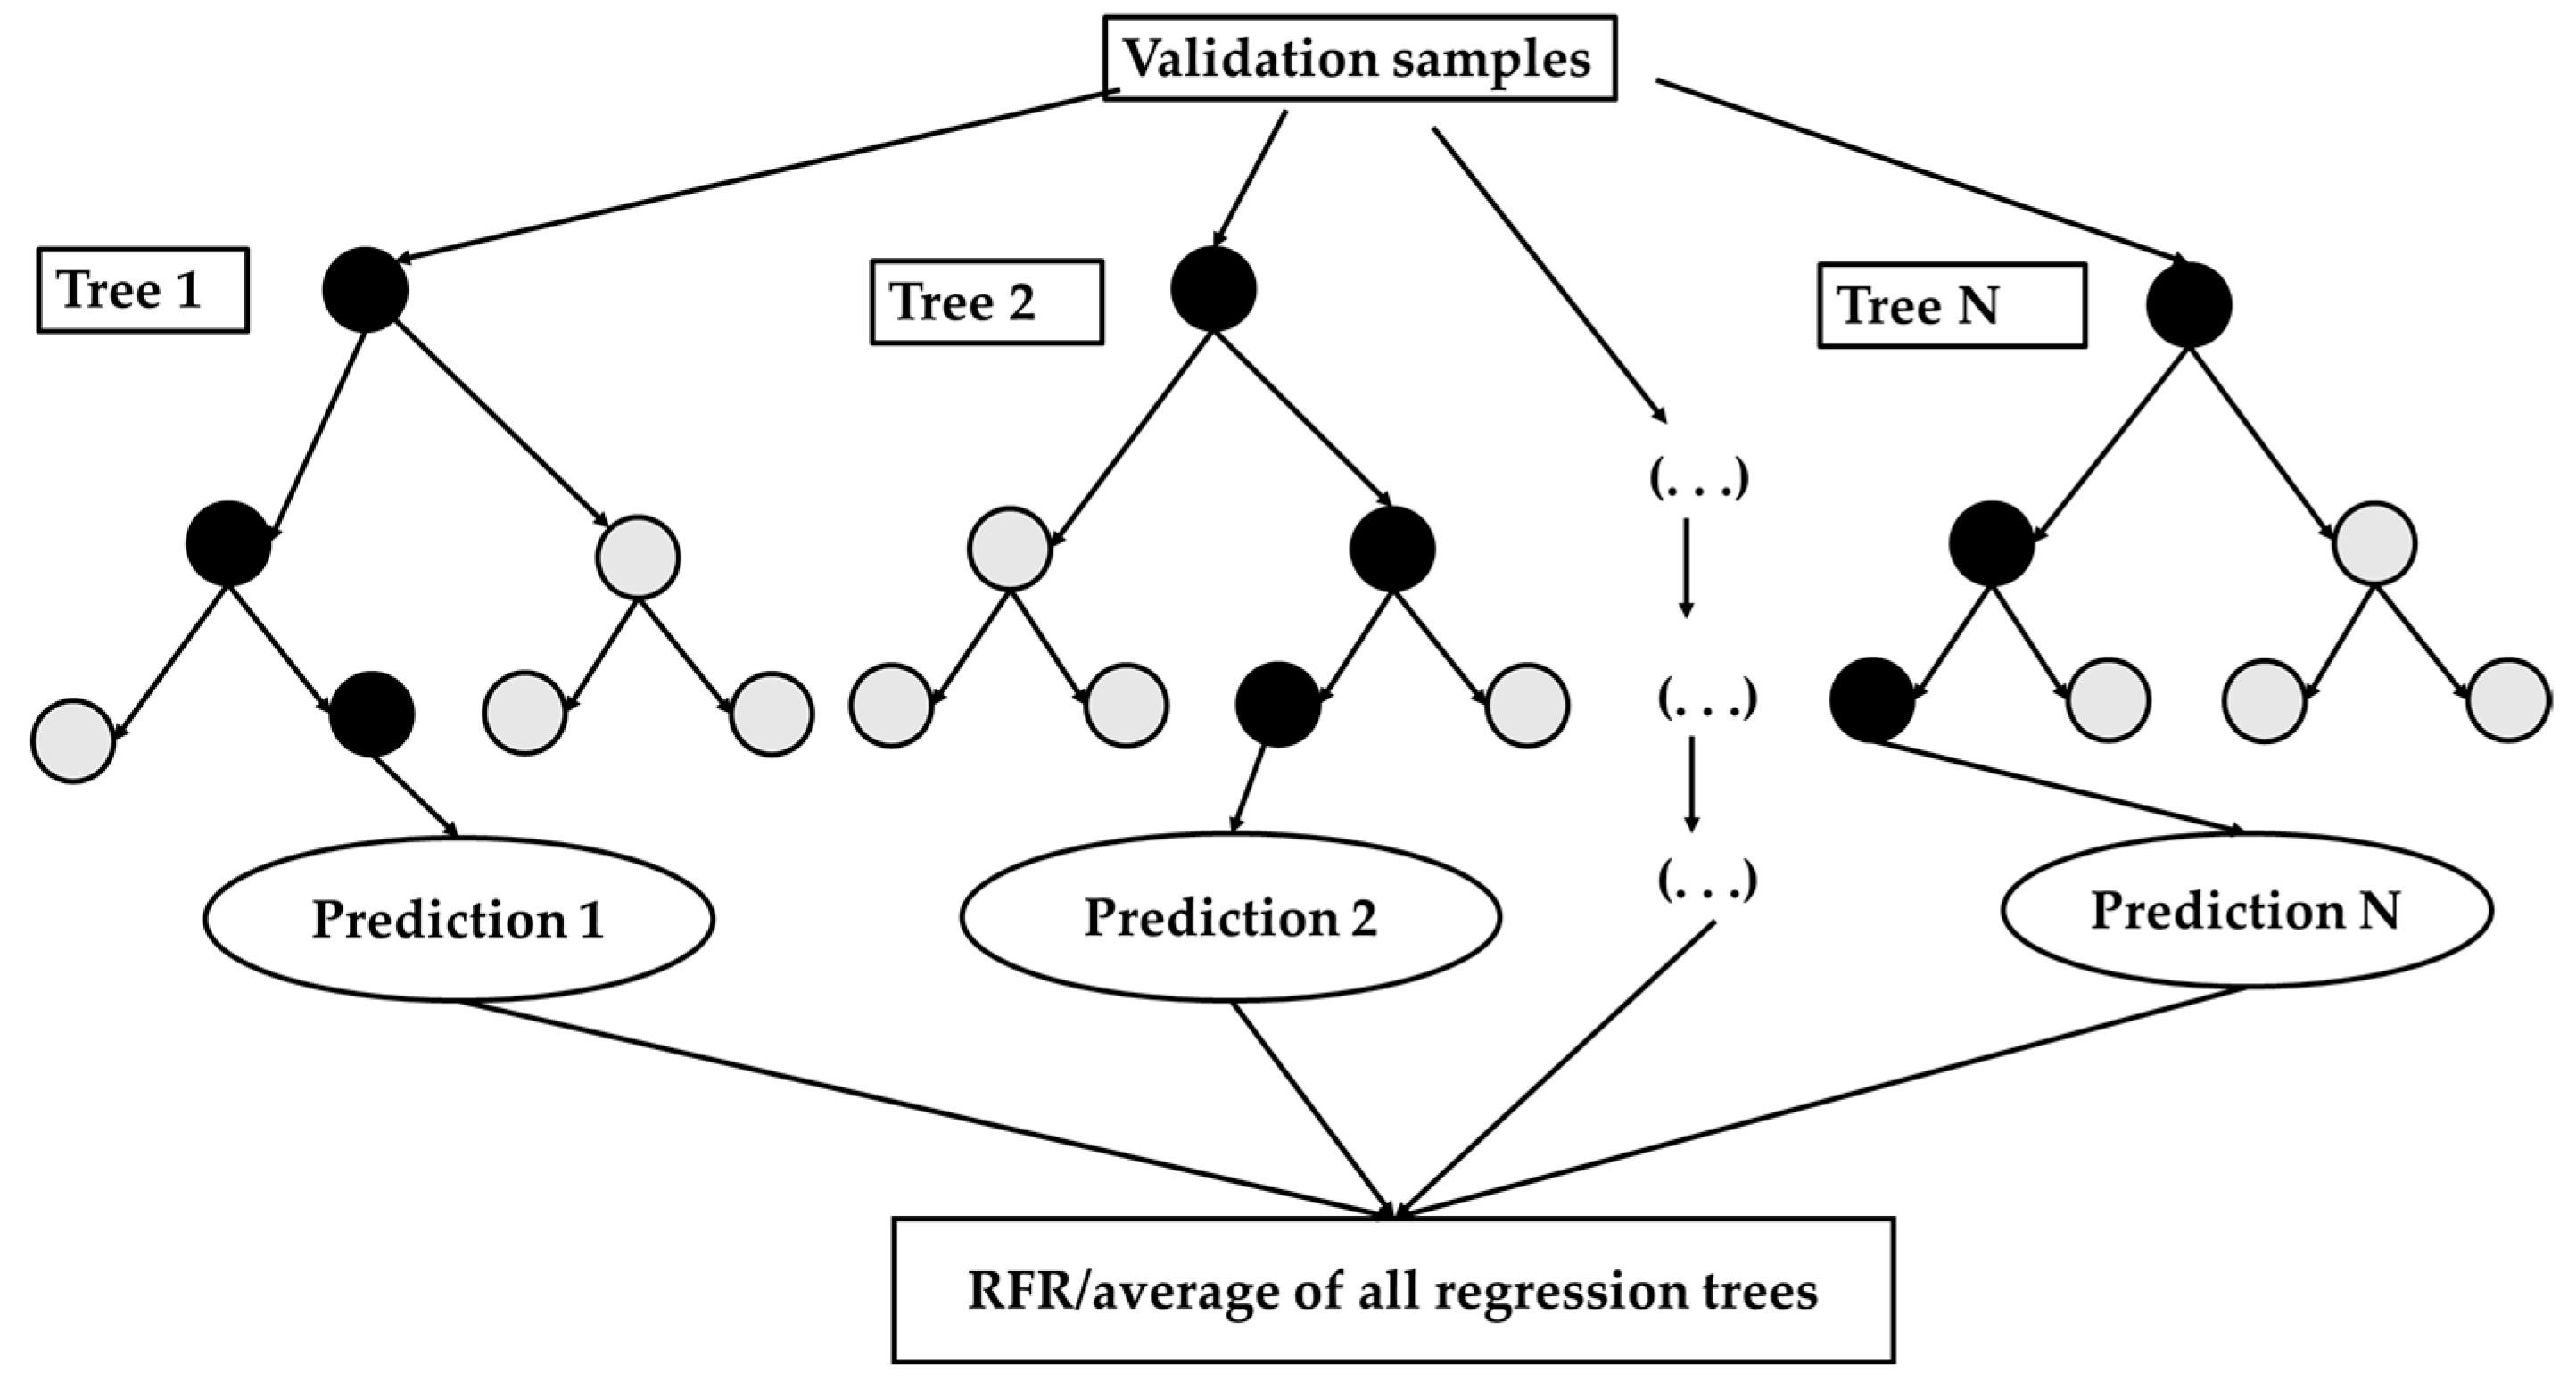
3.4.2. Random Forest
Figure 8 displays the schematic framework of the random forest model. The random forest method is aggregated on the basis of decision tree models, employing a majority of vote approaches to realize classification tasks [
51]. The bagging algorithm is implemented within the random forest model to generate training data for each decision tree via a sampling operation. By using the bootstrap sampling operation, data sample subsets of the
N nodes are released from the complete S sample dataset. The
N value indicates a random decision tree node, and the corresponding derived values are aggregated from the bagging framework.
where the
ith decision tree node
ϕn(
x) is built by using a random sample subset
Si, and the random forest model is aggregated via the independent construction of several parallel
N base trees. The conditional probability of the
kth class of
X is identified as follows:
3.4.3. Hyperparameter Setting Using RandomizedSearchCV
Hyperparameter optimization aims to search for the optimal combination of model parameters that will realize the best performance on testing data samples. In this study, the optimal random forest hyperparameter is obtained by specifying certain values and applying the RandomizedSearchCV algorithm. Specific hyperparameters include the maximum depth of decision tree (max_ depth), number of decision trees (n_estimators), minimum samples of splits (min_samples_split), and minimum samples of leaf nodes (min_samples_leaf). Compared with the GridSearchCV method, the random search can derive near-optimal hyperparameter combinations using fewer iterations based on random sampling operations [
52]. The optimal performance is achieved when the n_estimators are set to 100, min_samples_split is set to 2, min_samples_leaf is set to 1, and max_depth is set to 6.
Table 9 displays the tuning parameters based on the RandomizedSearchCV method.
However, machine learning approaches are inherently black box approaches that cannot explain which category of input features makes the largest contribution to model performance. To better understand the machine learning process, the interpretable machine learning framework SHapley Additive exPlanation (SHAP) is adopted to explain the results of the selected random forest machine learning algorithm.
3.5. Interpretable Machine Learning Framework SHAP
Entropy-based information gain and the Gini index are usually employed in random forest to determine the optimal state in the classification task; thus, information concerning how different features contribute to the average error decrease can be obtained. The data aggregated from all tree nodes reflect the measurement of feature importance. However, feature importance ranking derived from the error information is insufficient for interpreting individual estimations [
53], which means that the contribution of each maritime accident-involved feature to the derived output is unidentified; for instance, the underlying indicators that may increase environmental pollution are not known. Therefore, the SHAP model is introduced to determine the types of features that contribute most and how these contributions affect the occurrence of environmental pollution and economic loss. Ribeiro [
54] successfully combined a forecasting model f with an interpretable model g employing a local methodology. An additive feature contribution approach with linear function explanatory g for binary features was further defined as follows [
55]:
where
g() indicates a linear mapping of binary variables,
z′ is the observed or undefined variables,
M represents the number of filtered input variables, and the contribution of each feature is represented by
gi. Shapely values derived from the SHAP model can satisfy the local accuracy, consistency, and missingness characteristics—three characteristics that the additive feature attribution exhibits which are most consistent with human intuition [
56].
In order to explore and quantify the potential contribution of a specific feature to the classification method,
fS and
fS∪{i} are established. For a specific input variable
Xs, the impact of this feature on the classification model can be derived based on the established
fS and
fS∪{i}. The Shapely value, calculated as the weighted average of all potential discrepancies, represents the specific contribution of each feature, and is as follows:
where
f indicates the prediction model,
S is the set of all involved features without
i, and
F represents all features.
Compared with other interpretable approaches, such as the partial dependence plot (PDP), local interpretable model-agnostic explanation (LIME), and individual conditional expectation (ICE), the interpretable SHAP framework aims to provide a better direction to finding answers with respect to how predictions are realized by the applied methodologies; for instance, it can determine the type of input features that contribute to the desired output, and the most important characteristics in the prediction task [
57,
58].
The accident-based classification model was constructed using the random forest algorithm, considering various involved features such as ship length, persons onboard, and environmental factors together with accident and ship type. In addition, the SHAP methodology was implemented on the trained random forest model to resolve the combined effect of feature variables on environmental pollution and economic loss classification prediction.
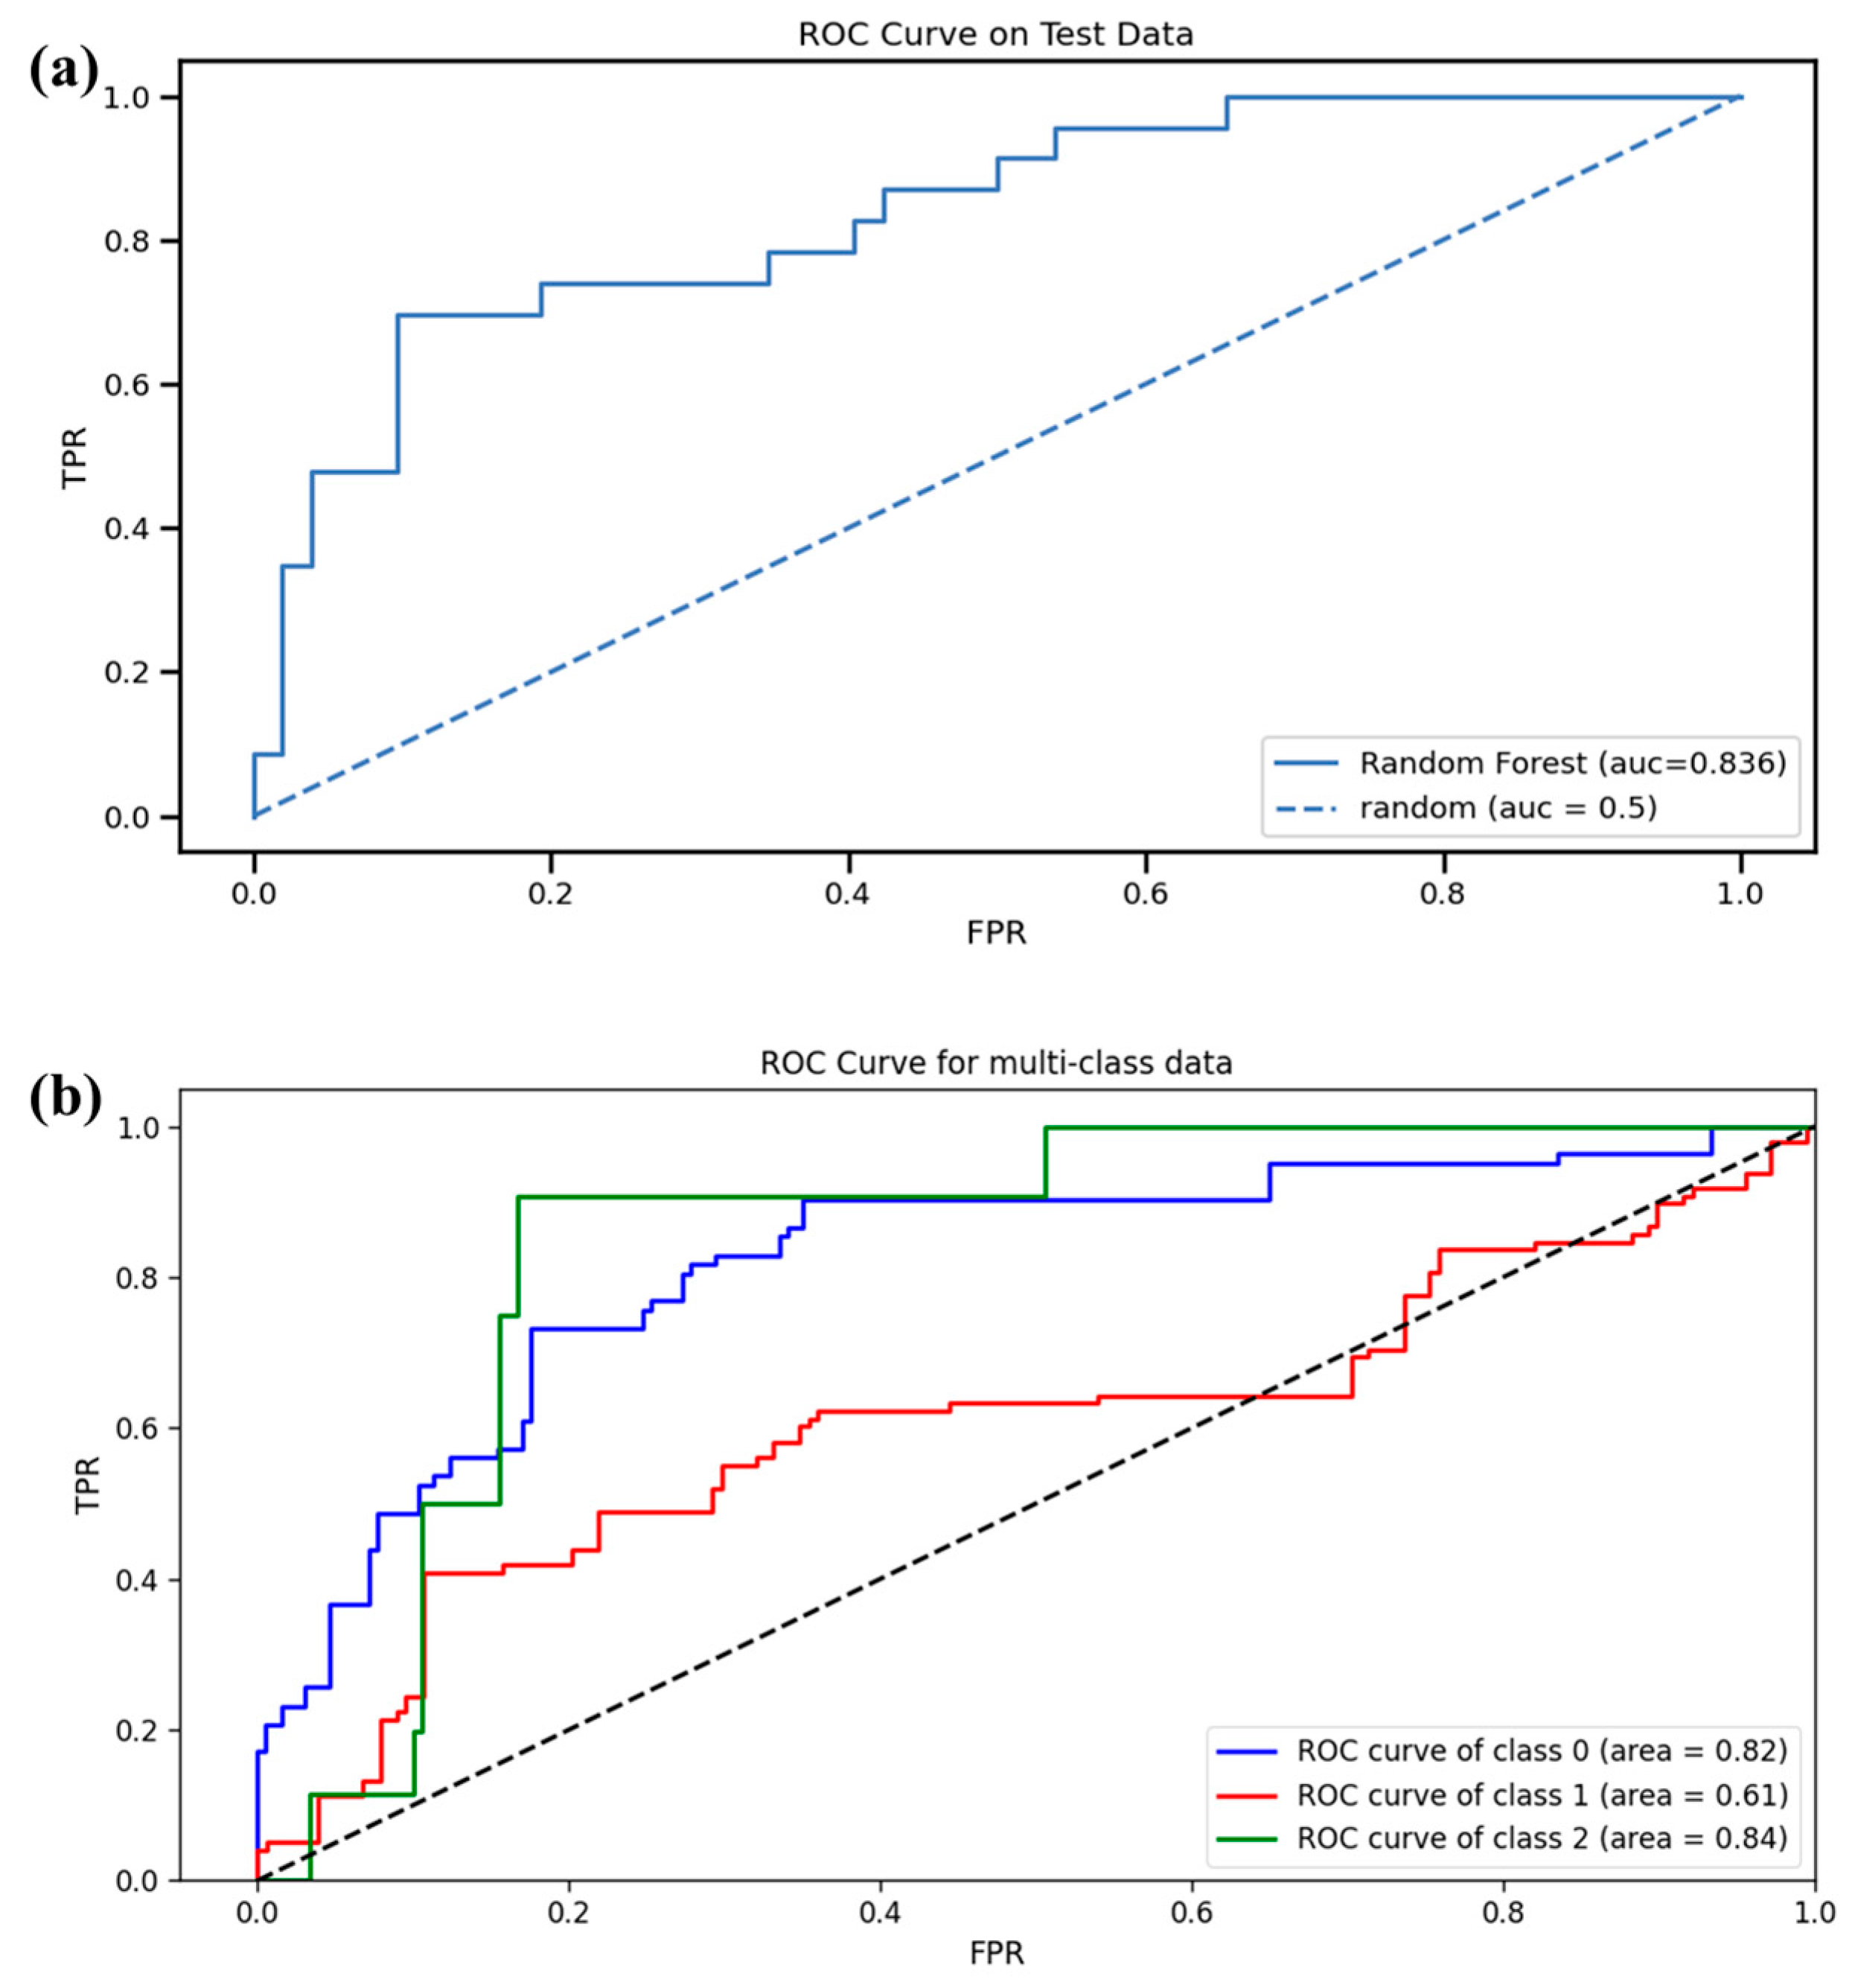
4. Results and Discussion
4.1. Feature Contributions to Environmental Pollution and Economic Loss
The target categories of binary classification of maritime accident-induced environmental pollution and multiple classifications of accident-based economic loss severity are displayed in
Figure 9. Specifically, we split the economic loss severity class into three categories, low, moderate, and high, as shown in
Figure 9b.
Figure 9a indicates if the accident caused marine pollution in a binary classification perspective.
The ROC plots for environmental pollution (a) and economic loss severity (b) classification tasks, which were produced based on TPR and FPR metrics, are illustrated in
Figure 10. The AUC value for accident-based environmental pollution is 0.836. For economic loss severity classification, three categories are obtained: the blue line denotes low, the red line denotes moderate, and the green line denotes high economic loss severity. The AUC values are 0.82, 0.61, and 0.84 for low, moderate, and high severities of economic damage, respectively. Thus, it was confirmed that the random forest model can provide promising environmental and property damage predictions based on the collected accident-involved features.
Based on the random-forest-derived feature importance in
Figure 6, four accident-involved features—ship length, persons onboard, economic impact of damage on vessel (EID on vessel), and air temperature—have the highest importance scores for environmental impact, while air temperature, wind speed, ship length, and persons onboard have the highest importance scores for economic loss. We also reached a common consensus; the more serious the maritime accident, the greater the losses incurred. In addition, factors external to the marine environment, including air temperature, wind speed, and visibility, also make a certain contribution to both environmental pollution and the severity of economic losses since bad weather conditions would certainly increase the possibility and severity of maritime accidents. However, the Gini index-calculated result could not determine how much each feature contributes to the specific output [
59]. Compared with the feature importance characterized using the random forest model, the interpretable SHAP model derives the underlying contribution of different input features to the specific target: the contribution can be positive or negative. The contributions of different accident-involved features to the target model output can be ranked and visualized using the SHAP values.
Figure 11a displays the mean SHAP value plot of environmental pollution-associated risk indicators and ranks the importance of different features to the desired target. It illustrates that the most important accident-involved feature in environmental pollution is persons onboard (note that the person onboard feature includes the passengers and crewmembers onboard), which might indicate that crewmembers onboard vessels have different vocational skills, such as proficiency in maneuverability, safety and environmental awareness, emergency response capability, and teamwork ability. More importantly, the more people onboard usually indicates a more complex management environment. The ship type and accident type also play important roles in environmental pollution accidents. For instance, collision or grounding incidents of oil tankers or dangerous chemical vessels will lead to varying levels of marine environment pollution. For accident-based economic loss impact,
Figure 11b illustrates that ship length ranks as the most important indicator, which might indicate that maritime accidents involving larger, longer ships would lead to more severe economic damage because the costs of large vessels are usually much higher.
Figure 12 shows SHAP summary plots of top-ranked accident-involved features for environmental pollution (a) and economic loss severity (b) prediction. A positive SHAP value means a positive driving force for increasing the possibility of accident-based pollution and economic losses. The derived SHAP values can be employed to investigate the detailed contribution of each risk factor to the model output target. The larger the absolute SHAP value, the greater the effect of the risk factor on the classification target. Note that the red and blue colored bars in
Figure 12 indicate the high and low impacts of individual features on the prediction task. For instance, a negative blue value for persons onboard in
Figure 12a represents a low possibility of accident-based pollution, and a positive red SHAP value for ship type indicates a high possibility of accident-based pollution.
As shown in
Figure 12, for accident-induced environmental pollution, ship type and accident type have the most positive contributions; the large positive EID on vessel, wind speed, and air temperature also have great impacts on marine environment pollution, while the persons onboard factor, with the larger negative SHAP values, indicates that this factor has a major negative impact on environmental pollution. The accident-based economic loss severity forecast shows larger SHAP values for wind speed, visibility, and ship length, indicating that they make the greatest contributions to the severity of property damage. The larger negative SHAP value for persons onboard indicates that fewer persons onboard will reduce the chances of severe economic losses. It should be noted that even a small amount of chemical or crude oil leakage could result in inestimable environmental pollution and economic damage [
12].
4.2. Accident-Based Risk Factor Contributions to Environmental Pollution and Property Loss
Different potential risk-involved factors would have different levels of impact on accident-induced marine pollution and economic losses. By using the interpretable SHAP framework combined with the random forest classification mode, the underlying contributions of different features were revealed. For accident-induced environmental pollution prediction, the persons onboard feature made the greatest contribution to the pollution results. This feature involves human-associated factors, which have been proven to be the main factor associated with ship accidents [
60]. The multiple human-related factors, including proficiency of crewmembers in maneuverability, safety and environmental awareness of all people onboard, emergency response capability, and teamwork, present a complicated socio-technical structure, making it challenging to fully explore the underlying human factors in accidents. More importantly, more people onboard usually indicates a more complex management environment. This might explain why maritime accident-based economic losses and environmental pollution are greatly affected by the persons onboard risk factor. In addition, ship and accident types also have a high impact on marine pollution; for instance, severe collision or grounding incidents of dangerous chemical cargo ships and oil tankers will cause serious environmental pollution. External marine environment features, such as wind speed and temperature, make a great contribution to marine pollution, meaning that the uncertainty and dynamics of external marine environments have a certain impact on maritime accidents [
9,
61].
The ship length feature makes a major contribution to the accident-based economic loss severity analysis. It has been proven that large seagoing vessels cause fewer accidents compared with small ships [
2]; however, once a large vessel is involved in a maritime traffic accident, the economic losses will inevitably be incalculable, and the damages will certainly be greater when it comes to severe incidents involving large passenger ships [
62]. With respect to the marine environmental impact of accident-based economic losses, adverse sea states with poor visibility and high wind can increase the severity of both economic losses and injuries since heavy sea states can make the maneuvering environment more complex, and the maneuverability of ships also deteriorates, which greatly increases the probability of marine accidents. Similarly, for the impact of pollution, the persons onboard feature can lead to a great proportion of economic losses. As we emphasized before, human-related factors are a major contributor to maritime accidents; thus, fewer people, including passengers and crewmembers, might reduce the probability of severe accidents with catastrophic losses. For instance, autonomous navigation systems can effectively replace human pilots for cargo transportation and vessel maneuvering, which will greatly reduce the probability of human-induced maritime accidents [
63].
Analyzing the consequences of accidents by exploring different accident-involved features in marine environmental pollution and economic loss plays an indispensable role in helping environmental protection agencies efficiently identify the trigger of an accident and pre-evaluate the extent of the potential damage, enabling them to better take prompt measures to mitigate the pollution effect. It also assists marine insurance companies to better evaluate the potential marine risks associated with the involved insurance policies, enabling them to set appropriate insurance premiums. More importantly, these investigation studies could help shipping industries and companies realize the importance of corporate social responsibility. Shipping-related organizations will also benefit greatly from maritime accident analysis, helping them to achieve a more sustainable shipping environment and people-involved development [
64].
For potential future research and an implementation roadmap, the research direction should prioritize validating and scaling the proposed interpretable ML framework through more detailed cross-regional testing using dynamic environmental data and long-term impact assessments to ensure generalizability. Technical enhancements could integrate causal inference and multi-objective optimization to refine risk predictions while addressing ethical concerns such as algorithmic bias and data privacy. Real-world implementation requires pilot deployments in high-risk maritime zones, stakeholder collaboration for regulatory alignment, and user-friendly interfaces to translate SHAP insights into actionable emergency protocols. Additionally, embedding the model into digital twin platforms and exploring blockchain-based accountability mechanisms could enhance operational trust. The next steps include controlled trials in critical shipping corridors, interdisciplinary training for maritime professionals, and continuous model updates via feedback loops to adapt to evolving climate and operational conditions, bridging research innovation with practical maritime safety and insurance applications.
In addition, this study enhances intersubjectivity across disciplines by translating complex machine learning (ML) insights into actionable, empirically grounded explanations relevant to researchers in environmental science, maritime policy, and risk management. For instance, by showing that older cargo ships with inadequate maintenance (human factor) have a higher likelihood of severe oil spills—mirroring the 2023 Suez Canal incident where an aging tanker caused significant environmental loss—the developed framework could help port authorities prioritize inspections. The identified wind speed threshold (>22 knots) aligns with the 2021 Sri Lanka ship fire disaster, where high winds exacerbated chemical leakage, validating the model’s ability to convert abstract risk factors into operational guidelines for emergency responders. Finally, the interpretable SHAP-based explanations provide maritime insurers with transparent criteria to adjust premiums, similar to how telematics data transformed auto insurance. By grounding findings in such relatable scenarios, the study fosters shared understanding among data scientists with ML interpretability, regulators of threshold-driven policies, and industry with risk cost optimization, thus advancing collaborative solutions to global maritime challenges.
5. Conclusions
Maritime accidents contribute to the majority of shipping-related economic losses and environmental pollution. Analysis of the consequences of accidents on marine pollution and the severity of economic losses plays an indispensable role in helping environmental protection agencies efficiently identify accident triggers and pre-evaluate the extent of the potential damage, enabling them to better take prompt measures to mitigate the effect of the pollution. It also assists marine insurance companies to better evaluate the potential risks associated with the involved insurance policies so as to set appropriate insurance premiums. This study establishes an interpretable data-driven approach for analyzing the potential contributions of risk-involved features on marine environmental pollution and the severity of economic losses from an associated risk factor perspective. Specifically, a triple feature filter step is established to determine the best risk-involved factors. Then, eight different ML models are aggregated to compare model performance. The random forest model showed the best performance for environmental pollution and economic loss forecasting. An interpretable ML framework is developed to explore the contributory factors explaining the forecasting target. Accident-involved features, including persons onboard, ship length, accident type, and ship type, were found to contribute the most to accident-induced environmental pollution and economic losses. Sea-state factors, including wind speed and air temperature, are also associated with pollution and economic loss severity. The insights gained from this study can contribute to improving accident-based environmental impact and economic loss severity prediction based on enhanced maritime safety strategies, which will enable shipping companies, crewmembers, and other stakeholders to tailor targeted safety strategies to prevent maritime accidents.
The ML-driven insurance models, while improving risk prediction accuracy, risk disadvantaging smaller operators (older vessels flagged as high-risk due to crew size or maintenance constraints) if implemented without safeguards. To address this issue, premiums should integrate fairness-aware ML techniques, such as penalizing models for disparities based on vessel size and hybrid assessments combining SHAP-derived risk drivers (crew count, pollution containment capacity) with contextual audits (operator upgrade efforts, regional subsidies). For example, small vessels classified as high-risk due to crew shortages could receive subsidized training rather than punitive premiums, supported by dynamic risk adjustments based on real-time safety investments (IoTs-tracked maintenance). Our SHAP framework, which clarifies how features like vessel age or accident type drive predictions, enables regulators to audit and contextualize algorithmic outputs, ensuring ML complements, not replaces, equitable policies (periods for fleet upgrades). This balances innovation with fairness, preventing systemic marginalization while incentivizing proactive risk reduction.
While this study provides valuable insights into objective risk factors influencing maritime pollution and economic losses, it is important to recognize its limitations, particularly the limited exploration of human operational factors such as crew decision-making processes, training adequacy, and communication protocols during emergencies. These elements, though challenging to quantify due to their subjective and situational nature, are critical to understanding accident causality. Future research should adopt a multidimensional approach by incorporating variables like organizational safety culture (compliance with safety audits, incident reporting transparency), regulatory enforcement efficacy (adherence to International Maritime Organization guidelines), and systemic maintenance practices (frequency of equipment inspections). Such expansions would enable a comprehensive risk profile of the shipping industry, bridging gaps between technical predictors and human/organizational behaviors. Despite these limitations, the current findings identify high-impact risk drivers—including accident types (collisions, groundings), vessel specifications (length, cargo capacity), and onboard personnel numbers—that directly correlate with pollution severity and economic damage. By integrating these potential risk factors into predictive models, stakeholders can prioritize interventions, such as redesigning crew training curricula to address skill gaps or optimizing vessel designs to minimize oil spill risks. Furthermore, the study might underscore the disproportionate role of human factors in severe incidents, highlighting an urgent need for industry-wide investments in competency development and human-centered operational frameworks.
In addition, economic loss estimates rely on heterogeneous sources (e.g., insurer reports, government data), introducing variability. For example, pollution costs in developing nations may be underreported compared to EU-regulated zones, potentially inflating the perceived dominance of human/technical factors in well-documented regions. Catastrophic accidents (for example, oil tanker spills) are relatively limited in the training data, risking model underestimation of tail-end risks that involve unconventional factors (e.g., subcontractor practices) absent in typical datasets. Additionally, the dataset predominantly includes incidents from high-traffic routes (e.g., South China Sea, Mediterranean), underrepresenting older or regionally isolated accidents. This may skew thresholds like ship length while overlooking risks associated with smaller, region-specific fleets. The dataset size could be enhanced to achieve more accurate results.
To mitigate accident-induced environmental and economic harm, shipping officers, regulators, and maritime authorities must implement targeted, data-driven strategies. First, human-centric interventions should be prioritized: mandatory simulation-based training programs should be developed to enhance crew preparedness for high-stress scenarios and standardized competency assessments could ensure adherence to evolving safety standards. Second, vessel-specific risk protocols should be established, such as dynamic risk assessments for larger ships (oil tankers and bulk carriers) that account for their unique pollution potential and maneuverability challenges. Third, advanced monitoring systems should be deployed to track real-time environmental conditions (wind speed via IoTs sensors and visibility through satellite feeds) and automatically trigger adaptive responses—for instance, rerouting vessels during storms or activating spill containment mechanisms. Additionally, aligning these measures with corporate social responsibility (CSR) initiatives—such as public reporting of pollution metrics or partnerships with coastal communities for ecosystem restoration—can foster accountability and sustainable development. For policymakers, integrating these insights into regulatory frameworks (mandating predictive analytics in port entry approvals) will incentivize proactive risk management. Insurers could leverage these findings to refine premium models, offering discounts for operators adopting AI-driven safety systems. Collectively, these steps will not only reduce immediate accident impacts but also cultivate a culture of resilience, ensuring that the maritime industry balances economic growth with ecological stewardship and societal well-being.


