Article

How the Complexity of Knowledge Influences Carbon Lock-In

School of Economics and Management, Northwest University, No.1 Xuefu Avenue, Chang’an District, Xi’an 710127, China
*
Author to whom correspondence should be addressed.
Sustainability 2025, 17(7), 2985; https://doi.org/10.3390/su17072985
Submission received: 24 February 2025 / Revised: 19 March 2025 / Accepted: 25 March 2025 / Published: 27 March 2025

Abstract

:
Based on panel data from 30 provinces in China from 2000 to 2023, this study examines the relationship between knowledge complexity and carbon lock-in. The results indicate that an increase in knowledge complexity alleviates carbon lock-in. Heterogeneity results show that the mitigating effect of knowledge complexity on carbon lock-in is more pronounced in eastern China, areas south of the Qinling–Huaihe River, regions with higher levels of infrastructure construction, lower proportion of state-owned enterprises, areas with higher government financial science and technology expenditures. In terms of the mechanisms, knowledge complexity primarily suppresses carbon lock-in through optimization of factor allocation, enhancement of efficiency levels, and upgrading of industrial structures. Further investigations reveal that knowledge complexity exhibits a significant spatial spillover effect on carbon lock-in.

1. Introduction

Climate change and global warming present increasingly urgent challenges. These threats significantly endanger ecosystems and human health while worsening natural disasters and socioeconomic inequalities. According to the 2024 Global Climate Status report released by the World Meteorological Organization (WMO), the global average surface temperature is 1.55 °C higher than the pre-industrial average [1]. Intensive human activities, particularly large-scale industrial operations, have emitted substantial CO2 and other greenhouse gases into the atmosphere. These emissions are a key driver of global warming. Therefore, reducing socioeconomic reliance on carbon (which means carbon lock-in, CLI) and transitioning to low-carbon development pathways have become critical strategies for addressing global climate challenges.
According to the 2023 Carbon Emissions Report proposed by the International Energy Agency (IEA), carbon emissions in developed economies decreased by 4.5% (with the value for the European Union’s dropping by nearly 9%), primarily due to the contribution of clean energy initiatives. In contrast, China’s emissions rose by approximately 565 million tons in 2023 (reaching 12.6 billion tons of CO2), marking the largest global increase [2]. Against this backdrop, countries worldwide have prioritized carbon reduction efforts. For instance, the EU established its Emissions Trading System in 2005 to optimize resource allocation and incentivize carbon reduction projects. The 2015 Paris Agreement introduced a UN-supervised carbon credit mechanism, formally operationalized in 2024, to facilitate cross-border emission targets. However, developing nations lag significantly in CLI mitigation policy design and implementation. Constrained by fiscal vulnerabilities and technological mismatches, many struggle to escape low-carbon transition inertia. As the world’s largest carbon emitter, the ability of China to implement effective environmental governance measures is critical to advancing global low-carbon development.
China is currently transitioning toward high-quality development. However, its economy and society remain heavily reliant on carbon-intensive industries and infrastructure. This dependence locks economic growth into a carbon-based energy system, creating a CLI effect. Such lock-in suppresses innovation and competitiveness in low-carbon alternatives, making China’s decarbonization transition exceptionally challenging. Carbon reduction pressures are intensifying, necessitating urgent solutions to address worsening CLI [3]. In response, the Chinese government formally announced its “carbon peak and carbon neutrality” goals in 2020, aiming to resolve pressing issues of environmental pollution and economic transformation. During the Third Plenary Session of the 20th Central Committee, the government emphasized improving green and low-carbon development mechanisms. It also called for building a circular economy system to achieve more dynamic, resilient, balanced, and sustainable high-quality development. Analyzing the mechanisms of CLI and designing targeted mitigation strategies thus hold significant theoretical and policy relevance. These efforts are critical for aligning China’s development trajectory with global climate goals.
The concept of “CLI” was first introduced by Unruh et al. (2000) [4], who defined it as a path that relies on energy systems based on fossil fuel consumption in exploring the evolution of technology and institutions in industrial economies. Subsequently, Unruh and Carrillo-Hermosilla (2006) further explored global CLI phenomena and strategies for carbon unlocking [5]. Seto et al. (2016) identified infrastructure, technology, institutions, and behavior as key CLI dimensions, whose mutual reinforcement creates systemic lock-in at a global scale [6]. Wang et al. (2016) [7] and Xu et al. (2022) [8] measured CLI using carbon overload and sequestration rates, revealing China’s increasing CLI severity. However, this approach overlooks institutional and technological dimensions central to the definition of CLI. Addressing this gap, Zhao et al. (2023) [9] and Chen et al. (2023) [10] developed an entropy-based index system, demonstrating CLI’s negative impact on green economic efficiency. As carbon neutrality gains attention, scholars have explored factors mitigating CLI. Carley et al. (2011) [11] and Dong et al. (2023) [12] found fossil fuels drive economic growth but exacerbate CLI, while renewables can break this paradox. Mattauch et al. (2015) analyzed structural shifts toward low-carbon economies, highlighting policy-driven technological change [13]. Liang et al. (2017) extended CLI theory to regional and industrial contexts, emphasizing its prevalence in underdeveloped areas [14]. Zhao et al. (2023) showed renewable energy consumption and generation alleviate CLI through technological and scale effects [15]. Yang et al. (2022) [16] and Zhao et al. (2024) [17] found that technological innovation and green total factor productivity enhance industrial upgrading, creating synergistic CLI mitigation effects. Zhao et al. (2023) also demonstrated that low-carbon and innovation city policies significantly suppress CLI through technological and industrial structural effects [18].
Existing literature highlights technological innovation and industrial upgrading as critical factors in mitigating CLI. However, mechanisms to enhance innovation, achieve industrial transformation, and ultimately escape CLI remain underexplored. Poutanen et al. (2016) identified knowledge complexity (KCI), characterized by the non-imitable and non-substitutable nature of innovative knowledge, as a key driver of technological innovation [19]. Elevating KCI in invention processes directly stimulates innovation and technological advancement while enhancing the complexity and novelty of green technologies, thereby accelerating green economic transitions. This implies that KCI may promote technological innovation and industrial upgrading, positioning it as a pivotal factor influencing CLI. Following this theoretical framework, Doğan et al. (2021) [20] and Wang et al. (2022) [21] explored links between KCI and carbon emissions. Yet, few studies directly examine KCI’s mechanisms in shaping CLI. Addressing this gap, this study investigates CLI through a KCI lens. Using panel data from 30 Chinese provinces (excluding Tibet) spanning 2000–2023, it empirically tests the KCI–CLI relationship and its underlying pathways.
The main contributions of this paper are as follows: First, it introduces KCI as a novel perspective to analyze CLI and its mechanisms. Existing literature has mainly focused on the impacts of technological innovation and total factor productivity. However, as previously mentioned, the enhancement of KCI not only directly fosters innovation and drives technological advancement but also strengthens the complexity and novelty of green technologies, making it a critical factor influencing CLI. Based on this understanding, this paper explores the factors affecting CLI through the lens of KCI, further analyzing its mechanisms from the perspectives of resource allocation, efficiency improvement, and structural optimization.
Secondly, it employs an iterative computation method with coupled nonlinear mapping to measure KCI more accurately. In contrast to previous studies that utilized patent citation rates and bimodal network models, this paper adopts the reflective method proposed by Hidalgo et al. (2007) [22] and employs the improved fitness method by Tacchella et al. (2012; 2018) [23,24], integrating a knowledge–province bimodal network to assess the knowledge complexity of various provinces and cities. This approach more effectively situates knowledge within patent and regional scale networks, allowing for an examination of the exclusivity and high value of knowledge from a network perspective.
Thirdly, we integrate multiple methods to identify the impact of KCI on CLI, mediating mechanisms and spatial spillover effects. Initially, two-way fixed effect is constructed to identify the relationship, investigating potential mediating mechanisms from the perspectives of resource allocation, efficiency improvement, and structural optimization. Subsequently, a spatial economic geography nested matrix is employed to measure the spatial spillover effects of KCI on CLI, providing a more comprehensive and objective reflection of the spatial correlation among cross-sectional units, which is further decomposed into direct, spatial, and total effects for detailed analysis.
The structure of the remaining sections is as follows: (1) The second section formulates research hypotheses based on the analysis of the relationship between KCI and CLI; (2) The third section outlines the research design; (3) The fourth section presents empirical testing; (4) The fifth section examines mechanisms; (5) The sixth section provides further analysis; (6) The seventh section concludes with policy implications.

2. Theoretical Analysis Framework and Research Hypotheses

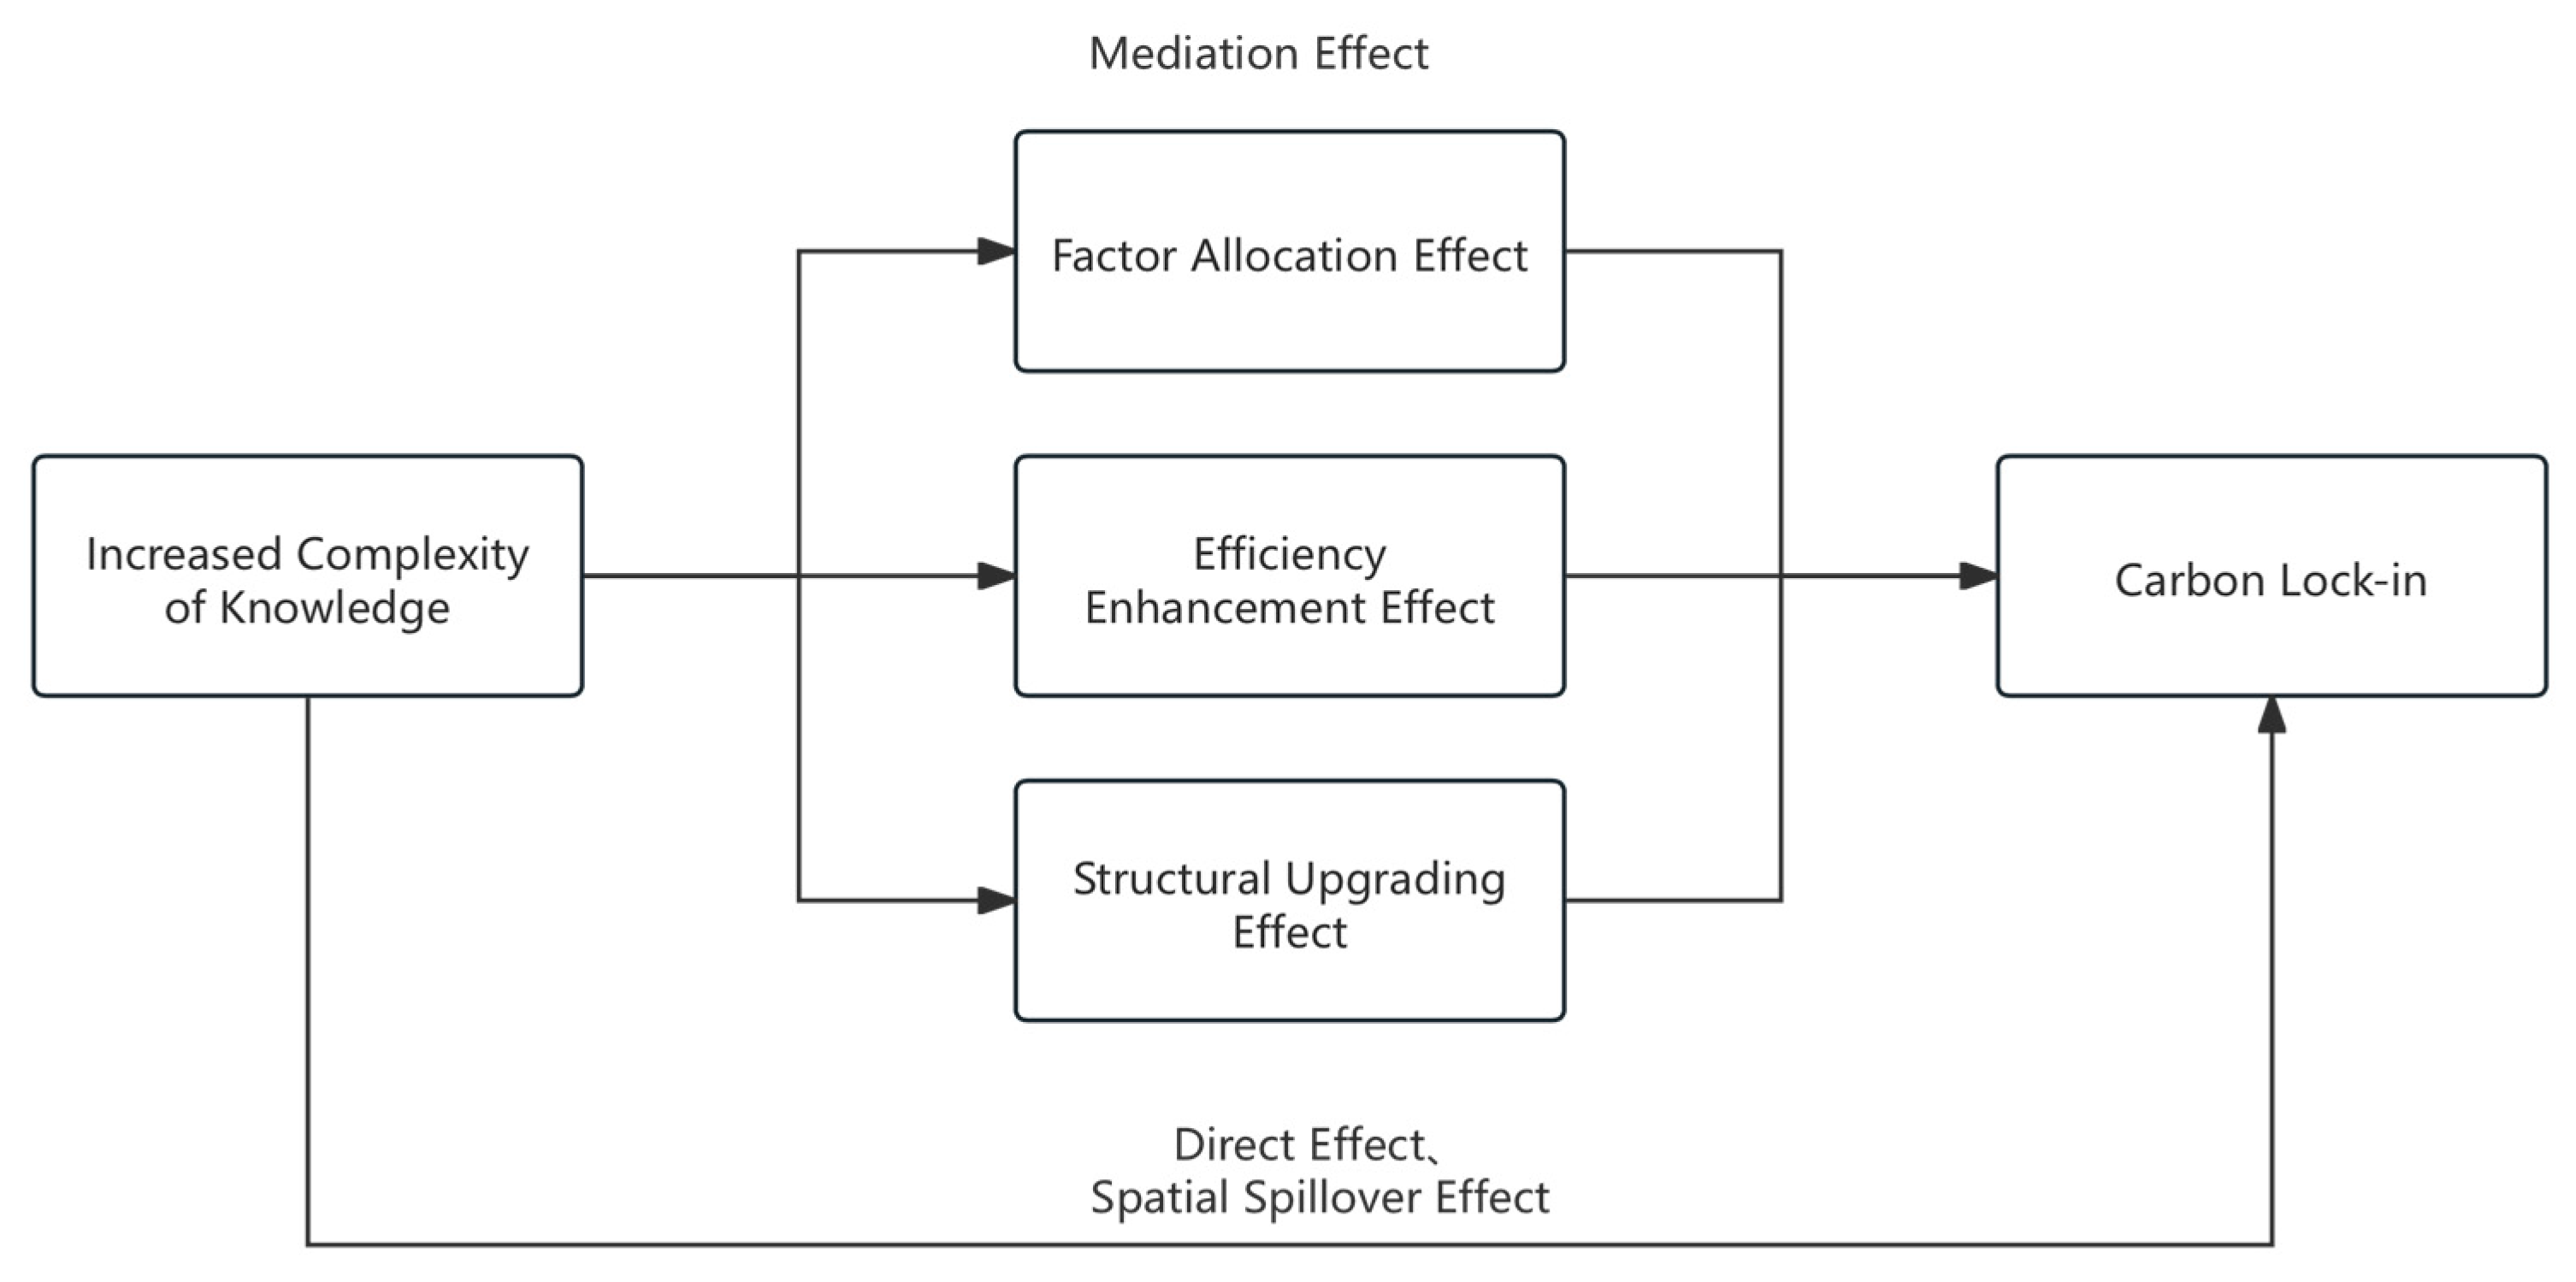
As previously mentioned, the enhancement of KCI can promote technological innovation and industrial structure upgrading, serving as a critical factor in alleviating CLI. KCI not only has a direct impact on mitigating CLI but also indirectly suppresses it through three aspects: resource allocation, efficiency improvement, and structural upgrading. Specifically:
(1)
The Direct Effects of KCI on CLI
The direct impact of KCI on CLI is primarily manifested in the following ways: Firstly, as a critical factor in innovation input, an increase in KCI can directly lead to an elevation in innovation levels, facilitating the accumulation of human capital in research and development. Conversely, it provides substantial intellectual support for the research, application, and advancement of green technologies, as well as the greening and upgrading of industrial structures. Such developments are conducive to enhancing resource utilization efficiency and significantly bolstering regional capabilities in advanced technology, particularly in achieving breakthroughs in green technologies and renewable energy. This progression allows low-carbon technologies to gradually replace carbon-intensive technologies, thereby addressing the issue of technological lock-in [25].
Second, KCI contributes to transforming regional development models. The deepening of knowledge systems enables regions to acquire cutting-edge scientific knowledge and R&D methodologies. This drives technological innovation and upgrades enterprises, fostering the development of more competitive products. Entry into high value-added industries accelerates optimization and upgrading of regional industrial structures [26]. Such transitions shift development from traditional energy resource dependency to technology and innovation-driven growth. Enhanced innovation collaboration further amplifies these effects. Through spillover effects of green innovation, green technologies are increasingly adopted across industries. This promotes industrial restructuring toward knowledge-intensive service sectors characterized by sustainability, low-carbon attributes, and technological sophistication. Consequently, sectoral reliance on carbon-intensive pathways is systematically reduced, weakening CLI mechanisms [27].
Finally, KCI enhancement strengthens human capital and raises public environmental awareness. It guides the diffusion of green consumption concepts, promoting sustainable consumer behavior, optimizes household energy consumption structures, transitioning lifestyles toward green practices. Efficient and intensive development models gradually replace traditional resource-intensive approaches [28]. Additionally, KCI drives innovation and adoption of energy technologies, reshapes energy supply structures by promoting clean energy development. These advancements optimize energy consumption patterns. By decelerating carbon emission growth in consumption sectors and addressing social behavioral lock-in, KCI positively accelerates carbon unlocking. Based on these mechanisms, we propose the following hypothesis:
H1: 
KCI has a significant direct negative impact on CLI.
(2)
The Indirect Effects of KCI on CLI: Mediating Mechanisms
The indirect effects of KCI on CLI primarily encompass three aspects: factor allocation, efficiency enhancement, and structural optimization.
  • Factor Allocation Effect
The inherent heterogeneity of complex knowledge fosters the development of advanced green technologies and high-level innovations, influencing regional environmental disparities and leading to the agglomeration of innovative factors [29]. As innovative factors flow in and cluster, it can enhance the stock of innovative resources, provide support in terms of human capital and funding, and optimize factor allocation. This process facilitates the widespread dissemination and deep application of green technologies, strengthens the openness and collaboration of green innovation, upgrading of green industrial chains, effectively alleviating the phenomenon of CLI. From the enterprise perspective, the aggregation of innovative factors can enhance technological cooperation among firms, drive higher-quality innovation activities, stimulate technological innovation vitality, and improve the efficiency of factor allocation, thereby advancing the development of a green economy and reducing CLI [30]. Spatially, the flow of innovative factors can also integrate dispersed economic resources, promoting the introduction of new technologies, enhancing the synergistic effects among industries, and improving resource allocation efficiency. This further steers the industrial structure towards resource saving and environmental friendliness [31]. Thus, we propose the following hypothesis:
H2: 
KCI has a significant negative impact on CLI through factor allocation.
2.
Efficiency Enhancement Effect
High-value and complex knowledge serves as a core driver of technological advancement. Innovation elements act as primary carriers of knowledge and information. Their inflow facilitates the exchange of knowledge and methodologies across regions, strengthens technology spillover effects. It also expands regional reserves of knowledge, technology, and capital. These outcomes collectively provide robust support for technological innovation activities [31]. On the one hand, with technological progress, the development and innovation of low-carbon technologies are accelerating, leading to a gradual replacement of carbon-intensive technologies by clean, low-carbon technologies. Notably, significant breakthroughs in green technologies and renewable energy technologies have occurred, with their extensive spillover effects injecting new momentum into sustainable development. On the other hand, the technology spillover effect is increasingly evident in production technologies and pollution reduction technologies. When enterprises innovate in production or pollution control technologies, competitive pressure encourages other firms to imitate and learn these new technologies, promoting the dissemination of knowledge and technology within agglomerated regions. The outcome of the technology spillover effect will facilitate the technological innovation upgrade of the entire agglomeration area, enhance overall technological levels, improve pollution management efficiency, and alleviate CLI [32]. Thus, we propose the following hypothesis:
H3: 
KCI has a significant negative impact on CLI through efficiency enhancement.
3.
Structural Upgrading Effect
Complex knowledge can facilitate the flow and aggregation of innovative elements, which not only enhances the efficiency of resource allocation but also promotes the application of knowledge. The agglomeration effect of innovative elements stimulates regional innovation vitality, increases the marginal returns on innovation investments, and makes technological innovation activities within the region more dynamic. Thereby driving fundamental adjustments and upgrades in the regional industrial structure. Furthermore, innovation as an endogenous variable of economic growth, can also propel regional technological advancement, leading to a higher level of development of the industrial structure [33]. Additionally, the optimization of the industrial structure can strengthen energy conservation and emission reduction, improving the structure and efficiency of energy consumption. This not only aids in the efficient utilization of production resources, reduces the rent-seeking costs between regions, but also alleviates environmental pressures, enhancing the regional resource status and environmental conditions. On this basis, both the transformation and optimization of the industrial structure can mitigate CLI by elevating the level of technological innovation, enabling related industries to rapidly develop towards knowledge-intensive services characterized by green, clean, and low-carbon attributes, demonstrating a “1 + 1 > 2” effect [18]. Therefore, we propose the following hypothesis:
H4: 
KCI has a significant negative impact on CLI through industrial structure upgrading.
(3)
The Spatial Spillover Effects of KCI on CLI
The spatial spillover of knowledge significantly positively influences the dynamic flow of innovative factors between regions, thereby effectively enhancing the overall regional innovation performance. This flow not only transcends geographical boundaries but also promotes the widespread development of innovative activities through the dissemination and sharing of knowledge [31]. The allocation of innovative factors contributes to optimizing the spatial layout of green industries, enhancing the spatial agglomeration effects of green economic development. The robust growth of the green economy relies on industrial clusters of a certain scale, while the effective allocation of innovative factors can guide the green industry to form agglomerations in specific spaces, further generating economies of scale and externality effects, thus providing a strong impetus for the sustainable development of the green economy. Moreover, the flow of innovative factors greatly facilitates communication and collaboration among heterogeneous green innovation entities across regions. This mechanism accelerates the free flow of green technologies and knowledge, creating spatial spillover effects for economic green growth. Such effects not only benefit the upgrading and transformation of green industries within regions but also promote the overall regional economy towards a more sustainable direction, ultimately achieving coordinated development in the green transformation of regional economies [34]. Therefore, we propose the following hypothesis:
H5: 
The impact of KCI on CLI has significant spatial spillover effects.
The research hypotheses of this paper are summarized in Table 1.
The relationship between KCI, factor allocation effect, efficiency enhancement effect, structural upgrading effect, and CLI is shown in Figure 1.

3. Research Design

3.1. Variable Selection and Measurement

3.1.1. Dependent Variable: CLI

Drawing on the studies by Zhao et al. (2023) [3] and Niu and Liu (2021) [35], considering the actual conditions of CLI across various provinces in China, we evaluated the CLI level in China from four dimensions: industry lock-in, institutional lock-in, technological lock-in, and social behavioral lock-in.
Fixed asset investment represents a sunk cost for enterprises; however, given the long lifecycle of fixed assets, decisions made during the initial investment phase significantly influence carbon emission intensity. Thereby inevitably hindering the transition of production methods and technologies towards low-carbon and environmentally friendly alternatives. Consequently, this study utilizes fixed asset investment as a primary foundational indicator for measuring industry lock-in. Additionally, the number of employees in the mining sector, the proportion of fiscal science and technology expenditure, and environmental pollution control investment relative to GDP are selected to reflect governmental investment in CLI, thereby facilitating the assessment of institutional lock-in. To gauge the level of technological lock-in, we employ the carbon emission intensity index, energy intensity index, and the proportion of R&D expenditure to GDP. From the perspective of individual behavior, social behavioral lock-in is measured, with specific indicators detailed in Table 2. Based on the aforementioned indicator system, we reference Zhao et al. (2023) [3] to calculate the CLI index for 30 provinces in China using the entropy method, with the specific calculation methodology outlined as follows:
The first step involves standardizing the 12 indicators.
The positive indicators are as follows:
X i j = x i j m i n ( x i j ) m a x ( x i j ) m i n ( x i j )
The negative indicators are as follows:
X i j = m a x ( x i j ) x i j m a x ( x i j ) m i n ( x i j )
Here, the data x i j for the j -th indicator representing province i ( i = 1, 2, …, n) is considered, where i = 1, …, 31 and j = 1, …, 12. The standardized indicator values are denoted as X i j .
The second step is to calculate the proportion of the j -th indicator for province i as follows:
P i j = X i j i = 1 n X i j
The third step entails calculating the entropy value of the j -th indicator, with n representing the total number of samples as follows:
e i j = 1 l n n i = 1 n P i j × l n ( P i j )
The fourth step involves calculating the information entropy redundancy for each j indicator as follows:
d j = 1 e j
The fifth step is to determine the weights for each j indicator, expressed as follows:
w j = d j j = 1 m d j
The sixth step, based on the weights, yields the carbon lock-in levels for the 30 provinces:
C L I i j = j = 1 m w i j X i j

3.1.2. Key Explanatory Variable: KCI

This paper employs the KCI to assess the complexity of local knowledge bases. Research on knowledge complexity, which measures the characteristics of local knowledge bases, has recently gained traction. This approach moves beyond traditional, homogenous analyses of knowledge, such as simple accumulation, stock growth, and the quantity of new knowledge. Instead, it focuses on the inherent quality, complexity, and diversity of knowledge. The core of this method involves positioning knowledge within patent-scale or regional-scale networks to examine qualitative aspects, such as exclusivity and high value, from a network perspective.
Employing the reflection method proposed by Hidalgo et al. (2007) [22], and utilizing the fitness method (FCM) as improved by Tacchella et al. (2012; 2018) [23], this study assesses the KCI of 30 provinces in China through a two-mode network of knowledge and provinces [24]. The advantage of this method lies in its iterative calculation approach, which incorporates a more rational, coupled nonlinear mapping. The specific calculation steps are as follows:
First, the revealed comparative advantage (RCA) is calculated to reflect whether a province possesses a comparative competitive advantage in creating or producing knowledge.
R C A c t = p c t / t p c t c p c t / c t p c t
Here, p c t represents the number of patents in technology category t for province c. If R C A c t > 1 , province c demonstrates a specialization advantage in the production of knowledge t, corresponding matrix elements M c , t = 1 , conversely, the value is zero. The calculation formula for matrix M is thus derived as follows:
M c ,   t =   1           i f     R T A c t > 1   0         i f     R T A c t 1
The number of technology categories possessed by a region that contain R C A c t > 1 is referred to as the region’s (knowledge) diversity, while the number of cities that possess a specific technology as a comparative advantage is termed the (regional) ubiquity of knowledge. The initial values are calculated by summing the columns and rows of matrix M, respectively, as follows:
K c , 0 = t M c t
K t , 0 = c M c t
Subsequently, iterations are performed with all initial conditions set to 1:
K ~ c , n = t M c t K t , n 1 K ~ t , n = 1 c M c t 1 K c , n 1
Finally, they are normalized as follows:
K c , n = K ~ c , n K ~ c , n c K t , n = K ~ t , n K ~ t , n t
In this context, K ~ c , n c and K ~ t , n t represent the averages of K ~ c , n and K ~ t , n , respectively. In the final results, K c , n denotes the fitness of the province, which corresponds to the required KCI for each province.

3.1.3. Mediating Variables

(1)
Factor Allocation: The Factor Allocation Mismatch Index (FAC) is employed for measurement
Efficient resource allocation implies a scenario where resources, characterized by their free mobility and allocation, facilitate the equalization of marginal factor outputs with marginal production costs, thereby achieving Pareto optimality. This study employs a factor misallocation index to gauge the level of factor allocation. Following Lin (2013), we utilized the relative disparity between the degree of factor market development and that of the most developed factor market within our sample as a proxy variable for factor market distortions [36]. Consequently, the factor market distortion indicator is formulated as follows:
F A C i t = m a x ( f a c t o r i t ) f a c t o r i t m a x ( f a c t o r i t ) × 100
Here, f a c t o r i t represents the index of factor market development. The constructed factor distortion indicator based on this index not only captures the relative differences in factor market distortions across regions but also reflects the temporal changes in factor market distortions within each region.
(2)
Efficiency Improvement: Green Total Factor Productivity (GTFP) is selected as the measure
Drawing on the methodology proposed by Pastor et al. (2005) [37], this study measures the regional total factor productivity growth within a global reference data envelopment analysis (DEA) framework, incorporating the super-efficiency slack-based measure (SBM) model introduced by Fukuyama et al. (2009) [38] and the Malmquist productivity index. Utilizing panel data from China’s industrial sectors from 2000 to 2023, input–output indicators are selected to calculate green total factor productivity (GTFP). Capital stock, employment, and total electricity consumption are used as input indicators. Economic output level is a critical determinant of industrial GTFP; thus, this study adopts “constant-price GDP of each province, municipality, and autonomous region” as the desirable output indicator. Undesirable outputs are a key distinction between GTFP and traditional total factor productivity (TFP). While traditional TFP assumes that higher output values are preferable, pollutants, as undesirable outputs of industrial production processes, are better when minimized. Therefore, this study selects four indicators for measurement: “industrial dust and soot emissions”, “industrial wastewater discharge”, “industrial sulfur dioxide (SO2) emissions”, and “PM2.5”.
(3)
Structural Upgrading (SU)
Drawing on the approach of Gan et al. (2011), the ratio of the output value of the tertiary industry to that of the secondary industry is adopted as a measure of industrial structure advancement [39]. This metric clearly reflects the tendency of the economic structure toward servitization and explicitly indicates whether the industrial structure is evolving in the direction of “servitization”. If the SU value shows an upward trend, it signifies that the economy is progressing toward servitization and that the industrial structure is upgrading.

3.1.4. Control Variable

This study employs the following control variables: The economic development level is represented by per capita GDP across provinces. Green finance development level is measured using the entropy method, incorporating green credit, green investment, green insurance, green bonds, green support, green funds, and green equity. The industrialization level is represented by the ratio of industrial added value to GDP. Government intervention is captured by a dummy variable indicating the implementation of China’s carbon emissions trading pilot policy. The international trade level is measured by the ratio of goods import and export value to regional GDP. The informatization level is gauged by the ratio of postal and telecommunications business volume to GDP.

3.2. Model Construction

To examine the impact of knowledge complexity on CLI, this study constructs a two fixed-effects model as the baseline regression model for empirical testing. The model is specified as follows:
C L I i t = α 0 + α 1 K C I i t + α 2 C o n t r o l i t + μ i + γ t + ε i t
In this context, the dependent variable is CLI; the core explanatory variable is KCI; the control variables are denoted as C o n t r o l ; μ i represents province fixed effects; γ t represents time fixed effects; α 0 is the constant term; α 1 is the estimated coefficient of the core explanatory variable; ε i t is the random disturbance term; i represents the province; and t represents the year.

3.3. Data Sources and Descriptive Statistics

Based on data availability, this study utilizes panel data from 30 provinces (excluding Tibet) spanning the period 2000–2023 for analysis. The data for all variables are sourced from the China Statistical Yearbook, provincial statistical yearbooks, China Urban Construction Statistical Yearbook, China City Statistical Yearbook, China Statistical Yearbook on Science and Technology, China Statistical Yearbook on Environment, China Energy Statistical Yearbook, and annual bulletins from relevant departments. The descriptive statistics of the variables are presented in the Table 3.
In this study, data from Tibet was excluded due to its remote location, missing data, and issues with data quality. The unique economic structure and geographical characteristics of Tibet, which differ significantly from those of other provinces, would affect the accuracy and reliability of the study. Therefore, Tibet was excluded from the analysis.

4. Empirical Analysis Results

4.1. Analysis of Baseline Model Estimation Results

This study employs a two-way fixed effects model to address endogeneity arising from temporal and individual heterogeneity. Table 4 presents regression results with control variables added progressively. Column (1) shows that without controls, KCI has a coefficient of −0.006775 on CLI, significant at the 5% level. However, economic development, green finance, industrialization, government intervention, international trade, and informatization may influence CLI. These factors are incrementally controlled. As shown in Table 4, KCI’s negative impact on CLI strengthens as controls are added. Column (4) reports the full model results, where a 1% increase in KCI reduces CLI by approximately 0.0076%, significant at the 1% level. This confirms that higher KCI directly suppresses CLI, facilitating carbon unlocking. This, hypothesis H1 is empirically supported.

4.2. Robustness Tests

(1)
Alternative Explanatory and Explained Variables
The core explanatory variable KCI is lagged to address the temporal relationship between CLI and KCI, reducing bidirectional causality and endogeneity. Results in Column (1) of Table 5 show the lagged variable aligns with the baseline regression, confirming the robustness of the findings.
This study employs carbon dioxide emission levels as an alternative dependent variable for CLI to validate the robustness of its findings. Elevated CLI is intrinsically associated with higher carbon emissions [4]. Replacing CLI with this measure addresses potential measurement biases in composite indicator construction. Empirical results in Column (2) of Table 5 align with the baseline regression estimates, demonstrating consistent and robust outcomes
(2)
Exclusion of Municipalities
For Column (3) in Table 5, municipalities are excluded from the sample. This follows Yang (2022) to address potential sample selection bias [16]. The bias arises from China’s imbalanced regional development. Municipalities often benefit from advanced economic development and government support. Their unique status and policy advantages might amplify the effects of knowledge complexity. The four municipalities are removed, and the regression is re-estimated. The results remain consistent with the baseline regression. This confirms the robustness of the findings.
(3)
Instrumental Variable (IV) Approach
While the earlier part of this study employs various methods to mitigate the impact of selection bias and other factors on the empirical results, endogeneity issues such as omitted variable bias and reverse causality may still persist, potentially affecting the empirical results and estimation accuracy. To address potential endogeneity, an instrumental variable (IV) approach is adopted.
Drawing on Li et al. (2024), the lagged KCI (L.KCI) was used as the instrumental variable, and a two-stage least squares (2SLS) method was applied to assess the specific impact of KCI on CLI [34]. Column (4) in Table 5 presents the results of the first-stage IV estimation, showing that the instrumental variable L.KCI is significantly positively correlated with the KCI at the 1% level. The weak instrument test indicates an F-statistic greater than 10, confirming the absence of weak instrument issues. Column (5) reports the results of the second-stage estimation, where the estimated coefficient remains significantly negative. Thus, the IV regression results are consistent with the baseline regression, indicating that KCI continues to have a significant negative impact on CLI after addressing endogeneity. This further demonstrates the robustness of the empirical findings.
This study addresses endogeneity concerns by employing “invention patent applications” as an IV. Patent data reflect regional knowledge recombination capacity and technological network density. Their growth directly signals the complexity of knowledge elements, which correlates endogenously with KCI [40]. The exclusion restriction holds because patents are technologically neutral, their carbon reduction effects depend solely on the mediation of KCI through technological path selection. The results presented in Table 6, Columns (1)–(2) confirm the robustness of these findings.
Local government education expenditure enhances regional KCI through human capital accumulation and knowledge diffusion. Education spending supports higher education institutions, cultivates research talent, and builds interdisciplinary networks. These actions increase the heterogeneity of knowledge production [41]. The exclusion restriction is satisfied as education policies primarily target human capital quality, not direct energy. The long-term lagged effects of education spending further mitigate reverse causality between CLI and current budgets. Therefore, this study employs “local government education expenditure” as an IV. The results presented in Table 6, Columns (3)–(4) demonstrate robust empirical outcomes.

4.3. Heterogeneity Analysis

(1)
Regional Heterogeneity
To further explore the heterogeneous effects of KCI on CLI across regions due to unbalanced KCI development, provinces are categorized into eastern, central, western regions, and areas south/north of the Qinling–Huaihe line. This approach analyzes region-specific impacts of KCI on CLI and reveals heterogeneous response mechanisms across regions at different development stages [15]. The corresponding results are presented in Table 7.
Columns (1)–(3) in Table 7 examine the impact of KCI on CLI in eastern, central, and western regions. The core independent variable coefficient for the eastern region is significantly negative, indicating that KCI substantially suppresses CLI in eastern China. However, KCI shows no statistically significant effects on central or western regions. Specifically, a 1% increase in KCI reduces CLI by 0.0053% in the eastern region.
This outcome stems from structural disparities in human capital and factor mobility across regions. The eastern region benefits from dense human capital accumulation and robust factor mobility networks. Highly skilled labor forces efficiently absorb and apply complex knowledge, driving low-carbon innovation and green industrial upgrading. High mobility of capital and technology accelerates knowledge spillovers, facilitating clean technology diffusion and high-carbon industry substitution. In contrast, central and western regions face insufficient human capital, limiting knowledge absorption capacity. Weak factor mobility hinders cross-regional integration of knowledge capital and innovation resources. Consequently, rising knowledge complexity fails to translate into low-carbon practices effectively. Traditional factor lock-in effects reinforce technological path dependence, weakening carbon reduction efficacy [18].
Columns (4)–(5) in Table 7 examine KCI’s impact on CLI in regions south and north of the Qinling–Huaihe line. A 1% KCI increase reduces CLI by 0.0054% in the southern region, demonstrating KCI’s significant suppressive effect on CLI.
The stronger carbon unlocking effect of KCI in regions south of the Qinling–Huaihe line compared to the north arises from structural disparities. The south’s humid climate and dense water networks sustain green industrial ecosystems. Human capital and innovation networks enhance localized knowledge application, driving clean technology advancement and high-carbon substitution. Market-driven factor allocation reduces reliance on traditional energy systems. In contrast, the north’s arid climate and historically heavy industrialization reinforce CLI. Human capital mismatches and restricted factor mobility hinder technological restructuring. Persistent path dependence on fossil technologies in energy-intensive industries further weakens the carbon unlocking potential of knowledge innovation.
(2)
Infrastructure Development
This study incorporates infrastructure development as a key variable in examining the heterogeneous impact of KCI on CLI. Infrastructure’s role in knowledge dissemination, technology diffusion, and green transition justifies this approach. Infrastructure level is measured by road mileage per capita across provinces.
As shown in Columns (1)–(2) of Table 8, a 1% increase in KCI reduces CLI by approximately 0.0057% in high-infrastructure regions, while the effect is insignificant in low-infrastructure regions. This occurs because advanced infrastructure lowers factor mobility costs and enhances collaborative innovation networks. These mechanisms accelerate localized knowledge absorption and low-carbon technology adoption, amplifying KCI’s carbon unlocking potential. Modern energy and digital infrastructure further enable green technology iteration, strengthening emission reduction effects [42]. In low-infrastructure regions, mobility barriers and technological incompatibility hinder knowledge complexity translation. Legacy infrastructure perpetuates path dependence on carbon-intensive technologies, limiting KCI’s efficacy. This heterogeneity underscores infrastructure’s critical threshold effect in converting knowledge innovation into low-carbon practices.
(3)
Ownership Structure
This study investigates how the prevalence of state-owned enterprises (SOEs) moderates the impact of KCI on CLI. In China, emission-intensive industries, primarily dominated by SOEs, maintain close institutional linkages with local governments. Due to their poor operational performance, local governments often sustain SOE profitability through administrative monopolies, including distorted market entry barriers and resource pricing mechanisms, which exacerbate CLI [43].
As shown in Table 8, Column (4) reports a significant negative coefficient (−0.006419) for regions with lower SOE presence, whereas Column (3) shows statistically insignificant effects in high-SOE regions. This suggests that KCI more effectively suppresses CLI in areas with fewer SOEs.
At the level of administrative monopoly, SOEs’ investment decisions prioritize policy goals over market efficiency. Local governments allocate resources to carbon-intensive industries via subsidies and land concessions, perpetuating resource misallocation. Even with rising KCI, green technologies struggle to penetrate due to distorted incentives [44]. SOEs’ performance evaluations prioritize scale over innovation, favoring mature carbon-intensive technologies rather than green alternatives.
At the level of industry monopoly, SOEs in energy and heavy industries control critical infrastructure and technical standards, creating entry barriers for green technologies [45]. Closed innovation networks within SOEs limit cross-entity knowledge spillovers. Internal R&D collaborations restrict external diffusion of complex knowledge, weakening KCI’s potential to drive low-carbon transitions.
These findings underscore how SOE dominance, through administrative and industry monopolies, constrains KCI’s role in mitigating CLI. Reforming monopolistic structures is essential to unlock decarbonization potential.
(4)
Government Expenditure
Government expenditure on science and technology is directly linked to knowledge generation, technological innovation, and research activities. The proportion of local fiscal spending on science and technology reflects the level of commitment and investment in technological development. This significantly impacts KCI, particularly in key areas like low-carbon technologies, environmental protection, and energy efficiency [46]. This study measures regional science and technology expenditure using its share of total fiscal spending. Regions are divided into high and low groups based on the median for heterogeneity analysis.
The results presented in Columns (5)–(6) of Table 8 show a 1% increase in KCI reduced CLI by approximately 0.0049% in high-expenditure regions. The effect is insignificant in low-expenditure regions. Technological progress and innovation are key drivers of green development. Such advancements rely heavily on fiscal support, particularly government investment. By adjusting the proportion of science and technology expenditure, governments direct resources toward areas that enhance knowledge complexity and address CLI, promoting sustainable societal development.

5. Mechanism Test

The negative impact of KCI on CLI has been confirmed. This section explores how KCI affects CLI and its underlying mechanisms. It also examines the factors through which KCI accelerates the mitigation of CLI. To address these questions, a mediation effect model is employed. This model tests the mediating roles of factor allocation, efficiency improvement, and structural upgrading. Following Jiang (2022), a two-step mediation effect model is constructed based on the original baseline regression framework [47]:
M i t = β 0 + β 1 K C I i t + β 2 C o n t r o l i t + μ i + γ t + ε i t
The mediating variables M include factor allocation, efficiency improvement, and structural upgrading. These are represented by the factor misallocation index ( F A C ), green total factor productivity ( G T F P ), and structural upgrading (SU), respectively. These variables are incorporated into the model. The constant term is denoted as β 0 . The coefficient of the core explanatory variable on the mediating variable is represented as β 1 . The coefficients of the control variables are denoted as β 2 .

5.1. Factor Allocation

Column (1) in Table 9 shows the coefficient of KCI on FAC as −1.101084, significant at the 1% level. The result suggests KCI alleviates FAC and enhances resource allocation efficiency.
KCI promotes the flow of innovative elements, attracting talent, capital, and technology to competitive fields. Such agglomeration of innovative elements boosts innovation efficiency and optimizes market resource allocation, ensuring efficient use of innovative resources [31].
Factor allocation demonstrates flexibility, allowing regions to adjust strategies based on developmental needs. Effective integration of spatially dispersed economic resources creates a favorable environment for technological innovation, supporting green economic transformation and laying the foundation for sustainable development. Enhanced factor mobility fosters regional innovation collaboration, enabling more rational and effective resource allocation. Improved green technology levels contribute to CLI mitigation [29]. Therefore, hypothesis H2 is supported.

5.2. Efficiency Improvement

Column (2) in Table 9 shows a significant positive correlation between KCI and GTFP. A 1% increase in KCI leads to a 0.155657% rise in GTFP. This indicates that a higher knowledge complexity effectively drives green technological innovation and improves efficiency.
KCI enhances regional green technology innovation capabilities. It promotes knowledge exchange and cooperation, creating resource advantages. These advantages drive green technology innovation, positively contributing to green economic development. Technological innovation plays a key role in mitigating CLI by disrupting existing carbon-intensive systems and behaviors. Technological advancements introduce low-carbon or carbon-neutral alternatives, challenging the dominance of carbon-intensive technologies [48]. Disruptive innovations provide opportunities to reduce reliance on fossil fuels and transition to sustainable alternatives. For example, innovations in renewable energy, energy storage systems, energy-efficient appliances, and low-carbon transportation help decrease fossil fuel dependence and alleviate CLI. These innovations break lock-in effects and enable a transition to more sustainable pathways [49]. Thus, hypothesis H3 is supported.

5.3. Structural Upgrading

Column (3) in Table 9 presents the mediation effect test results for industrial structure upgrading. The coefficient of KCI on SU is 0.081745, indicating that CLI improvement effectively promotes industrial structure upgrading.
On the one hand, higher KCI significantly enhances regional technological capabilities and R&D capacity. As the depth and breadth of the knowledge system expands, knowledge accumulates and deepens. Enterprises gain access to cutting-edge scientific knowledge and R&D methods, providing strong technical support. This drives technological innovation and upgrades, enabling the development of more competitive products and entry into high-value-added industries, thereby promoting industrial structure optimization [50]. On the other hand, higher KCI attracts high-quality talent and capital investment, supporting technological R&D, innovation projects, and high-tech industries. This pushes regional industrial structures toward technology and knowledge-intensive transformation.
Industrial structure upgrading rebalances the economy by reducing the dominance of carbon-intensive industries, such as manufacturing processes heavily reliant on fossil fuels. For example, promoting sustainable agriculture and low-carbon services diversifies and sustains the industrial structure, reducing dependence on carbon-intensive activities and mitigating CLI [51]. During this upgrading process, low-carbon industries gain traction. Strategic investments in renewable energy and energy-efficient technologies create new opportunities for employment, innovation, and economic growth while reducing carbon emissions. This helps break the cycle of CLI, supporting hypothesis H4.

6. Further Analysis

Drawing on the spatial spillover model specification proposed by Shao et al. (2016), this study employs a nested spatial economic–geographic matrix to measure the spatial spillover effects of knowledge complexity on CLI [52]. This approach not only accounts for the spatial influence of geographic distance but also reflects the regional spillover and radiation effects of economic factors, thereby providing a more comprehensive and objective representation of the spatial linkages among cross-sectional units. The specific elements of the spatial weight matrix are constructed as follows:
Spatial geographic distance weight matrix:
W 1 =   1 d i j         i f   i j   0               i f   i j
Spatial economic distance weight matrix:
W 2 =   1 Y i Y j         i f   i j   0                                       i f   i j
Spatial economic-geographic nested matrix:
W = 1 2 W 1 + 1 2 W 2
Here, d i j represents the straight-line distance between region i and region j , while Y i and Y j denote the economic indicators of region i and region j , respectively. In this study, these indicators specifically refer to the annual average per capita GDP of each region.
To assess the applicability of the SDM, Wald and LR tests were conducted to determine whether the SDM could be simplified to SEM or SAR. The test results reject the simplifications. Therefore, the spatial Durbin model (SDM) with two fixed effects (controlling for spatial individual effects and temporal effects) was selected as the most suitable criterion.
Columns (1)–(3) in Table 10 show that the coefficient of KCI on local CLI is −0.007356, with the spatial lag term coefficient at 0.314112. Both are significant at the 1% level. This indicates that KCI significantly enhances local green economic efficiency and mitigates CLI, but its inhibitory effect on neighboring regions is insignificant. Columns (4)–(6) reveal significant negative direct and total effects of KCI on CLI, while indirect effects remain insignificant. These results demonstrate that KCI’s optimized regional allocation exerts a clear direct effect in suppressing CLI. However, its spatial spillover effects on neighboring regions’ CLI mitigation remain limited.
The limited spatial spillover effects of KCI on CLI can be explained through three dimensions: knowledge spillovers, factor mobility, and green technology adoption barriers.
At the knowledge spillover level, complex knowledge has not yet generated effective spillover effects on green technology advancement in neighboring regions. Knowledge spillovers primarily manifest in high-tech innovation and digital technology development, while green development receives limited attention. Disordered allocation of innovation resources further weakens spatial spillover efficacy.
In terms of talent and capital mobility, resource competition drives talent, capital, and key innovation factors to cluster in regions with higher KCI. Mismatched incentive structures concentrate human capital in these areas, creating an “innovation siphon effect” [53]. This depletes neighboring regions of critical resources. Capital exhibits inertia, favoring short-term returns in developed regions over green investments in peripheral areas. These mobility barriers constrain talent and capital flows, indirectly undermining green economic efficiency in neighboring regions.
At the green technology adoption level, regional competition and insufficient complementary technological infrastructure create institutional barriers. These factors reinforce a “regional lock-in effect”, where localized economic systems resist external innovation diffusion [10]. The lack of absorptive capacity for advanced knowledge and fragmented institutional frameworks hinder cross-regional optimization of green technology allocation. Consequently, spatial spillover effects remain underdeveloped, limiting the free flow and shared application of green technologies across regions.
Table 10 shows the total spatial spillover effect of KCI is significantly negative but remains influenced by neighboring regions. This highlights the need to improve governance and optimize the allocation of complex knowledge and talent capital. Reducing factor misalignment and promoting green technology adoption are critical. These measures can advance green economic development across provinces and mitigate CLI.

7. Conclusions and Policy Implications

This study analyzes panel data from 30 Chinese provinces between 2000 and 2023. Provincial CLI is measured by a comprehensive indicator system, and provincial KCI is measured by using the reflection method and fitness method, combined with knowledge-province bipartite networks. The impact of KCI on CLI is evaluated by a two fixed-effects model. We also systematically examined the heterogeneity, robustness, possible mechanisms, and spatial spillover effects. We identified the following four key findings: (1) Baseline regressions confirm KCI significantly mitigates CLI. (2) KCI’s inhibitory effect is stronger in eastern China, regions south of the Qinling–Huaihe line, areas with advanced infrastructure, higher government S&T expenditure ratios, and lower SOE presence. (3) KCI suppresses CLI through optimizing factor allocation, enhancing efficiency, and upgrading industrial structures. (4) KCI exhibits significant negative direct and total effects on CLI, but insignificant spatial spillovers. While KCI’s optimized regional allocation directly reduces CLI, spatial spillovers to neighboring regions remain limited.
Policy implications derived from these findings are discussed below:
(1)
Enhance KCI to alleviate regional CLI. This study demonstrates that increasing KCI significantly inhibits CLI, offering a critical strategy to address CLI challenges. Theoretically, higher KCI disrupts carbon-intensive technological and institutional path dependencies. On a practical level, Shenzhen, China, has transitioned from a “world factory” to a “global science and technology innovation center”. This shift is marked by rising knowledge complexity, driven by the integration of ICT and new energy technologies, exemplified by BYD’s electrification platforms. Policy interventions have prioritized high value-added industries, such as smart grids and battery recycling, over traditional electronics manufacturing. Consequently, carbon emissions per unit of GDP fell by 14.5% between 2020 and 2025, breaking the inertia of carbon-intensive economic models [54]. Governments should prioritize fostering complex knowledge through coordinated interventions. First, intellectual property systems must be strengthened to incentivize cross-disciplinary innovation. Targeted R&D subsidies should support foundational green technologies with high knowledge spillover potential, such as carbon capture and smart grids. Second, technology transfer mechanisms require optimization. Centralized patent pools and industry knowledge databases can reduce adoption costs for SMEs, breaking barriers to green industrial transformation. Additionally, a dynamic KCI-CLI policy evaluation framework should be established. Integrating KCI metrics into local government performance assessments will redirect resources toward green innovation. These measures collectively enable systemic knowledge–technology–institution synergies, accelerating nationwide carbon unlocking and advancing two-carbon goals.
(2)
Strengthen policy guidance to advance the spatial optimization of complex knowledge resource allocation. This study further finds that optimized regional allocation of KCI exhibits significant direct effects in suppressing CLI, but its spatial spillover effects on neighboring regions remain limited, indicating strong “regional lock-in” barriers. To eliminate local protectionism and spatial fragmentation, governments should establish cross-regional innovation alliances. Institutional coordination—such as unified carbon markets and mutual recognition of technical standards—can reduce knowledge spillover frictions. Enhanced spatial governance of complex knowledge resources is critical to promote interregional synergies. Simultaneously, establishing targeted funds to redirect talent and capital to underdeveloped regions is essential. Infrastructure connectivity must also be prioritized to improve technological compatibility, thereby unlocking KCI’s latent spatial spillover potential.
(3)
Develop targeted policies to fully leverage KCI’s potential in suppressing CLI. This study reveals heterogeneous effects of KCI on CLI across regions. KCI demonstrates stronger CLI mitigation in eastern China, areas south of the Qinling–Huaihe line, regions with advanced infrastructure, higher government S&T expenditure ratios, and a lower proportion of SOE presence. To address this heterogeneity, differentiated strategies are essential. Regions such as eastern China and those south of the Qinling–Huaihe line should prioritize complex knowledge innovation and cross-regional technology transfer. Institutional coordination can amplify their systemic advantages. In contrast, central/western and northern regions require targeted central fiscal support to upgrade digital infrastructure and smart energy networks. These measures reduce knowledge absorption costs and facilitate low-carbon patent sharing, weakening regional lock-in effects. Concurrently, optimizing fiscal S&T expenditure toward knowledge-intensive low-carbon technologies is critical. Funding should prioritize interdisciplinary R&D platforms to accelerate green breakthroughs. SOEs must reorient innovation resources toward green technologies, breaking path dependency in carbon-intensive sectors. Spatial governance frameworks should integrate these measures to maximize KCI’s decarbonization potential nationwide.
(4)
The international community must establish a multi-tiered, coordinated policy framework to address global CLI challenges. This study proposes three globally coordinated strategies to address CLI. First, establish a global carbon pricing alliance with regionally differentiated price floors. International compensation funds should offset mitigation cost disparities between developed and developing nations. Second, strengthen technology transfer mechanisms by creating low-carbon patent pools and preferential licensing systems, prioritizing carbon-intensive regions. Multilateral transition funds must support industrial restructuring and workforce retraining in fossil-dependent areas, ensuring socially inclusive decarbonization. Third, harmonize international rules by unifying carbon market certification standards and green financial disclosure frameworks. Cross-border carbon market integration would enhance global mitigation synergies. These multidimensional interventions—economic incentives, technology sharing, and institutional alignment—systematically dismantle CLI while advancing carbon neutrality goals.
Admittedly, there are still some limitations in this research. Although this article discusses the direct impact, mediating mechanisms, and spatial spillover effects of KCI on CLI, more factors still need to be considered in measuring knowledge complexity in the article. In future research, implicit or non-technical knowledge will be further incorporated to more comprehensively measure KCI. Meanwhile, in the conclusion and policy section, at the practical level, we have preliminarily analyzed relevant cases to demonstrate the inhibitory effect of KCI on CLI. However, further in-depth analysis is needed on specific methods and measures to improve KCI.

Author Contributions

Conceptualization, Y.L.; methodology, Y.L.; software, M.S.; validation, M.S. and Y.L.; formal analysis, M.S.; data curation, M.S.; writing—original draft preparation, M.S.; writing—review and editing, Y.L.; visualization, M.S.; supervision, Y.L.; project administration, Y.L.; funding acquisition, Y.L. All authors have read and agreed to the published version of the manuscript.

Funding

This research was funded by the National Natural Science Foundation of China (No. 7210040759, No. 72301211), the Humanities and Social Science Planning Fund of Ministry of Education (No. 23YJA790045), the General Social Science Foundation of Shaanxi Province (No. 2023D016), the Shaanxi Innovation Capability Support Program (Nos. 2024ZC-YBXM-017).

Institutional Review Board Statement

No applicable.

Informed Consent Statement

Not applicable.

Data Availability Statement

The series data are mainly from China Statistics Yearbook, China Statistical Yearbook on Environment, China Statistical Yearbook on Energy, Statistics Database of China Economic Information, Chinese Research Data Services Platform (CNRDS), China Carbon Accounting Database (CEADs) and some scholars’ research reports in China.

Conflicts of Interest

The authors declare no conflict of interest.

Abbreviations

The following abbreviations are used in this manuscript:
CLIcarbon lock-in
KCIknowledge complexity index
FACfactor misallocation index
GTFPgreen total factor productivity
SUstructural upgrading

References

  1. World Meteorological Organization: WMO Confirms 2024 as Warmest Year on Record at About 1.55 °C Above Pre-Industrial Level. Available online: https://wmo.int/media/news/wmo-confirms-2024-warmest-year-record-about-155degc-above-pre-industrial-level/ (accessed on 10 January 2025).
  2. The International Energy Agency (IEA): CO2 Emissions in 2023. Available online: https://www.iea.org/reports/co2-emissions-in-2023/ (accessed on 1 March 2024).
  3. Zhao, C.; Wang, K.; Dong, K. How does innovative city policy break carbon lock-in? A spatial difference-in-differences analysis for China. Cities 2023, 136, 104249. [Google Scholar] [CrossRef]
  4. Unruh, G.C. Understanding carbon lock-in. Energy Policy 2000, 28, 817–830. [Google Scholar] [CrossRef]
  5. Unruh, G.C.; Carrillo-Hermosilla, J. Globalizing carbon lock-in. Energy Policy 2006, 34, 1185–1197. [Google Scholar] [CrossRef]
  6. Seto, K.C.; Davis, S.J.; Mitchell, R.B.; Stokes, E.C.; Unruh, G.; Ürge-Vorsatz, D. Carbon lock-in: Types, causes, and policy implications. Annu. Rev. Environ. Resour. 2016, 41, 425–452. [Google Scholar] [CrossRef]
  7. Wang, Z.H.; Cheng, P.F. China’s Carbon Lock-In and Unlocking in the Context of Carbon Loading. Resour. Sci. 2016, 38, 909–917. [Google Scholar] [CrossRef]
  8. Xu, Y.; Dong, B.; Chen, Y.; Qi, H. Effect of industrial transfer on carbon lock-in: A spatial econometric analysis of Chinese cities. J. Environ. Plan. Manag. 2022, 65, 1024–1055. [Google Scholar] [CrossRef]
  9. Zhao, C.; Dong, K.; Zheng, S.; Fu, X.; Wang, K. Can China’s aviation network development alleviate carbon lock-in? Transp. Res. Part D Transp. Environ. 2023, 115, 103578. [Google Scholar] [CrossRef]
  10. Chen, Y.; Liu, K.; Ni, L.; Chen, M. Impact of carbon lock-in on green economic efficiency: Evidence from Chinese provincial data. Sci. Total Environ. 2023, 892, 164581. [Google Scholar] [CrossRef]
  11. Carley, S. Historical analysis of US electricity markets: Reassessing carbon lock-in. Energy Policy 2011, 39, 720–732. [Google Scholar] [CrossRef]
  12. Dong, K.; Jia, R.; Zhao, C.; Wang, K. Can smart transportation inhibit carbon lock-in? The case of China. Transp. Policy 2023, 142, 59–69. [Google Scholar] [CrossRef]
  13. Mattauch, L.; Creutzig, F.; Edenhofer, O. Avoiding carbon lock-in: Policy options for advancing structural change. Econ. Model. 2015, 50, 49–63. [Google Scholar] [CrossRef]
  14. Liang, Z. Industry carbon lock-in: The connotation, causes and unlocking policy—Based on the perspective of less-developed areas in China. Stud. Sci. Sci. 2017, 35. [Google Scholar] [CrossRef]
  15. Zhao, C.; Dong, K.; Wang, K.; Taghizadeh-Hesary, F. How can Chinese cities escape from carbon lock-in? The role of low-carbon city policy. Urban Clim. 2023, 51, 101629. [Google Scholar] [CrossRef]
  16. Yang, Y.; Wei, X.; Wei, J.; Gao, X. Industrial structure upgrading, green total factor productivity and carbon emissions. Sustainability 2022, 14, 1009. [Google Scholar] [CrossRef]
  17. Zhao, C. Can industrial structure optimization and industrial structure transition both lead to carbon lock-in mitigation? The case of China. Environ. Sci. Pollut. Res. 2024, 31, 23247–23261. [Google Scholar] [CrossRef]
  18. Zhao, C.; Wang, J.; Dong, K.; Wang, K. How does renewable energy encourage carbon unlocking? A global case for decarbonization. Resour. Policy 2023, 83, 103622. [Google Scholar] [CrossRef]
  19. Poutanen, P.; Soliman, W.; Ståhle, P. The complexity of innovation: An assessment and review of the complexity perspective. Eur. J. Innov. Manag. 2016, 19, 189–213. [Google Scholar] [CrossRef]
  20. Doğan, B.; Driha, O.M.; Lorente, D.B.; Shahzad, U. The mitigating effects of economic complexity and renewable energy on carbon emissions in developed countries. Sustain. Dev. 2021, 29, 1–12. [Google Scholar] [CrossRef]
  21. Wang, F.; Li, H.; Cao, Y.; Zhang, C.; Ran, Y. Knowledge sharing strategy and emission reduction benefits of low carbon technology collaborative innovation in the green supply chain. Front. Environ. Sci. 2022, 9, 783835. [Google Scholar] [CrossRef]
  22. Hidalgo, C.A.; Klinger, B.; Barabási, A.-L.; Hausmann, R. The product space conditions the development of nations. Science 2007, 317, 482–487. [Google Scholar] [CrossRef]
  23. Tacchella, A.; Cristelli, M.; Caldarelli, G.; Gabrielli, A.; Pietronero, L. A new metrics for countries’ fitness and products’ complexity. Sci. Rep. 2012, 2, 723. [Google Scholar] [CrossRef] [PubMed]
  24. Tacchella, A.; Mazzilli, D.; Pietronero, L. A dynamical systems approach to gross domestic product forecasting. Nat. Phys. 2018, 14, 861–865. [Google Scholar] [CrossRef]
  25. Foxon, T.J. Technological Lock-In and the Role of Innovation. In Handbook of Sustainable Development; Edward Elgar Publishing: London, UK, 2014; pp. 304–316. [Google Scholar] [CrossRef]
  26. Grillitsch, M.; Nilsson, M. Innovation in peripheral regions: Do collaborations compensate for a lack of local knowledge spillovers? Ann. Reg. Sci. 2015, 54, 299–321. [Google Scholar] [CrossRef]
  27. Lin, S.; Zhou, Z.; Hu, X.; Chen, S.; Huang, J. How can urban economic complexity promote green economic growth in China? The perspective of green technology innovation and industrial structure upgrading. J. Clean. Prod. 2024, 450, 141807. [Google Scholar] [CrossRef]
  28. Zheng, Q.; Wan, L.; Wang, S.; Chen, Z.; Li, J.; Wu, J.; Song, M. Will informal environmental regulation induce residents to form a green lifestyle? Evidence from China. Energy Econ. 2023, 125, 106835. [Google Scholar] [CrossRef]
  29. Geng, K.; Zhang, X.; Jiang, H.; Zhuang, Z. The spatio-temporal characteristics and dynamic evolution of coupling and coordinated development of innovation factor allocation and green economy in China. Front. Environ. Sci. 2024, 12, 1475508. [Google Scholar] [CrossRef]
  30. Fang, H.; Huo, Q.; Hatim, K. Can digital services trade liberalization improve the quality of green innovation of enterprises? Evidence from China. Sustainability 2023, 15, 6674. [Google Scholar] [CrossRef]
  31. Bai, J.; Jiang, F. Collabo rative innovation, spatial correlation, and regional innovation performance. Econ. Res. 2015, 50, 174–187. [Google Scholar]
  32. Liu, Y.; Ren, T.; Liu, L.; Ni, J.; Yin, Y. Heterogeneous industrial agglomeration, technological innovation and haze pollution. China Econ. Rev. 2023, 77, 101880. [Google Scholar] [CrossRef]
  33. Fu, H.; Mao, Y.; Song, L. Empirical study on the impact of innovation on the upgrading of industrial structure: Based on inter provincial panel data from 2000 to 2011. China Ind. Econ. 2013, 9, 56–68. [Google Scholar] [CrossRef]
  34. Li, H.; Du, X.; Yan, X.-W.; Xu, N. Digital Transformation and Urban Green Development: Evidence from China’s Data Factor Marketization. Sustainability 2024, 16, 4511. [Google Scholar] [CrossRef]
  35. Niu, H.; Liu, Z. Measurement on carbon lock-in of China based on RAGA-PP model. Carbon Manag. 2021, 12, 451–463. [Google Scholar] [CrossRef]
  36. Lin, B.; Du, K. The Impact of Factor Market Distortion on Energy Efficiency. Econ. Res. 2013, 48, 125–136. [Google Scholar]
  37. Pastor, J.T.; Lovell, C.A.K. A global Malmquist productivity index. Econ. Lett. 2005, 88, 266–271. [Google Scholar] [CrossRef]
  38. Fukuyama, H.; Weber, W.L. A directional slacks-based measure of technical inefficiency. Socio-Econ. Plan. Sci. 2009, 43, 274–287. [Google Scholar] [CrossRef]
  39. Gan, C.H.; Zheng, R.G.; Yu, X.B. The Impact of China’s Industrial Structure Changes on Economic Growth and Fluctuations. Econ. Res. 2011, 46, 4–16+31. [Google Scholar]
  40. Donoso, J.F. A simple index of innovation with complexity. J. Informetr. 2017, 11, 1–17. [Google Scholar] [CrossRef]
  41. Okombi, I.F.; Lebomoyi, N.E. Economic complexity and inclusive green growth: The moderating role of public expenditure on education. J. Environ. Stud. Sci. 2024, 1–31. [Google Scholar] [CrossRef]
  42. Wei, L.; Lin, B.; Zheng, Z.; Wu, W.; Zhou, Y. Does fiscal expenditure promote green technological innovation in China? Evidence from Chinese cities. Environ. Impact Assess. Rev. 2023, 98, 106945. [Google Scholar] [CrossRef]
  43. Chu, M.; Jin, T. Government Paradox, State Owned Enterprise Monopoly, and Income Gap: An Empirical Test Based on the Characteristics of China’s Transformation. China Ind. Econ. 2013, 2, 18–30. [Google Scholar] [CrossRef]
  44. Jin, L.Q.; Lin, J.Z.; Ding, S.S. The impact of administrative monopoly on resource misallocation caused by ownership differences. China Ind. Econ. 2015, 4, 31–43. [Google Scholar] [CrossRef]
  45. Chen, L.; Luo, L.Y.; Kang, N. Administrative Monopoly and Factor Price Distortion: An Empirical Test Based on Industry wide Data and Endogenous Perspective in China. China Ind. Econ. 2016, 1, 52–66. [Google Scholar] [CrossRef]
  46. Liu, Z.; Tong, Z.; Zhang, Z. Government expenditure structure, technological progress and economic growth. Int. J. Emerg. Mark. 2024, 19, 3729–3767. [Google Scholar] [CrossRef]
  47. Jiang, T. Mediation and moderation effects in empirical research on causal inference. China Ind. Econ. 2022, 5, 100–120. [Google Scholar] [CrossRef]
  48. Kim, J.; Sovacool, B.K.; Bazilian, M.; Griffiths, S.; Lee, J.; Yang, M.; Lee, J. Decarbonizing the iron and steel industry: A systematic review of sociotechnical systems, technological innovations, and policy options. Energy Res. Soc. Sci. 2022, 89, 102565. [Google Scholar] [CrossRef]
  49. Cheng, C.; Ren, X.; Dong, K.; Dong, X.; Wang, Z. How does technological innovation mitigate CO2 emissions in OECD countries? Heterogeneous analysis using panel quantile regression. J. Environ. Manag. 2021, 280, 111818. [Google Scholar] [CrossRef]
  50. Sun, Y.; Guan, W.; Mehmood, U.; Yang, X. Asymmetric impacts of natural resources on ecological footprints: Exploring the role of economic growth, FDI and renewable energy in G-11 countries. Resour. Policy 2022, 79, 103026. [Google Scholar] [CrossRef]
  51. Zhu, B.; Zhang, T. The impact of cross-region industrial structure optimization on economy, carbon emissions and energy consumption: A case of the Yangtze River Delta. Sci. Total Environ. 2021, 778, 146089. [Google Scholar] [CrossRef]
  52. Shao, S.; Li, X.; Cao, J.H. Economic policy choices for haze pollution control in China: A perspective based on spatial spillover effects. Econ. Res. 2016, 51, 73–88. [Google Scholar]
  53. Shi, X.; Chen, Y.; Xia, M.; Zhang, Y. Effects of the talent war on urban innovation in China: A difference-in-differences analysis. Land 2022, 11, 1485. [Google Scholar] [CrossRef]
  54. Notice of the Shenzhen Municipal People’s Government on Issuing the Implementation Plan for the National Carbon Peak Pilot Program (Shenzhen). Available online: https://www.sz.gov.cn/gkmlpt/content/11/11478/post_11478512.html?jump=true#20044/ (accessed on 1 August 2024).
Figure 1. Logical analysis diagram of KCI, factor allocation effect, efficiency enhancement effect, structural upgrading effect, and CLI.
Sustainability 17 02985 g001
Table 1. Research hypothesis.
Sequence NumberResearch Hypothesis
H1KCI has a significant direct negative impact on CLI
H2KCI has a significant negative impact on CLI through factor allocation
H3KCI has a significant negative impact on CLI through efficiency enhancement
H4KCI has a significant negative impact on CLI through industrial structure upgrading
H5The impact of KCI on CLI has significant spatial spillover effects
Table 2. Construction of CLI indicators.
IndicatorMeasurementAttributeWeighting
Industry lock-inX1: The proportion of value added by the secondary industry in relation to GDP+0.0753481
X2: The proportion of fixed asset investment to GDP+0.0769402
X3: The proportion of fixed capital consumption in GDP+0.0756376
Institutional lock-inX4: Mining industry employment+0.0799916
Y1: Financial technology expenditure0.0749214
Y2: The proportion of GDP allocated to environmental pollution control investment0.0750689
Technological lock-inX5: Carbon emission intensity (the ratio of total carbon emissions to gross domestic product)+0.0777466
Y3: The ratio of R&D expenditure to GDP0.0751379
X6: Energy intensity (the ratio of total energy consumption to gross domestic product)+0.0769268
Social behavior lock-inX7: Regional GDP per capita+0.0783321
X8: Private vehicle ownership+0.0764209
X9: Total passenger turnover+0.0778342
X10: Level of Household Consumption Carbon Emissions+0.0796936
Table 3. Descriptive statistics.
VariableMeanStd. Dev.MinMax
CLI0.3881740.0603360.2030950.570833
KCI9.92429827.45552.90e-06197.1515
FAC41.15412021.9245500.00000093.015570
GTFP11.2279506.6359450.83894721.333130
SU1.2141070.6589860.5182445.689837
Log GDP10.276280.8901567.92262412.20746
Green finance0.2806320.1226670.0533360.663902
Industrialization0.4198150.0822360.1491200.619602
Government intervention0.0916660.2887550.0000001.000000
International trade0.4147590.4505410.0103282.164697
Informatization0.0528080.0204450.0186570.120717
CLI, carbon lock-in; KCI, knowledge complexity index; FAC, factor misallocation index; GTFP, green total factor productivity; SU, structural upgrading.
Table 4. Main regression analysis.
(1)(2)(3)(4)
VARIABLESCLICLICLICLI
KCI−0.006775 **−0.006695 **−0.007841 ***−0.007704 ***
(−2.555590)(−2.561340)(−2.958993)(−3.070387)
Log GDP −0.035605 ***−0.078344 ***−0.085884 ***
(−5.606946)(−11.768739)(−12.999812)
Green finance −0.182946 ***−0.124713 ***−0.134749 ***
(−5.067822)(−3.308965)(−3.586820)
Industrialization 0.075280 ***0.068459 ***
(3.924726)(3.401889)
Government intervention −0.010590 ***−0.009164 **
(−2.589086)(−2.482322)
International trade 0.011621 *
(1.824784)
Informatization −0.101484
(−1.065210)
Constant0.388846 ***0.432575 ***0.381305 ***0.385618 ***
(511.617605)(45.635395)(25.386527)(22.847044)
Time FEYYYY
Province FEYYYY
Observations720720720720
R-squared0.9080.9130.9150.916
Note: ***, ** and * represent significance at 1%, 5% and 10%.
Table 5. Robustness tests.
(1)(2)(3)(4)(5)
VARIABLESCLICO2 Emission LevelsCLIKCICLI
KCI −0.037151 ***−0.006768 ** −0.001127 ***
(−3.03482979)(−2.262257) (−2.711544)
L.KCI−0.006095 ** 0.175851 ***
(−2.345108) (4.748336)
Constant0.391276 ***0.076773 *0.370119 ***−22.780056 ***0.270815 ***
(21.807236)(1.81820730)(23.196281)(−3.150920)(15.015092)
Control variableYesYesYesYesYes
Time FEYesYesYesYesYes
Province FEYesYesYesYesYes
Observations690720624690690
R-squared0.9160.4820.904 0.368
Note: ***, ** and * represent significance at 1%, 5% and 10%.
Table 6. Robustness Tests.
(1)(2)(3)(4)
VARIABLESKCICLIKCICLI
KCI −0.004295 *** −0.004295 ***
(−2.609568) (−2.609568)
Innovation6.188757 ***
Capacity(2.693674)
Government 0.069621 ***
Expenditure (8.124164)
Constant−34.542355 ***0.205840 ***−10.4288470.205840 ***
(−4.289856)(4.087113)(−1.495627)(4.087113)
Control variableYesYesYesYes
Time FEYesYesYesYes
Province FEYesYesYesYes
Observations720720720720
R-squared −2.350 −2.350
Note: *** represents significance at 1%.
Table 7. Heterogeneity tests.
(1)(2)(3)(4)(5)
EastMiddleWestRegions South of the Qinling–Huaihe LineRegions North of the Qinling–Huaihe Line
VARIABLESCLICLICLICLICLI
KCI−0.005291 **−0.0102680.020644−0.005429 **−0.007219
(−2.260722)(−0.914894)(1.095121)(−2.247828)(−1.006186)
Constant0.417985 ***0.541437 ***0.209316 ***0.339502 ***0.299358 ***
(8.566667)(26.915343)(6.818071)(14.013773)(14.098862)
Control variableYesYesYesYesYes
Time FEYesYesYesYesYes
Province FEYesYesYesYesYes
Observations264192264360360
R-squared0.9460.9670.8590.8920.928
Note: *** and ** represent significance at 1% and 5%.
Table 8. Heterogeneity tests.
(1)(2)(3)(4)(5)(6)
High Infrastructure LevelLow Infrastructure LevelHigh Proportion of State-Owned EnterprisesLow Proportion of State-Owned EnterprisesHigh Proportion of Government ExpenditureLow Proportion of Government Expenditure
VARIABLESCLICLICLICLICLICLI
KCI−0.005737 **−0.012837−0.001437−0.006419 **−0.004975 **−0.020579
(−2.396934)(−1.433724)(−0.879949)(−2.060176)(−2.111812)(−1.527647)
Constant0.432333 ***0.354731 ***0.328066 ***0.306137 ***0.385361 ***0.416149 ***
(10.300229)(13.772291)(14.768112)(6.119217)(10.554369)(15.206013)
Control variableYesYesYesYesYesYes
Time FEYesYesYesYesYesYes
Province FEYesYesYesYesYesYes
Observations358359360360359360
R-squared0.9600.9140.9490.9520.9260.888
Note: *** and ** represent significance at 1% and 5%.
Table 9. Mediation Mechanism Testmechanism test.
(1)(2)(3)
VARIABLESFACGTFPSU
KCI−1.101084 ***0.155657 **0.081745 **
(−5.307860)(2.008937)(2.379080)
Constant71.541266 ***18.493235 ***10.975731 ***
(17.165629)(23.053097)(8.644063)
Control variableYesYesYes
Time FEYesYesYes
Province FEYesYesYes
Observations720720720
R-squared0.6190.3770.940
Note: *** and ** represent significance at 1% and 5%. CLI, carbon lock-in; KCI, knowledge complexity index; FAC, factor misallocation index; GTFP, green total factor productivity; SU, structural upgrading.
Table 10. Spatial spillover effects test.
(1)(2)(3)(4)(5)(6)
VARIABLESMainWxSpatialLR_DirectLR_IndirectLR_Total
KCI−0.007356 ***−0.006393 −0.007797 ***−0.012476−0.020272 **
(−2.793730)(−1.048251) (−2.762572)(−1.459781)(−2.037648)
rho 0.314112 ***
(5.448416)
Control variableYesYesYesYesYesYes
Time FEYesYesYesYesYesYes
Province FEYesYesYesYesYesYes
Observations720720720720720720
R-squared0.0760.0760.0760.0760.0760.076
Number of id303030303030
Note: *** and ** represent significance at 1% and 5%.
Disclaimer/Publisher’s Note: The statements, opinions and data contained in all publications are solely those of the individual author(s) and contributor(s) and not of MDPI and/or the editor(s). MDPI and/or the editor(s) disclaim responsibility for any injury to people or property resulting from any ideas, methods, instructions or products referred to in the content.

