Article

Advancing Sustainable Mobility: Artificial Intelligence Approaches for Autonomous Vehicle Trajectories in Roundabouts

by
Salvatore Leonardi
1,*,
Natalia Distefano
1 and
Chiara Gruden
2
1
Department of Civil Engineering and Architecture, University of Catania, Viale Andrea Doria, 6, 95125 Catania, Italy
2
Faculty of Civil Engineering, Transportation Engineering and Architecture, University of Maribor, Smetanova Ulica 17, 2000 Maribor, Slovenia
*
Author to whom correspondence should be addressed.
Sustainability 2025, 17(7), 2988; https://doi.org/10.3390/su17072988
Submission received: 26 February 2025 / Revised: 25 March 2025 / Accepted: 26 March 2025 / Published: 27 March 2025

Abstract

:
This study develops and evaluates advanced predictive models for the trajectory planning of autonomous vehicles (AVs) in roundabouts, with the aim of significantly contributing to sustainable urban mobility. Starting from the “MRoundabout” speed model, several Artificial Intelligence (AI) and Machine Learning (ML) techniques, including Linear Regression (LR), Random Forest (RF), Support Vector Regression (SVR), Gradient Boosting Regression (GBR), and Neural Networks (NNs), were applied to accurately emulate human driving behavior and optimize AV trajectories. The results indicate that neural networks achieved the best predictive performance, with R2 values of up to 0.88 for speed prediction, 0.98 for acceleration, and 0.94 for differential distance, significantly outperforming traditional models. GBR and SVR provided moderate improvements over LR but encountered difficulties predicting acceleration and distance variables. AI-driven tools, such as ChatGPT-4, facilitated data pre-processing, model tuning, and interpretation, reducing computational time and enhancing workflow efficiency. A key contribution of this research lies in demonstrating the potential of AI-based trajectory planning to enhance AV navigation, fostering smoother, safer, and more sustainable mobility. The proposed approaches contribute to reduced energy consumption, lower emissions, and decreased traffic congestion, effectively addressing challenges related to urban sustainability. Future research will incorporate real traffic interactions to further refine the adaptability and robustness of the model.

1. Introduction

The advent of autonomous vehicles (AVs) has ushered in a new era in transportation, offering significant advances in traffic efficiency, vehicle coordination and passenger comfort. Despite these potential benefits, the development of AVs faces numerous challenges, particularly in trajectory planning and decision making. The ability of AVs to navigate complex driving scenarios, such as roundabouts, intersections, and other dynamic environments, depends on their ability to replicate or improve on human driving behavior in terms of adaptability and efficiency.
Among these scenarios, roundabouts present unique challenges compared to other types of intersections. Unlike conventional signalized intersections, where vehicle movement is controlled by clear signals, roundabouts require continuous vehicle movement without full stops, which requires a greater ability to anticipate human-driven vehicle behavior and dynamically adjust speed to ensure smooth traffic flow. In addition, roundabouts’ geometric complexity, the fluctuating traffic density, and the need for AVs to respond to human drivers in real time make trajectory planning even more challenging. A comparative study has shown that the autonomous management of roundabouts requires more advanced predictive models to reduce passage times and minimize disruptions to existing traffic flow [1]. Another study found that the introduction of connected and AVs in roundabouts can increase traffic capacity by 58–73% compared to conventional traffic flows [2].
In addition to roundabouts and signalized intersections, intersections with stop control also pose another major challenge for AVs. Unlike roundabouts, where movement is continuous, or signalized intersections, where clear traffic phases dictate movement, stop-controlled intersections require AVs to make more conservative decisions to ensure safety when merging with cross traffic. A recent study has shown that stop-controlled intersections require more complex predictive models, as AVs must balance assertiveness and safety when yielding to oncoming traffic [3].
This research focuses on the development of predictive models to improve the trajectory planning of AVs. Among these models, a special speed model called “MRoundabout” was developed in a previous study to replicate human driving behavior in roundabouts [4]. This model is important as it forms the basis for understanding and predicting vehicle behavior in these complex environments and provides the basic speed profiles required for further predictive modeling. However, existing approaches to trajectory planning often struggle to account for the stochastic nature of real-world driving, where human drivers exhibit different behaviors depending on external factors such as road conditions, visibility, and congestion. Studies have shown that conventional trajectory planning approaches tend to be too conservative in such scenarios, which can reduce efficiency without eliminating safety risks [5]. Other research has shown that robust trajectory planning methods need to integrate stochastic prediction models to adequately account for the variability of real-world driving conditions [6]. To account for these factors, models are needed that can dynamically adapt to different driving conditions while ensuring optimal safety and efficiency.
Recent advances in the field of Artificial Intelligence (AI), particularly Machine Learning (ML), offer promising opportunities to improve the trajectory planning of AVs by leveraging large datasets on human driving behavior. By using ML models, AVs can learn from empirical data to predict optimal speed profiles and trajectories that mimic human-like driving patterns while maintaining high safety standards. In particular, the integration of AI-based models enables AVs to process extensive data from sensors, cameras and LiDAR systems so that they can make real-time trajectory adjustments in response to dynamic traffic environments. These capabilities are critical to ensure smooth and efficient navigation through roundabouts, where there are frequent accelerations and decelerations due to incoming and circulating vehicles. Research has shown that machine learning models that integrate sensor data from LiDAR, cameras, and GPS significantly improve the accuracy and reliability of trajectory prediction, increasing safety and reducing collision risk [7]. In addition, deep fusion approaches combining LiDAR and cameras have been shown to optimize trajectory planning and perform better in complex driving scenarios than single-sensor methods [8]. Another study highlights the importance of perception-based trajectory planning in real-time dynamic environments, where AI-based models enable rapid acceleration and deceleration adjustments [9]. Finally, the AI-assisted fusion of multi-sensor data is crucial for AVs to efficiently navigate dynamic environments by processing large datasets in real time [10].
Furthermore, advanced AI-supported trajectory planning for AVs can play an important role in promoting sustainable urban mobility. By optimizing vehicle trajectories to reduce unnecessary acceleration and braking, AVs can significantly reduce energy consumption and pollutant emissions, thus directly contributing to environmental sustainability. In addition, improved trajectory planning promotes smoother traffic flow and less congestion, addressing key socio-economic and environmental challenges in urban contexts.
This study integrates advanced ML techniques such as Linear Regression (LR), Random Forest (RF), Support Vector Regression (SVR), Gradient Boosting Regression (GBR), and Neural Networks (NNs) to improve the prediction accuracy of speed, acceleration, and distance variables based on the geometric features of roundabouts.
The main objective of this research is to develop and evaluate a set of predictive models that can accurately replicate human driving behavior in roundabouts and improve the trajectory planning capabilities of AVs. Through a comparative analysis of different AI techniques, this study aims to determine which models best deal with the non-linearity of vehicle movement and provide the most reliable trajectory predictions. Furthermore, the study investigates how the inclusion of real-world driving data can improve the model’s adaptability to ensure that AVs can navigate roundabout geometries with minimal risk of collisions or abrupt maneuvers. Such improvements can further strengthen the contribution of AVs to sustainable mobility by increasing both safety and traffic efficiency. This approach involves rigorous model calibration and validation with empirical data collected at multiple roundabouts to ensure the robustness and generalizability of the proposed models.
This paper is organized as follows: The Section 2 (Literature Review) provides a comprehensive overview of the previous research on trajectory planning for AVs and highlights key studies, methods, and research gaps that are directly relevant to the objectives of this study. The Section 3 (Methodology) describes the machine learning techniques used in this study, including Linear Regression, Random Forest, Support Vector Regression, Gradient Boosting Regression and Neural Networks. It also integrates the basic MRoundabout speed model, detailing the stages of data collection, design, training, and validation to ensure its applicability for modeling human driving behavior. In addition, this section discusses the impact of different environmental and traffic conditions on AV trajectory planning, emphasizing the importance of robust model adaptability in real-world scenarios. It also explains the role of advanced tools such as ChatGPT-4 in streamlining data pre-processing, optimizing model parameters, and improving the overall workflow. The Section 4 (Results and Discussion) evaluates the performance of the prediction models, compares their accuracy using metrics such as Mean Squared Error (MSE) and the Coefficient of Determination (R2), and considers the wider implications of these results for AV trajectory planning. Finally, the Section 5 (Conclusions) summarizes the key findings of the study, highlights the fundamental role of NNs in trajectory prediction, and outlines possible future research directions, such as incorporating traffic interactions and exploring hybrid modeling techniques.

2. Literature Review

Trajectory planning for autonomous vehicles (AVs) plays a central role in efficient and reliable navigation, especially in complex driving environments. Over the years, numerous algorithms and approaches have been proposed by researchers that have significantly advanced the understanding and refinement of trajectory planning for AVs.
An important focus in the recent literature is real-time path planning, which is crucial for coping with dynamic driving scenarios and unexpected obstacles. An et al. presented a real-time algorithm that utilizes lane information, minimum turning radius, and driving radius to dynamically adjust vehicle positioning. This effectively accounted for environmental uncertainties and demonstrated a robust performance in real-time scenarios [11]. Tezerjani et al. have proposed a robust algorithm tailored for autonomous vehicles driving in dynamic environments with moving obstacles. Their approach introduces innovations such as defining the path density by adjusting the number of waypoints along the trajectory and integrating hierarchical motion planning algorithms. This combination optimizes the distribution of waypoints in terms of accuracy in curved areas and reduces computational complexity in straight sections, improving real-time adaptability [12].
In urban driving scenarios, trajectory smoothness and adaptability remain a major challenge. Jie et al. developed an efficient trajectory planning system for autonomous driving in complex dynamic scenarios through the iterative and incremental optimization of trajectory speed. Their method uses a Gaussian process-based path planner to generate continuous parameterized paths with arc length in the Frenét framework, taking into account static obstacle avoidance and curvature constraints. An efficient s-t graph search method is introduced to find a velocity profile along the generated path to deal with dynamic environments and ensure smooth and adaptive trajectories [13].
In addition, Jiang et al. presented a framework for a robust system for planning autonomous driving in urban environments, which includes trajectory refinement, trajectory interpolation, static and dynamic obstacle avoidance, and trajectory tracking. Their approach smooths the original road centerline using cubic splines and uses fifth-order Bezier curves to generate human-like trajectories that guarantee at least second-order continuity and curvature continuity. This system is the answer to the challenges of trajectory smoothing and adaptability in urban driving scenarios [14].
These recent studies highlight the ongoing advances in real-time path planning and trajectory smoothing for autonomous vehicles that address dynamic driving scenarios and improve adaptability in complex environments.
Recent advances emphasize the use of machine learning (ML) and artificial intelligence (AI) techniques to improve the accuracy of trajectory planning and manage complex dynamic traffic environments more effectively. Reinforcement learning (RL), such as the hierarchical framework proposed by Wang et al., has been effectively applied to dynamically generate trajectories, which is particularly beneficial in real-time scenarios involving lane changes [15]. Complementing these developments, Liu et al. provided a comprehensive review of deep learning approaches, emphasizing the importance of advanced neural networks to improve the accuracy and robustness of vehicle trajectory prediction [16]. Among the various deep learning techniques, Jiang et al. identified Long Short-Term Memory (LSTM) networks as particularly effective, consistently outperforming alternatives such as Gated Recurrent Units (GRUs) and Stacked Autoencoders (SAEs) in predicting vehicle trajectories [17].
Recent developments in Transformer-based architectures have further improved the performance of trajectory prediction, especially under dynamic driving conditions. Vision transformers (ViTs) and transformer-based reinforcement learning models have shown exceptional efficiency in capturing complex spatio-temporal dependencies. For example, Xu et al. (2022) proposed a Transformer-based motion trajectory prediction model that integrates self-observation mechanisms to learn complex motion patterns in urban driving scenarios, outperforming traditional LSTM-based models in terms of generalization ability [18]. Furthermore, deep reinforcement learning (DRL) has been applied to autonomous navigation. Policy optimization algorithms such as Proximal Policy Optimization (PPO) and Soft Actor-Critic (SAC) have been used to improve decision making in highly interactive traffic environments [19]. Amin et al. introduced a transformer-based model specifically designed for trajectory prediction in urban environments. By effectively capturing spatio-temporal dependencies among vehicles through an eight-neighborhood representation and leveraging a transformer network, their approach significantly outperformed traditional recurrent architectures such as LSTMs, achieving a superior generalization and predictive accuracy while reducing training times [20]. Furthermore, Deep Reinforcement Learning (DRL) has improved the decision making of autonomous vehicles, especially in complex intersection scenarios. Li et al. proposed a DRL-based system using convolutional neural networks and deep Q-networks to optimize driving strategies and showed improved safety and efficiency at accident-prone intersections [21].
Graph Neural Networks (GNNs) represent an important advance in predicting trajectories for autonomous vehicles (AVs), as they significantly improve the modeling of interaction between dynamic road users. Singh and Srivastava proposed a multiscale GNN with temporal feature modeling to predict the trajectories of dynamic agents in interactive and uncertain environments. Their approach effectively captures spatio-temporal correlations and outperforms state-of-the-art methods, especially in sparse datasets, making it highly relevant for AV navigation in complex environments [22]. In addition, GNNs have been explored to improve the prediction of AV trajectories by modeling interactions between multiple road users. Studies such as that of Jiao et al. (2023) have shown that GNN-based trajectory planning systems significantly improve the consistency of trajectories and reduce the risk of collisions in roundabouts [23]. These results suggest that the inclusion of Transformers, deep reinforcement learning, and graph-based learning in trajectory planning could lead to more adaptable and robust autonomous driving models.
Trait selection and adaptability have also attracted considerable attention. Bani-Hani et al. employed decision trees and Naive Bayes classifiers to predict trajectories and refined their results by using random forest regressors to improve feature selection and prediction accuracy [24]. Complementing these studies, Hao et al. introduced an online learning system that enables real-time updates based on sequential historical data and effectively reduces prediction errors under dynamically changing traffic conditions [25]. The integration of control mechanisms with machine learning was further explored by Jardine et al. who achieved a significant improvement in trajectory accuracy and robust obstacle avoidance for autonomous quadrotors using Model Predictive Control (MPC) in conjunction with machine learning techniques [26]. Ghariblu and Moghaddam extended their adaptive methods to highway driving to optimize traffic flow, improve safety, and significantly reduce congestion [27].
High-resolution digital maps combined with advanced trajectory planning algorithms further improve the precision of AV navigation. Bajić et al. demonstrated the benefits of incorporating detailed road geometries and traffic rules using digital maps, achieving significant improvements in AV navigation accuracy in an urban context [28]. Wang et al. improved the Hybrid-A* algorithm by incorporating vehicle dynamics and specific road conditions, enabling safer and more realistic trajectory predictions that are particularly suitable for complex urban driving environments [29]. In addition, Hu et al. introduced a hybrid approach that combines sampling-based planners with optimization techniques, significantly improving the accuracy of trajectory planning and ensuring reliable obstacle avoidance in both static and dynamic scenarios [30].
Recent studies have extended trajectory planning methods specifically for larger vehicles such as autonomous buses navigating in dynamic environments. Waleed et al. addressed the unique challenges posed by larger vehicles by integrating real-time data processing and advanced predictive models, creating a flexible framework that can be adapted to public transportation systems [31]. Said et al. validated combined reactive–deliberative methods specifically designed for static and dynamic obstacle avoidance to improve the operational safety of AVs in different scenarios [32]. Levy and Haddad focused on non-linear model predictive control (NMPC) strategies for unstructured road navigation without well-defined lanes and emphasized the robustness and smoothness of the trajectories that can be achieved even under extremely challenging driving conditions [33]. In addition, Zhang et al. successfully integrated human-like behavior models into AV trajectory planning, significantly improving traffic rule compliance, trajectory realism, and passenger comfort, which is especially important in urban driving scenarios [34].
To summarize, the literature reveals important trends in AV trajectory planning: the integration of human driving behavior models, real-time adaptability, and robust control mechanisms are central to improving AV navigation. Advances in machine learning, particularly hybrid and hierarchical methods, have shown significant potential to improve the accuracy of predictions and the robustness of trajectories. These findings form the basis for tackling complex driving environments such as roundabouts, where the geometric and dynamic interactions require sophisticated, adaptive solutions.
To summarize, the literature reveals the following important trends in AV trajectory planning:
  • The integration of human driving behavior models, real-time adaptability, and robust control mechanisms are central to improving AV navigation.
  • Advances in Machine Learning, especially hybrid and hierarchical methods, have shown significant potential to improve the accuracy of predictions and the robustness of trajectories.
  • Deep Learning, Transformer-based architectures, and Deep Reinforcement Learning are emerging as state-of-the-art approaches that enable AVs to make more accurate, adaptive and context-aware trajectory decisions.
  • Graph Neural Networks (GNNs) and attention mechanisms show promise in capturing interactions between road users and improving AVs’ decision making in complex environments.
These findings form the basis for tackling complex driving environments such as roundabouts, where geometric and dynamic interactions require sophisticated, adaptive solutions. Future research should further investigate the integration of Transformers, DRL, and GNNs into trajectory planning systems to improve the robustness and adaptability of AV systems in the real world.

3. Methodology

This study aims to develop new predictive models for trajectory planning in AVs based on the fundamental results of the MRoundabout model [4]. The main objective is to use the speed profiles generated by MRoundabout to train ML models capable of emulating human driving behavior in roundabouts. These predictive models are designed to account for the complexity of speed, acceleration, and distance variables and ensure a robust and adaptive performance in real-world scenarios.
The problem under investigation relates specifically to the challenges of trajectory planning in roundabouts, where vehicles are subject to constant variations in curvature, acceleration, and deceleration. In contrast to straight road sections, roundabouts require dynamic speed adjustments based on the entry and exit radii, the road geometry, and the required maneuverability of the vehicle. Smooth and efficient navigation in such environments is crucial for autonomous driving systems, as errors in predicting trajectories can lead to suboptimal paths, unnecessary braking, or disruption to traffic flow.
To address these challenges, this study builds on the MRoundabout model, which provides a structured framework for defining speed profiles based on geometric constraints. By incorporating advanced AI techniques, including NNs and ensemble-based learning methods, this work aims to refine prediction accuracy beyond traditional kinematic or rule-based models. The methodology explicitly considers how different machine learning models interpret and adapt to the geometric constraints of roundabouts, providing a comparative evaluation of their performance in emulating realistic driving behavior.

3.1. Predictive Models

The predictive models trained and evaluated in this study include LR, RF, SVR, GBR, and NNs. Each model is configured using the collected data and trained to predict speed, acceleration and various distance variables based on geometric attributes of roundabouts. The selection of these AI models, particularly from the ML subset, is based on their proven effectiveness in dealing with different data structures and complexities.
An important aspect in the training of prediction models is the control of overfitting [35]. Since some methods, such as NNs and GBR, tend to overfit the training data, we implemented a number of regularization strategies. For GBR, a mechanism for the early termination of training was applied if the validation loss did not improve in 10 consecutive iterations. For the NNs, dropout was applied in the hidden layers (set to 20%) and L2 regularization (weight reduction) was used to reduce overfitting. To assess the true predictive ability of the models, we explicitly separated the training, validation and test sets and used five-fold cross-validation. These steps ensured that the models did not over-adapt to the training data and could effectively generalize to unseen data.
The basic model used was LR, which is valued for its straightforwardness and ease of interpretation. Despite its simplicity, it often provides reliable results and serves as a benchmark for evaluating more complex models [36,37,38]. LR is indeed a ML technique, especially in the field of supervised learning, where continuous outcomes are predicted based on input features [39,40]. RF and GBR are chosen for their ensemble methods that improve the predictive power by combining the results of multiple decision trees [41,42,43]. These techniques are characterized by their ability to capture complicated, non-linear relationships and interactions within the data. SVR is chosen for its ability to manage high-dimensional datasets and model complex, non-linear relationships through kernel functions. This makes SVR particularly suitable for complicated data, where linear models may not be sufficient [44,45]. NNs are included due to their powerful ability to model very complex, non-linear patterns. With their multi-layered architecture, NNs can recognize complex relationships in large, high-dimensional datasets, making them particularly effective for the detailed data used in this study [46,47].

3.1.1. Linear Regression

LR is a fundamental and widely used statistical method for modeling the relationship between a dependent variable and one or more independent variables. It assumes a linear relationship between the input features and the target variable, making it simple and interpretable.
In this analysis, the LR model was configured using the Ordinary Least Squares (OLS) method, which minimizes the sum of the squared differences between the observed and predicted values, ensuring the best fit line through the data points.
To ensure the robustness of the model, a five-fold cross-validation was performed. In this technique, the dataset is divided into five subsets. The dataset is divided into five subsets. In each step, the model is trained on four subsets and validated on the remaining subset. This process is repeated five times, ensuring that each subset is used exactly once as a validation set. While 10-fold cross-validation is often considered the standard approach, five-fold cross-validation has been shown to provide a good balance between computational efficiency and model reliability, especially in cases where the amount of data is moderate [48,49]. The performance of the LR model was evaluated using the MSE and the R2. MSE measures the average of the squares of the errors between the observed and predicted values and thus provides an indication of the accuracy of the model. R2 indicates the proportion of variance in the dependent variable that can be predicted by the independent variables and is therefore a measure of the explanatory power of the model.

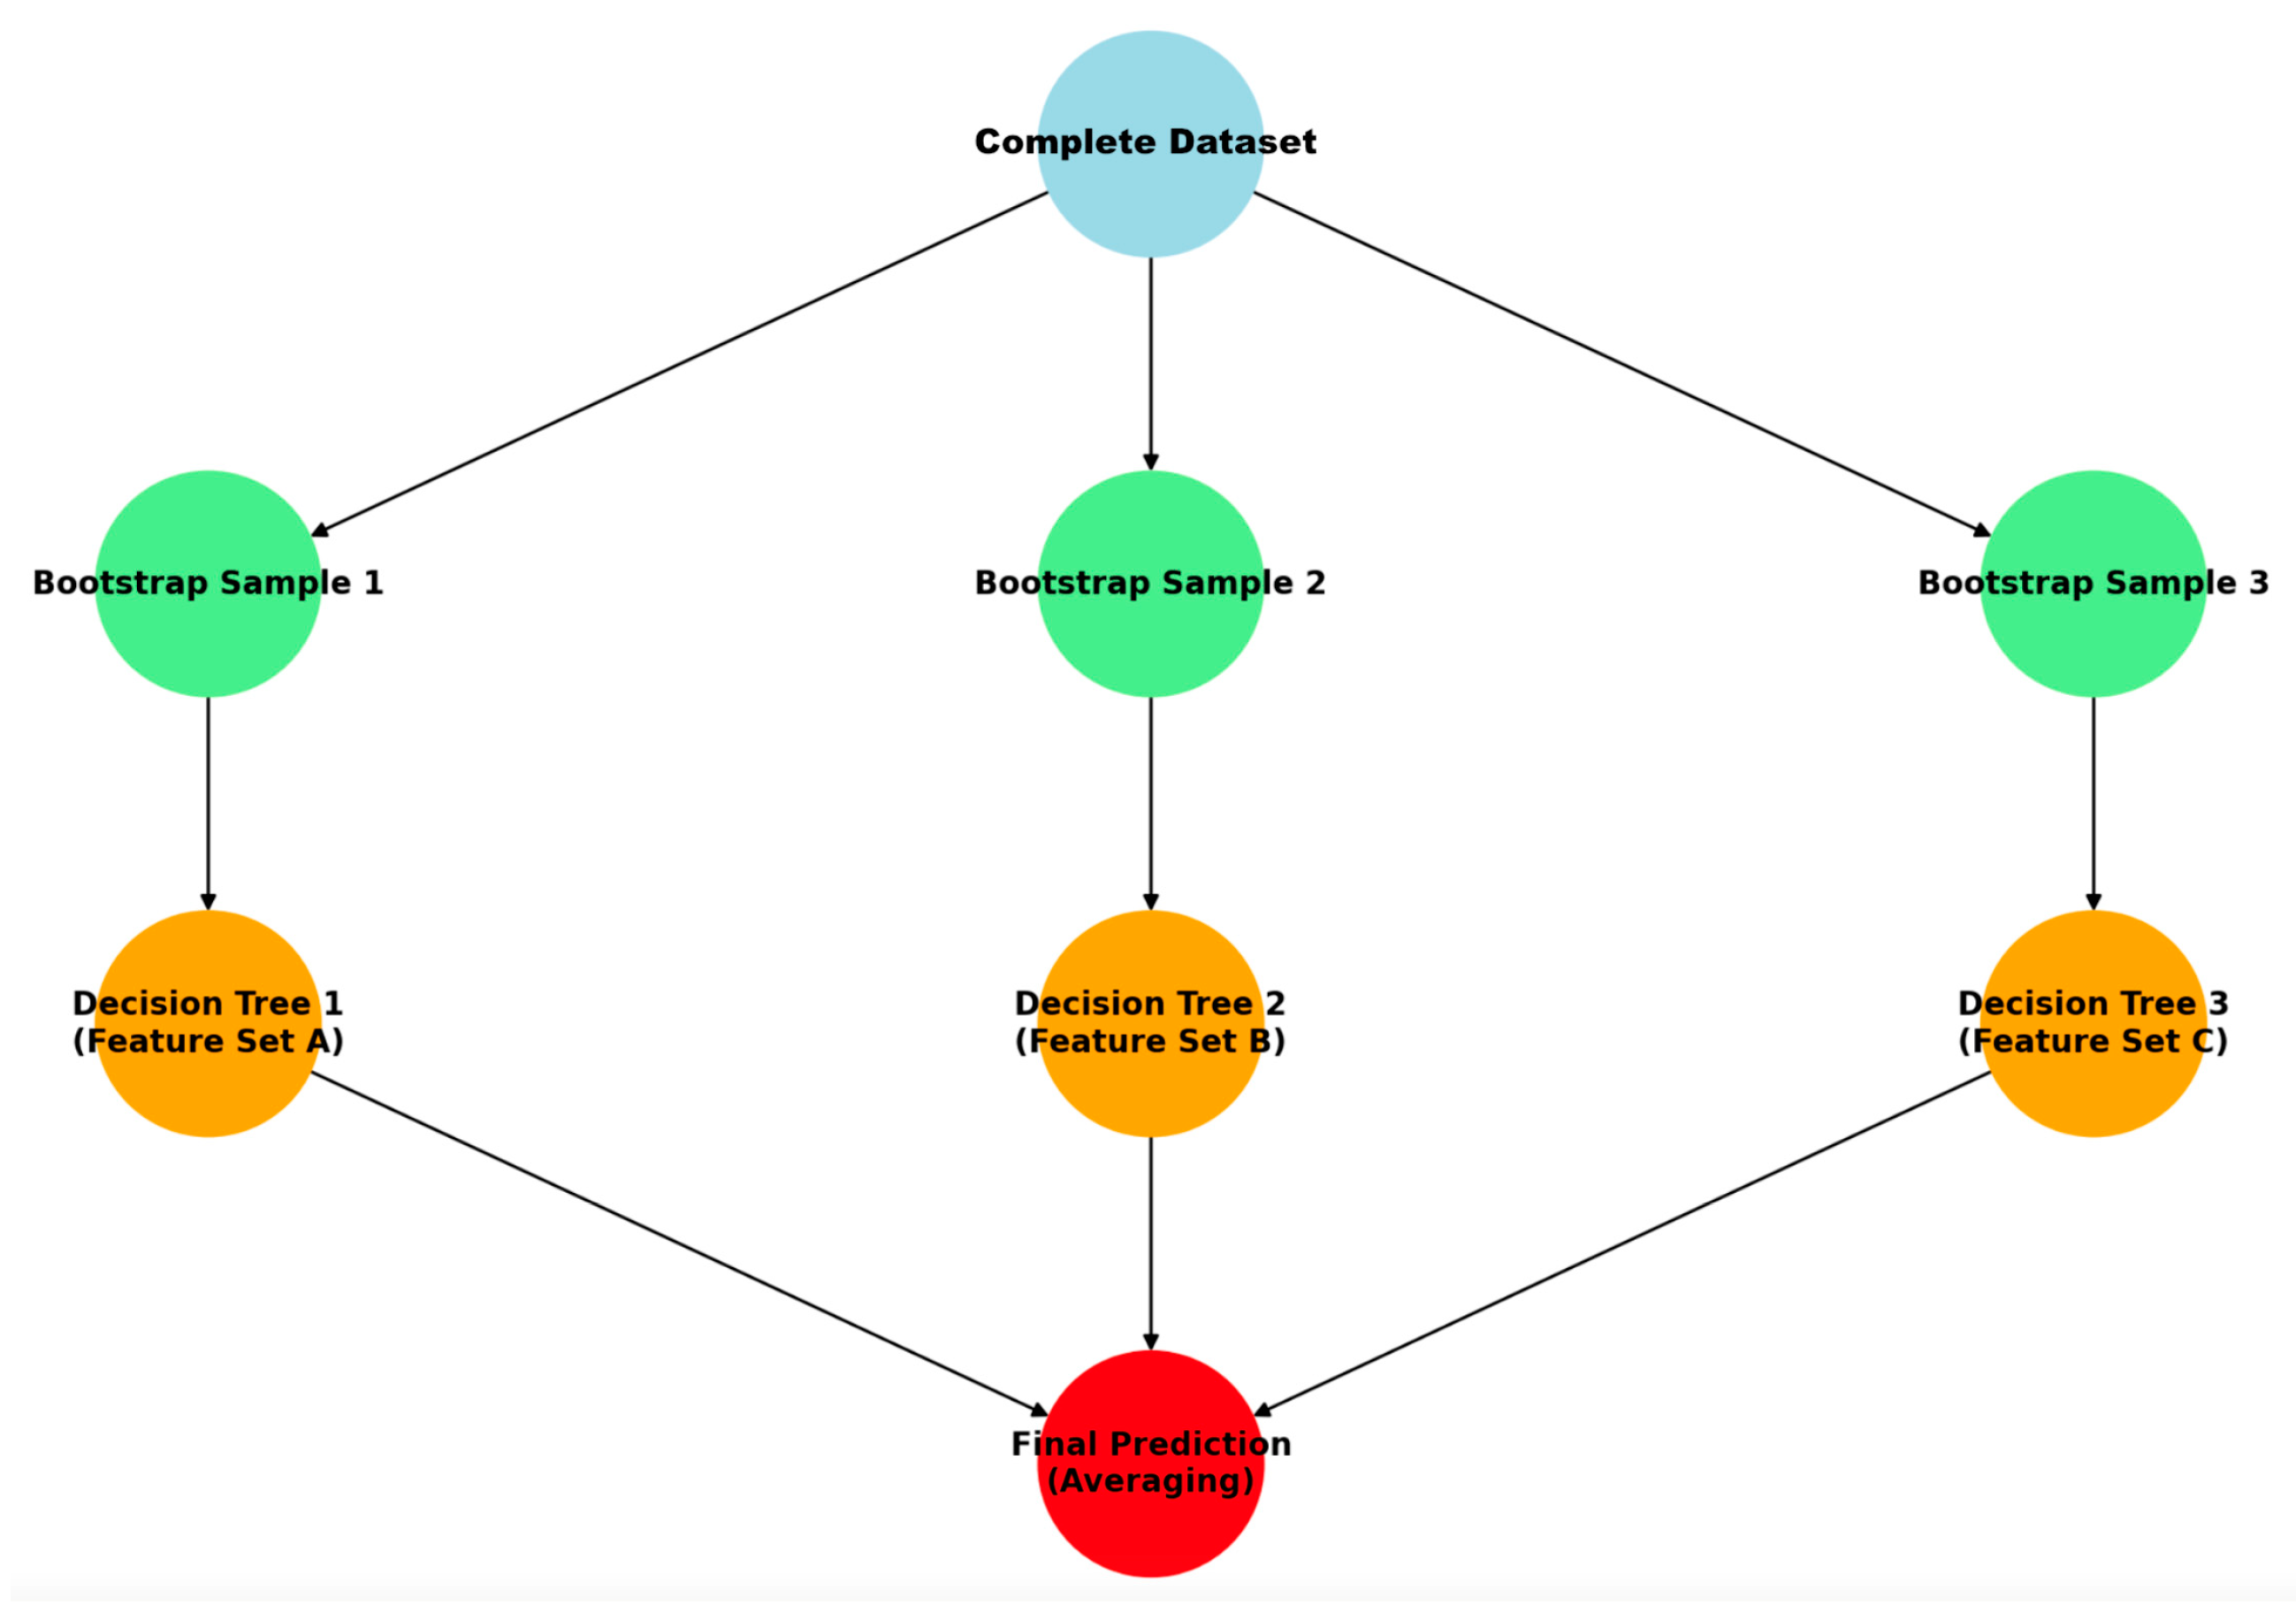
3.1.2. Random Forest Model

RF is an AI technique that falls under the category of ensemble learning methods. It combines the predictions of multiple decision trees to improve accuracy and control over-fitting. This approach is particularly effective for handling large datasets with high dimensionality and managing complex interactions between variables, making it a robust tool for many predictive modeling tasks in Machine Learning. In this analysis, the RF model was configured with the following parameters:
  • Number of Trees (n_estimators): 100, which helps reduce the variance of the model.
  • Maximum Depth of Trees (max_depth): 10, which prevents the trees from growing too deep and overfitting the training data.
  • Minimum Samples to Split a Node (min_samples_split): 2, specifying the minimum number of samples required to split an internal node.
  • Minimum Samples per Leaf (min_samples_leaf): 1, specifying the minimum number of samples required to be at a leaf node.
  • Criterion for Splitting: MSE, used to measure the quality of a split.
Figure 1 shows a simplified representation of the RF model. The figure illustrates the main principles of bootstrap aggregation (bagging) and randomness of features. The entire dataset is first randomly divided into several bootstrap subsets to ensure that each decision tree is trained on a different part of the data. In addition, each tree receives only a random subset of the available features, which prevents overfitting and reduces the correlation between the trees. Each decision tree produces an independent prediction based on the subset of data and features assigned to it. The final output is obtained through an aggregation process, by averaging the predictions of the individual trees in regression tasks, which improves the prediction accuracy and generalization ability of the model. This visualization illustrates the ensemble nature of RF, where multiple trees contribute to a more robust and stable final prediction [50].
The model’s robustness was ensured through five-fold cross-validation. Additionally, parameter optimization was carried out using Grid Search techniques to identify the optimal combination of hyperparameters, enhancing the model’s performance and predictive accuracy.

3.1.3. Support Vector Regression

The principles of Support Vector Machines (SVM) are extended to regression problems through SVR, a powerful technique within AI and specifically ML. This is particularly effective in capturing complex, non-linear relationships using kernel functions, which enable the model to map input data into higher-dimensional spaces, allowing for more accurate predictions.
In this analysis, the SVR model was configured with the following parameters:
  • Kernel Function: Radial Basis Function (RBF), which helps to handle non-linear relationships by mapping the input features into higher-dimensional space.
  • Regularization Parameter (C): Set at 1.0, which controls the trade-off between achieving a low error on the training data and minimizing the model complexity.
  • Kernel Coefficient (gamma): ‘scale’, which defines how far the influence of a single training example reaches.
  • Epsilon (ε): Set at 0.1, specifying the margin of tolerance where no penalty is given to errors.
To ensure the model’s robustness, five-fold cross-validation was performed. Additionally, parameter optimization was conducted using Grid Search techniques to identify the optimal combination of hyperparameters, thereby enhancing the model’s performance and predictive accuracy.
Figure 2 illustrates the structure of the SVR model, including the data points, the margin (±ϵ), and the support vectors. This visualization highlights the key elements that define the SVR approach, providing an intuitive understanding of its operation.

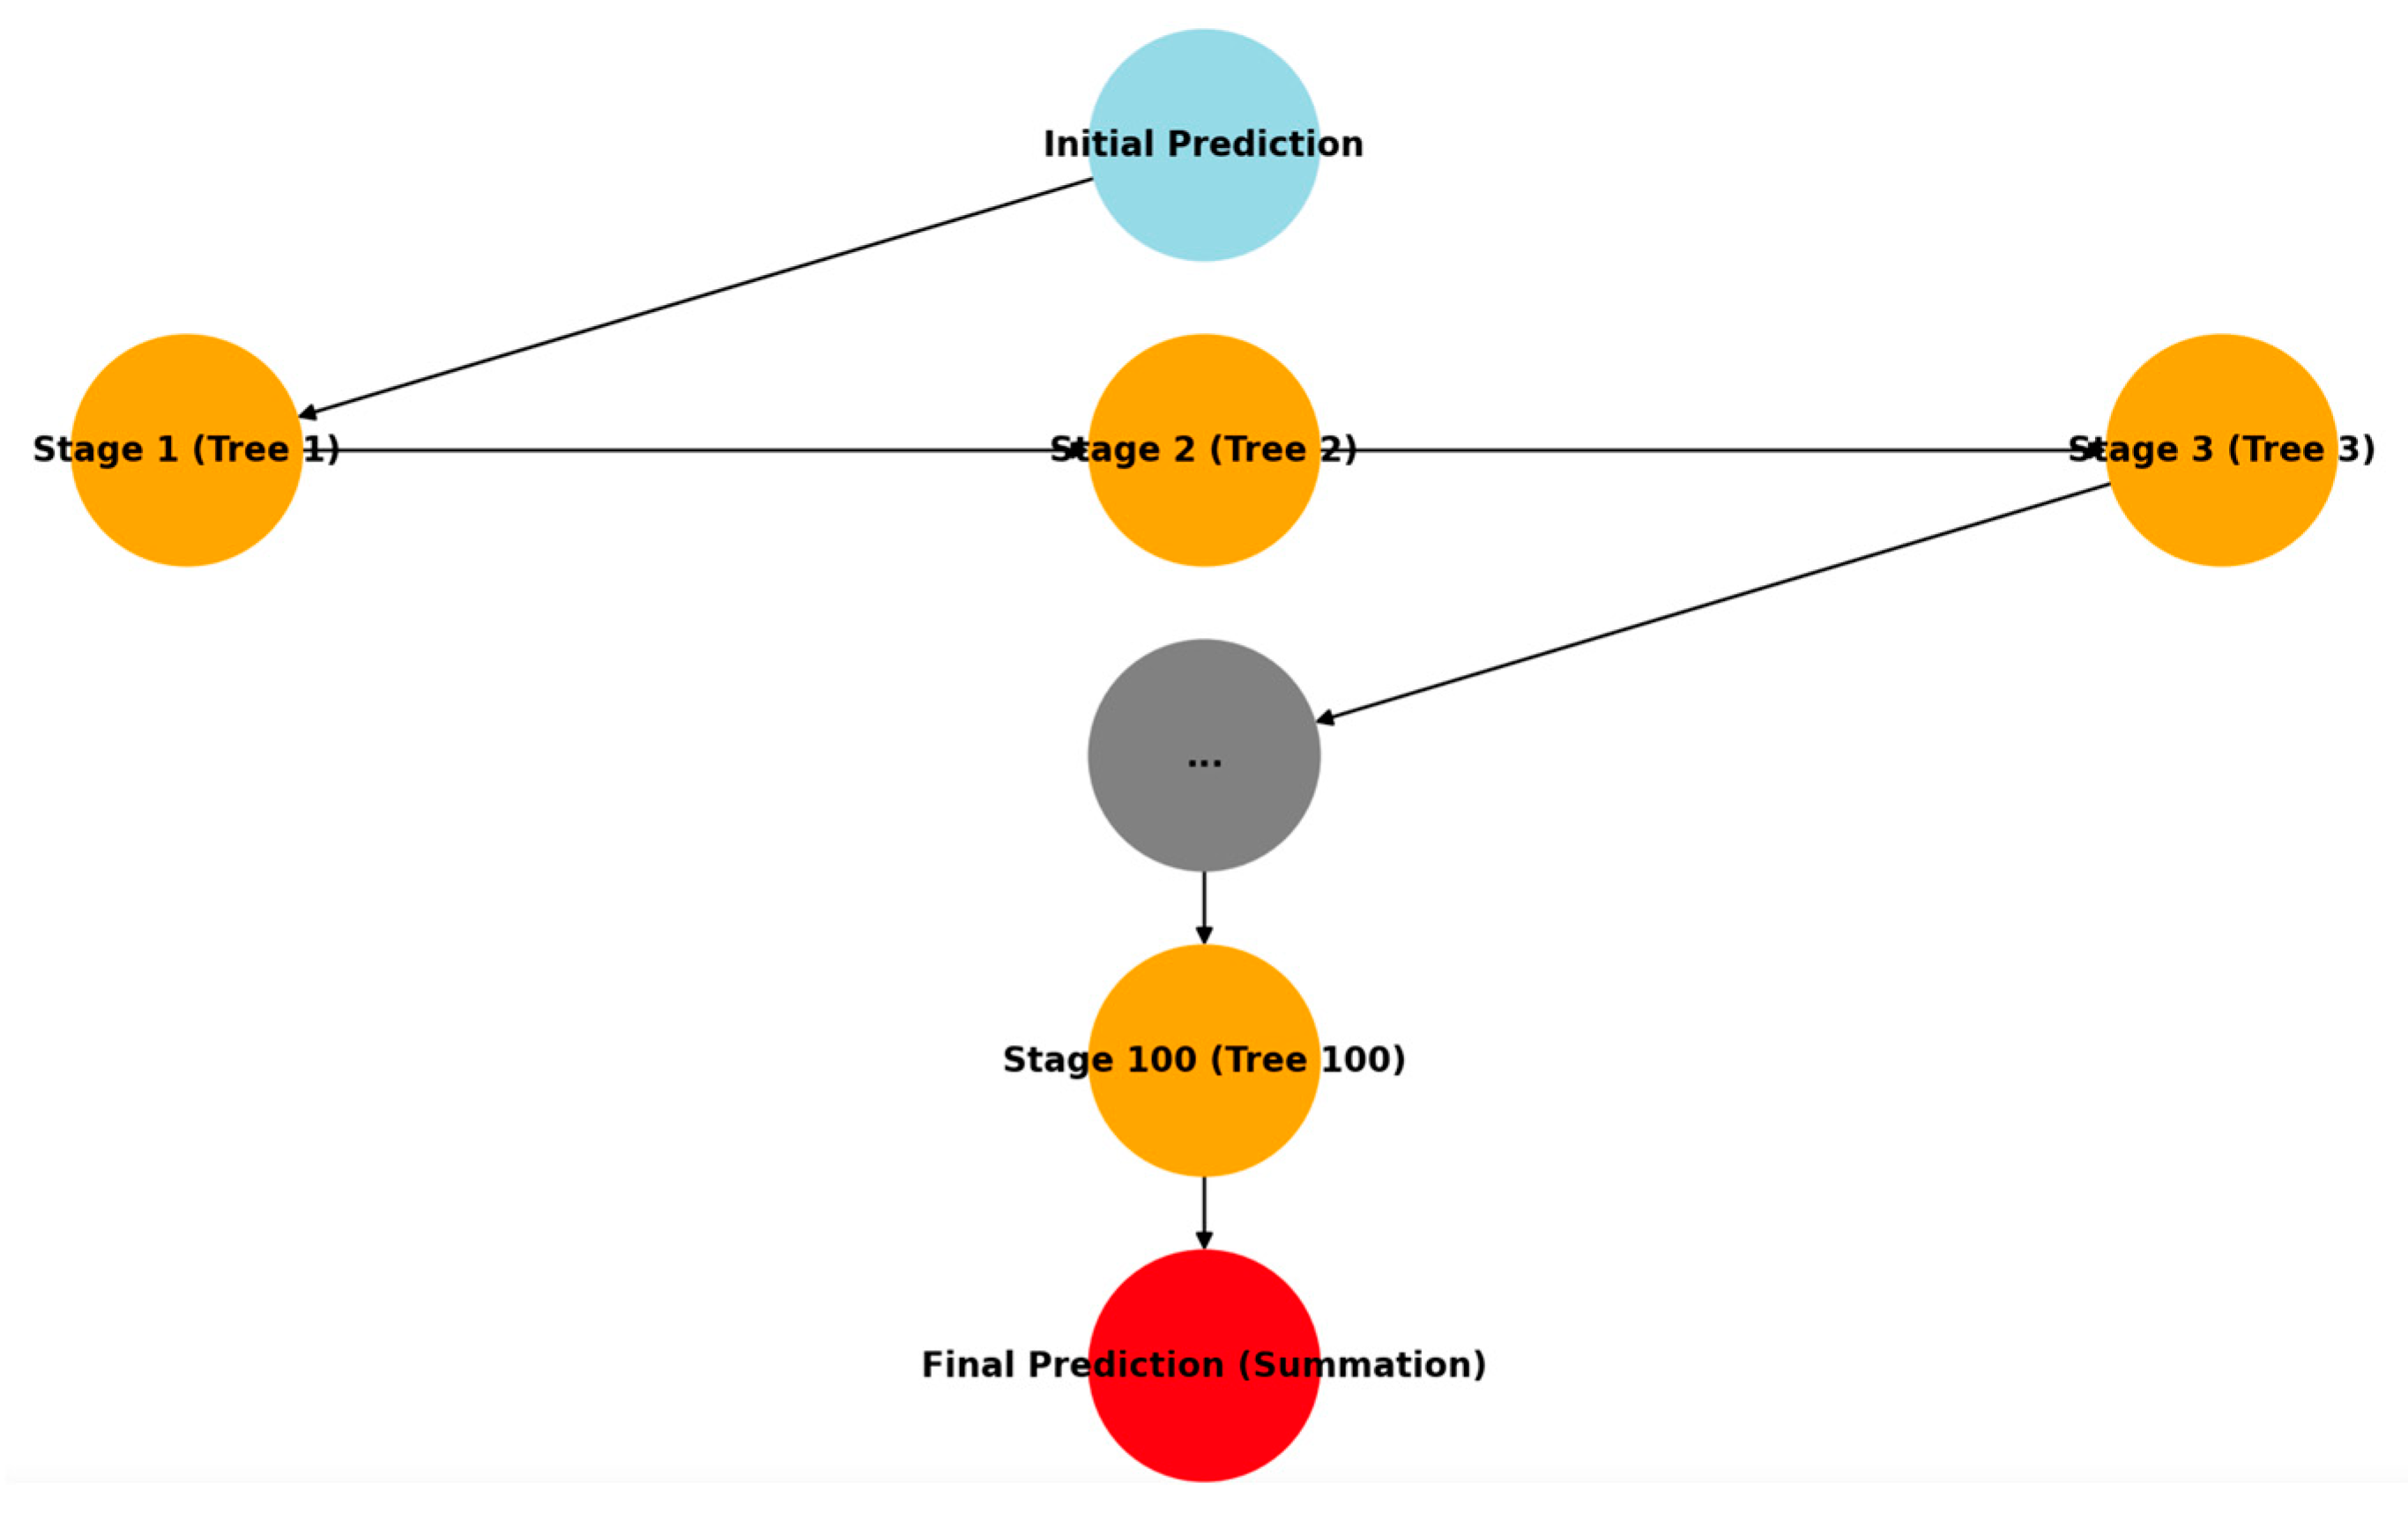
3.1.4. Gradient Boosting Regression

GBR is an AI technique from the ensemble learning category where models are created sequentially, with each model attempting to correct the errors of the previous one. This method is particularly effective when it comes to improving the accuracy of predictive models by combining the strengths of multiple weaker models, resulting in a more robust overall prediction.
In this analysis, the GBR model was configured with the following parameters:
  • Number of Boosting Stages (n_estimators): 100, which specifies the number of boosting stages to be run.
  • Learning Rate: Set at 0.1, which controls the contribution of each tree to the final model.
  • Maximum Depth of Trees (max_depth): Three, which limits the depth of the individual regression estimators to prevent overfitting.
  • Minimum Samples to Split a Node (min_samples_split): Two, specifying the minimum number of samples required to split an internal node.
  • Minimum Samples per Leaf (min_samples_leaf): One, specifying the minimum number of samples required to be at a leaf node.
  • Loss Function: Least Squares (ls), which measures the difference between observed and predicted values.
Figure 3 provides a simplified representation of the GBR process. The diagram illustrates how the boosting stages are applied sequentially, with each tree learning from the residual errors of the previous stages. While only the first few stages are shown explicitly, in this study the process continues iteratively up to 100 stages. Each stage refines the predictions by minimizing the loss function, and the final output is obtained by aggregating the weighted contributions of all trees. This sequential correction mechanism ensures an increasingly accurate prediction.
In order to assess the reliability of the model, a five-fold cross-validation was performed. In addition, hyperparameter tuning was performed using grid search to find the best combination of parameters to improve the performance and prediction accuracy of the model.

3.1.5. Neural Networks

NNs are a class of AI models, specifically within ML, that are inspired by the structure and function of the human brain. The Artificial Neural Network (ANN) employed in this study is specifically a Multilayer Perceptron (MLP) deep neural network. This architecture consists of an input layer, several hidden layers, and an output layer that work together to process and transform data. MLP networks are particularly well suited for capturing complex, non-linear relationships in large datasets, making them very effective for predictive modeling in trajectory planning.
In this analysis, the neural network was configured with the following structure:
  • Input Layer: Receives the independent variables (R1, R2, R3).
  • First Hidden Layer: Sixty-four neurons, using the ReLU (Rectified Linear Unit) activation function.
  • Second Hidden Layer: Thirty-two neurons, also using the ReLU activation function.
  • Output Layer: One neuron, performing linear regression to predict the target variable.
Figure 4 shows a simplified representation of the architecture of the neural network, along with its main components (input, hidden layers, and output) and the connections between them. The number of neurons in each layer is reduced for clarity, but the essential structure of the network remains the same.
The network was trained over 100 epochs, with the Adam optimizer employed to adjust the weights and biases during training. The loss function used was MSE, which measures the average of the squares of the errors between the predicted and actual values.
To ensure the model’s robustness, five-fold cross-validation was performed, and parameter optimization was carried out using Grid Search techniques to identify the best combination of hyperparameters for optimal performance.

3.2. Integration of the MRoundabout Model

The “MRoundabout” speed model forms the basis for this study. It was developed to accurately simulate human driving behavior in single-lane roundabouts [4]. The model generates a basic speed profile based on the geometric attributes of the reference path, focusing on the following three critical radii (R1, R2, R3) that define the path:
  • Radius of entry (R1): the minimum radius on the fastest through-route before reaching the entry line.
  • Circulation path radius (R2): the minimum radius on the fastest passage path while the vehicle is circulating around the center island.
  • Exit radius (R3): the minimum radius on the fastest passage route when the vehicle leaves the island.
These radii assume that the vehicle is 2 m wide and maintains a minimum distance of 0.5 m from the centerline of the roadway or a concrete curb that follows a painted edge line. Specifically, the center line of the vehicle is marked 1.0 m from a painted edge line; 1.5 m from a concrete curb; and 1.5 m from a lane centerline.
To describe the path through the roundabout, a parametric representation in polar coordinates is used, specifying the radial distance from the center of the roundabout and the angle relative to the horizontal axis. The path is expressed as follows:
r(θ) = r0 + a⋅θ2
Here, r0 represents the initial distance from the roundabout, a determines the curvature of the path, and θ varies from the entry angle to the exit angle.
The MRoundabout speed profile was created using the following steps (Figure 5):
  • Division into Turning Regions (TRs):
    • TR1: Starts before entering the roundabout, where the vehicle decelerates, and ends in the middle of the section passed under acceleration, between the first and second circular arcs.
    • TR2: Starts at the end of TR1 and ends in the middle of the section passed under acceleration, between the second and third circular arcs.
    • Starts at the end of TR2 and ends where the vehicle accelerates after the last section with constant curvature.
  • Important distances:
    • Lsi (i = 1, 2, 3): The distance from the start of each region to the point where the speed si is reached and remains constant.
    • ΔSi (i = 1, 2, 3): The differential distance between the center of the region and the start of constant speed si, calculated as ΔSi = TRi/2 − LSi
  • Additional Parameters:
    • s0: Initial speed before the roundabout, influenced by road design or signage.
    • d01: The model assumes a decrease in speed from s0 to s1 before entering the roundabout. This deceleration considers the natural reduction in speed required to navigate the tight entry curvature safely. Hypothetically, if a vehicle were to accelerate in this section, it would likely result in excessive lateral forces and reduced control, which is unusual driving behavior under normal conditions.
    • a12: After deceleration, the model assumes that drivers gradually regain speed while circulating, transitioning from s1 to s2. This is because, in the fastest trajectory, vehicles experience a geometric widening of the path, allowing them to accelerate naturally. However, in cases where external factors (e.g., interactions with other vehicles or congestion) alter this dynamic, a deceleration phase could occur instead, impacting the expected trajectory. Since MRoundabout is designed to isolate the influence of geometry alone, traffic-induced effects are not explicitly modeled.
    • a23: When the vehicle leaves the roundabout, it continues to accelerate from s2 to s3 and switches back to the regular lane of the exit leg. This behavior is a direct consequence of the decreasing curvature, which allows drivers to reach a higher cruising speed again. This structured approach ensures an accurate representation of the speed profile across the roundabout.
To validate the MRoundabout model, real vehicle movement data were collected from five representative single-lane roundabouts in Italy [4]. The dataset included the following:
  • Vehicle trajectory tracking using high-resolution cameras, LIDAR sensors, and GPS devices to ensure the accurate measurement of speed, acceleration, and lateral displacement.
  • Speed profiles recorded along the fastest trajectory, capturing variations at different radii (R1, R2, R3).
  • Time series data to analyze acceleration and deceleration behavior with special attention to transitions between turn zones (TRs).
Data collection was carried out outside peak hours to exclude the influence of external traffic interactions. This decision was essential to ensure that the recorded trajectories reflect the purely geometric influence of the roundabout design and not the drivers’ reactions to the surrounding vehicles. Had the data been collected during peak traffic hours, the observed trajectories would have been influenced by braking and swerving behavior in response to traffic density, which would have significantly altered the recorded speed profiles. While these interactions are essential for a more comprehensive analysis of traffic flow, the focus of this study was to isolate the role of roundabout geometry in shaping vehicle trajectories [4].

3.3. Data Acquisition and Calibration

Extensive data were collected to support the development and calibration of the “MRoundabout” speed model. The study included the following [4]:
  • Selection of five representative roundabouts in Italy.
  • Collection of vehicle movement data using high-resolution cameras, LIDAR sensors and GPS devices.
  • Analysis of 135 valid trajectories recorded by 15 drivers (7 men and 8 women) aged between 23 and 62, driving at off-peak times to minimize external influences.
To ensure a fair evaluation of model performance and to avoid overfitting, the dataset was split into three parts: 70% for training, 15% for validation, and 15% for testing. This split was chosen to ensure a sufficient amount of data were available for the model to learn from while obtaining independent validation and test sets for performance evaluation. With a total dataset size of 135 observations, this split resulted in 94 samples for training, 20 for validation, and 20 for testing.
The 70–15–15% split is widely recognized in the machine learning literature as a suitable approach for small to medium-sized datasets, ensuring an adequate training set while maintaining an independent validation set for hyperparameter tuning [48]. Alternative splits such as 80–10–10% (with priority given to training) or 60–20–20% (with priority given to model validation) were considered. However, we opted for 70–15–15% to maintain consistency with previous experiments and to achieve a balanced approach between training, validation, and generalization testing [51,52].
Furthermore, studies indicate that test set sizes of 10–20% are common in deep learning applications, especially in trajectory planning and autonomous driving models, where dataset sizes are often limited [53]. In our case, this split allowed for the available training data to be maximized while maintaining an independent test set for unbiased evaluation. However, it is important to note that the test set contains only 20 observations, which is sufficient for a preliminary evaluation of model generalization but may lead to fluctuations in performance metrics due to the small sample size [54].
To minimize the risk of overfitting and to ensure a robust model evaluation, the following strategies were applied:
  • GBR: Training was stopped early if the validation loss had not improved after 10 consecutive iterations. This technique has been shown to prevent overfitting in gradient boosting algorithms by ensuring that models are not trained beyond the optimal performance threshold [55].
  • NNs: L2 regularization (weight reduction) and a dropout rate of 20 in hidden layers have been used to reduce overfitting. L2 regularization helps prevent large weights that can lead to model instability, while the dropout rate improves generalization by randomly deactivating neurons during training [56].
  • Five-fold cross-validation: applied to all models during training to ensure that the final test set remains fully segregated for unbiased evaluation. The five-fold approach strikes a balance between computational efficiency and robust performance evaluation, making it a widely accepted method in machine learning [57].
These techniques ensured that the models did not overfit the training data and maintained a strong generalization performance despite the limitations imposed by the size of the dataset. Future research could address this limitation by collecting additional data or implementing more advanced resampling techniques, such as stratified k-fold cross-validation, to further validate the robustness of the models [58].
The geometric features of the roundabouts were recorded, and the model parameters were calibrated by minimizing the least squares error between the predicted and observed human driving speed along the fastest path. This optimization ensured agreement with real human driving behavior. The profiles generated by the MRoundabout model deviated only minimally from the observed data, highlighting its robustness and accuracy in capturing the dynamics of vehicle movement in roundabouts [4].
By integrating these fundamental results with advanced ML techniques, the study will develop predictive models that improve the trajectory planning capabilities of AVs.

3.4. Role of ChatGPT-4 in Model Development

ChatGPT-4 was used as a supporting tool to streamline different phases of the workflow, particularly during the pre-processing of the data, the tuning of the hyperparameters, and the initial exploratory analysis of the model configurations. Its main role was to automate repetitive tasks so that researchers could focus on the more complex aspects of model evaluation and refinement. In particular, ChatGPT-4 facilitated the selection of initial hyperparameter ranges, which were subsequently optimized by Grid Search and empirically validated to ensure the best model performance. However, it is important to emphasize that the recommendations generated by the AI were not automatically applied but served as a preliminary guide. The researchers critically evaluated, refined, and validated these suggestions through systematic experimentation to ensure the methodological rigor of the study. The final tuning process involved multiple iterations with empirical validation through cross-validation techniques and statistical analysis to determine the most effective model configurations.
The use of ChatGPT-4 significantly reduced the time required for hyperparameter tuning and model comparison. An initial analysis showed that manual tuning took around 18 h, while this time was reduced by around 40% with AI support thanks to the more targeted selection of the search space. For complex models such as artificial Neural Networks (ANNs), ChatGPT-4 helped to narrow down the initial search space and speed up the optimization process.
In the case of the multilayer perceptron (MLP) neural network, for example, ChatGPT-4 initially suggested a learning rate between 0.001 and 0.1, a dropout rate between 10% and 30%, and a hidden layer architecture with 32-64-128 neurons per layer. However, empirical tests showed that a learning rate between 0.002 and 0.005 provided greater training stability, a dropout rate between 10% and 20% improved generalization, and a structure with 64-32 neurons per hidden layer provided the best balance between performance and computational efficiency. In addition to tuning the hyperparameters, ChatGPT-4 was used to assist in processing datasets, fine-tuning model parameters, and increasing the efficiency of the model development process. The integration of ChatGPT-4 enabled rapid iterations and real-time feedback, contributing significantly to the refinement and validation of the predictive models. While there are no recent studies applying ChatGPT-4 specifically to our domain, the research highlights its effectiveness in supporting ML methods. In particular, studies highlight its role in hyperparameter optimization, feature selection, and model training, contributing to an overall improvement in ML workflows [59,60,61]. These results confirm the increasing use of tools such as ChatGPT and similar AI-driven systems to refine machine learning pipelines and emphasize the relevance of our methodological approach.
However, despite its advantages, ChatGPT-4 also has certain limitations. Its recommendations may be affected by biases inherent in language models, as highlighted in recent studies on ethical risks and biases in large-scale AI models [62]. Furthermore, ChatGPT-4 provides suggestions based on pre-existing knowledge, but cannot automatically adjust its recommendations based on the analyzed dataset, unlike AutoML tools that autonomously select hyperparameters by directly analyzing the data [63]. For this reason, AI-generated recommendations must always be empirically validated [64]. To ensure the robustness of the model, all final configurations were validated through cross-validation and empirical testing.
To better illustrate the methodological workflow, Figure 6 presents a diagram distinguishing the steps supported by the AI from those performed directly by the researchers. This provides transparency and illustrates that while AI has improved process efficiency, the final decisions were made through rigorous empirical validation. The integration of AI in a supporting role, rather than as a replacement for expert decision making, enabled the automation of parts of the workflow without compromising scientific rigor. The results confirm that the AI-assisted tuning of hyperparameters can accelerate model development, but final decisions must always be guided by human expertise and experimental validation.

4. Results and Discussions

In this section, a comprehensive evaluation of the predictive models is presented, focusing on their ability to generalize across different datasets and capture important driving behaviors in roundabouts. The analysis includes both numerical metrics and graphical diagnostics to evaluate model accuracy, biases, and tendencies to overfit. Particular attention is paid to the differences in performance between models, highlighting the strengths of deep learning techniques and the limitations of simpler approaches. The discussion provides insights into the predictive reliability of each method and their implications for autonomous vehicle trajectory planning.

4.1. Numerical Analysis and Model Performance Evaluation

The performance of each model was evaluated based on MSE and R2 for each pair of variables: speed (S1, S2, S3), acceleration (d01, a12, a23), and differential distances (ΔS1, ΔS2, ΔS3).
To provide a clearer assessment of model performance, we report metrics separately for the training, validation, and test sets. As expected, more complex models, such as Neural Networks (NNs) and Gradient Boosting Regression (GBR), achieved a very low MSE in the training set, with an increase in validation and test sets, indicating a slight overfitting effect. This was particularly evident in the acceleration and differential distance variables, where the test set showed a 30–40% increase in MSE compared to the training set. However, the R2 values remained acceptably high in the test set (between 0.85 and 0.89 for NNs), demonstrating that the model retained its strong generalization capability. Simpler models, such as LR, showed smaller variations across sets but had lower overall accuracy. These results confirm that NNs are the most effective model for trajectory prediction in roundabouts but require regularization strategies to further mitigate overfitting risks. However, it is important to note that the NNs also showed the most significant decreases in performance between training and test sets, particularly for the R1–S1 (from 1.00 to 0.84) and R2–S2 (from 1.00 to 0.85) variable pairs. This behavior suggests that despite the use of regularization techniques such as dropout and L2 weight penalty, NNs are prone to overfitting, especially when working with limited datasets or when the training data do not fully capture the variability of real-world scenarios. Therefore, although the predictive ability of NNs is strong in most cases, their generalization performance should be interpreted with caution. Future research should consider additional strategies—such as expanding the dataset, simplifying the architecture, or applying advanced regularization techniques—to further improve the robustness of these models.
The results show the effectiveness of each model in predicting driving behavior based on the critical path radii (R1, R2, R3) in roundabouts (Table 1).
The variation in the MSE and the R2 between the training, validation and test datasets corresponds to the established patterns in predictive modeling. Simpler models such as LR show stable but suboptimal performance across all datasets, as they assume linearity and are therefore unsuitable for complex, non-linear relationships such as those encountered in vehicle trajectory planning. The observed results, where LR maintains a relatively high MSE and low R2 in the test data, are consistent with previous findings showing its limitations in autonomous vehicle applications [24]. RF and GBR show an improved predictive ability due to their ability to model nonlinearity, but both show signs of overfitting, especially RF, which remembers the training data too aggressively. GBR reduces variance but still shows inconsistencies between the validation and test datasets, emphasizing the need for fine-tuned hyperparameters [65]. SVR provides mixed results. It performs adequately in speed prediction, but has problems with acceleration and differential distance variables, a known limitation that depends on kernel selection and regularization settings [66,67]. NNs prove to be the best-performing model, consistently achieving the lowest MSE and highest R2 across all datasets. Their strong generalization ability, as evidenced by the minimal deviation between their validation and test performance, indicates effective learning without excessive memorization, which is further supported by regularization techniques such as dropout and weight reduction [16]. These results are consistent with previous research emphasizing the superior ability of deep learning to handle complex trajectory planning in autonomous driving scenarios.
The analysis of the five machine learning models confirms the theoretical expectations.
The following analysis focuses exclusively on the performance metrics of the test set, as these are the most reliable measures of the generalization ability of each model.
Analyzing the results of the five AI models revealed significant differences in their performance depending on the type of variables considered. Although LR is a simple and interpretable model, its performance varied depending on the type of variables analyzed. While LR provided reasonable predictions for speed variables (R-S pairs), its effectiveness was considerably lower for acceleration (R-acc pairs) and differential distance (R-ΔS pairs), confirming its limitations in capturing the non-linear relationships inherent in trajectory prediction. For example, for the R1-S1 pair, the model achieved an MSE of 5.78 and an R2 of 0.63, for R2-S2 it achieved an MSE of 18.21 and an R2 of 0.66, and for R3-S3 it achieved an MSE of 16.00 and an R2 of 0.62. For the R-acc pairs, performance was even worse, with R2 values close to zero or very low, at 5.00 × 10⁻⁴ for R1-d01, 0.09 for R2-a12, and 0.17 for R3-a23, indicating poor predictive ability. For the R-ΔS pairs, the results were disappointing, with high MSE values and very low R2 values: 0.18 for R1S1, 0.07 for R2S2, and 0.08 for R3S3.
The RF model showed a variable performance, with good results for some pairs of variables and poor results for others. For the R1-S1 pair, the model performed well, with an R2 of 0.73 and an MSE of 6.04, but the performance was weaker for R2-S2 (R2 of 0.30 and MSE of 19.00) and R3-S3 (R2 of 0.50 and MSE of 16.50). For the R-acc pairs, the performance was moderate, with an R2 of 0.68 for R1-d01 and an MSE of 4.00 × 10⁻⁴, while the results for R2-a12 and R3-a23 were less satisfactory, with an R2 of 0.10 and 0.17 and an MSE of 0.04 and 0.08, respectively. For the R-ΔS pairs, the results were less than optimal, with very low R2 values and high MSE values, such as R1S1 (MSE of 0.78 and R2 of 0.22), R2S2 (MSE of 2.37 and R2 of 0.12), and R3S3 (MSE of 5.13 and R2 of 0.24).
The performance of the SVR model was variable, with good results for some pairs of variables but poor results for others. For the R1-S1 pair, the SVR achieved decent results, with an R2 of 0.70 and an MSE of 6.33; for R2-S2, it achieved an R2 of 0.55 and an MSE of 11.00, and for R3-S3 it achieved an R2 of 0.55 and an MSE of 12.50. However, for the R-acc pairs, the performance of the model was lower, with an R2 of 0.50 for R1-d01, 0.08 for R2-a12, and 0.16 for R3-a23, and an MSE of 6.00 × 10⁻⁴, 0.04, and 0.08, respectively. The performance was even worse for the R-ΔS pairs, with very low R2 values and high MSE values, such as R1S1 (MSE of 0.57 and R2 of 0.43), R2S2 (MSE of 2.75 and R2 of 0.02), and R3S3 (MSE of 4.12 and R2 of 0.40).
The GBR model showed a similar performance to RF, with good results for some variables and a moderate or poor performance for others. For the R1-S1 pair, GBR performed well with, an MSE of 5.58 and an R2 of 0.74, but its performance was weaker for R2-S2, with an MSE of 23.00 and an R2 of 0.22, and for R3-S3, with an MSE of 17.00 and an R2 of 0.45. For the R-acc pairs, GBR showed a moderate performance, with an R2 of 0.62 for R1-d01 and an MSE of 5.00 × 10⁻⁴, while the results for R2-a12 and R3-a23 were less satisfactory, with an R2 of 0.09 and 0.18 and an MSE of 0.04 and 0.08, respectively. For the R-ΔS pairs, the performance was different, with moderate MSE values and low R2 values, such as R1S1, with an MSE of 0.76 and an R2 of 0.23, R2S2, with an MSE of 2.49 and an R2 of 0.09, and R3-ΔS3, with an MSE of 4.54 and an R2 of 0.35.
Finally, NNs, a prominent AI technique, proved to be the most effective model among those analyzed, with excellent predictive abilities for all pairs of variables. For the R1-S1 pair, NNs achieved the best results, with an MSE of 1.10 × 10⁻³ and an R2 of 0.84; for R2-S2, the model achieved an MSE of 4.5 × 10⁻³ and an R2 of 0.85, and for R3-S3, it achieved an MSE of 5.80 × 10⁻³ and an R2 of 0.88. For the R-acc pairs, the NNs again showed excellent performance, with an MSE of 0.00, 6.00 × 10⁻⁴, and 4.5 × 10⁻³ and an R2 of 0.99, 0.96, and 0.92 for R1-d01, R2-a12, and R3-a23, respectively. For the R-ΔS pairs, the NNs achieved the best results, with an MSE of 5.00 × 10⁻⁴, 3.80 × 10⁻³, and 3.80 × 10⁻³ and an R2 of 0.94, 0.91, and 0.88 for R1S1, R2S2, and R3S3, respectively.
In conclusion, the NNs model proved to be the most effective of the models analyzed, as it exhibited superior predictive ability for all pairs of variables considered. It achieved the highest R2 values and the lowest MSE, making it the most effective model for capturing the complex and non-linear relationships in the data. Compared to the other models, its performance was significantly better, making it the best choice for this type of analysis.

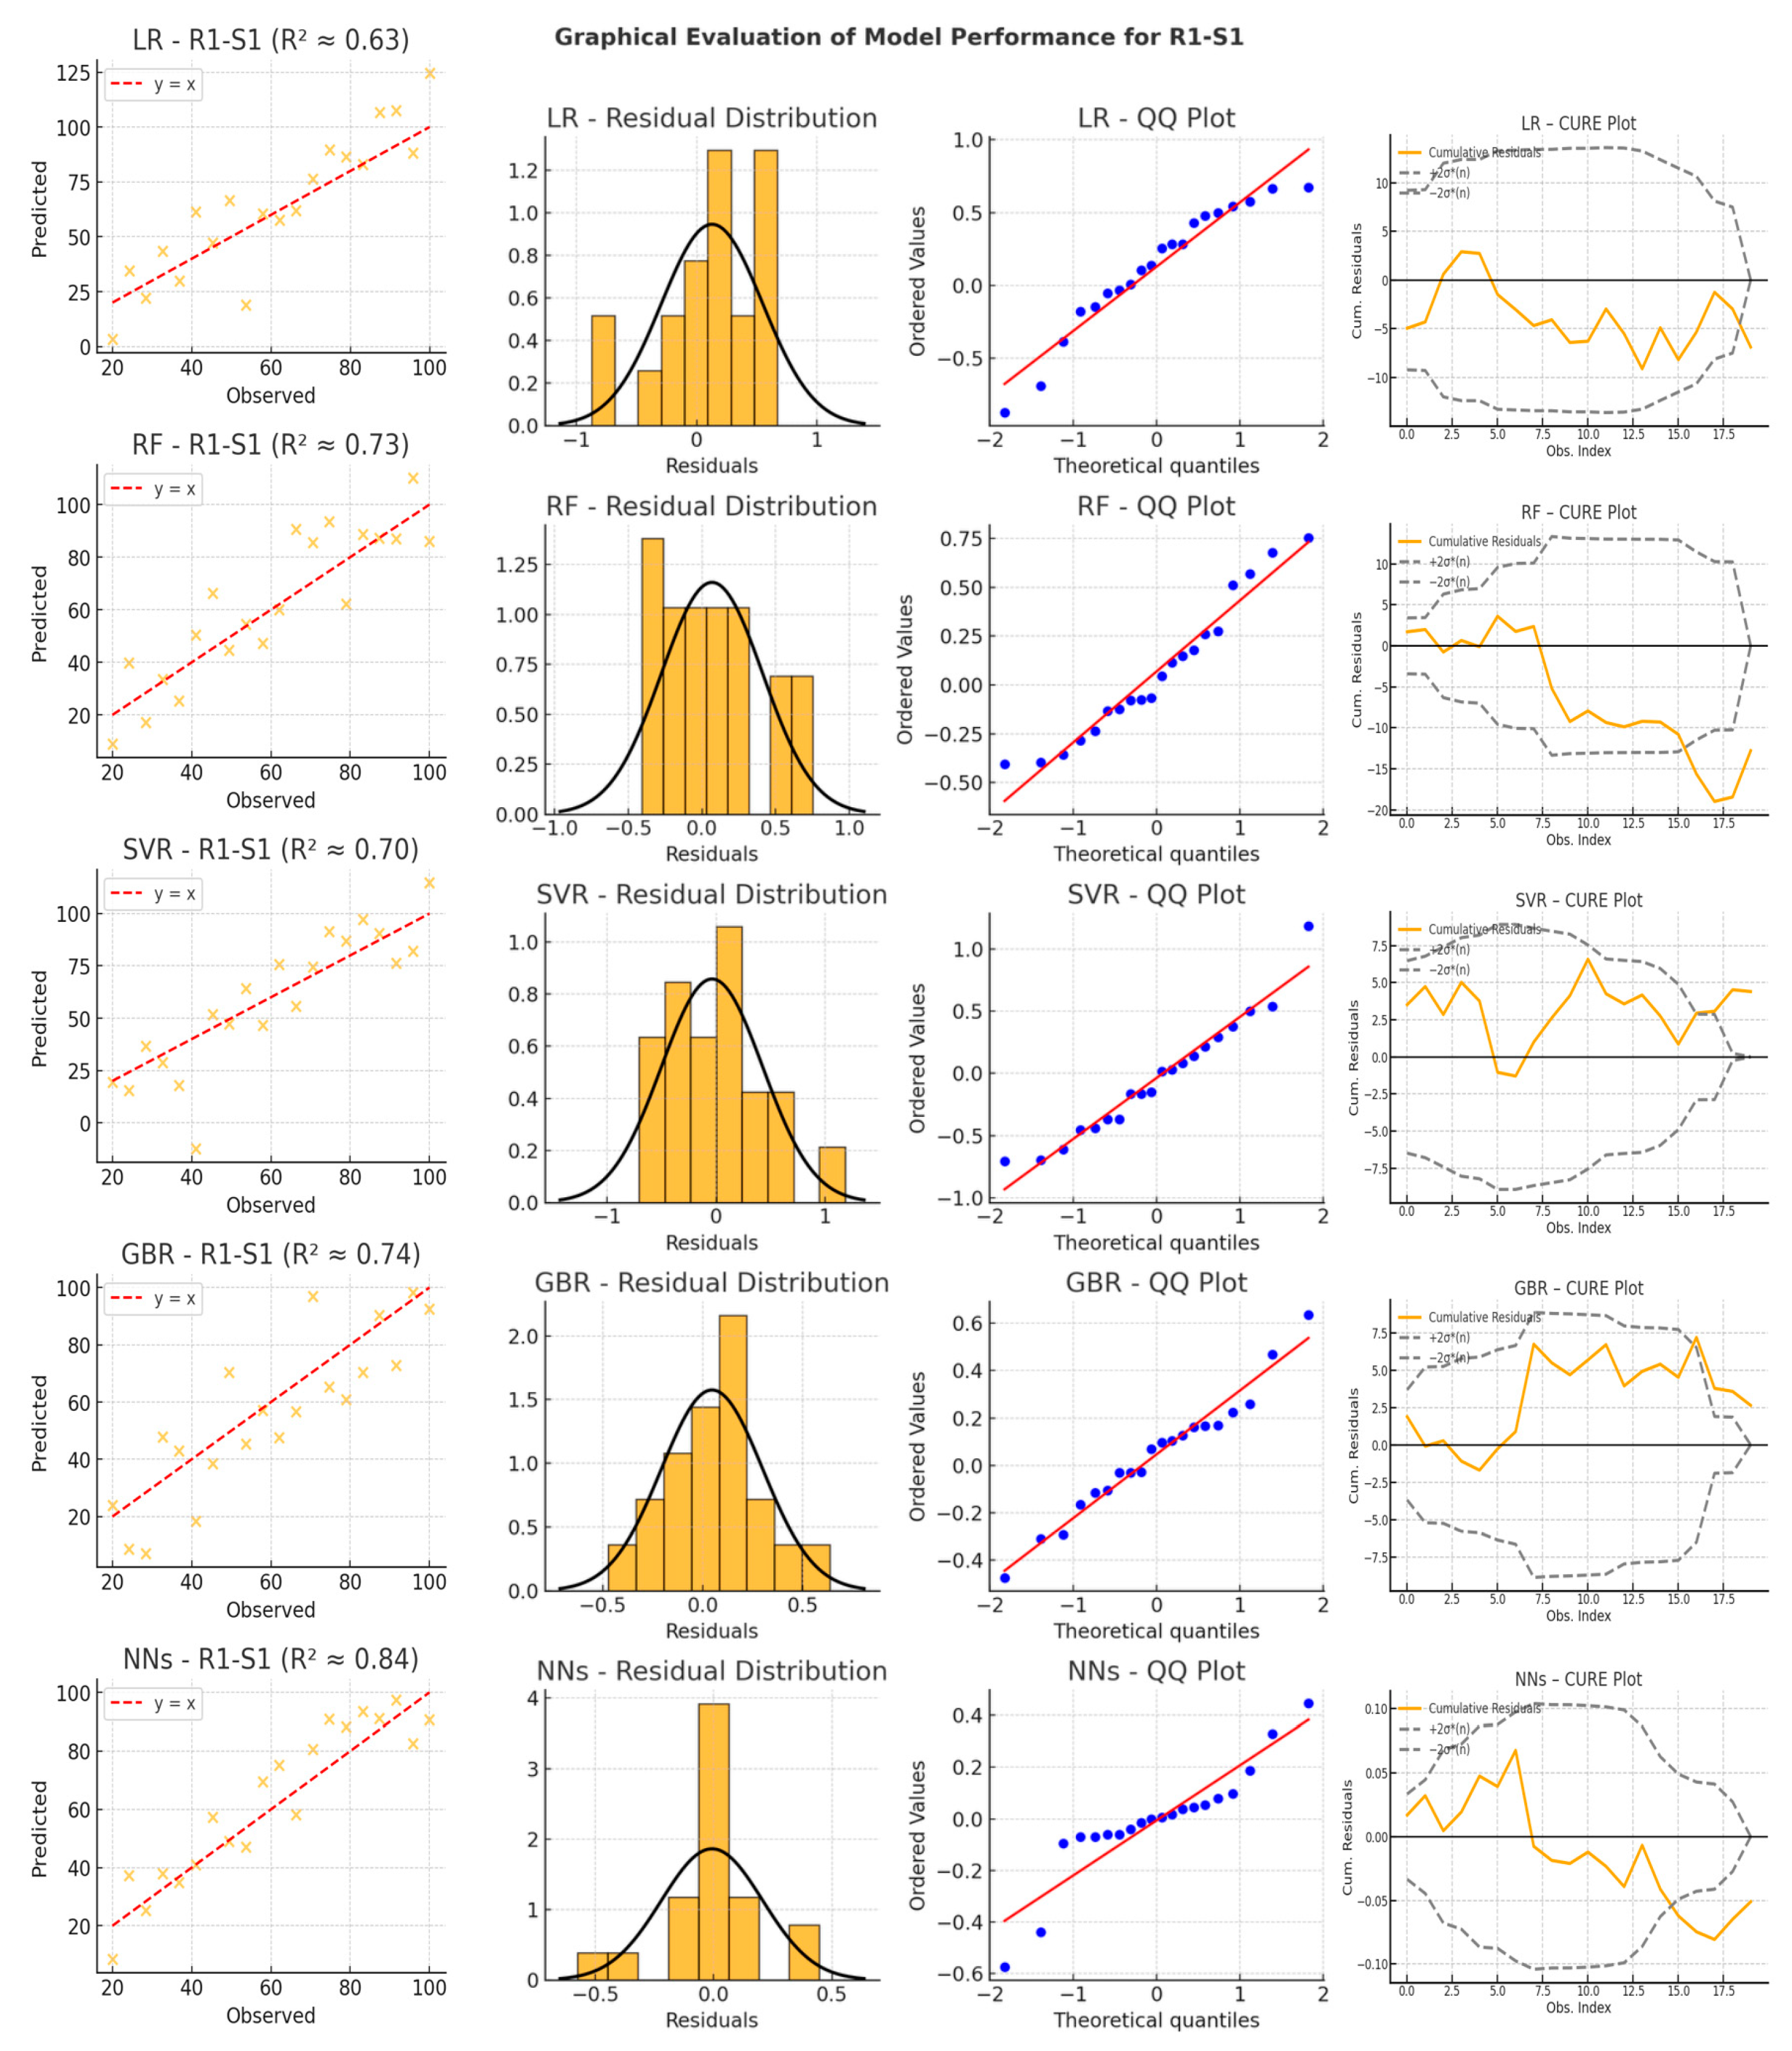
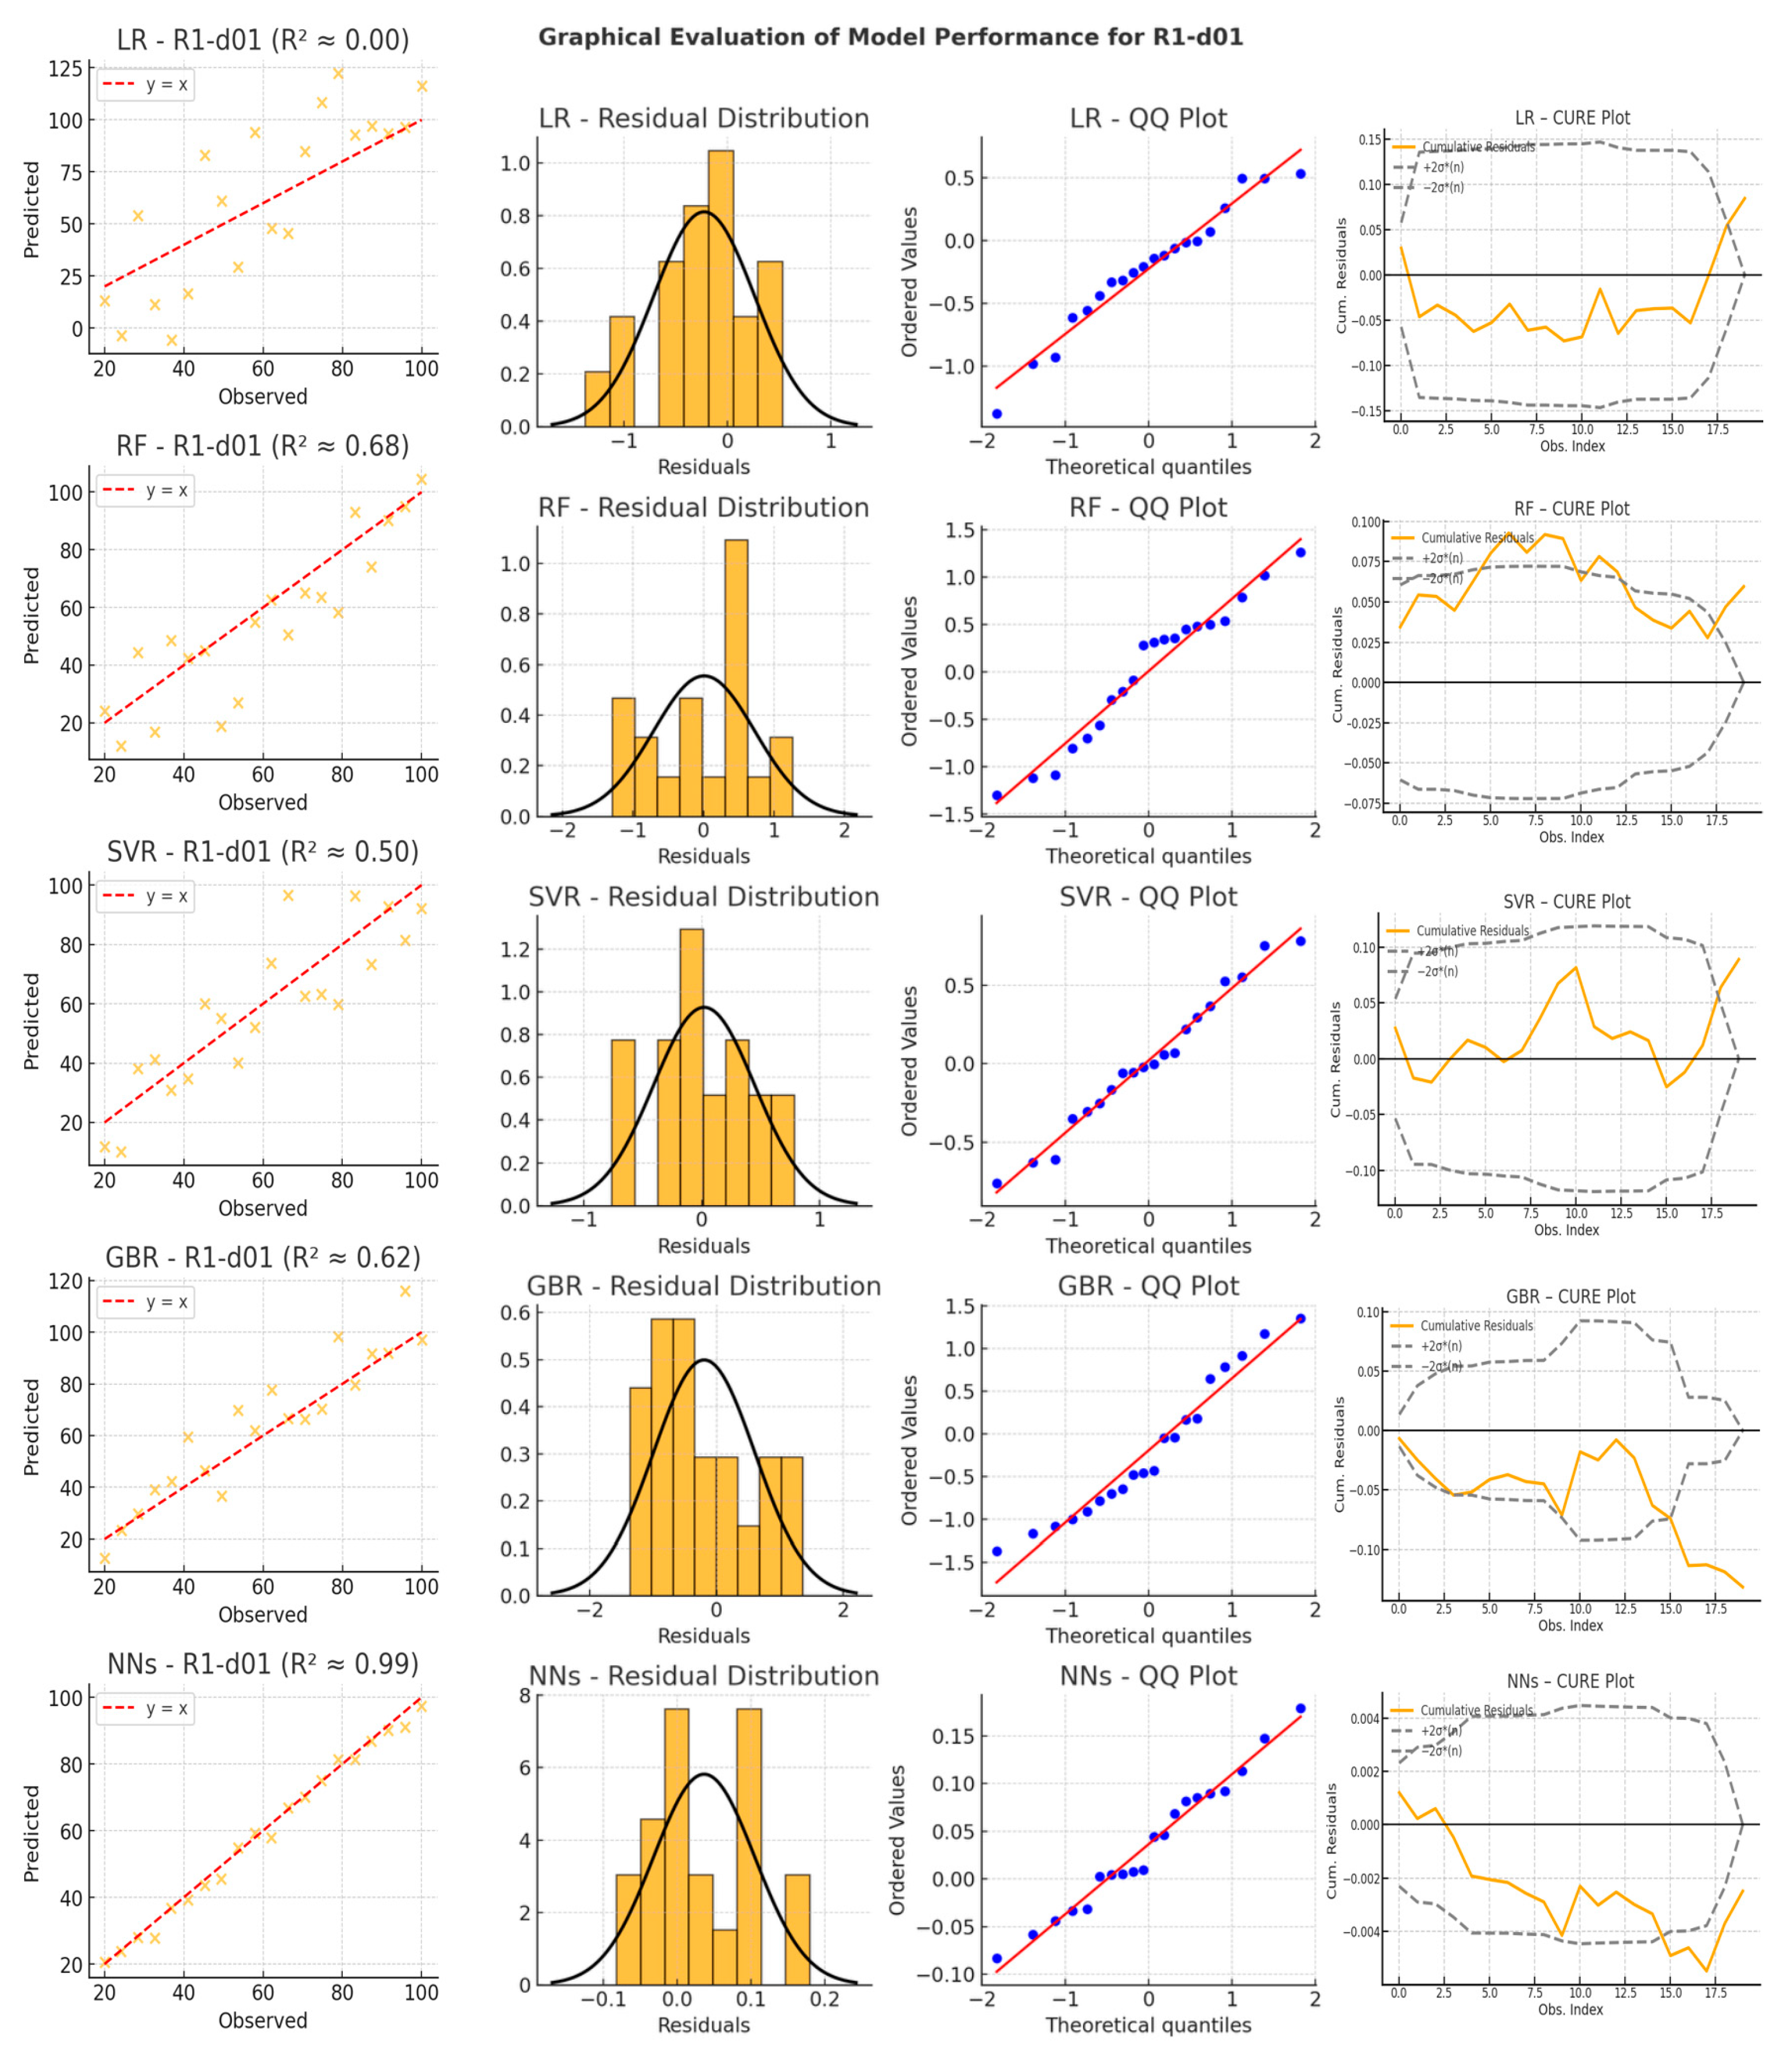
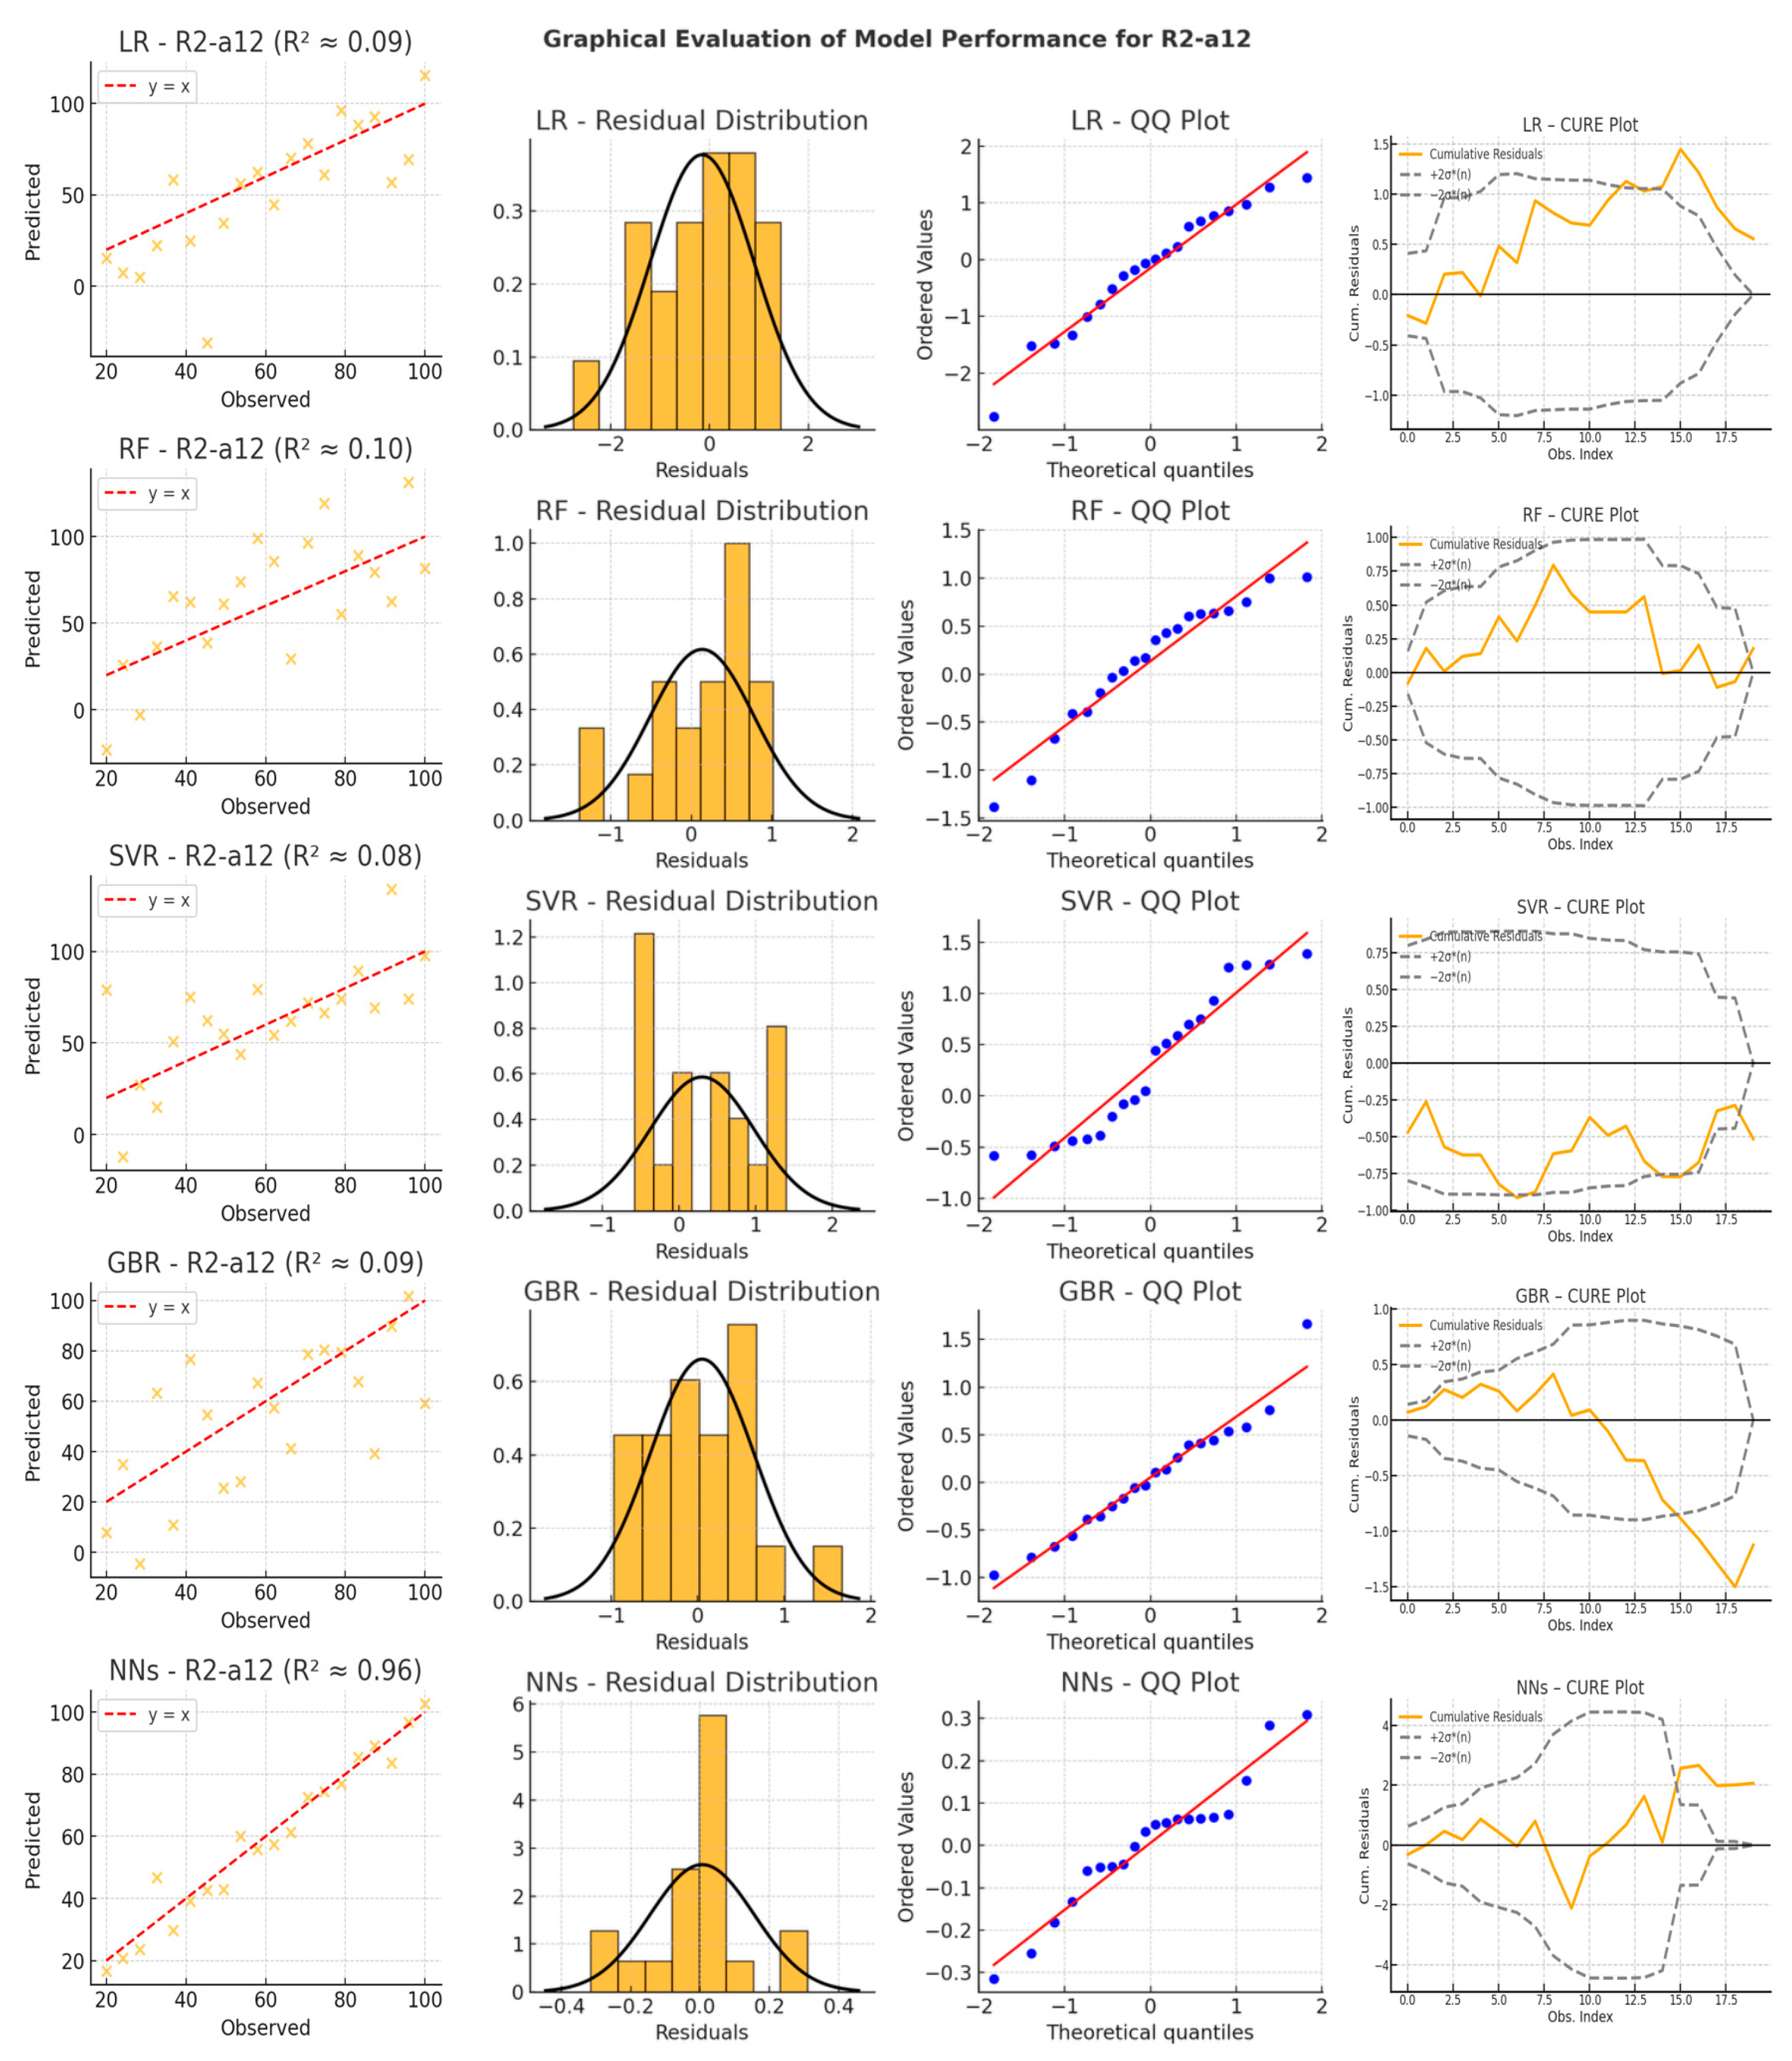
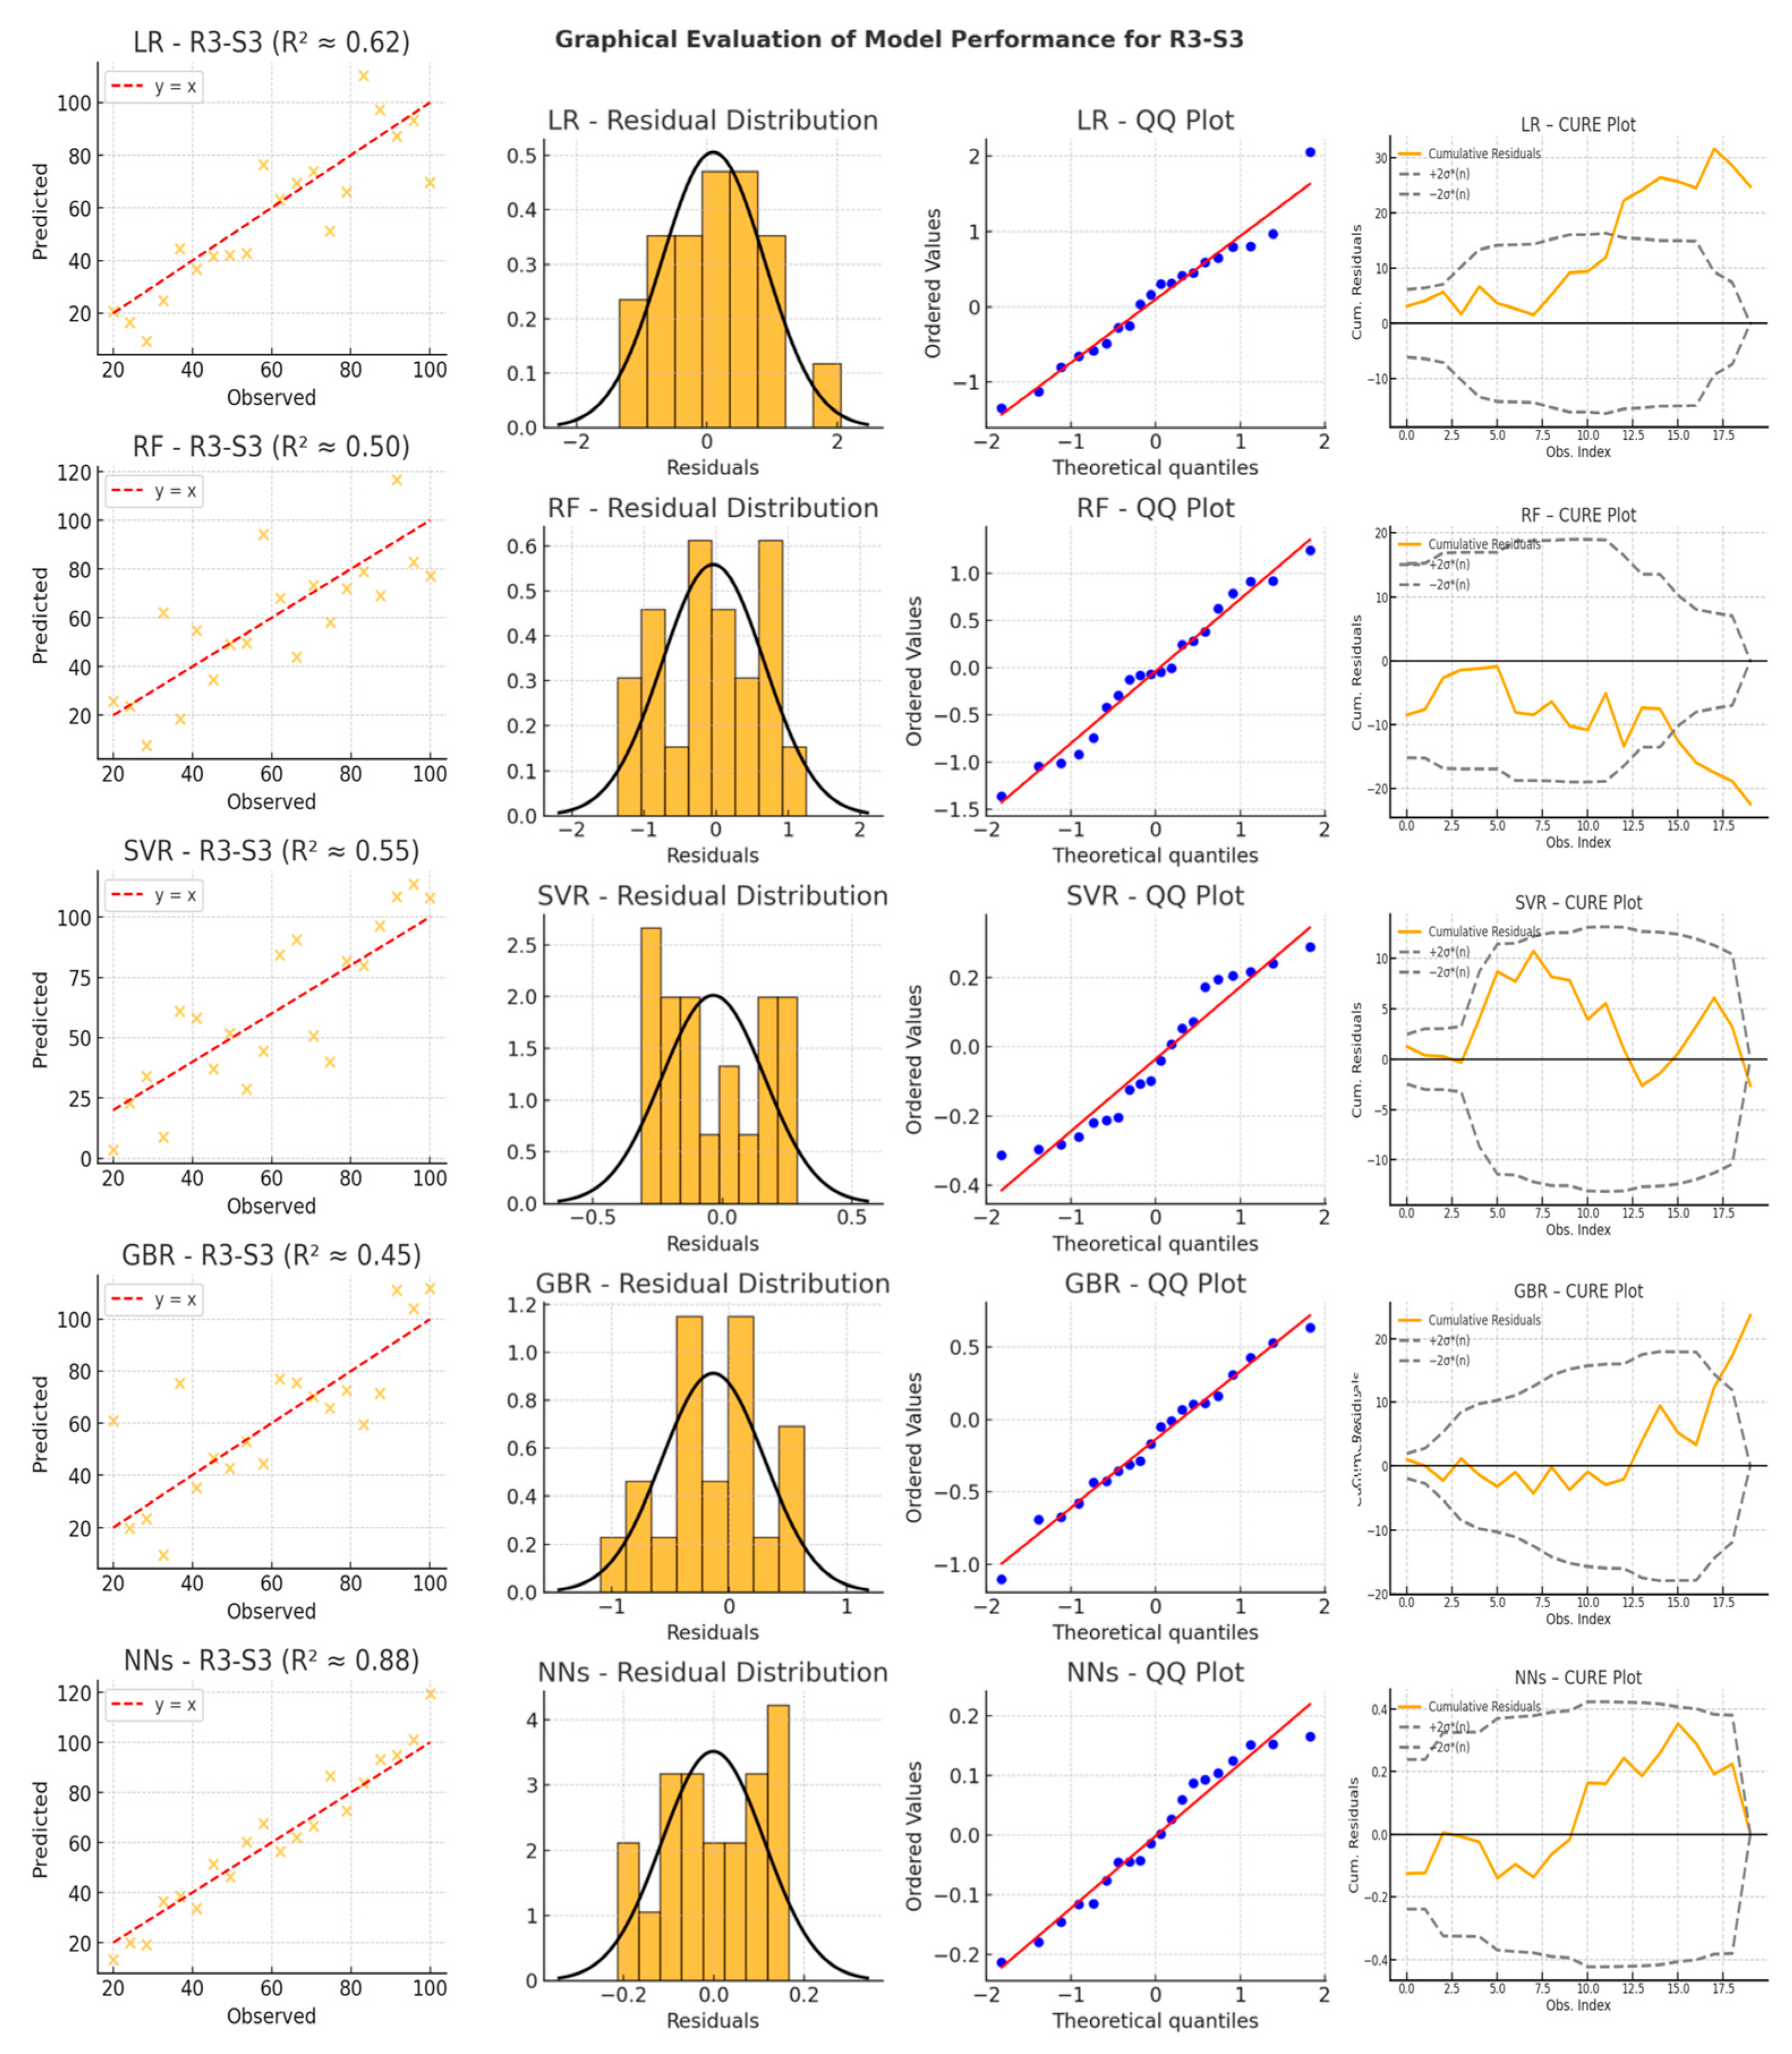
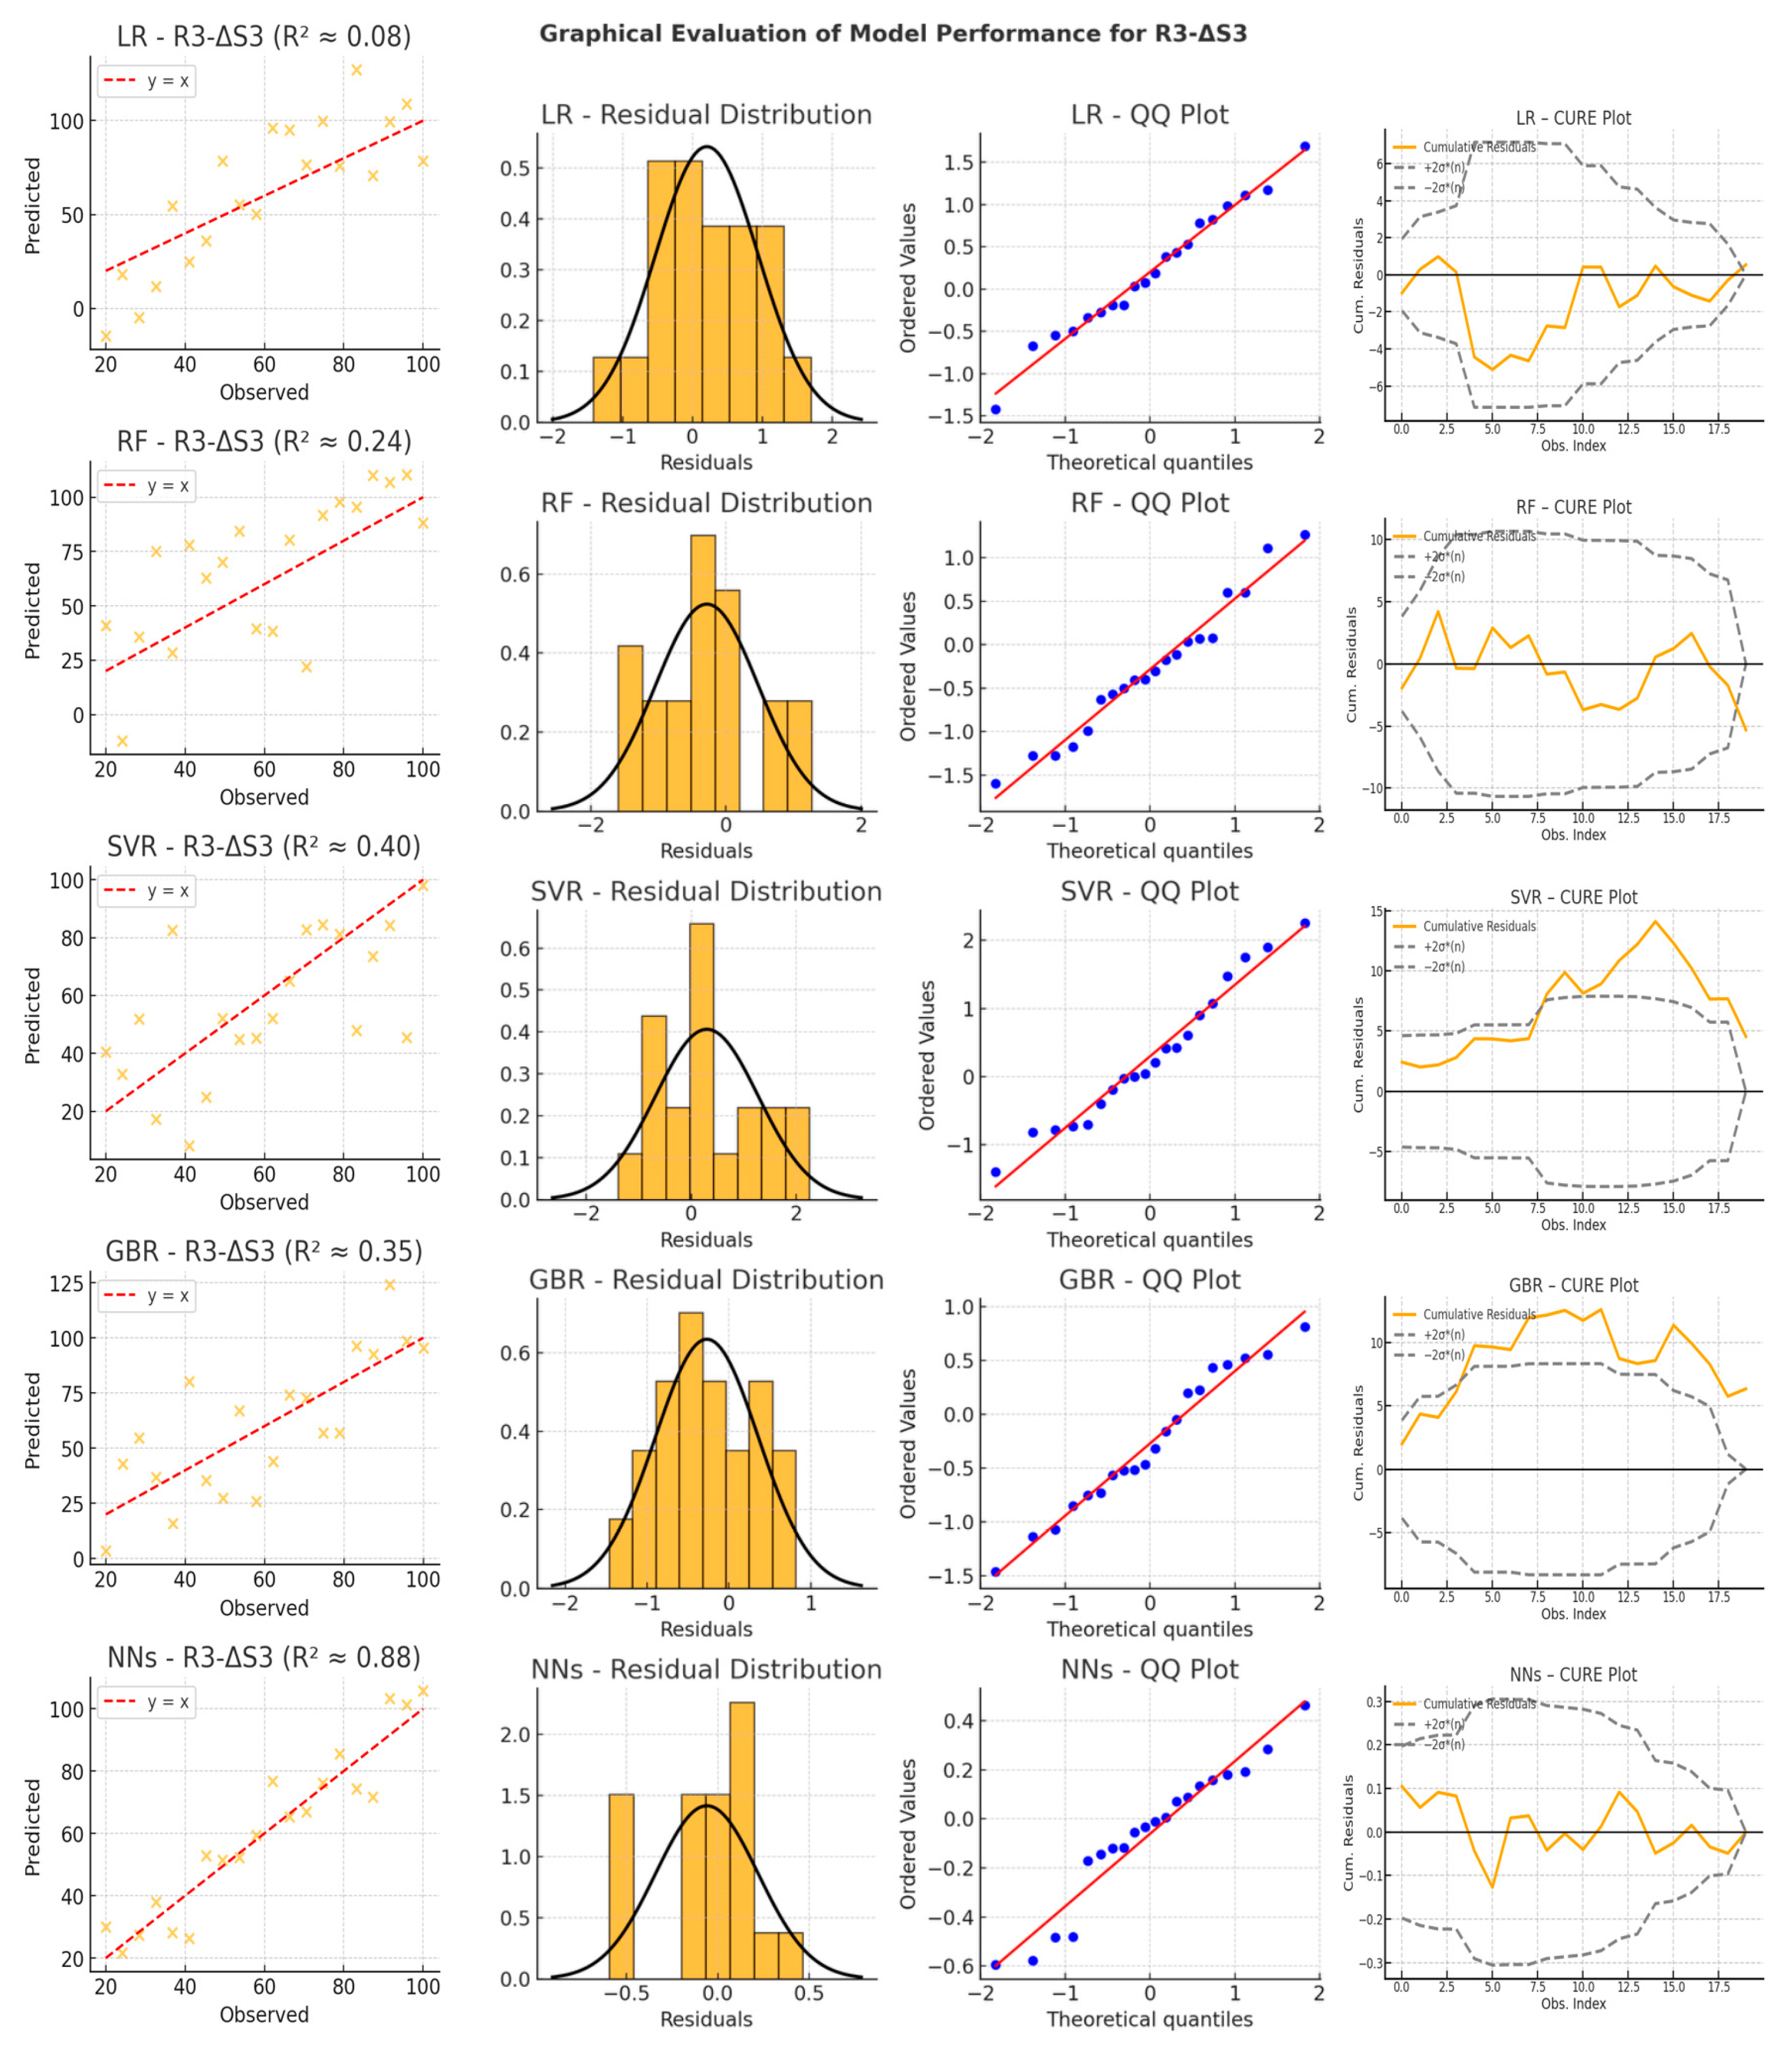
4.2. Graphical Analysis and Model Performance Evaluation

A graphical assessment was conducted for each of the nine diagnostic sets (speed, acceleration, and differential distance at three different radii, R1–R3) using four visualization tools: scatter plots, residual distribution plots, QQ plots, and cumulative residual (CURE) plots. The corresponding graphical representations can be found in Figure 7, Figure 8, Figure 9, Figure 10, Figure 11, Figure 12, Figure 13, Figure 14 and Figure 15, where each set of plots illustrates the prediction accuracy and error behavior of the models for different trajectory variables. These plots provide a direct comparison of model performance and highlight the strengths and limitations of handling nonlinearity and dynamic variations in roundabout navigation.
These visual aids provide both a high-level overview of predictive alignment and a detailed analysis of error behavior, illustrating the strengths and limitations of each model in capturing the diverse driving conditions present in roundabouts.
  • Scatter plots compare observed versus predicted values, offering insight into model accuracy and bias. LR exhibits significant dispersion, particularly for acceleration and differential distance variables, confirming its limited ability to handle nonlinearity. NNs show the most tightly clustered points around the diagonal, reinforcing their capacity to model complex non-linear relationships with high accuracy. RF and GBR perform reasonably well for speed variables, but their scatter increases significantly in acceleration-related predictions (e.g., R2-a12, R3-a23), indicating instability when faced with rapid changes in driving behavior. SVR struggles to maintain predictive consistency, with some high-variance predictions and deviations from the diagonal, particularly in acceleration variables.
  • Residual distribution plots reveal systematic errors across different models. LR residuals exhibit skewness and noticeable deviations from zero, further confirming its difficulty modeling vehicle motion dynamics. RF and GBR show wider residual distributions, capturing some patterns but suffering from high fluctuations. SVR residuals occasionally form multiple peaks, indicating a lack of smoothness and instability across different driving conditions. In contrast, NNs exhibit narrow, symmetric residual distributions, suggesting minimal bias and strong adaptability to both steady and abrupt transitions in vehicle trajectories.
  • QQ plots provide further validation of the error distributions by comparing the residuals against a theoretical normal distribution. LR residuals deviate significantly at both tails, failing to capture extreme changes in speed and acceleration. RF and GBR display heavy tails, indicating that some predictions are prone to large errors, especially in more complex driving scenarios. SVR residuals exhibit deviations that suggest sensitivity to input conditions, particularly when tested outside the primary range of training data. Conversely, NNs align closely with the theoretical normal distribution, demonstrating well-distributed errors and a superior generalization ability.
  • CURE (Cumulative Residuals) plots, generated according to the methodology proposed by Hauer and Bamfo (1997), illustrate how prediction errors accumulate across the dataset and allow a diagnostic evaluation of the model specification [68]. The inclusion of ±2σ*(n) confidence bands allows for the assessment of whether the cumulative residuals behave like a random walk—a key indicator of correct model specification. In this analysis, LR shows a monotonically increasing residual curve that consistently exceeds the confidence limits, confirming its systematic bias and limited goodness of fit. RF, GBR, and SVR show fluctuating but often divergent patterns, indicating a tendency to accumulate errors over time, especially for the acceleration and differential distance variables. In contrast, the NNs maintain an oscillating pattern that moves within confidence bands, emphasizing their ability to self-correct over successive observations. This stability reflects their superior ability to capture dynamic dependencies and ensure smooth, adaptive trajectory predictions.
Taken together, these graphical evaluations confirm that the ability to model non-linear driving dynamics and adapt to rapidly changing conditions is essential for accurate trajectory prediction in roundabouts. While some models perform acceptably for speed variables, they exhibit significant error accumulation in acceleration and differential distance predictions, as is evident in the scatter, residual, and CURE plots. NNs consistently outperform all other models, achieving the highest accuracy, lowest bias, and most stable generalization performance across all variables.

4.3. Comparison of Machine Learning Techniques and Future Research Directions

Quantitative comparisons, based on MSE and the R2, largely confirm the graphical findings, clarifying each model’s strengths and weaknesses:
  • Linear Regression remains the simplest technique, but its linear assumptions are too restrictive for the inherently non-linear dynamics of vehicle motion in roundabouts. While it achieves moderate performance in speed-related variables (especially for the first radius, R1), its performance deteriorates significantly in predicting acceleration and differential distance. This is evidenced by its near-zero R2 values, indicating that in some cases, the LR errors exceed those of a naïve baseline model. Consequently, LR is ill-suited to capture the rapidly changing driving conditions, particularly during roundabout entries and exits.
  • Random Forest and Gradient Boosting Regression, both tree-based methods, show promising results for speed variables, often achieving higher R2 scores than LR. However, their performance is inconsistent for acceleration and differential distance variables, where they frequently exhibit high error variance. In some cases, near-zero R2 values emerge, suggesting a lack of ability to handle rapid sequential changes. Their reliance on splitting the feature space into discrete regions can lead to overfitting on localized patterns, reducing their ability to generalize when driving conditions shift. This instability is particularly evident in the CURE plots, where residuals tend to accumulate unchecked over time, revealing an inability to correct sequential prediction errors. This limitation is especially critical in acceleration and differential distance variables, where tree-based models fail to incorporate sequential dependencies, resulting in inconsistent predictions across different driving scenarios.
  • Support Vector Regression is theoretically capable of capturing non-linear relationships through kernel functions, but its predictive performance depends heavily on hyperparameter tuning. The results show that SVR is occasionally effective in speed prediction, but it struggles in other contexts, with notable dips into near-zero R2 values. This discrepancy is likely due to difficulties in selecting an optimal kernel width and regularization parameters, which are crucial to balancing variance across diverse driving scenarios. As a result, SVR errors become significant when conditions deviate from the range where the model was trained, limiting its applicability to more dynamic scenarios.
  • Neural Networks, which already demonstrated superior performance in the graphical analysis, further confirm their dominance in numerical results, achieving the highest R2 values and the lowest MSE across all variables. Their ability to learn complex patterns and dynamically adapt to changing driving conditions makes them the most suitable model for trajectory prediction in roundabouts.
Future research should focus on refining deep learning architectures, especially by integrating sequence-based models—such as LSTM or Transformer networks—to increase accuracy for acceleration and distance variables. Hybrid approaches that combine physics-based constraints with deep learning can also improve interpretability while maintaining robust performance. In parallel, the addition of different traffic conditions and geometric features to the datasets, together with real-time sensor data (e.g., LiDAR and radar), will further improve the validity and applicability of the models. The adoption of a more holistic assessment framework—encompassing both numerical and visual assessments—will ensure a more sophisticated understanding of model behavior and suitability for trajectory prediction.
The use of multiple machine learning techniques (e.g., ensemble or hybrid models) and the possibility of real-time adaptation (online learning) can account for the unpredictability of real-world driving scenarios. Advanced tools such as ChatGPT-4 can streamline data pre-processing, calibration, and optimization, accelerating the refinement of prediction solutions. As a dynamic assistant for vehicle training and decision making, ChatGPT could interpret complex data, suggest contextual strategies and adapt to new or unforeseen conditions in real time. Ultimately, the integration of AI-driven decision support with live sensor inputs promises more efficient and highly adaptive autonomous vehicles capable of navigating roundabouts and other complex traffic environments with greater ease.
This study represents a significant step forward in trajectory modeling and builds on the MRoundabout model, which was originally developed to isolate the influence of roundabout geometry on vehicle behavior. While the model does not currently account for interactions between road users, ensuring high reliability under controlled assumptions, the results confirm that its predictions remain accurate and effective under these conditions. However, a key direction for future research is to increase the reliability of the model by progressively integrating real traffic interactions so that it can better adapt to dynamic environments and improve its applicability for the navigation of autonomous vehicles in complex environments.

5. Conclusions

This study investigated how well different artificial intelligence techniques—linear regression, random forest, support vector regression, gradient boosting regression, and neural networks—can replicate human driving behavior in roundabouts by predicting speed, acceleration and differential spacing. Although simpler models such as linear regression offered interpretable solutions, they had difficulty capturing non-linear behavior, especially for acceleration and distance-related variables. Ensemble methods such as Random Forest and Gradient Boosting performed better but showed inconsistencies when driving conditions changed rapidly. Support Vector Regression, while theoretically robust for non-linear problems, also had problems with tuning and generalization.
Neural networks were consistently found to be the most accurate and adaptive choice and provided the highest R2 values and the lowest MSE for all variables. Their performance underscores the critical value of deep learning approaches for capturing the dynamic, often abrupt speed and acceleration profiles that drivers exhibit in roundabouts. Furthermore, automating the data pre-processing and tuning of model parameters with advanced AI tools (e.g., ChatGPT) proved instrumental in streamlining the workflow and refining the final model results.
This study isolates the effects of roundabout geometry on vehicle trajectories without the influence of surrounding traffic. However, in real-world scenarios, AVs must deal with additional complexities, such as lane-sharing, evasive maneuvers, and dynamic entry and exit conditions, all of which contribute to the variability of speed profiles and trajectory decisions. The accurate modeling of vehicle behavior under controlled conditions provides a solid foundation for refining AV control strategies. By establishing a reliable framework, this research supports the development of more adaptive trajectory planning models and improves their ability to operate effectively in increasingly dynamic traffic environments.
An important contribution of this study lies in its clear implications for sustainable mobility. By using AI-driven predictive models to optimize AV trajectories in roundabouts, the proposed approaches can lead to smoother traffic flow and less congestion, reducing fuel consumption and pollutant emissions. The increased efficiency and adaptability of AVs can also contribute to a safer urban environment and have a positive impact on social and economic sustainability. Therefore, the developed methodology directly supports the goals of sustainable urban transportation by addressing critical challenges such as environmental impact, energy efficiency, traffic safety, and improved quality of life in densely populated areas.
Future research will aim to further integrate real-world traffic interactions and explore hybrid modeling techniques to improve the practical applicability and impact on the sustainability of navigation strategies of autonomous vehicles.

Author Contributions

Conceptualization, N.D. and S.L.; methodology, C.G., N.D. and S.L.; software, N.D. and S.L.; validation, S.L.; formal analysis, N.D.; investigation, N.D. and S.L.; resources, N.D. and S.L.; data curation, S.L.; writing—original draft preparation, C.G., N.D. and S.L.; writing—review and editing, C.G., N.D. and S.L.; visualization, C.G. and N.D.; supervision, S.L.; Funding acquisition, SL. All authors have read and agreed to the published version of the manuscript.

Funding

This work was carried out as part of the project “SICURI—Strade Intelligenti per CondUcenti che impiegano smaRt vehIcles” (prot. no. 267490 of 10/07/2024), funded by the PIAno di InCEntivi per la Ricerca di Ateneo 2024/2026 (PIA.CE.RI 2024/2026)—Linea di Intervento 1 “Progetti di ricerca collaborativa” of the University of Catania.

Institutional Review Board Statement

Not applicable to this study because effects on humans are essentially nonexistent.

Informed Consent Statement

Not applicable to this study because no subjects were involved in the research trials.

Data Availability Statement

The original contributions presented in this study are included in the article. Further inquiries can be directed to the corresponding author.

Conflicts of Interest

The authors declare no conflicts of interest.

References

  1. Wu, Y.; Zhu, F. Junction Management for Connected and Automated Vehicles: Intersection or Roundabout? Sustainability 2021, 13, 9482. [Google Scholar] [CrossRef]
  2. Martin-Gasulla, M.; Elefteriadou, L. Traffic Management with Autonomous and Connected Vehicles at Single-Lane Roundabouts. Transp. Res. Part C Emerg. Technol. 2021, 125, 102964. [Google Scholar] [CrossRef]
  3. Ziraldo, E.; Govers, M.E.; Oliver, M. Enhancing Autonomous Vehicle Decision-Making at Intersections in Mixed-Autonomy Traffic: A Comparative Study Using an Explainable Classifier. Sensors 2024, 24, 3859. [Google Scholar] [CrossRef] [PubMed]
  4. Leonardi, S.; Distefano, N. Roundabout Trajectory Planning: Integrating Human Driving Models for Autonomous Vehicles. Sustainability 2023, 15, 6288. [Google Scholar] [CrossRef]
  5. Benciolini, T.; Fink, M.; Güzelkaya, N.; Wollherr, D.; Leibold, M. Safe and Non-Conservative Trajectory Planning for Autonomous Driving Handling Unanticipated Behaviors of Traffic Participants. arXiv 2024. [Google Scholar] [CrossRef]
  6. Yiting, W.; Wuxing, Z.; Hui, Z.; Jian, Z. Stochastic Trajectory Planning Considering Parameter and Initial State Uncertainty. IEEE Access 2021. [Google Scholar] [CrossRef]
  7. Vysotska, N.; Nakonechnyi, I. Automobile System for Predicting the Trajectory of Vehicle Movement. Int. Sci. J. Eng. Agric. 2024, 3, 38–50. [Google Scholar] [CrossRef]
  8. Zhang, Y. LIDAR–Camera Deep Fusion for End-to-End Trajectory Planning of Autonomous Vehicle. J. Phys. Conf. Ser. 2022, 2284, 012006. [Google Scholar] [CrossRef]
  9. Tramacere, E.; Luciani, S.; Feraco, S.; Circosta, S.; Khan, I.; Bonfitto, A.; Amati, N. Local Trajectory Planning for Autonomous Racing Vehicles Based on the Rapidly-Exploring Random Tree Algorithm. In Proceedings of the ASME 2021 International Design Engineering Technical Conferences and Computers and Information in Engineering Conference, (IDETC-CIE 2021), Virtual, 17–19 August 2021. [Google Scholar] [CrossRef]
  10. Singh, V.; Sastry Hari, S.K.; Tsai, T.; Pitale, M. Simulation Driven Design and Test for Safety of AI-Based Autonomous Vehicles. In Proceedings of the 2021 IEEE/CVF Conference on Computer Vision and Pattern Recognition Workshops (CVPRW), Nashville, TN, USA, 19–25 June 2021; pp. 122–128. [Google Scholar] [CrossRef]
  11. An, H.; Choi, W.; Choi, S. Real-Time Path Planning for Trajectory Control in Autonomous Driving. In Proceedings of the 24th International Conference on Advanced Communication Technology (ICACT), Pyeongchang, Republic of Korea, 13–16 February 2022; pp. 366–371. [Google Scholar] [CrossRef]
  12. Tezerjani, M.D.; Carrillo, D.; Qu, D.; Dhakal, S.; Mirzaeinia, A.; Yang, Q. Real-Time Motion Planning for Autonomous Vehicles in Dynamic Environments. arXiv 2024, arXiv:2406.02916. [Google Scholar] [CrossRef]
  13. Jie, C.; Yingbing, C.; Qingwen, Z.; Lu, G.; Ming, L. Real-Time Trajectory Planning for Autonomous Driving with Gaussian Process and Incremental Refinement. In Proceedings of the 2022 International Conference on Robotics and Automation (ICRA), Philadelphia, PA, USA, 23–27 May 2022; pp. 8999–9005. [Google Scholar] [CrossRef]
  14. Jiang, Y.; Jin, X.; Xiong, Y.; Liu, Z. A Dynamic Motion Planning Framework for Autonomous Driving in Urban Environments. In Proceedings of the 2020 39th Chinese Control Conference (CCC), Shenyang, China, 27–30 July 2020; pp. 5429–5435. [Google Scholar] [CrossRef]
  15. Wang, Z.; Tu, J.; Chen, C. Reinforcement Learning Based Trajectory Planning for Autonomous Vehicles. In Proceedings of the 2021 China Automation Congress (CAC), Beijing, China, 22–24 October 2021; pp. 2768–2773. [Google Scholar] [CrossRef]
  16. Liu, J.; Mao, X.; Fang, Y.; Zhu, D.; Meng, M.Q.H. A Survey on Deep-Learning Approaches for Vehicle Trajectory Prediction in Autonomous Driving. In Proceedings of the 2021 IEEE International Conference on Robotics and Biomimetics (ROBIO), Sanya, China, 27–31 December 2021; pp. 978–985. [Google Scholar] [CrossRef]
  17. Jiang, H.; Chang, L.; Li, Q.; Chen, D. Trajectory Prediction of Vehicles Based on Deep Learning. In Proceedings of the 2019 4th International Conference on Intelligent Transportation Engineering (ICITE), Singapore, 5–7 September 2019; pp. 98–104. [Google Scholar] [CrossRef]
  18. Xu, Y.; Wang, Y.; Peeta, S. Leveraging Transformer Model to Predict Vehicle Trajectories in Congested Urban Traffic. Transp. Res. Rec. 2022, 2677, 898–909. [Google Scholar] [CrossRef]
  19. Frauenknecht, B.; Ehlgen, T.; Trimpe, S. Data-Efficient Deep Reinforcement Learning for Vehicle Trajectory Control. In Proceedings of the 2023 IEEE 26th International Conference on Intelligent Transportation Systems (ITSC), Bilbao, Spain, 24–28 September 2023. [Google Scholar] [CrossRef]
  20. Amin, F.; Gharami, K.; Sen, B. TrajectoFormer: Transformer-Based Trajectory Prediction of Autonomous Vehicles with Spatio-Temporal Neighborhood Considerations. Int. J. Comput. Intell. Syst. 2024, 17, 87. [Google Scholar] [CrossRef]
  21. Li, G.; Li, S.; Li, S.; Qin, Y.; Cao, D.; Qu, X.; Cheng, B. Deep Reinforcement Learning Enabled Decision-Making for Autonomous Driving at Intersections. Automot. Innov. 2020, 3, 374–385. [Google Scholar] [CrossRef]
  22. Singh, D.; Srivastava, R. Graph Neural Network with RNNs-Based Trajectory Prediction of Dynamic Agents for Autonomous Vehicles. Appl. Intell. 2022, 52, 12801–12816. [Google Scholar] [CrossRef]
  23. Jiao, Y.; Miao, M.; Yin, Z.; Lei, C.; Zhu, X.; Nie, L.; Tao, B. A Hierarchical Hybrid Learning Framework for Multi-Agent Trajectory Prediction. IEEE Trans. Intell. Transp. Syst. 2024, 25, 10344–10354. [Google Scholar] [CrossRef]
  24. Bani-Hani, R.; Aljbour, S.; Shurman, M. Autonomous Vehicles Trajectory Prediction Approach Using Machine Learning. In Proceedings of the 2023 14th International Conference on Information and Communication Systems (ICICS), Irbid, Jordan, 21–23 November 2023. [Google Scholar] [CrossRef]
  25. Hao, C.; Chen, Y.; Cheng, S.; Zhang, H. Improving Vehicle Trajectory Prediction with Online Learning. In Proceedings of the 2023 IEEE Intelligent Vehicles Symposium (IV), Anchorage, AK, USA, 4–7 June 2023; pp. 561–567. [Google Scholar] [CrossRef]
  26. Jardine, P.T.; Givigi, S.N.; Yousefi, S. Experimental Results for Autonomous Model-Predictive Trajectory Planning Tuned with Machine Learning. In Proceedings of the 2017 Annual IEEE International Systems Conference (SysCon), Montreal, QC, Canada, 24–27 April 2017; pp. 1–7. [Google Scholar] [CrossRef]
  27. Ghariblu, H.; Moghaddam, H.B. Trajectory Planning of Autonomous Vehicle in Freeway Driving. Transp. Telecommun. J. 2021, 22, 278–286. [Google Scholar] [CrossRef]
  28. Bajić, J.; Herceg, M.; Resetar, I.; Velikic, I. Trajectory Planning for Autonomous Vehicle Using Digital Map. In Proceedings of the 2019 Zooming Innovation in Consumer Technologies Conference (ZINC), Novi Sad, Serbia, 29–30 May 2019; pp. 44–49. [Google Scholar] [CrossRef]
  29. Wang, C.; Xu, N.; Huang, Y.; Guo, K.; Liu, Y.; Li, Q. Trajectory Planning for Autonomous Vehicles Based on Improved Hybrid A. Int. J. Veh. Des. 2020, 218, 218–239. [Google Scholar] [CrossRef]
  30. Hu, P.; Ma, Z.; Wang, H.; Li, H.; Peng, K.; Zhang, H. Trajectory Planning Method of Autonomous Vehicle in Road Scene. In Proceedings of the 2022 China Automation Congress (CAC), Xiamen, China, 25–27 November 2022; pp. 512–517. [Google Scholar] [CrossRef]
  31. Waleed, A.; Hammad, S.; Abdelaziz, M.; Maged, S. Trajectory Planning Approach for Autonomous Electric Bus in Dynamic Environment. Proc. Inst. Mech. Eng. Part D J. Automob. Eng. 2023, 238, 4255–4270. [Google Scholar] [CrossRef]
  32. Said, A.; Talj, R.; Francis, C.; Shraim, H. Local Trajectory Planning for Autonomous Vehicle with Static and Dynamic Obstacles Avoidance. In Proceedings of the 2021 IEEE International Intelligent Transportation Systems Conference (ITSC), Indianapolis, IN, USA, 19–22 September 2021; pp. 2738–2743. [Google Scholar] [CrossRef]
  33. Levy, R.; Haddad, J. Path and Trajectory Planning for Autonomous Vehicles on Roads without Lanes. In Proceedings of the 2021 IEEE International Intelligent Transportation Systems Conference (ITSC), Indianapolis, IN, USA, 19–22 September 2021; pp. 2679–2684. [Google Scholar] [CrossRef]
  34. Zhang, D.; Yu, Z.; Xiong, L.; Zhao, J.; Zhang, P.; Li, Y.; Xia, L.; Wei, Y.; Li, Z.; Fu, Z. Driving-Behavior-Oriented Trajectory Planning for Autonomous Vehicle Driving on Urban Structural Road. Proc. Inst. Mech. Eng. Part D J. Automob. Eng. 2020, 235, 975–995. [Google Scholar] [CrossRef]
  35. Fiorentini, N.; Pellegrini, D.; Losa, M. Overfitting Prevention in Accident Prediction Models: Bayesian Regularization of Artificial Neural Networks. Transp. Res. Rec. J. Transp. Res. Board 2022, 2677, 1455–1470. [Google Scholar] [CrossRef]
  36. Daoud, G.; El-Darieby, M. Towards a Benchmark for Trajectory Prediction of Autonomous Vehicles. In Proceedings of the 2023 10th International Conference on Dependable Systems and Their Applications (DSA), Tokyo, Japan, 10–11 August 2023; pp. 614–622. [Google Scholar] [CrossRef]
  37. Bala, J.A.; Adeshina, S.A.; Aibinu, A.M. Implementing Nonlinear Model Predictive Control for Enhanced Trajectory Tracking and Road Anomaly Avoidance in Autonomous Vehicles. In Proceedings of the 2023 2nd International Conference on Multidisciplinary Engineering and Applied Science (ICMEAS), Abuja, Nigeria, 1–3 November 2023; pp. 1–6. [Google Scholar] [CrossRef]
  38. Malfoy, A.; Ajwad, S.A.; Boudkhil, M. Autonomous Parking System for Vehicles: Trajectory Planning and Control. In Proceedings of the 2023 IEEE 11th International Conference on Systems and Control (ICSC), Sousse, Tunisia, 18–20 December 2023; pp. 1–6. [Google Scholar] [CrossRef]
  39. Maulud, D.H.; Abdulazeez, A. A Review on Linear Regression Comprehensive in Machine Learning. J. Appl. Sci. Technol. Trends 2020, 1, 140–147. [Google Scholar] [CrossRef]
  40. Marrie, R.A.; Dawson, N.V.; Garland, A. Quantile Regression and Restricted Cubic Splines Are Useful for Exploring Relationships Between Continuous Variables. J. Clin. Epidemiol. 2009, 62, 511–517. [Google Scholar] [CrossRef] [PubMed]
  41. Miller, P.; Lubke, G.; McArtor, D.B.; Bergeman, C. Finding Structure in Data Using Multivariate Tree Boosting. Psychol. Methods 2015, 21, 583–602. [Google Scholar] [CrossRef]
  42. Şahin, E. Assessing the Predictive Capability of Ensemble Tree Methods for Landslide Susceptibility Mapping Using XGBoost, Gradient Boosting Machine, and Random Forest. SN Appl. Sci. 2020, 2, 1308. [Google Scholar] [CrossRef]
  43. Robnik-Šikonja, M. Improving Random Forests. Lect. Notes Comput. Sci. 2004, 359, 370. [Google Scholar] [CrossRef]
  44. Ustün, B.; Melssen, W.; Buydens, L. Visualization and Interpretation of Support Vector Regression Models. Anal. Chim. Acta 2007, 595, 299–309. [Google Scholar] [CrossRef]
  45. Dhhan, W.; Rana, S.; Alshaybawee, T.; Midi, H. The Single-Index Support Vector Regression Model to Address the Problem of High Dimensionality. Commun. Stat.—Simul. Comput. 2018, 47, 2792–2799. [Google Scholar] [CrossRef]
  46. Somers, M.; Casal, J. Using Artificial Neural Networks to Model Nonlinearity. Organ. Res. Methods 2009, 12, 403–417. [Google Scholar] [CrossRef]
  47. Blank, T.B.; Brown, S.D. Data Processing Using Neural Networks. Anal. Chim. Acta 1993, 277, 273–287. [Google Scholar] [CrossRef]
  48. Nti, I.K.; Yarko-Boateng, O.N.; Aning, J. Performance of Machine Learning Algorithms with Different K Values in K-Fold Cross-Validation. Int. J. Inf. Technol. Comput. Sci. 2021, 6, 5. [Google Scholar] [CrossRef]
  49. Prihandono, M.A.; Harwahyu, R.; Sari, R.F. Performance of Machine Learning Algorithms for IT Incident Management. In Proceedings of the 2020 11th International Conference on Awareness Science and Technology (iCAST), Qingdao, China, 7–9 December 2020; pp. 1–6. [Google Scholar] [CrossRef]
  50. Fiorentini, N.; Leandri, P.; Losa, M. Defining Machine Learning Algorithms as Accident Prediction Models for Italian Two-Lane Rural, Suburban, and Urban Roads. Int. J. Inj. Control Saf. Promot. 2022, 29, 450–462. [Google Scholar] [CrossRef]
  51. Joseph, V.R. Optimal Ratio for Data Splitting. Stat. Anal. Data Min. ASA Data Sci. J. 2022, 15, 531–538. [Google Scholar] [CrossRef]
  52. Joseph, V.R.; Vakayil, A. SPlit: An Optimal Method for Data Splitting. Technometrics 2021, 63, 490–502. [Google Scholar] [CrossRef]
  53. Rácz, A.; Bajusz, D.; Héberger, K. Effect of Dataset Size and Train/Test Split Ratios in QSAR/QSPR Multiclass Classification. Molecules 2021, 26, 1111. [Google Scholar] [CrossRef] [PubMed]
  54. Bichri, H.; Chergui, A.; Hain, M. Investigating the Impact of Train/Test Split Ratio on the Performance of Pre-Trained Models with Custom Datasets. Int. J. Adv. Comput. Sci. Appl. 2024, 15, 252–258. [Google Scholar] [CrossRef]
  55. Wei, Y.T.; Yang, F.; Wainwright, M.J. Early Stopping for Kernel Boosting Algorithms: A General Analysis with Localized Complexities. IEEE Trans. Inf. Theory 2019, 65, 6685–6703. [Google Scholar] [CrossRef]
  56. Scetbon, M.; Dohmatob, E. Robust Linear Regression: Gradient-Descent, Early-Stopping, and Beyond. In Proceedings of the 26th International Conference on Artificial Intelligence and Statistics (AISTATS), Valencia, Spain, 25–27 April 2023; Volume 206, pp. 11583–11607. [Google Scholar] [CrossRef]
  57. Wan, H. Gradient Descent Boosting: Convergence and Algorithm. Computer Science, Mathematics. Available online: https://courses.engr.illinois.edu/ece543/sp2017/projects/Haohua%20Wan.pdf (accessed on 10 January 2025).
  58. Malinin, A.; Prokhorenkova, L.; Ustimenko, A. Uncertainty in Gradient Boosting via Ensembles. In Proceedings of the 9th International Conference on Learning Representations (ICLR), Virtual, 3–7 May 2021; pp. 1–17. [Google Scholar] [CrossRef]
  59. Tayebi Arasteh, S.; Han, T.; Lotfinia, M.; Kuhl, C.; Kather, J.N.; Truhn, D.; Nebelung, S. Large Language Models Streamline Automated Machine Learning for Clinical Studies. Nat. Commun. 2024, 15, 1603. [Google Scholar] [CrossRef]
  60. Basheer, B.; Obaidi, M. Enhancing Healthcare Data Classification: Leveraging Machine Learning on ChatGPT-Generated Datasets. Int. J. Adv. Appl. Comput. Intell. 2024, 5, 33–34. [Google Scholar] [CrossRef]
  61. Nasayreh, A.; Mamlook, R.E.; Samara, G.; Gharaibeh, H.; Aljaidi, M.; Alzu’bi, D.; Al-Daoud, E.; Abualigah, L. Arabic Sentiment Analysis for ChatGPT Using Machine Learning Classification Algorithms: A Hyperparameter Optimization Technique. ACM Trans. Asian Low-Resour. Lang. Inf. Process. 2024, 23, 1–19. [Google Scholar] [CrossRef]
  62. Weidinger, L.; Mellor, J.; Rauh, M.; Griffin, C.; Uesato, J.; Huang, P.S.; Cheng, M.; Glaese, M.; Balle, B.; Kasirzadeh, A.; et al. Ethical and Social Risks of Harm from Language Models. arXiv 2021, arXiv:2112.04359. [Google Scholar] [CrossRef]
  63. Feurer, M.; Klein, A.; Eggensperger, K.; Springenberg, J.T.; Blum, M.; Hutter, F. Auto-Sklearn: Efficient and Robust Automated Machine Learning. In Automated Machine Learning; Springer: Cham, Switzerland, 2019; pp. 113–134. [Google Scholar] [CrossRef]
  64. Bommasani, R.; Hudson, D.A.; Adeli, E.; Altman, R.; Arora, S.; von Arx, S.; Bernstein, M.S.; Bohg, J.; Bosselut, A.; Brunskill, E.; et al. On the Opportunities and Risks of Foundation Models. arXiv 2021, arXiv:2108.07258. [Google Scholar] [CrossRef]
  65. Alsanwy, S.; Qazani, M.C.; Al-Ashwal, W.; Shajari, A.; Nahavandi, S.; Asadi, H. Vehicle Trajectory Prediction Using Deep Learning for Advanced Driver Assistance Systems and Autonomous Vehicles. In Proceedings of the 2024 IEEE International Systems Conference (SysCon), Montreal, QC, Canada, 15–18 April 2024; pp. 1–8. [Google Scholar] [CrossRef]
  66. Fan, S.; Li, X.; Li, F. Intention-Driven Trajectory Prediction for Autonomous Driving. In Proceedings of the 2021 IEEE Intelligent Vehicles Symposium (IV), Nagoya, Japan, 11–17 July 2021; pp. 107–113. [Google Scholar] [CrossRef]
  67. Li, M.; Li, Z.; Xu, C.; Liu, T. Short-Term Prediction of Safety and Operation Impacts of Lane Changes in Oscillations with Empirical Vehicle Trajectories. Accid. Anal. Prev. 2020, 135, 105345. [Google Scholar] [CrossRef]
  68. Hauer, E.; Bamfo, J. Two Tools for Finding What Function Links the Dependent Variable to the Explanatory Variables. In Proceedings of the ICTCT Conference, Lund, Sweden, 5–7 November 1997. [Google Scholar]
Figure 1. Random Forest Model: simplified diagram.
Sustainability 17 02988 g001
Figure 2. Support Vector Regression with radial basis function kernel.
Sustainability 17 02988 g002
Figure 3. Gradient Boosting Regression: simplified diagram.
Sustainability 17 02988 g003
Figure 4. Simplified Neural Network architecture.
Sustainability 17 02988 g004
Figure 5. MRoundabout speed model showing speed variations across Turning Regions in a single-lane roundabout.
Sustainability 17 02988 g005
Figure 6. Workflow illustrating ChatGPT-4-assisted steps in model development.
Sustainability 17 02988 g006
Figure 7. Graphical evaluation of model performance for the R1-S1 variable pair using four diagnostic plots.
Sustainability 17 02988 g007
Figure 8. Graphical evaluation of model performance for the R1-d01 variable pair using four diagnostic plots.
Sustainability 17 02988 g008
Figure 9. Graphical evaluation of model performance for the R1-ΔS1 variable pair using four diagnostic plots.
Sustainability 17 02988 g009
Figure 10. Graphical evaluation of model performance for the R2-S2 variable pair using four diagnostic plots.
Sustainability 17 02988 g010
Figure 11. Graphical evaluation of model performance for the R2-a12 variable pair using four diagnostic plots.
Sustainability 17 02988 g011
Figure 12. Graphical evaluation of model performance for the R2-ΔS2 variable pair using four diagnostic plots.
Sustainability 17 02988 g012
Figure 13. Graphical evaluation of model performance for the R3-S3 variable pair using four diagnostic plots.
Sustainability 17 02988 g013
Figure 14. Graphical evaluation of model performance for the R3-a23 variable pair using four diagnostic plots.
Sustainability 17 02988 g014
Figure 15. Graphical evaluation of model performance for the R3-ΔS3 variable pair using four diagnostic plots.
Sustainability 17 02988 g015
Table 1. Comparison of model performance across training, validation, and test sets.
ModelVariableMSE (Train)MSE (Validation)MSE (Test)R2 (Train)R2 (Validation)R2 (Test)
LRR1-S15.285.535.780.670.650.63
RFR1-S14.535.036.040.850.810.73
SVRR1-S14.815.066.330.850.800.70
GBRR1-S14.194.655.580.860.830.74
NNsR1-S16.00 × 10−49.00 × 10−41.10 × 10−31.000.960.84
LRR2-S216.6117.4118.210.700.680.66
RFR2-S214.2515.8319.000.400.390.30
SVRR2-S28.338.7711.000.680.640.55
GBRR2-S216.6118.4623.000.300.290.22
NNsR2-S22.20 × 10−33.20 × 10−34.50 × 10−31.000.950.85
LRR3-S314.3315.1116.000.680.660.62
RFR3-S312.2813.6516.500.580.560.50
SVRR3-S39.489.9812.500.670.640.55
GBRR3-S312.4613.8417.000.570.560.45
NNsR3-S33.20 × 10−34.50 × 10−35.80 × 10−30.980.930.88
LRR1-d011.00 × 10−31.00 × 10−31.00 × 10−35.00 × 10−45.00 × 10−45.00 × 10⁻⁴
RFR1-d013.00 × 10−43.00 × 10−44.00 × 10−40.730.710.68
SVRR1-d015.00 × 10−45.00 × 10−46.00 × 10−40.560.540.50
GBRR1-d014.00 × 10−44.00 × 10−45.00 × 10−40.680.660.62
NNsR1-d010.000.000.001.000.990.99
LRR2-a120.040.040.040.100.090.09
RFR2-a120.030.040.040.120.110.10
SVRR2-a120.030.040.040.100.090.08
GBRR2-a120.030.040.040.110.100.09
NNsR2-a124.00 × 10−45.00 × 10−46.00 × 10−40.980.970.96
LRR3-a230.070.070.070.190.180.17
RFR3-a230.070.070.080.210.190.17
SVRR3-a230.070.070.080.200.180.16
GBRR3-a230.070.070.080.210.190.18
NNsR3-a233.00 × 10−33.70 × 10−34.50 × 10−30.940.930.92
LRR1S10.330.350.360.220.210.18
RFR1S10.590.650.780.410.350.22
SVRR1S10.450.480.570.570.500.43
GBRR1S10.570.640.760.430.360.23
NNsR1S10.000.005.00 × 10−40.950.950.94
LRR2S21.972.072.180.080.070.07
RFR2S21.771.972.370.130.130.12
SVRR2S22.092.202.750.040.030.02
GBRR2S21.942.042.490.120.110.09
NNsR2S22.00 × 10−32.90 × 10−33.80 × 10−30.930.920.91
LRR3S32.512.642.770.090.090.08
RFR3S33.854.275.130.430.370.24
SVRR3S33.233.404.120.530.500.40
GBRR3S33.573.754.540.510.410.35
NNsR3S32.90 × 10−34.10 × 10−35.40 × 10−30.890.890.88
Disclaimer/Publisher’s Note: The statements, opinions and data contained in all publications are solely those of the individual author(s) and contributor(s) and not of MDPI and/or the editor(s). MDPI and/or the editor(s) disclaim responsibility for any injury to people or property resulting from any ideas, methods, instructions or products referred to in the content.

