1. Introduction
In 2021, South Korea’s nominal GDP was USD 1818.432 billion, ranking 11th globally. However, by 2023, it had declined to USD 1712.793 billion, dropping to 14th place worldwide. South Korea first entered the top 20 global economies in 1987, rising to 11th place by 1997, but as of 2024, it has not yet regained its previous ranking [
1]. A critical turning point in South Korea’s economic development was the launch of the First Five-Year Economic Development Plan in 1962. During the Seventh Five-Year Plan (which lasted until 1996), the country experienced rapid economic growth, giving rise to the term “Miracle on the Han River”. Following the Asian Financial Crisis, South Korea introduced substantial reforms to its economic system, successfully navigating a path to recovery. Particularly, during the early 2000s, President Kim Dae-jung’s administration prioritized the “Information Revolution”, establishing a strong foundation for digital infrastructure and continuously advancing government services. Consequently, South Korea improved its ranking in the UN E-Government Index, moving from 15th place in 2002 to 2nd place in 2022. Additionally, in several subcategories, such as the E-Government Development Index, Online Service Index, and Online Participation Index, South Korea has frequently ranked first [
2].
South Korea has thus transformed from a war-torn nation in the 1950s into a top-10 global economy and, since the early 2000s, has actively promoted digitalization, establishing a robust knowledge-based service infrastructure. Consequently, it is now recognized as a global leader in information services. However, since the 2000s, South Korea’s economic growth rate has slowed. It dropped from the 4–5% range to 3% in the 2010s and further declined to 1% in 2023, which led to a drop in its global economic ranking [
3]. This deceleration in economic growth is not unique to South Korea but is a common phenomenon among advanced economies. According to the International Monetary Fund (IMF), the average economic growth rate of G7 countries in 2024 is projected to be 1.1%, indicating a broader trend of growth stagnation among developed nations [
1]. These trends suggest that countries must explore new avenues for sustainable economic growth.
As artificial intelligence rapidly evolves and is integrated into various industries, industrial ecosystems are transforming, and new economic sectors are emerging. Furthermore, developing a sustainable economic growth model is a shared global challenge. Therefore, governments must facilitate the creation, accumulation, and distribution of new resources to generate added value and establish a foundation for economic system innovation. A key industry that supports such economic transformation is Knowledge-Intensive Business Services (KIBS) [
4,
5,
6,
7].
KIBS serve as an intermediate input for other organizations, supplementing or replacing internal service functions to enhance production efficiency and quality [
8]. Miles (1995) outlined three key characteristics of KIBS: (1) they rely heavily on specialized knowledge; (2) they act as a primary resource for information and knowledge, producing intermediary services that support clients’ production processes; and (3) they play a critical role in competition, primarily providing services to businesses [
9]. Based on these attributes, KIBS play a pivotal role in fostering innovation within national economic systems and generating value across various industries.
Research on KIBS has been conducted from various perspectives depending on the industries and organizations that demand such services. Studies have categorized KIBS demand based on business sectors [
10,
11,
12,
13,
14], regions and national economies [
15,
16,
17,
18], and types of innovation [
4,
5,
6,
7]. These studies have demonstrated that KIBS positively influence organizational and financial performance, innovation, and employment. However, their effectiveness varies based on the intensity of knowledge concentration, network connectivity, and workforce expertise. National-level studies have primarily examined the role and impact of KIBS across countries at the regional or industrial level, mostly adopting a micro-level approach based on firm interactions. However, research analyzing the macro-level impact of KIBS [
15,
16,
17,
18,
19,
20] and their role within national economies remains limited.
Therefore, this study aims to examine the economic role of KIBS and their varying impacts on national economies in countries with different economic scales, KIBS sector sizes, and industrial structures. In particular, it investigates the economic status, role, and influence of KIBS in the United States—a global leader in KIBS-related industries and ranked first in the 2024 Global Knowledge Index—and South Korea, which has a comparatively smaller economy and seeks a new model for economic development. Furthermore, as the role and impact of KIBS may vary not only across countries but also over time, the study focuses on the period from 2010 to 2020, for which comprehensive data are available.
To conduct this analysis, this study employs Input–Output Analysis, a quantitative approach that assesses the role of each KIBS sector within the economic system and its impact on other industries. Input–Output Analysis is a widely adopted analytical framework that systematically captures inter-industry transactions in a structured matrix format [
21], enabling a comprehensive examination of economic interactions. This framework facilitates in-depth assessments of national economies, particularly by analyzing the contributions and spillover effects of key industries. Such insights are essential for informing investment decisions and shaping economic policies. Furthermore, Input–Output Analysis has been instrumental in cross-national comparisons of industry-specific economic impacts [
22,
23], offering valuable implications for economic and policy decision-making.
Within this framework, the study applies the Inter-Industry Linkage Model, one of the various Input–Output Analysis methodologies, to investigate the economic role of KIBS. Additionally, it employs the demand-driven model to estimate the production-inducing effects and value-added-inducing effects. Moreover, the supply-driven model is utilized to assess the supply-shortage effect, allowing for the quantification and cross-national comparison of KIBS’ economic impact.
The remainder of this paper is organized as follows:
Section 2, Literature Review, reviews definitions, roles, and classifications of KIBS, followed by an analysis of KIBS trends over time and across countries. Additionally, this Section compares South Korea’s economic status with its KIBS sector, underscoring differences in national economic scale and KIBS development.
Section 3, Research Methodology, explains the Input–Output Analysis methodology, data-collection process, and research procedures employed in this study.
Section 4, Findings, and Analysis analyzes the role and economic impact of KIBS across different time periods and between South Korea and the United States, identifying key differences in sectoral contributions and overall economic influence.
Section 5, Conclusion, summarizes the key findings and discusses policy implications.
2. Literature Review
Since the mid-1990s, as the transition to a knowledge-based economy has become a key issue, industries have explored ways to achieve economic growth and innovation through knowledge and information. Within this context, KIBS can be defined as a sector of business services that serves as intermediate goods, contributing to organizational and financial innovation in firms. Miles (1995) [
9] defined KIBS as services used in economic activities that create value, while Hertog (2000) [
24] characterized them as private firms or organizations that provide intermediate goods or services and rely heavily on specialized knowledge. Similarly, Bettencourt et al. (2002) [
25] described them as firms that accumulate, generate, and disseminate knowledge to develop customized services or products that meet customer demands, making knowledge-intensive activities a core component of their value creation process.
KIBS are generally classified as P-KIBS (traditional professional services) and T-KIBS (new technology-based professional services), each with distinct subsectors. P-KIBS include business and management services, legal and accounting services, research and development (R&D), and advertising and marketing. T-KIBS encompass information and communication-related industries, including computer programming, consulting, and information service activities [
9,
26].
Research on KIBS has explored its demand across industries, the formation of KIBS clusters, and its impact on national economies. Findings suggest that KIBS positively influence industrial innovation and sustainable economic growth. Studies focusing on industry-level effects have examined whether KIBS serve as a resource for innovation in the manufacturing and service sectors. The effects of KIBS vary depending on industry characteristics, firm size and age [
12,
27], as well as the skill level of the workforce [
14,
20]. However, KIBS contribute positively to organizational and financial innovation and value co-creation [
10,
11,
12,
13,
14,
20,
28].
Research on the regional impact of KIBS has emphasized that KIBS clustering fosters knowledge flow and the diffusion of innovation, leading to qualitative growth in regional economies [
12,
15,
16,
29,
30,
31,
32,
33]. KIBS’ influence varies depending on the use of local resources in a firm’s early development stage, regional innovation and production system differences, and geographical proximity [
29]. Moreover, the role of KIBS is more pronounced in innovation-oriented regions, whereas its impact is relatively weaker in non-innovative regions [
32]. Furthermore, the role of KIBS varies depending on the type of innovation, such as production versus development-driven innovation [
31]. Recent studies have highlighted the role of digital finance in reinforcing the positive effects of KIBS clustering, with findings indicating that the impact of KIBS is more pronounced in smaller cities than in larger urban areas [
32,
33].
Additionally, domestic studies have examined the impact of KIBS on the South Korean economy at the regional level. Shin (2024) [
18] utilized Input–Output Analysis to assess the sector-specific economic spillover effects of KIBS in South Korea, concluding that while their impact varies across subsectors, KIBS contribute positively to the sustainable growth of the Korean economy.
As a service industry that functions as an intermediate good, KIBS have been widely studied from different perspectives, including industrial, regional, and national levels, depending on their demand scope and target industries. The impact of KIBS as a knowledge-based industry is influenced by the skill level of their workforce, the characteristics of their client firms, regional and national economic conditions, and the degree of innovation. Consequently, research on KIBS has been predominantly conducted in Europe and North America [
28,
29,
34,
35]. In contrast, studies on KIBS in Asia have largely concentrated in Japan and China [
36,
37,
38,
39,
40], with an increasing number of studies now expanding to other Asian economies owing to their rapid economic growth [
18,
41].
However, despite the substantial body of research on knowledge services and knowledge industries in South Korea, studies explicitly focused on KIBS remain relatively scarce compared with those conducted in other countries. Given South Korea’s economic scale and current economic conditions, analyzing the sectoral and temporal impact of KIBS, as well as conducting comparative studies with advanced economies, would provide valuable insights for KIBS policy formulation, industry growth strategies, and overall national economic development.
4. Data and Methodologies
This study aims to analyze and compare the role and economic spillover effects of the T-KIBS and P-KIBS sectors within the KIBS industry in South Korea and the United States at five-year intervals from 2010 to 2020. By doing so, this research seeks to identify commonalities and differences in the economic functions of KIBS sectors, examine their current status, roles, and structural changes in each country, and explore future development directions.
To achieve this objective, the study utilizes the OECD inter-country input–output tables for 2010, 2015, and 2020, which provide standardized monetary units and industry classifications for both countries. The industry classification in these tables is based on the International Standard Industrial Classification (ISIC) but has been optimized for input–output analysis, making it well suited for cross-country comparisons of economic impacts [
42].
To quantitatively assess the economic roles and spillover effects of the target industry sectors, this study employed input–output analysis. Among various approaches within this type of analysis, this research examined inter-linkage effects to evaluate the economic role of KIBS and applied both the demand-induced and supply-driven models to measure its overall impact on the economy.
Specifically, the demand-driven model was used to estimate production-inducing effects and value-added-inducing effects, while the supply-driven model was applied to analyze supply-shortage effects. Additionally, rather than focusing solely on the intrinsic economic effects of KIBS, this study emphasizes how each KIBS sector influences other industries. To achieve this, an exogenous specification approach was adopted to assess the extent to which the KIBS industry impacts the economic performance of other sectors [
43].
Through this study, I aim to provide a clearer understanding of the role of the KIBS industry within national economies and contribute to formulating policy implications for its future development.
4.1. Input–Output Analysis
Table 5 provides a summary to facilitate an understanding of the Input–Output Analysis methods employed in this study. The first model pertains to inter-linkage effects, which include the forward linkage effect and the backward linkage effect. The second model corresponds to the demand-driven model, which calculates the production-inducement coefficient and the value-added inducement coefficient. Finally, the supply-driven model is used to derive the supply-shortage coefficient. A detailed explanation of each model and its corresponding methodology are provided in the following section.
4.1.1. Inter-Linkage Effect
The inter-linkage effect comprises backward linkage (
) and forward linkage (
) effects. The forward linkage effect (
) in Equation (1) is determined by summing the rows of the production-inducement coefficient matrix (
) and dividing this sum by the overall industry average of the total row sums within the matrix [
21]. This calculation represents the final demand across all sectors as a single unit. It reflects the proportion of output that the
ith industry must generate to bring its unit production level in line with the average across all industries.
The backward linkage effect (
) in Equation (2) is calculated by taking the sum of the rows in the production-inducement coefficient matrix and dividing it by the overall industry average of these row sums. This value represents the industry-specific inducement coefficient relative to the average production-inducement coefficient (
) across all industries [
21].
4.1.2. Demand-Driven Model
This study examines the production and value-added-inducing effects within detailed demand-driven models. The production and value-added-inducing effects represent the direct and indirect impacts on both the analyzed industry and other industries when 1 USD is produced or invested in the industry under study. These effects are quantified using Equations (3)–(6).
In Equation (3), the input coefficient (
) is obtained by dividing the intermediate input amount (
), which represents the raw materials acquired by each industrial sector from other sectors to produce goods and services, by the total input amount (
) [
21]. When structured in the same matrix form as the endogenous section of the input–output table, it forms the input coefficient matrix (
A). To assess the spillover effect of each target industry, the input coefficient (
) is derived from the input–output table, where industries are reclassified accordingly. The formulation of Equation (3) is as follows:
- -
: Total input amount in sector j
- -
: Amount of input sourced from subsector as an intermediate input for
The production-inducement coefficient is determined by treating the analyzed industry as an exogenous variable and applying the fundamental Equation (4).
- -
: Row vector of the input coefficients of the reclassified industries subject to analysis
- -
: Identity matrix with ones along the diagonal
- -
: Matrix of input coefficients ()
The value-added coefficient in Equation (5) is calculated by dividing the total added value of each industry sector, as recorded in the input–output table, by the overall output.
- -
: Added value of subsector
In Equation (6), the value-added coefficient quantifies the portion of the production-inducing effect that stems from added value. It is derived by multiplying the value-added coefficient with the production-inducement coefficient [
21]. This represents the net economic value contributed by the industry under analysis.
- -
: Diagonal vector of the value-added coefficient
- -
: Coefficient representing the production-inducing effect
4.1.3. Supply-Driven Model
The supply-shortage effect is a method used in the supply-driven model to assess the extent to which production in other industries will decline when the output of the industry under analysis is reduced by 1 USD [
44]. To determine these supply-shortage effects, the output coefficient (
) from Equation (7) is derived using the output coefficient table [
44]. This coefficient represents the proportion of intermediate input—such as raw materials procured from other sectors for goods and services production—relative to the total output [
44].
- -
: Output of subsector
- -
: Amount of input sourced from subsector as an intermediate input for
The supply-shortage coefficient is determined by treating the industry under analysis as an exogenous factor and applying the fundamental model Equation (8).
- -
: Row vector of output coefficients for the subsector
- -
: Identity matrix with ones along the diagonal
- -
: Matrix of output coefficients ()
4.2. Research Procedure
Figure 3 illustrates the step-by-step procedure of this study.
In the first step, a preliminary analysis was conducted to define the concept of KIBS, identify the industrial sectors that constitute KIBS, and specify the target industries for this study.
The second step examined the output and value-added contributions of the classified KIBS sectors in the target countries, South Korea and the United States, and analyzed their share in the overall economy. This step helped to understand the role and trends of the KIBS industry in each country’s economy, serving as a reference point for assessing changes in the subsequent impact analysis.
From the third step onward, an in-depth Input–Output Analysis was conducted. First, the industrial linkage effects were analyzed to assess the economic role of the KIBS industry. The study then compared the economic roles and changes in South Korea and the United States over three time points: 2010, 2015, and 2020.
The fourth step analyzed the economic impact of the T-KIBS sector in South Korea and the United States. This included examining the production-inducement, value-added inducement, and supply-shortage effects, while also comparing changes over the study period.
The fifth step focused on the economic impact of the P-KIBS sector in South Korea and the United States. Similar to the fourth step, it analyzes the production-inducement, value-added inducement, and supply-shortage effects and compares changes over time.
Finally, in the sixth step, the economic impacts of T-KIBS and P-KIBS within the KIBS industry in South Korea and the United States were compared, providing insights into the differences between these sectors within the KIBS industry.
For the purposes of this study, the OECD input–output tables must be adjusted to align with the research objectives. In particular, it is necessary to distinguish between Technology-Based KIBS (T-KIBS) and Professional KIBS (P-KIBS) and compare them with other industrial sectors. In this study, T-KIBS is classified under Code J62T63 (IT and other information services), while P-KIBS is categorized under Code M (professional, scientific, and technical activities), thereby redefining these sectors for analysis.
Subsequently, the economic spillover effects of the two KIBS subsectors were examined over time and across countries to assess their impact on other industries. These industries were classified into three broad sectors: primary, secondary, and tertiary. The primary sector includes Code A (agriculture, forestry, and fishing) and Code B (mining). The secondary sector corresponds to Code C10T33 (manufacturing), encompassing food and beverage production, as well as miscellaneous product manufacturing. The tertiary sector comprises all service industries not included in the primary or secondary sectors, corresponding to Codes D through T. Based on this classification, this study systematically evaluates the impact of the KIBS industry on different sectors.
5. Results
5.1. Comparison of Inter-Linkage Effects by KIBS Sector in South Korea and the United States (2010–2020)
The role of each analyzed sector within the economic system can be assessed through forward and backward linkage effects. Forward linkage effects measure the extent to which a sector’s output serves as an input for other industries, while backward linkage effects indicate the degree to which a sector, when considered a final good, relies on inputs from other industries. Previous studies have employed forward and backward linkage effects to examine the economic roles of industrial sectors across different national contexts. Comparative analyses have demonstrated that the same industry may assume distinct economic functions depending on the country [
22,
44]. For instance, the natural gas supply sector has been classified as a final-demand basic industry in South Korea, whereas in Japan, it exhibits characteristics of a manufacturing-oriented sector [
22]. Additionally, the Bank of Korea (2016) has asserted that the extent to which an industry’s output is utilized as an intermediate good is positively correlated with its forward linkage effects value [
21].
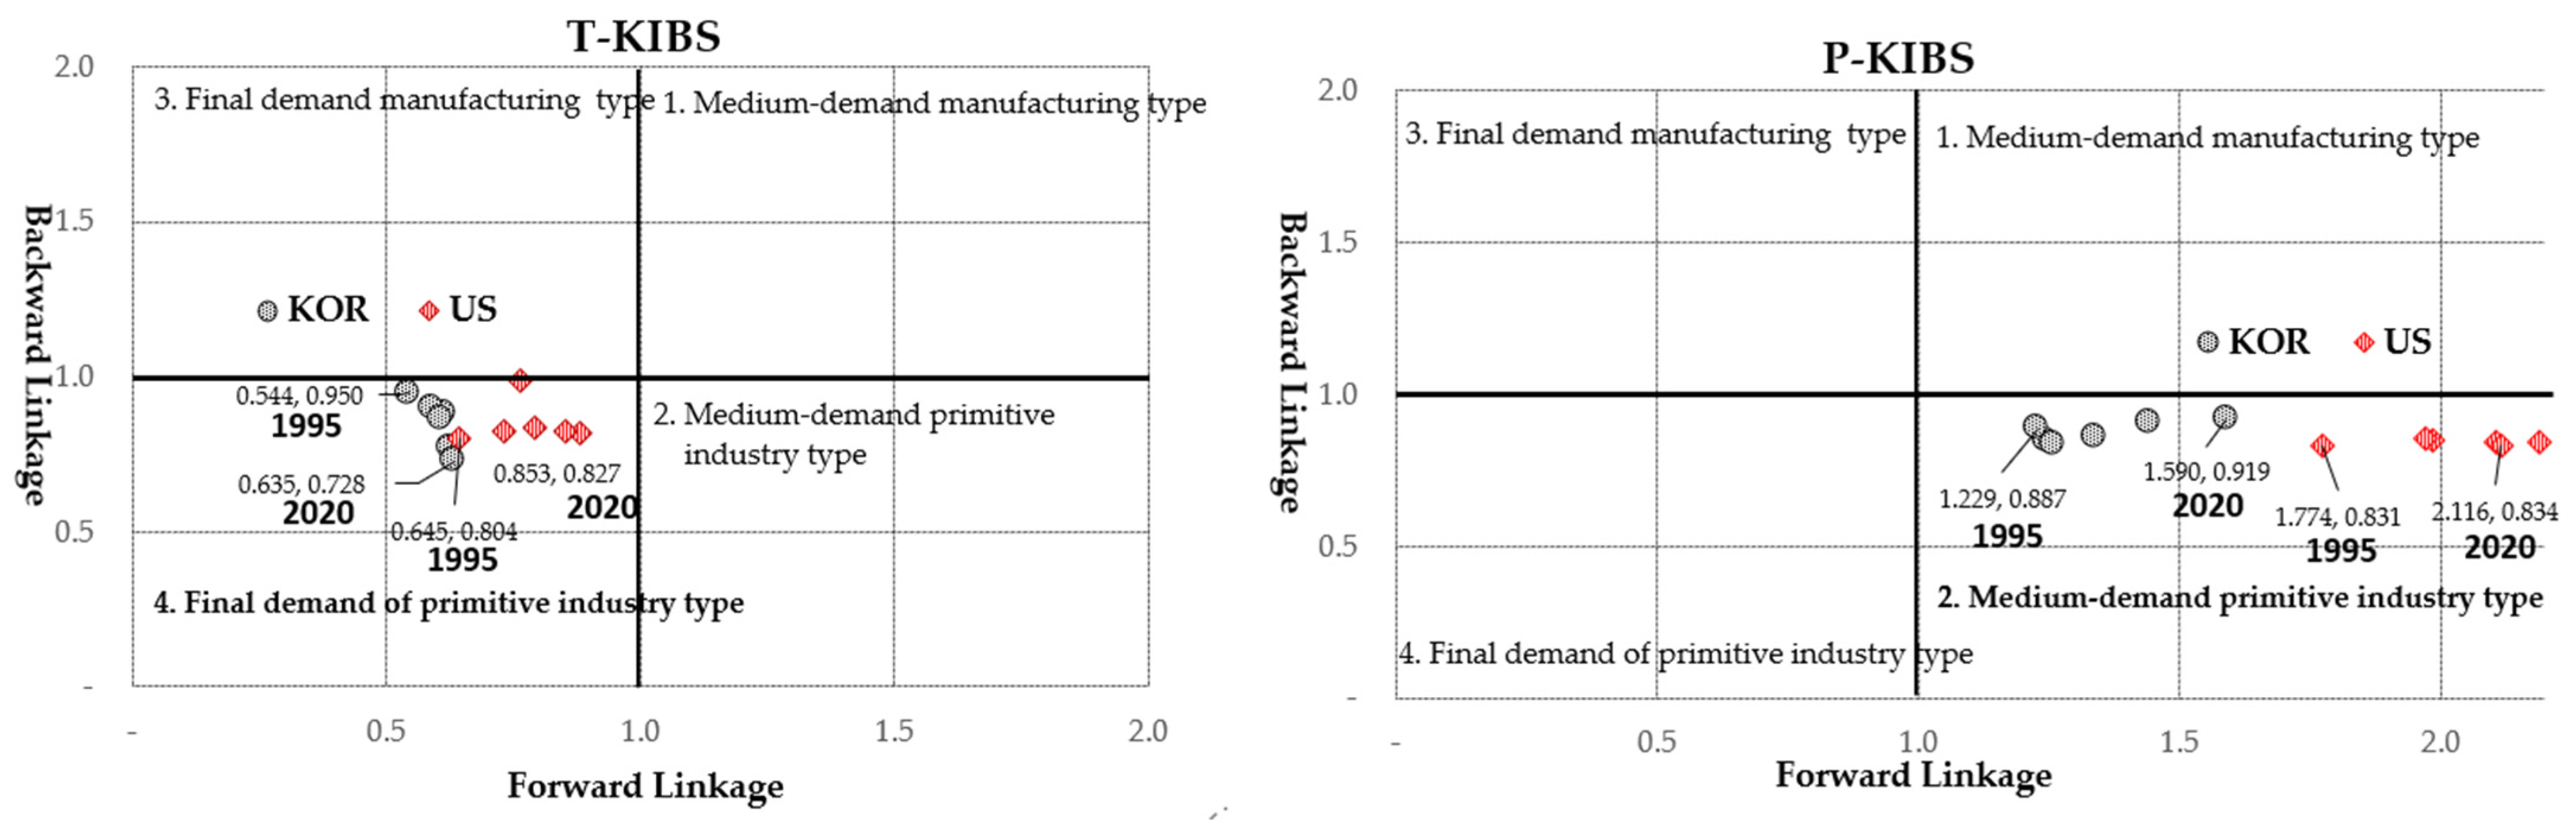
You and You (2009) classified industries into four categories based on the values of forward and backward linkage effects [
44]. The first category, “manufacturing-oriented intermediate demand type”, applies to industries where both forward and backward linkage effects exceed 1. The second category, “primitive intermediate demand type”, includes industries where forward linkage effects exceed 1, but backward linkage effects fall below 1. The third category, “manufacturing-oriented final demand type”, consists of industries where forward linkage effects fall below 1 while backward linkage effects exceed 1. Last, the fourth category, “primitive final demand type”, refers to industries where both forward and backward linkage effects are below 1.
Table 6 presents the industrial linkage effects of the KIBS sector in South Korea and the United States.
An analysis of the T-KIBS sector in South Korea revealed that forward linkage effects increased slightly from 0.606 in 2010 to 0.635 in 2020. Regarding industry ranking, T-KIBS ranked 23rd in 2010 and remained at 24th place from 2015 onward. Conversely, backward linkage effects declined from 0.865 in 2010 to 0.728 in 2020. The ranking also dropped from 22nd in 2010 to 26th in 2015 and further to 27th in 2020. Based on these findings, the T-KIBS sector in South Korea is classified as a “primitive final demand type” as both forward and backward linkage effects are below 1.
In the United States, T-KIBS forward linkage effects were 0.793 in 2010, ranking 19th among 32 industries. This figure increased to 0.880 in 2015, improving its ranking to 15th, but slightly declined to 0.853 in 2020, settling at 17th place. Backward linkage effects in the United States were 0.840 in 2010, ranking 28th among 32 industries, and remained at 28th place in both 2015 and 2020. Consequently, the T-KIBS sector in the United States, like in South Korea, is classified as a “primitive final demand type” owing to both forward and backward linkage effects being below 1.
Although the T-KIBS sector in both South Korea and the United States falls into the same industry classification, the United States exhibited higher forward and backward linkage effect values and rankings than South Korea. This suggests that T-KIBS in the United States maintains a relatively higher degree of integration within the broader economic system.
An analysis of the P-KIBS sector in South Korea showed that forward linkage effects increased from 1.258 in 2010 (ranking 7th among 32 industries) to 1.441 in 2015 (5th place) and further to 1.590 in 2020 (4th place). These findings indicate a steady rise in both linkage values and rankings since 2010.
Meanwhile, backward linkage effects in South Korea increased slightly from 0.842 in 2010 (24th place) to 0.906 in 2015 (22nd place) and further to 0.919 in 2020 (20th place). As forward linkage effects consistently exceeded 1, while backward linkage effects remained below 1 from 2010 to 2020, P-KIBS in South Korea is classified as a “primitive intermediate demand type”.
In the United States, P-KIBS forward linkage effects reached 2.103 in 2010, ranking second among all industries. These values remained stable at 2.190 in 2015 and 2.116 in 2020, maintaining second place throughout the period.
Conversely, backward linkage effects in the United States remained relatively stable, with values of 0.846 in 2010, 0.848 in 2015, and 0.834 in 2020. The P-KIBS sector consistently ranked 27th out of 32 industries throughout the period. Unlike South Korea, where values fluctuated over time, the United States exhibited relatively stable forward and backward linkage effect values, maintaining its ranking across the years.
Based on these findings, the P-KIBS sector in the United States is classified as a “primitive intermediate demand type”, consistent with its classification in South Korea.
Figure 4 visually represents the data presented in
Table 6. As shown in
Table 6, the roles of T-KIBS and P-KIBS in South Korea and the United States are classified according to the same criteria. However,
Figure 4 reveals distinct differences in the roles of KIBS between the two countries. Notably, the forward linkage effect for both KIBS sectors in the United States remains consistently higher than in South Korea throughout the entire analysis period.
5.2. Economic Spillover Effects of the T-KIBS Sector in South Korea and the United States (2010–2020)
Table 7 compares the changes in production-inducing effects in the T-KIBS sector in South Korea and the United States from 2010 to 2020. Production-inducing effects refer to the extent of production generated in other industries when 1 USD is invested in the T-KIBS sector.
In South Korea, the production-inducing effects of the T-KIBS sector on other industries declined steadily, from 0.932 in 2010 to 0.638 in 2015 and further to 0.606 in 2020. The examination of the sectoral breakdown of these effects showed that the tertiary sector accounted for the largest share in 2010, with a production-inducing effect of 0.510 (54.7% of the total). The secondary sector followed with 0.379 (40.6%), while the primary sector had the lowest impact at 0.043 (4.7%). By 2015, the overall production-inducing effects declined. The tertiary sector decreased to 0.374, yet its relative share remained at 54.7%, indicating an increase in its relative influence. The secondary sector fell to 0.240 (37.7%), while the primary sector dropped to 0.024 (3.7%), showing a decline in both absolute value and proportion. In 2020, the overall production-inducing effects continued to decline, but each sector’s share showed notable changes. The tertiary sector’s share rose to 59.2%, making it the most dominant sector, while the secondary sector increased slightly to 38.0%, and the primary sector further declined to 2.8%.
An examination of the average annual growth rate by sector showed that the primary sector saw the steepest decline at −9.0%, followed by the secondary sector at −4.9%, while the tertiary sector recorded the smallest decline at −3.5%. These trends indicate that while the overall production-inducing effects in South Korea’s T-KIBS sector have consistently declined, the relative importance of the tertiary sector has increased, while the shares of the primary and secondary sectors have fluctuated and adjusted over time.
In contrast to South Korea, the production-inducing effects of the T-KIBS sector in the United States declined from 0.540 in 2010 to 0.487 in 2015 but rebounded to 0.542 in 2020, returning to the 2010 level. This trend differs from South Korea, where production-inducing effects continued to decline during the same period, recording an average annual growth rate of −4.2%. In contrast, the United States experienced a slight increase of 0.1% over the decade. A breakdown of sectoral production-inducing effects shows that the tertiary sector had an overwhelming influence in 2010, with a production-inducing effect of 0.446, accounting for 82.7% of the total. The secondary sector followed with 0.082 (15.2%), while the primary sector contributed only 2.1%. In 2015, the tertiary sector’s production-inducing effect declined to 0.412, but its relative share increased to 84.6%. The secondary sector decreased to 0.069 (14.2%), and the primary sector fell to 0.006 (1.2%), showing an overall decline in both industries. By 2020, the sectoral distribution resembled that of 2010, with the tertiary sector recording a production-inducing effect of 0.446 (82.3%), the secondary sector increasing slightly to 0.085 (15.7%), and the primary sector standing at 0.011 (2.0%).
The examination of the average annual growth rate by sector from 2010 to 2020 revealed that the primary sector showed a slight decline of −0.2%, and the secondary sector grew marginally by 0.4%, while the tertiary sector remained largely unchanged. These results indicate that the U.S. T-KIBS sector exhibited an overall recovery by 2020, with its influence in the tertiary sector remaining stable.
A comparison of production-inducing effects in the T-KIBS sector in South Korea and the United States reveals several key differences. Although the total production-inducing effects in the U.S. were lower than those in South Korea, the gap between the two countries has narrowed over time. This is because South Korea’s production-inducing effects continuously declined, while the U.S. maintained a relatively stable trend. Sectoral comparisons also highlight distinct trends. In the United States, the tertiary sector consistently accounted for over 80% of total production-inducing effects, with minimal fluctuations. The primary and secondary sectors experienced slight variations but maintained overall stability. Meanwhile, in South Korea, the share of the tertiary sector in production-inducing effects steadily increased, while the primary sector showed a continuous decline. The secondary sector remained relatively stable, with only minor fluctuations.
These findings suggest that the impact of the T-KIBS sector on other industries differed between South Korea and the United States. In South Korea, overall production-inducing effects decreased, but the importance of the tertiary sector grew. In the United States, production-inducing effects remained stable—particularly in the tertiary sector, which continued to hold a dominant share.
Table 8 presents the value-added-inducing effects of the T-KIBS sector in South Korea and the United States, underscoring changes from 2010 to 2020. Value-added-inducing effects represent the amount of value added generated in other industries when 1 USD is invested in the T-KIBS sector.
The total value-added-inducing effects of South Korea’s T-KIBS sector showed a continuous decline, from 0.389 in 2010 to 0.271 in 2015, and further to 0.257 in 2020, with an average annual growth rate of −4.10%. In 2010, the value-added-inducing effects generated in the tertiary sector were 0.190, accounting for 69.4% of the total, while the secondary sector recorded 0.097 (25.0%), and the primary sector contributed 0.022 (5.6%). By 2015, all three sectors experienced a decline in value-added-inducing effects, with slight changes in their respective shares. In 2020, the tertiary sector’s value-added-inducing effects decreased to 0.176, with its share dropping to 68.5%. The primary sector also declined to 0.008 (3.1%), while the secondary sector increased slightly to 0.073, raising its share to 28.5%. Examining the average annual growth rate by sector, the primary sector showed the steepest decline at −9.70%, followed by the tertiary sector at −4.20% and the secondary sector at −2.80%. In contrast, the value-added-inducing effects of the U.S. T-KIBS sector decreased from 0.312 in 2010 to 0.280 in 2015 but rebounded to 0.303 in 2020, resulting in a slight average annual decline of −0.30%.
A sectoral analysis of the U.S. economy shows that in 2010, the tertiary sector had the highest value-added-inducing effects at 0.272, accounting for 87.2% of the total, while the secondary sector recorded 0.033 (10.7%), and the primary sector contributed 0.006 (2.1%). In 2015, the tertiary sector’s value-added-inducing effects declined to 0.247, but its share increased to 88.1%. The secondary sector recorded 0.031 (10.9%), and the primary sector dropped to 0.003 (1.1%), indicating an overall decrease in both sectors. In 2020, the tertiary sector’s value-added-inducing effects rose slightly to 0.263, but its share decreased to 86.8%, lower than in 2010 and 2015. Meanwhile, the secondary sector increased to 0.034 (11.3%), with both its value-added-inducing effects and share increasing slightly, while the primary sector recovered to 0.006 (1.9%), reaching the same level as in 2010.
A comparison of value-added-inducing effects between South Korea and the United States revealed that South Korea’s T-KIBS sector showed a continuous decline, whereas the United States exhibited only minor fluctuations. In both countries, the tertiary sector accounted for the highest share of value-added-inducing effects, but the share in the U.S. remained dominant, ranging from 86.8% to 88.1%, while in South Korea, it was relatively lower, ranging from 68.5% to 70.1%. Additionally, the primary sector experienced the most significant decline, with South Korea’s average annual growth rate falling sharply to −9.70%.
Table 9 presents the supply-shortage effects in the T-KIBS sector in South Korea and the United States and their changes from 2010 to 2020. Supply-shortage effects refer to the reduction in production in other sectors when 1 USD of production in the T-KIBS sector is not achieved.
In South Korea, the supply-shortage effects of the T-KIBS sector decreased from 0.997 in 2010 to 0.898 in 2015 but then increased again to 1.106 in 2020. The average annual growth rate from 2010 to 2020 was 1.0%.
The examination of the sectoral breakdown of supply-shortage effects showed that the tertiary sector recorded a total effect of 0.529 in 2010, accounting for 53.1% of the total supply-shortage effects. The secondary sector followed with 0.459 (46.1%), while the primary sector had the lowest impact at 0.008 (0.8%). In 2015, the tertiary sector’s supply-shortage effects increased to 0.558, and its share rose to 62.2%, indicating an increasing impact. In contrast, the secondary sector declined to 0.333 (37.0%), while the primary sector remained relatively unchanged at 0.007 (0.8%). By 2020, the supply-shortage effects of the tertiary sector increased significantly to 0.751, and its share rose further to 67.9%. The secondary sector increased slightly to 0.346, but its share dropped to 31.3%, while the primary sector remained stable at 0.009 (0.8%).
The analysis of the average annual growth rate by sector from 2010 to 2020 indicated that the tertiary sector showed a steady increase of 3.6%, while the secondary sector declined by −2.8%. The primary sector remained largely unchanged, with a growth rate of 0.6%.
In the United States, the supply-shortage effects in the T-KIBS sector increased from 0.952 in 2010 to 1.021 in 2015 and further to 1.047 in 2020. The average annual growth rate from 2010 to 2020 was also 1.0%, indicating a similar trend to South Korea.
A sectoral analysis of the U.S. economy showed that in 2010, the tertiary sector accounted for 0.800 of the total supply-shortage effects, making up 84.1% of the total impact. The secondary sector recorded 0.135 (14.2%), while the primary sector had a minimal effect at 0.017 (1.8%). By 2015, the tertiary sector’s supply-shortage effects increased to 0.858, maintaining a similar share at 84.0%, while the primary sector increased slightly to 0.023 (2.3%). In 2020, the tertiary sector recorded 0.859 (82.0%); the secondary sector increased to 0.159 (15.2%), and the primary sector grew to 0.030 (2.8%), reflecting an upward trend in both the secondary and primary sectors.
The examination of the average annual growth rate by sector from 2010 to 2020 indicated that the tertiary sector showed minimal change, with an increase of 0.7%, while the secondary sector grew by 1.6%. The primary sector experienced the highest growth rate at 5.9%, though its overall share of supply-shortage effects remained small.
A comparison of the supply-shortage effects in the T-KIBS sector between South Korea and the United States reveals that the average annual growth rate of total supply-shortage effects was identical at 1% in both countries. However, sectoral effects showed notable differences. In South Korea, the supply-shortage effects in the tertiary sector continued to increase, while the secondary sector showed a declining trend. In contrast, the United States exhibited relatively stable trends across sectors.
A comparison of the sectoral distribution of supply-shortage effects showed that, in 2020, the tertiary sector’s share in the U.S. was significantly higher at 82.0%, compared with 67.9% in South Korea. In the secondary sector, the U.S. recorded a share of 15.2% in 2020, whereas South Korea, despite its declining trend, still maintained a much higher share at 31.3%—more than twice that of the U.S. Finally, in the primary sector, the U.S. saw a steady increase in its share to 2.8%, whereas South Korea remained at a stable level of 0.8%.
5.3. Economic Spillover Effects of the P-KIBS Sector in South Korea and the United States (2010–2020)
Table 10 compares the changes in production-inducing effects in the P-KIBS sector in South Korea and the United States from 2010 to 2020.
In South Korea, the production-inducing effects in the P-KIBS sector increased from 0.883 in 2010 to 0.972 in 2015 and further to 1.029 in 2020, showing a continuous upward trend since 2010.
The examination of sectoral contributions showed that, in 2010, the tertiary sector had a production-inducing effect of 0.532, accounting for 60.3% of the total. The secondary sector recorded 0.295 (33.4%), while the primary sector accounted for 0.056 (6.4%). In 2015, the production-inducing effect of the tertiary sector remained at 0.534, with its share decreasing to 55%. In contrast, the secondary sector’s production-inducing effects increased to 0.380 (39.1%), while the primary sector remained relatively stable at 0.057 (5.9%). By 2020, the tertiary sector recorded 0.576 (56.0%), the secondary sector 0.403 (39.1%), and the primary sector 0.050 (4.9%).
From 2010 to 2020, the total production-inducing effects in the P-KIBS sector grew at an average annual rate of 1.5%. Among the sectors, the secondary sector showed the highest growth, with an annual increase of 3.2%. In contrast, the primary sector declined at an average annual rate of −1.1%.
In the United States, the production-inducing effects of the P-KIBS sector increased slightly from 0.436 in 2010 to 0.438 in 2015 and further to 0.460 in 2020. Examining sectoral contributions, in 2010, the tertiary sector had a production-inducing effect of 0.346, accounting for 79.4% of the total. The secondary sector recorded 0.078 (17.9%), while the primary sector accounted for 0.012 (2.7%). In 2015, the tertiary sector’s production-inducing effects increased to 0.362 (82.6%), while the secondary sector declined to 0.069 (15.6%), and the primary sector fell to 0.007 (1.7%). By 2020, the tertiary sector recorded 0.369 (80.3%), the secondary sector 0.079 (17.1%), and the primary sector 0.012 (2.6%). Between 2010 and 2020, the total production-inducing effects in the U.S. P-KIBS sector grew at an average annual rate of 0.5%. The tertiary sector had the highest growth rate at 0.7%, but overall, the changes remained minor. The secondary sector showed minimal growth at 0.1%, while the primary sector grew slightly by 0.2% per year.
When the production-inducing effects of the P-KIBS sector between South Korea and the United States were compared, South Korea’s total production-inducing effects were more than twice as high as those of the U.S., with a much steeper growth trend. In the United States, not only was the total production-inducing effect lower, but all three sectors showed only minor fluctuations, with little overall change. In contrast, South Korea’s secondary sector exhibited the most significant changes, recording an average annual growth rate of 3.2%, indicating a clear upward trend.
Table 11 compares the changes in value-added-inducing effects in the P-KIBS sector in South Korea and the United States from 2010 to 2020.
In South Korea, the value-added-inducing effects of the P-KIBS sector increased from 0.376 in 2010 to 0.400 in 2015, and further to 0.414 in 2020. Examining sectoral contributions, in 2010, the tertiary sector had a value-added-inducing effect of 0.279, accounting for 70.3% of the total. The secondary sector recorded 0.068 (18.1%), while the primary sector accounted for 0.028 (7.5%). In 2015, the tertiary sector declined to 0.268 (67.1%), while the secondary sector increased to 0.101 (25.4%), with both its total effect and share increasing. The primary sector remained stable at 0.030 (7.5%). By 2020, the tertiary sector increased to 0.279 (67.4%); the secondary sector rose to 0.112 (27.0%), while the primary sector decreased to 0.023 (5.6%). Between 2010 and 2020, the total value-added-inducing effects in the P-KIBS sector grew at an average annual rate of 1.0%. The tertiary sector showed little change, while the secondary sector exhibited the highest growth at 5.1% annually. In contrast, the primary sector recorded a continuous decline at an average annual rate of −1.9%.
In the United States, the value-added-inducing effects of the P-KIBS sector increased slightly from 0.246 in 2010 to 0.247 in 2015 and further to 0.252 in 2020. Examining sectoral contributions, in 2010, the tertiary sector had a value-added-inducing effect of 0.208, accounting for 84.7% of the total. The secondary sector recorded 0.031 (12.5%), while the primary sector accounted for 0.007 (2.8%). In 2015, the tertiary sector increased to 0.215 (87.1%), while the secondary sector declined to 0.028 (11.5%), and the primary sector decreased to 0.004 (1.4%). By 2020, the tertiary sector remained relatively stable at 0.216 (85.7%); the secondary sector increased slightly to 0.030 (11.9%), while the primary sector rose to 0.006 (2.5%). Between 2010 and 2020, the total value-added-inducing effects in the U.S. P-KIBS sector grew at an average annual rate of just 0.2%. The tertiary sector had the highest growth rate at 0.4%, but its change remained minimal. In contrast, the secondary sector declined by an average of −0.3% per year, while the primary sector decreased at an average annual rate of −0.9%.
A comparison of the value-added-inducing effects in the P-KIBS sector between South Korea and the United States revealed that South Korea had consistently higher total value-added-inducing effects throughout the period, with a higher average annual growth rate. The analysis of sectoral contributions indicated that the United States maintained a significantly higher share of value-added-inducing effects in the tertiary sector, exceeding 85%, while South Korea recorded a lower proportion in the mid−60% range. Similar to production-inducing effects, South Korea showed strong growth in the secondary sector’s value-added-inducing effects. Additionally, in both South Korea and the United States, the primary sector had the lowest value-added-inducing effects, with a declining average annual growth rate, but the decline was more pronounced in South Korea.
Table 12 compares the supply-shortage effects in the P-KIBS sector in South Korea and the United States from 2010 to 2020.
In South Korea, the supply-shortage effects in the P-KIBS sector were 1.479 in 2010, slightly decreasing to 1.446 in 2015, and increasing again to 1.472 in 2020. The examination of sectoral contributions showed that, in 2010, the tertiary sector had a supply-shortage effect of 0.686, accounting for 46.4% of the total. The secondary sector recorded 0.779 (52.7%), while the primary sector accounted for 0.015 (1.0%). In 2015, the tertiary sector decreased to 0.606 (41.9%), while the secondary sector increased to 0.824 (57.0%). The primary sector remained relatively unchanged at 0.016 (1.1%). By 2020, the tertiary sector increased to 0.705 (47.9%); the secondary sector declined slightly to 0.748 (50.9%), and the primary sector increased slightly to 0.018 (1.2%). From 2010 to 2020, the total supply-shortage effects in the P-KIBS sector remained largely unchanged, with an average annual growth rate of 0.0%. The tertiary sector recorded minimal growth at 0.3%, while the secondary sector experienced a slight decline at −0.4%. The primary sector showed a growth rate of 2.1%, but its overall contribution remained insignificant. Unlike production-inducing effects and value-added-inducing effects, where the tertiary sector had the highest share, supply-shortage effects had the greatest impact on the secondary sector, while the primary sector had the lowest impact. Although the tertiary sector had a relatively lower share, its total supply-shortage effects remained at a high level.
In the United States, the supply-shortage effects in the P-KIBS sector were 1.187 in 2010, increasing to 1.234 in 2015 and further rising to 1.283 in 2020. Examining sectoral contributions, in 2010, the tertiary sector had a supply-shortage effect of 0.883, accounting for 74.4% of the total. The secondary sector recorded 0.268 (22.6%), while the primary sector accounted for 0.036 (3.0%). In 2015, the tertiary sector increased slightly to 0.937 (75.9%), while the secondary sector declined to 0.253 (20.5%), and the primary sector remained stable at 0.044 (3.5%). By 2020, the tertiary sector recorded 0.944 (73.6%); the secondary sector increased to 0.282 (22.0%), and the primary sector rose to 0.057 (4.5%). Between 2010 and 2020, the total supply-shortage effects in the U.S. in the P-KIBS sector grew at an average annual rate of 0.8%. The primary sector had the highest growth rate at 4.9%, followed by the tertiary sector at 0.7%, while the secondary sector grew at a slower pace of 0.5%.
A comparison of the supply-shortage effects in the P-KIBS sector between South Korea and the United States showed that South Korea’s total supply-shortage effects remained consistently higher than those in the U.S. throughout the analysis period. Regarding average annual growth rate, South Korea’s supply-shortage effects remained stable, whereas the United States showed a slight upward trend. The examination of sectoral differences indicated that, in South Korea, the secondary sector’s share of supply-shortage effects was significantly higher than its share in production-inducing effects (39.1% in 2020) and value-added-inducing effects (27.0%). Similarly, in the United States, the secondary sector’s supply-shortage effects were higher than in other categories, but its share was still lower compared with South Korea.
5.4. Summary of Economic Spillover Effects of KIBS in South Korea and the United States (2010–2020)
Figure 5 visually represents the changes in production-inducing effects and value-added-inducing effects across various KIBS sectors from 2010 to 2020. It is based on data from
Table 10,
Table 11 and
Table 12.
Regarding production-inducing effects, both KIBS sectors in South Korea recorded higher values than those in the United States. In the comparison of the two KIBS sectors, in South Korea, P-KIBS had higher production-inducing effects than T-KIBS after 2010, and the gap between the two sectors has gradually widened. In contrast, in the United States, T-KIBS maintained higher production-inducing effects throughout the entire analysis period.
Regarding value-added-inducing effects, since 2015, the T-KIBS sector in the United States recorded higher values than in South Korea, whereas South Korea exhibited higher P-KIBS value-added-inducing effects throughout the entire analysis period. Additionally, in South Korea, P-KIBS surpassed T-KIBS in value-added-inducing effects after 2015, whereas in the United States, T-KIBS consistently maintained higher levels.
The examination of the supply-shortage effects in both South Korea and the United States showed that the P-KIBS sector consistently recorded higher values than the T-KIBS sector throughout the entire period. As of 2020, South Korea exhibited higher supply-shortage effects in the T-KIBS sector compared with the United States. Additionally, in the P-KIBS sector, South Korea maintained higher supply-shortage effects than the United States throughout the entire analysis period from 2010 to 2020.
6. Discussion and Conclusions
KIBS, comprising T-KIBS and P-KIBS, plays a crucial role in fostering economic and organizational innovation while supporting sustainable growth. Its impact varies based on knowledge intensity, connectivity, and workforce skill levels, with national differences shaped by economic scale and industrial structure. This study examines the economic role of KIBS in the United States and South Korea from 2010 to 2020 using input–output analysis. The findings reveal significant structural disparities between the two economies. In 2020, the total output of the United States was 8.6 times that of South Korea, while its value-added output was 11.27 times higher, largely due to the greater share of tertiary industries in the U.S. (76.66% compared with 57.83% in South Korea). Sectoral analysis indicates that in 2020, T-KIBS and P-KIBS output in the United States were 14.38 and 10.28 times greater than in South Korea, respectively, with value-added output 14.46 and 13.85 times higher. However, both countries have experienced a consistent decline in the annual growth rate of KIBS output and value-added output.
Given the distinct economic structures and KIBS industry landscapes in South Korea and the United States, an analysis of the economic role and spillover effects of KIBS subsectors in both countries yielded the following key insights.
First, while the economic role of KIBS varies across sectors, its function remains consistent across countries. In both South Korea and the United States, T-KIBS is classified as a “primitive final demand type”, while P-KIBS is characterized as a “primitive intermediate demand type”. However, an examination of backward and forward linkage effects reveals that the United States utilizes KIBS more effectively as a raw material input within its economic system than South Korea. Second, the economic spillover effects of KIBS closely align with the total output proportions of each country’s industrial sectors. The spillover effects of T-KIBS closely mirror total industrial output proportions, while in South Korea, P-KIBS exhibits a stronger influence on the secondary sector (manufacturing industry). Third, the scale of economic spillover effects of KIBS varies significantly between the two countries. While the United States has maintained a relatively stable trend, South Korea has exhibited greater volatility. The economic spillover effects of T-KIBS in South Korea have been declining continuously, whereas P-KIBS has shown an upward trend. In contrast, the economic spillover effects of KIBS in the United States have remained relatively stable. Fourth, the supply-shortage effect of KIBS is more pronounced than other economic spillover effects, indicating that KIBS plays a critical role as a key input in production. When P-KIBS supply is disrupted, the resulting decline in production is more significant than that observed in T-KIBS. This pattern was observed in both South Korea and the United States.
Despite the shared role of KIBS in the two countries, its economic spillover effects exhibit distinct patterns. Based on these findings, the following policy implications can be derived regarding KIBS utilization in each country.
First, KIBS plays a pivotal role as a key resource for sustainable economic growth. As an industry that induces production and value-added effects, an inadequate supply of KIBS can disrupt national economic production activities. Therefore, establishing an economic system that ensures the smooth and stable supply of KIBS is essential. Second, KIBS development and supply policies must be tailored to each country’s economic structure, industry scale, and firms’ capabilities in utilizing KIBS. Economic spillover effects vary depending on these factors. For instance, while T-KIBS closely aligns with total industrial output proportions, South Korea’s P-KIBS exerts a stronger influence on the secondary sector. Consequently, establishing customized KIBS development and supply policies that align with each country’s industrial structure and characteristics is necessary. Last, the T-KIBS sector requires innovation through research and development. The economic spillover effects of KIBS have stagnated in the United States, while in South Korea, they have been continuously declining. T-KIBS plays a pivotal role in organizational and financial innovation by providing advanced technology and specialized knowledge. However, the stagnation of production and value-added effects, coupled with the high supply-shortage effect, suggest that T-KIBS functions remain limited. Therefore, innovation within the T-KIBS sector itself is essential to ensure that it can contribute effectively to financial innovation among demand-side industries.
This study examines the evolution of the KIBS sectors in South Korea and the United States from 2010 to 2020, identifying their economic roles and characteristics while assessing their potential as drivers of sustainable economic growth. Prior research suggests that the economic effects of KIBS vary based on industry characteristics, firm size, and age [
12,
27], as well as the skill level of the workforce [
14,
20]. Given these factors, this study quantitatively analyzes the economic impact of KIBS in South Korea and the United States—two countries with distinct economic scales and KIBS sector sizes—thereby elucidating the divergent roles and effects of KIBS within each national context. However, this study has certain limitations as it focuses solely on two countries and confines the analysis period to post-2010. Further research should broaden the scope by incorporating additional countries and extending the analysis period. As the role and economic spillover effects of KIBS likely vary in developing countries, further investigation into this aspect would be particularly valuable.


