Article

The Persistence Puzzle: Bibliometric Insights into Dropout in MOOCs

by
Irina-Daniela Cișmașu
1,
Bianca Raluca Cibu
2,
Liviu-Adrian Cotfas
2,* and
Camelia Delcea
2
1
Department of Financial and Economic Analysis and Valuation, Bucharest University of Economic Studies, 010552 Bucharest, Romania
2
Department of Economic Informatics and Cybernetics, Bucharest University of Economic Studies, 0105552 Bucharest, Romania
*
Author to whom correspondence should be addressed.
Sustainability 2025, 17(7), 2952; https://doi.org/10.3390/su17072952
Submission received: 20 February 2025 / Revised: 22 March 2025 / Accepted: 23 March 2025 / Published: 26 March 2025

Abstract

:
Massive Open Online Courses (MOOCs) are a relatively new educational model that provides free access to educational content regardless of location or time. Despite these benefits, MOOCs encounter significant challenges, such as low completion rates, high dropout rates, and inconsistent participant comprehension, often due to the absence of simulations and practical activities. Incorporating sustainable education principles into MOOCs could bring benefits to the long-term effectiveness of the learning process, ensuring conscious learning practices. To address the issue of MOOC dropout rates and assess the scientific interest in this area, a bibliometric analysis was conducted on a dataset of 193 papers sourced from the ISI Web of Science database, spanning from 2013 to 2023. Papers were selected based on relevant keywords for the study. The analysis highlights key academic institutions, leading authors, and publication trends within this field. It reveals a strong and growing interest in MOOC dropout rates, with an annual growth rate of 40.04%. Research trends were identified by analyzing n-grams from keywords, titles, abstracts, and keywords plus, supplemented by a detailed review of the most cited papers globally. A collaborative network analysis was performed to explore author collaborations, their global distribution, institutional affiliations, research objectives, and study directions. The findings from the most cited papers show an increasing focus on understanding the factors contributing to MOOC dropout rates and developing strategies to address these issues.

1. Introduction

Massive open online courses (MOOCs) are online courses designed for a large number of participants [1]. MOOC platforms, such as Coursera, edX and Udacity, offer MOOCs in various disciplines in partnership with universities and colleges. They allow access to education for anyone with an internet connection, integrating multimedia elements for an immersive experience. MOOCs have become popular by breaking down geographical barriers and providing global access to quality educational content [2]. Since their inception, MOOCs have been divided into two types: Connectivist MOOCs—which focus on knowledge creation and generation, and Extended MOOCs—which focus on knowledge dissemination [3,4]. These platforms have come to be used to deepen a large number of courses that are part of different fields such as, but not limited to, the following: medicine [5], demography [6] and supply chain management [7].

1.1. Setting the Scene

MOOCs are characterized primarily by their open accessibility and capacity for unlimited participation, and they have significantly transformed the landscape of corporate education within the university setting [8]. Even by “corporate education”, one can infer the diversity of their use, going from the school level, even reaching the level of including educational processes or programs made available to employees by their employers to help them to instill different knowledge and to support them to have continuous professional training. Beyond the traditional videotaped lectures found in course materials, MOOCs offer forums designed specifically to foster community interactions, both among students and between instructors and students [9]. A crucial aspect of the long-term adoption if MOOCs relies on their degree of alignment with the sustainable education principles. By fostering inclusive, lifelong learning opportunities and integrating environmentally responsible digital practices, MOOCs can contribute to a more equitable and resource-efficient education system. Sustainable MOOCs emphasize accessibility, digital equity, and pedagogical strategies that promote engagement while reducing digital waste and unnecessary resource consumption [10].
As a brief overview of the history of MOOCs, they have evolved from the earliest methods of distance learning, starting with correspondence courses in the 1700s. The 1990s saw a major change with the advent of personal computers and the internet, allowing universities to offer online courses. These courses, initially intended for a restricted audience, gradually became accessible to the general public. Open learning initiatives in the 1970s and 1980s further widened access to education [11]. The first MOOC, “Connectivism and Connective Knowledge”, was offered for free by Stephen Downes and George Siemens at the University of Manitoba in 2008, and in 2011, Stanford University released “Introduction to AI” by Sebastian Thrun and Peter Norvig. The New York Times called 2012 the “Year of MOOCs” thanks to the rise in platforms such as Udacity, Coursera and edX [12,13].
Over the past two decades, distance learning has undergone rapid evolution. A pivotal moment in this transformation occurred in 2019 with the outbreak of the COVID-19 pandemic, which compelled countries worldwide to implement home learning measures, thereby significantly accelerating the adoption and advancement of distance learning technologies and methodologies [14]. MOOCs have provided free access to seminars by renowned professors and ongoing support through various events and educational materials during the COVID-19 pandemic. They ensure curriculum sharing, adaptive outcomes and open enrolment [15].
However, learner engagement in MOOCs tends to be self-directed and highly inconsistent, contributing to the high dropout rates frequently observed in these courses. This issue has been the focus of numerous research studies [16,17,18,19,20]. According to the researchers’ findings, even though MOOC enrollment requests were high, recorded completion rates were below 10% [21]. Low completion rates have created numerous problems, affecting benefits for learners, providers and MOOC platforms, which have lost both time and profits. Given the large number of interested learners, researchers have sought to understand the underlying motives that lead learners to drop out of MOOCs [22]. Celik and Cagiltay [23] summarize in their study that although the participants wanted to complete the courses in order to receive a certification, their intentions changed along the way, the main factor being lack of time. Aldowah et al. [24] identify six main factors that influence student dropout from MOOCs: feedback, academic skills, social support, course design, social presence, and prior experience. Secondary factors include engagement, time, interaction, motivation, course difficulty and family or work circumstances. Other studies involve, but are not limited to, the following: predicting both dropout and learner behavior [25], identifying techniques to reduce dropout and avoid the lack of interaction found among MOOC participants [26], identifying ways for tutors to intervene and reduce dropout [27] and finding ideas to make it safe to incorporate virtual manipulatives into MOOCs [28]. Zhu et al. [29,30] conducted a systematic review related to MOOC research trends and techniques in 2018 and 2020, respectively.
As MOOCs expand, incorporating sustainability-focused approaches will be critical to maintaining their effectiveness and durability. Sustainable MOOCs can act as a bridge to ongoing, adaptable learning while also addressing digital inclusiveness, environmental responsibility, and long-term student engagement. Exploring these characteristics can provide useful insights into optimizing MOOCs for global educational requirements.

1.2. The Objective of the Study

In this paper, a bibliometric analysis was conducted to identify and analyze the most influential papers in the field of MOOC dropout. As one of the most complex phenomena in contemporary online education, MOOC dropout remains a difficult dilemma to solve, especially from the perspective of identifying and tackling the factors that cause it. While research over the years has provided valuable insights, the above-mentioned studies confirm that drop-out persists and that its causes are interlinked and varied. These reasons can be likened to pieces of a jigsaw puzzle, each representing an essential element, which, when put together, form a pattern that favors dropout. Thus, the persistence of this phenomenon highlights the need for a more in-depth approach and customized solutions to increase retention in MOOCs.
In addition to providing readers with a comprehensive overview of the publications, authors, countries and affiliates that have made significant contributions to academic research in this field, this paper aims to observe trends in the analysis, to highlight the main themes studied, to highlight the temporal evolution, the relationships between concepts, theories and applicability, to uncover gaps and possible future directions of research, and to provide a comparison of both the results and the techniques applied. Furthermore, as far as the field of education is concerned, this paper can be used as a point for the identification of various barriers and the assessment of reasons for participation or dropout in MOOCs.
To support the above-mentioned main objective, the following research questions were formulated:
  • How has MOOC abandonment research evolved over time?
  • What are the characteristics of the articles that stood out in the field of MOOC dropout?
  • Who are the top authors in MOOC dropout research?
  • Which journals are the researchers’ favorite journals for publishing articles in this field?
  • Which are the leading universities in publishing work on MOOC dropout?
Bibliometric analysis offers a different approach to contributing to the research, by analyzing, from a scientometric point of view, papers belonging to a specific field through using, in general, large amounts of data, relying on tools such as VOSviewer or R and developed databases such as Scopus or Google Scholar [31]. Due to its increasing popularity, bibliometric analysis has been used in this study due to the availability, accessibility and progress in scientific software, which has enabled us to handle large volumes of data; thus, this method of analysis has a significant impact on research due to the totality of the indicators it involves [32,33,34,35,36]. Moreover, it has been observed over time that it helps researchers to discover patterns of collaboration, the structure of a research field and emerging trends, using targets and massive data, facilitating the identification of different gaps in knowledge, the generation of new ideas and the positioning of contributions in a field [37,38,39,40]. In addition to the importance that this method of analysis gives to quantitative data, an increased interest in qualitative data has been observed over time, and one can observe the implications that bibliometric analysis has had and still has on research evaluation [41].
In the paper by Passas [42], the researcher made a comparison between bibliometric analysis, systematic reviews and meta-analysis. The author noted that although both bibliometric analysis and meta-analysis are quantitative analyses, they differ in focus. Meta-analysis can be described more as a tool that helps to extend theory by examining the relationships between variables, whereas bibliometric analysis is easier to approach by exploring both the intellectual and bibliometric structure of a field via the investigation of the relationships between institutions, authors or topics. Moreover, the researcher argues that the three techniques are complementary, each offering unique benefits: bibliometric analysis is suitable for providing general reviews, thus being used for large datasets, but not beneficial for research that includes small datasets, since it is able to quantify the scientific literature; meta-analysis is more of a summarization technique at the statistical level, being beneficial for studies with similar contexts and methodologies; systematic reviews are conducted on a specific topic in a structured way, being useful for specific reviews, not broad ones.

1.3. Manuscript Contribution

This paper aims to analyze the evolution of the MOOC dropout research, as stated above, by considering the elements related to a bibliometric analysis, and to further identify which are the authors’ areas of interest in terms of MOOC dropout, so that this can be explored further in future research. With the passage of time, as can be seen in Table 1, the interest of researchers in the debated topics and the analyses carried out by other authors have led to the use of bibliometric analysis in the field of education.
Zong et al. [43] conducted a bibliometric analysis to investigate the development of outdoor education over time. The authors observed a gradual increase in interest by changing themes from environmental governance to environmental education. Hallinger et al. [44] observed the increasingly significant development of research (1991–2023) on education for sustainable development in East Asia.
Basheer et al. [45] analyzed how higher education institutions are involved in achieving the Sustainable Development Goals (SDGs). The authors started from existing research both on the integration of the SDGs into the educational curriculum and on how these efforts are evaluated and tracked. Drawing from a total of 83 articles, the findings focus on the increasing importance of sustainability and on the need to integrate the SDGs into all academic areas of higher education institutions.
With a similar theme, Dönmez [46] analyzed research on sustainability in education using bibliometric analysis, highlighting the increase in publications and the shift in focus from environmental education to sustainable education with the SDGs entering them mainstream. The study emphasizes the role played by education in sustainability and the need for further research for the more effective implementation of educational efforts, laying a foundation for future research.
In addition to these mentioned examples, several of the other authors’ studies and their focus are presented in Table 1.
Considering the papers listed in Table 1, it should be stated that the present paper distinguish which of the studies from the previous researchers mainly focus on education research in general, which focus on higher education in particular, and which focus on various issues related to education such as the evolution of education in a particular area, assessment practices, dropout prediction methods, learners’ confusion, the involvement of academic and emotional support, etc., by conducting a quantitative analysis of MOOC dropout research based on an overview of the publications, citations, authors, and institutions. Furthermore, this paper explores how research themes in the area of MOOC dropout have evolved and which are the themes that have attracted the interest of the research from the field by taking into account the most cited papers.

1.4. Paper Roadmap

The first part of this work involves the extraction of a database comprising selected articles, chosen using specific filters that will be detailed in the subsequent section. Part 2 follows with an explanation of the methodology and materials that form the basis of the research. The selection process, guided by these filters, was meticulously carried out to identify the most relevant articles in the field of MOOC dropout. Part 3, the most comprehensive section, presents the bibliometric analysis of the selected papers. This analysis covers articles published between 2013 and 2023 and includes a detailed examination of the authors, their journal preferences, existing collaborations, and their most globally cited articles. Additionally, a rigorous analysis of the most frequent word groups and factorial analysis were conducted, while two thematic maps and an evolution map were created. Part 4 presents the conclusions drawn from the bibliometric analysis of MOOC dropout and discusses the limitations of this study.

2. Materials and Methods

To identify the most relevant papers, key journals, and influential authors in the study of MOOC dropout, this paper employs bibliometric analysis. Bibliometric analysis, also known as scientometrics, utilizes mathematical and statistical methods to quantify scientific activity and assess its impact over a specified period [51,52]. A review of the specialized literature indicates that this method is frequently employed by researchers across various fields to conduct scientometric analyses [53,54,55,56,57,58].
In order to perform a bibliometric analysis, according to the literature [59,60], it is necessary to divide the analysis into four parts, which can be seen in Figure 1:
  • Dataset extraction: Downloading the dataset from the selected platform, Clarivate Analytics’ Web of Science Core Collection, also commonly known as Web of Science (WoS) database, in our case;
  • Analysis: Conducting analyses through the use of a specific software—Biblioshiny 4.2.3 library in R version 4.4.1 in our case;
  • Discussions;
  • Conclusions and limitations.

2.1. Dataset Extraction

In this subsection, the process of collecting and creating the database will be described. First, the platform from which the database is extracted is presented, followed by the specific indexes that were used, as well as the filters that were used in order to extract only those articles that we considered relevant for this analysis.
For the first part, involving the selection of the platform from which to extract the database, the choice of WoS is based on its extensive coverage of different disciplines [61,62,63,64,65] and its restrictive selection of journals, which gives it a solid reputation in the scientific community [66], as argued by Bakır et al. [67]. Although other databases such as Google Scholar, Scopus, PubMed, IEEE, and the Cochrane Library are available, the Web of Science (WoS) platform was selected for this analysis due to its compatibility with Biblioshiny, the bibliometric tool employed in this study. WoS allows seamless data import into Biblioshiny, which is crucial for the analysis process. While both VOSviewer and Biblioshiny are among the most widely used bibliometric analysis tools, each of them has limitations regarding data import capabilities. Biblioshiny supports raw file imports from Scopus, WoS, Lens, Dimensions, and Cochrane Library, while VOSviewer can import raw files from Dimensions, Lens, WoS, and PubMed [68,69].
It is important to emphasize that the extraction of data from the WoS dataset is conducted on a subscription basis. As noted by other researchers [70,71], the dataset obtained from the Web of Science (WoS) is closely tied to the specific subscription level utilized, making it essential to specify the indexes accessed. In our case, as detailed in Table 2, we employed all ten available indexes within WoS for extracting the dataset. While the indexes are available for the mentioned periods, depending on the field of analysis, the period in which the paper belonging to a specific field has been written can be shorter.
To achieve the objectives of the proposed research, a dataset was extracted using specific filters to ensure alignment with the research goals. The process involved four distinct steps to generate the dataset, as highlighted in Table 3.
First, filters were applied to retain only those articles that included the most significant terms in their titles, abstracts, or keywords. The initial filter selected papers containing the keyword “MOOC*”, identifying a number of papers equal to 8443. It should be stated that the “*” has been in order to facilitate the search of both singular (“MOOC”) and plural (“MOOCs”) forms of “MOOC” keyword. The second filter was applied to select research containing the keyword “dropout”, which resulted in a significantly larger dataset of 32,480 papers compared to the previous filter. Since our objective was to focus specifically on the dropout rates of individuals enrolled in online courses, the third filter was used to refine the dataset further by retaining only those papers that contained both the terms “MOOC*” and “dropout”. This refinement reduced the dataset to a total of 455 papers meeting both criteria. Comparing the selection criteria, it was observed that Billsberry and Alony [72] used the abbreviations “MOOC” and “MOOCs” to form the database used in their bibliometric analysis, which was mainly aimed at mapping the courses and identifying the most significant themes. Querying the Scopus database, the researchers came up with a total number of 3114 published journal articles, 597 book chapters, 145 reviews and 53 editorials from the period 2009–2022. Furthermore, in order to ensure that the database is an appropriate one for the purpose of analyzing dropout in distance education, much like in this analysis, Kurulgan [73] used the keyword “dropout” and its derivatives to filter the database extracted from WoS.
The second stage involved applying a filter to include only articles written in English, reducing the dataset from 455 to 432 articles. English was selected because it is an internationally recognized language and the most commonly used language for academic publications, as noted by Raman et al. [74]. Researching other bibliometric analyses carried out, it was found that this criterion has also been applied to observe the following: the increase in interest in MOOCs by researchers over time [75], the awareness of students regarding their education on the mismanagement of toxic waste [76] and the understanding of both the integration and use of virtual reality in the educational process [77].
The third step involved filtering the dataset to include only documents classified as “articles”, resulting in a total of 212 papers. According to Donner [78], categorizing a paper as an “article” denotes a report of original research, regardless of length, and may include meta-analyses. This classification technique aligns with the indexing practices used by WoS and Scopus datasets. Donner further argues that, in bibliometric analyses, it is crucial to limit the dataset to articles presenting primary research findings. Additionally, distinguishing between different document types is essential in scientometrics due to their varied content and purposes, which can lead to different citation patterns. Other researchers have chosen to include this filter related to articles among the papers selected in the bibliometric analysis, in order to identify research literature on initial teacher training in relation to inclusive education [79] or to observe how the field of gamification has evolved over a certain period of time from an educational point of view [80].
In the final stage of generating the dataset, a filter was applied to limit the publication years by excluding 2024. This exclusion was made because 2024 is not a full year and there is a possibility that papers submitted to WoS may not have been indexed by the time the dataset was extracted. Moreover, if articles published in 2024 would have been included in the analysis performed, different indicators such as those related to citations would have been biased as these papers would not have had enough time to be cited. Thus, indicators such as the number of citations per article would have been affected and would not have accurately reflected their real impact, given that they would have been at the beginning of the citation process and would not yet have had significant traction in the literature. A similar approach was used by Basheer et al. [45], where the dataset was limited to publications from 2018 to 2023. After applying this final filter, the dataset was refined to a total of 193 articles.

2.2. Analysis

This sub-chapter represents the most complex part of this study, describing the totality of the analyses that were applied to the dataset. For this part, the program RStudio version 4.4.1 was used, particularly the package Bibliometrix version 4.2.3. together with the command biblioshiny(). R serves as both a language and an environment for statistical and graphical computation, providing a diverse array of graphical and statistical techniques. It is highly extensible and supports functional and object-oriented programming, making it a powerful tool for conducting complex analyses such as bibliometric studies [69].
In Figure 1 the central part of the analysis is divided into four distinct sections, with the final section further subdivided into four subcategories. The first section, “Dataset Overview”, provides details on the key indicators of the selected dataset, setting the context for the research domain. These indicators include the time period during which the papers were published, the total number of papers and their sources, the average number of citations per paper, the annual scientific output, the number of references, the annual evolution of average article citations per year, the total number of authors, and whether authors preferred to publish individually or in collaboration.
The second section of the analysis focused on evaluating the sources to identify the most relevant journals over the analytical period. This was performed by examining the total number of documents published in the field, applying Bradford’s Law [81], and assessing the journals’ impact through their H-index. Discovered in 1934, Bradford’s law is one of the three major bibliometric laws, alongside Zipf’s law and Lotka’s law. Bradford’s law posits that scientific papers on a given topic are distributed according to a mathematical function. As the number of articles on a topic increases, the number of journals publishing those articles also increases. According to this law, if we cluster journals producing roughly the same number of articles, the number of clusters is proportional to 1 : n : n 2 , where n represents a multiplier [81,82]. The H-index is a measure that captures scientific output by considering both the total number of publications and the number of citations. It assesses productivity and provides an overview of an individual’s research performance, but it is not ideal for direct comparison between researchers [83].
The third section provides a more detailed analysis of the authors, identifying those with the most significant scientific contributions to MOOC dropout research. This analysis was further broken down by year, examining the authors’ affiliations, the countries with which they collaborated, and the creation of a collaborative network to visualize how authors grouped together. Additionally, this section highlighted the countries that recorded a high number of citations.
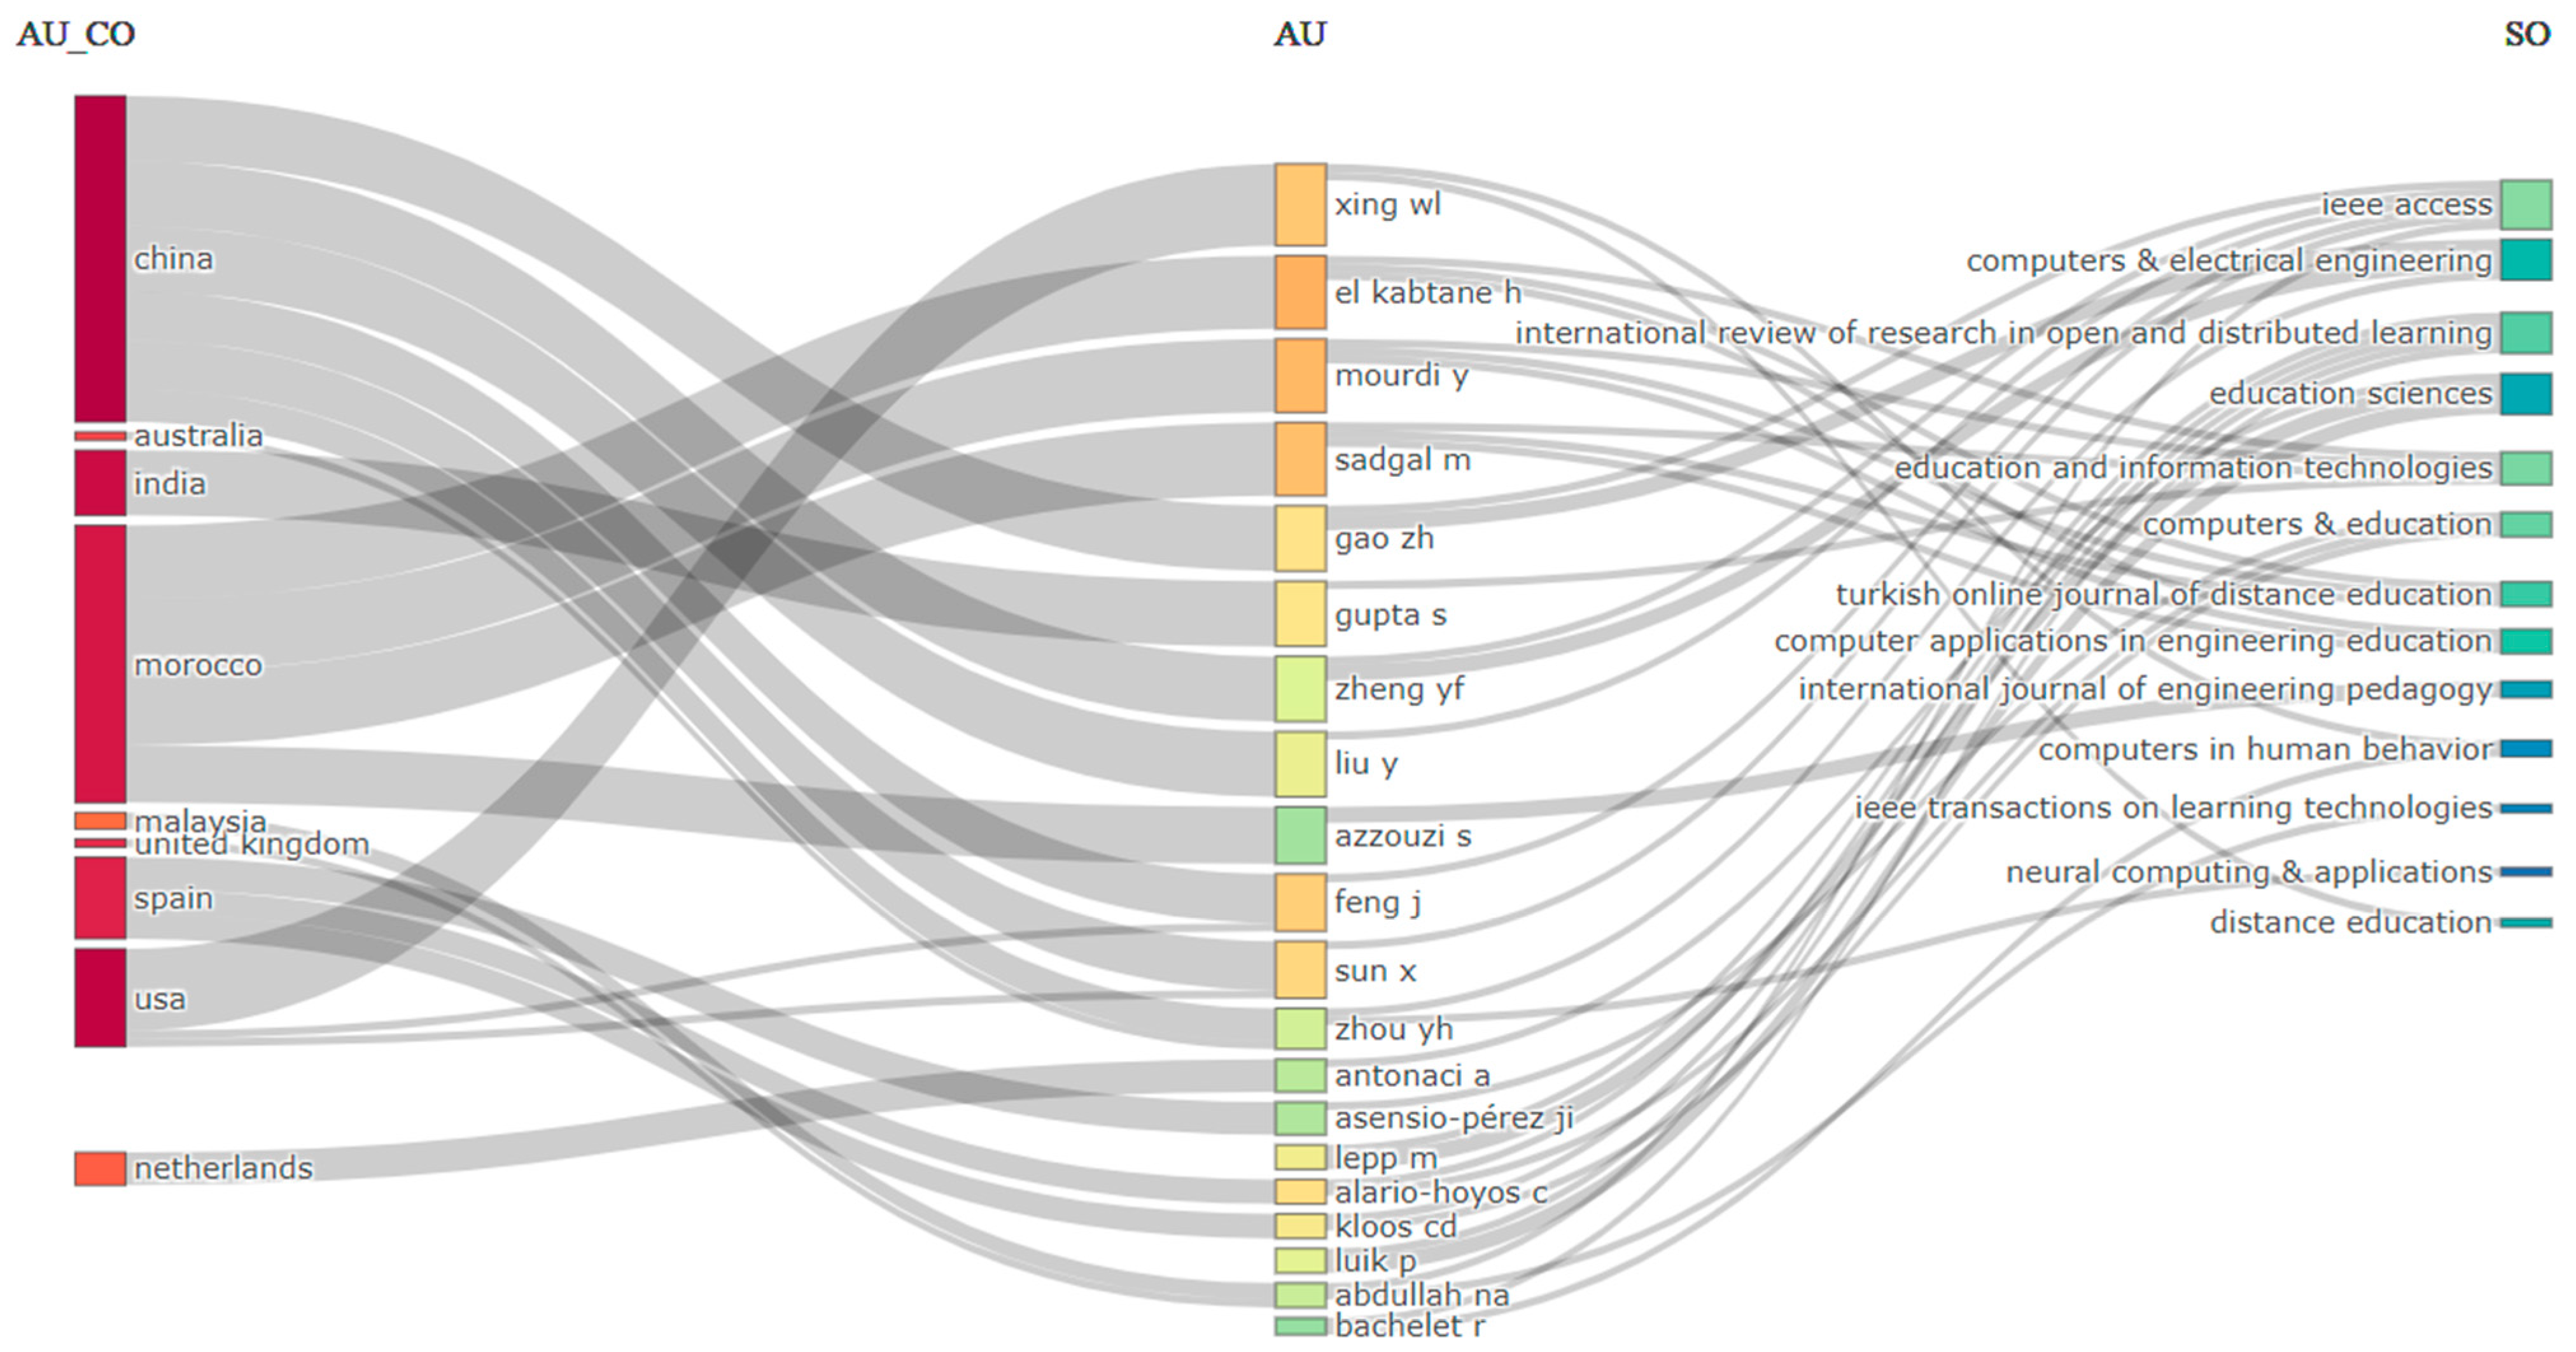
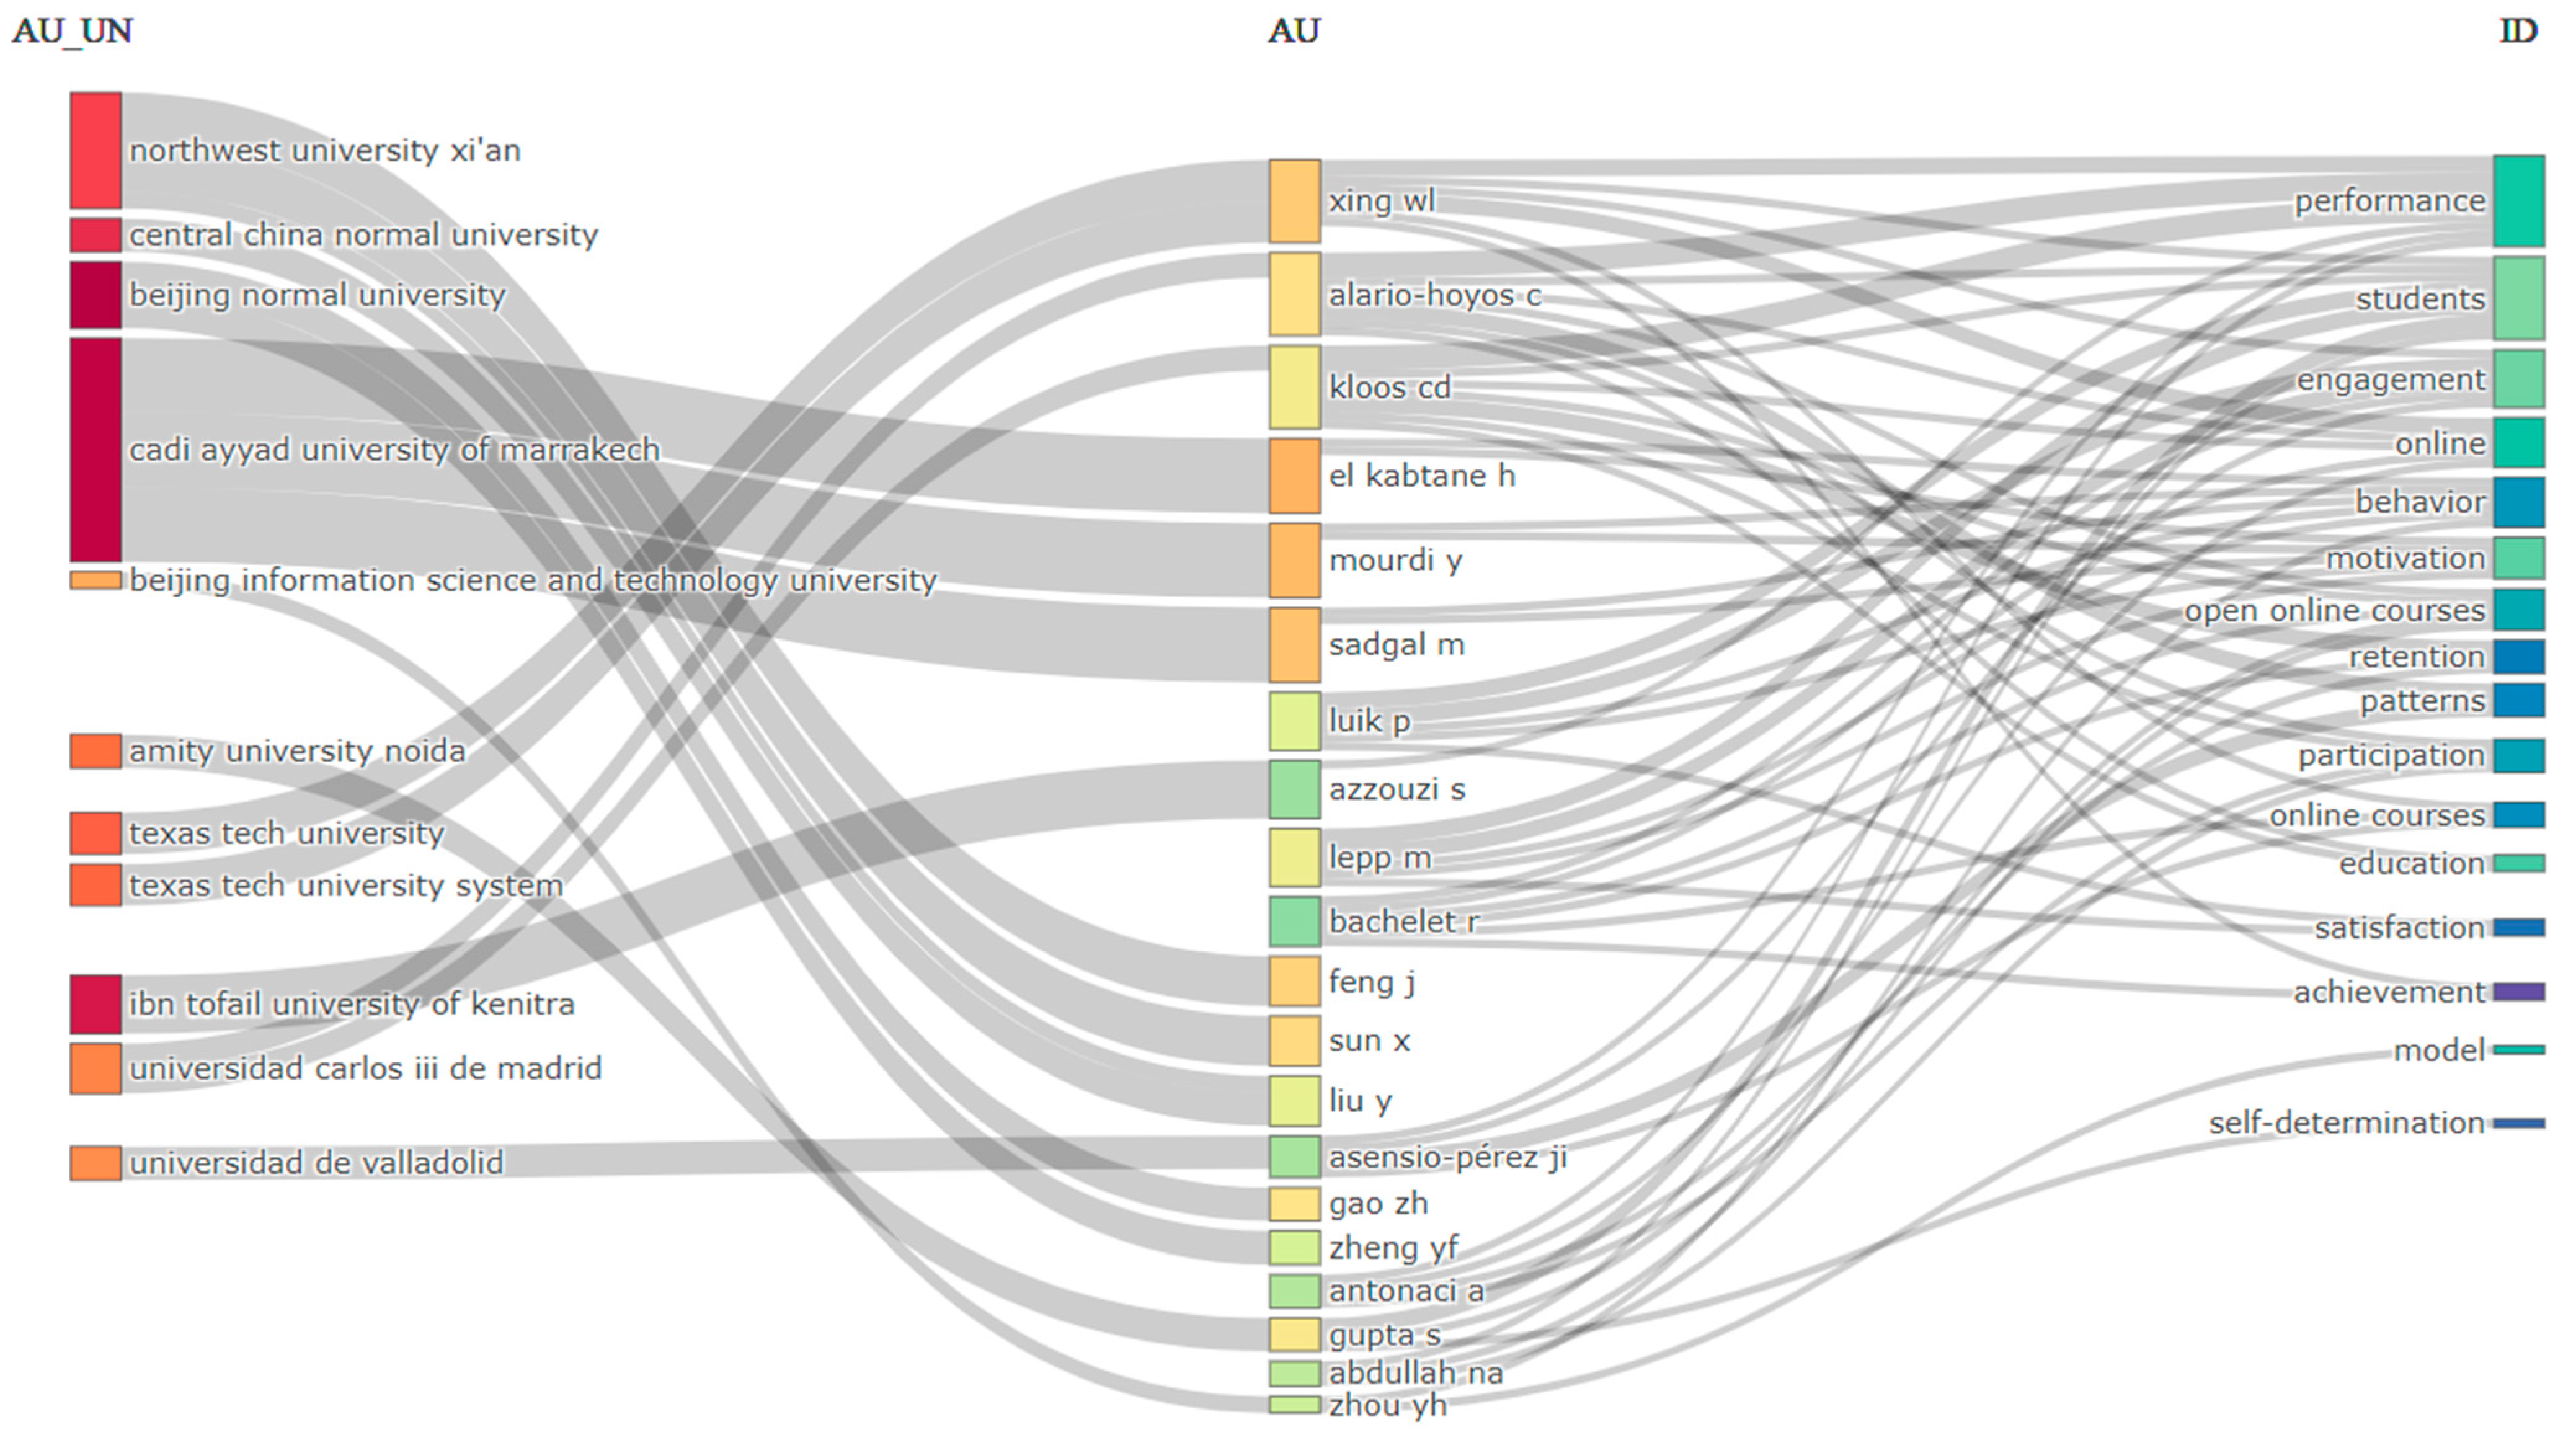
The fourth section, titled “Analysis of Literature”, is subdivided into four subcategories: the first two subcategories (“Most cited papers—overview” and “Most cited papers—review”) focus on the most cited works, providing readers with insights into the research approaches and objectives of authors who have studied MOOC dropout. Each paper is accompanied by a comprehensive summary, including details such as the number of authors, the journal in which studies were published, the total number of citations, the total number of citations per year, and the normalized citation counts. The third subcategory, “Word Analysis”, concentrates on identifying the most frequently used keywords, including author keywords, “keywords plus”, and common word groups (n-grams) found in the abstracts and titles of the selected papers. The final subcategory features two three-field plots, which illustrate the connections between countries, authors, and journals, as well as between affiliations, authors, and keywords. The N-grams are actually the bigrams and trigrams found, which represent groups of words (two or three words as the case may be) that had a significant number of occurrences in the identified works. In addition, the last sub-category includes a thematic map of the authors’ keywords, used to describe the current state of the research field and to highlight possible future research directions. A thematic evolution map is provided to show how research techniques have evolved up to 2020 and beyond. Finally, a factorial analysis is conducted to explore and understand the structure of relationships between the variables in the dataset.

2.3. Discussion

The discussion part of this article will analyze the significance of the results obtained from the bibliometric analysis of the evolution of MOOCs and the interest of researchers in this topic. It will discuss general observations related to the significant growth of publications in the field of MOOCs and discuss the relevance of publications in major journals, as well as significant contributions by renowned authors or regional contributions. Moreover, the discussion will expand on the main research directions identified and the identified prediction techniques will be compared; the main causes of dropout, personalized interventions to prevent dropout, and the impact of cultural and social network factors on dropout rates will also be discussed.

2.4. Conclusions and Limitations

In the conclusions section, we will summarize the main results of the bibliometric analysis of MOOC dropout based on articles indexed in ISI Web of Science. We will also summarize the interest in this field, which were the most cited articles and their countries of origin, which were the more frequently used analysis techniques, which were the most active institutions in this field, and which are the limitations of this analysis.

3. Dataset Analysis

This section focuses on analyzing the papers selected through specific filters, with particular attention given to the number of authors, the existing collaborations between them, and the insights they were able to uncover through their analyses.

3.1. Dataset Overview

Table 4 reveals that our dataset comprises 193 articles, published across 101 different journals between 2013 and 2023. According to Dhawal Shah [84], 2013 was a pivotal year for MOOCs, marked by a surge in student enrollments. While there were approximately 100 MOOCs in 2012, this number skyrocketed to nearly 700 in 2013. The selected articles collectively contain 6560 references, a substantial number reflecting the complexity of the education field, which necessitates a wide range of sources for comprehensive analysis across various studies.
In addition to the key statistics discussed, the final two indicators in Table 4 provide insights into the content of the documents. The dataset contains 573 “author’s keywords”, resulting in an average of approximately 3 (2.97) keywords per document. The “keywords plus” indicator, totaling 255, represents keywords extracted from the titles of articles that were cited, with an average of approximately 1 (1.32) keywords plus per document.
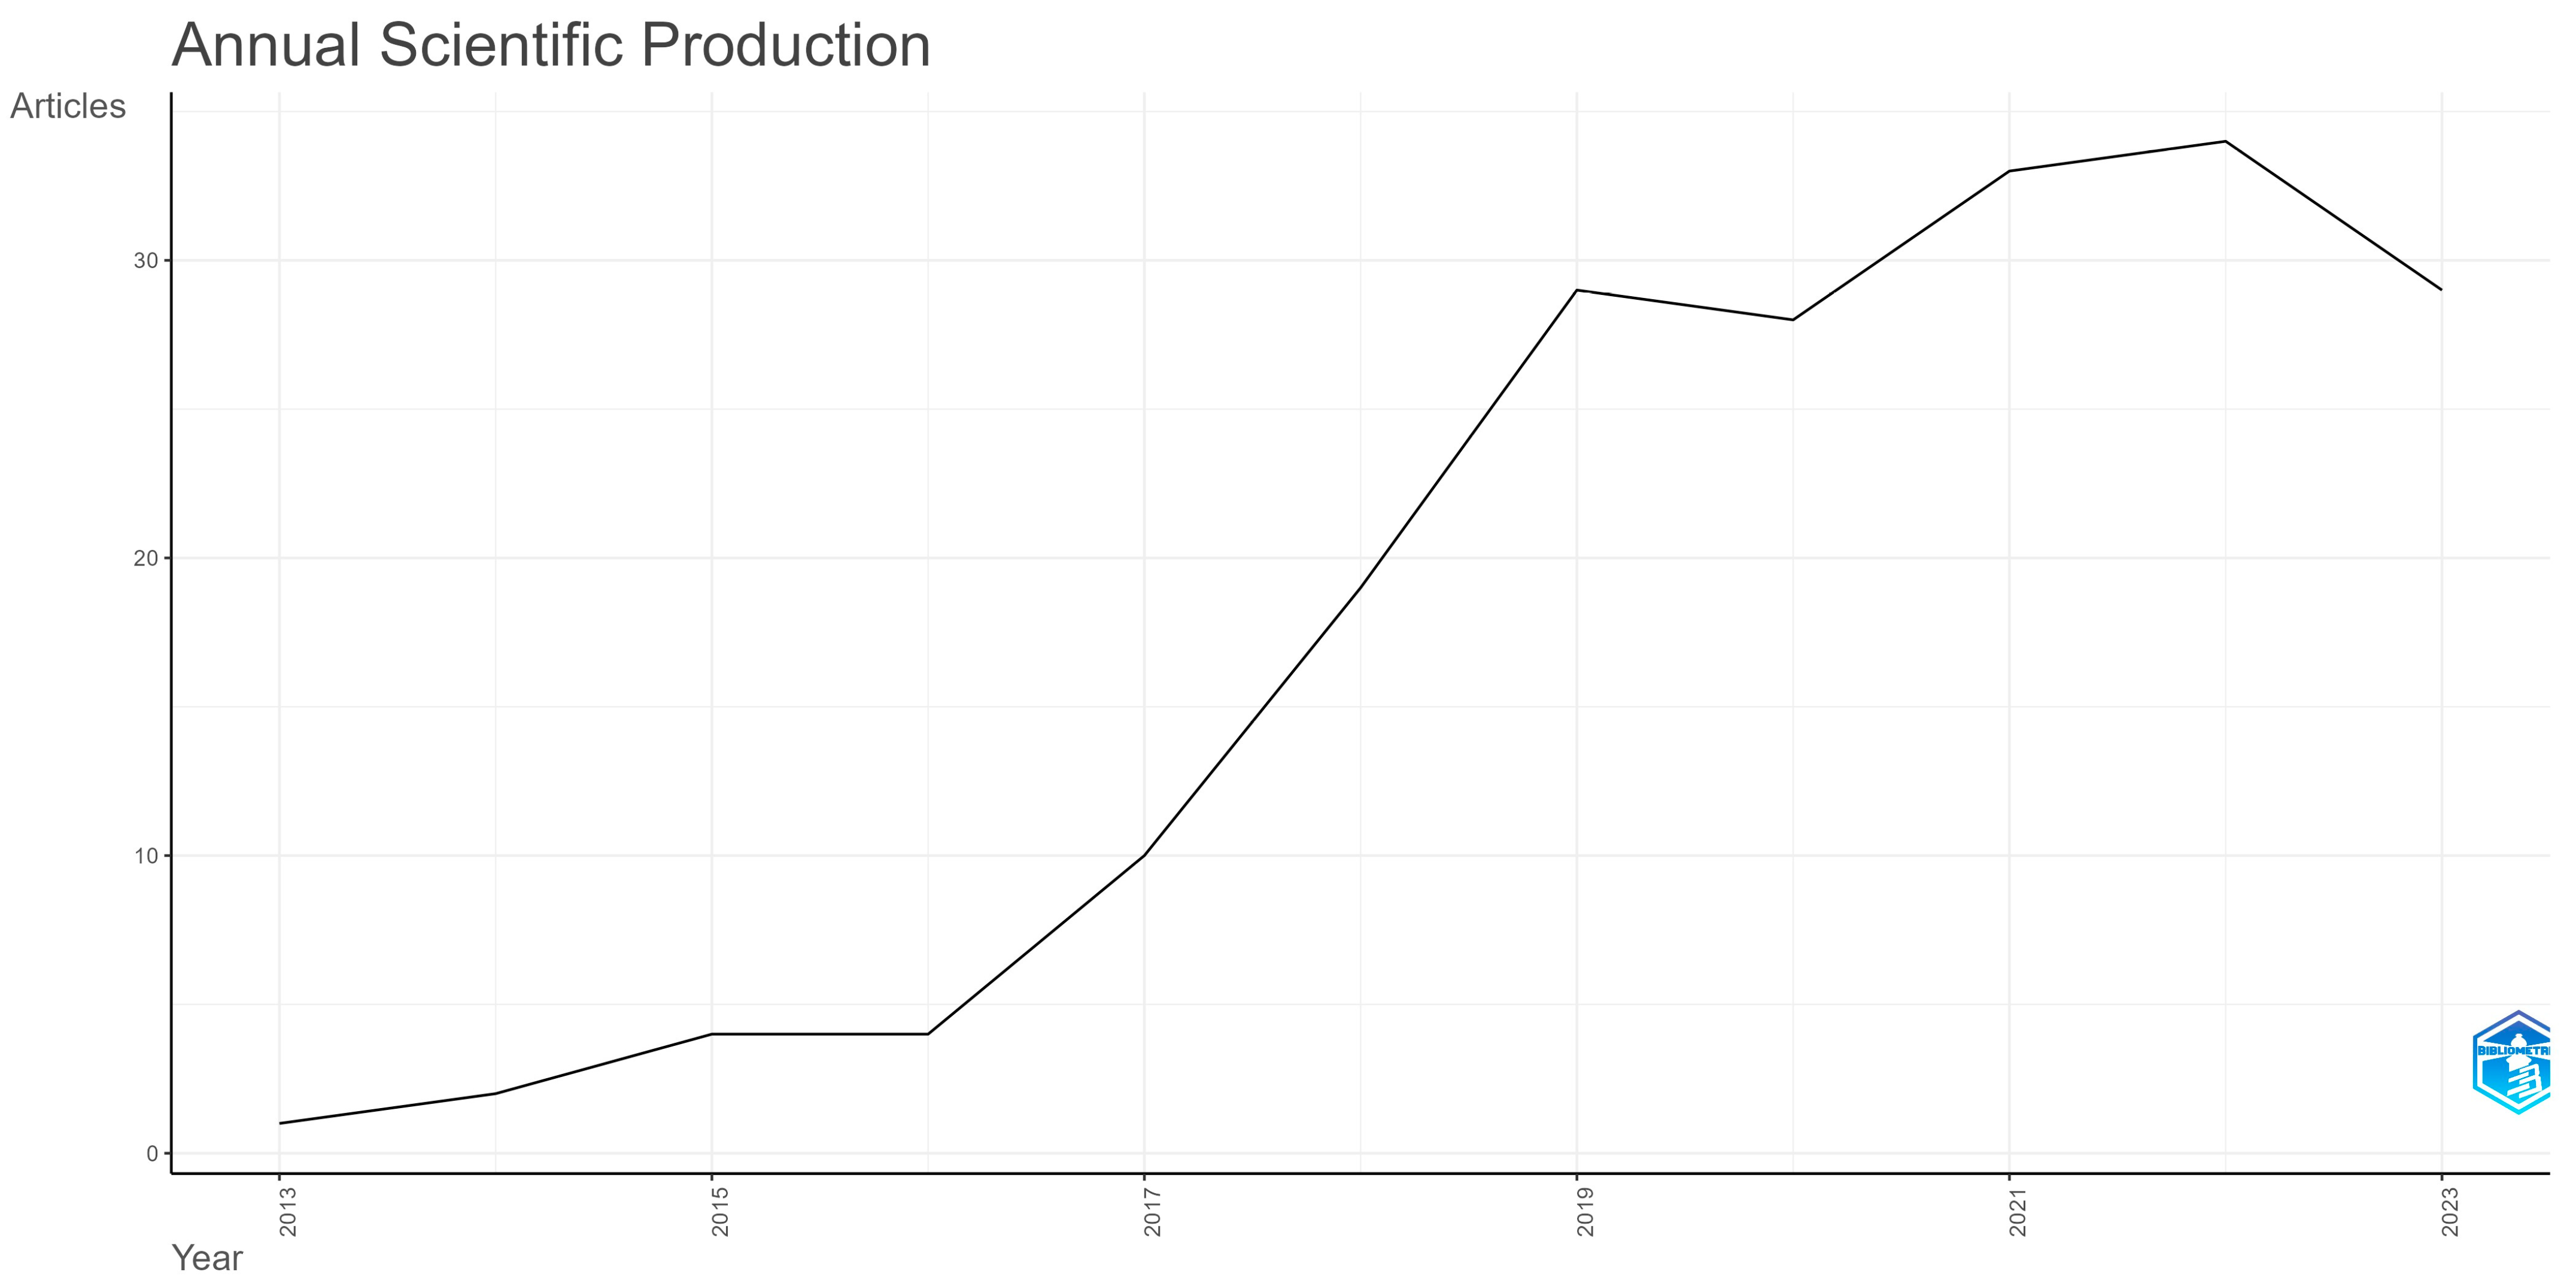
Regarding the annual scientific output in the area of MOOCs dropout, determined based on the extracted dataset, Figure 2 shows that the highest number of articles in the analyzed field—34—were published in 2022. Additionally, there is a noticeable increase in the number of articles from 2016, with only 4 articles, to 2019, when 29 studies were published. Throughout the analyzed period, interest in this field has followed an upward trend, with an annual growth rate of 40.04%. However, a decrease is observed between 2022 and 2023, with five fewer articles published in the latter year.
According to Shah [84], by the end of 2019, more than 900 universities worldwide had either launched or announced a total of 13,500 MOOCs. It can also be seen that, in 2019 alone, approximately 2500 courses were launched by 450 universities. Furthermore, it was concluded that the increased interest in MOOCs in 2020 was a side effect of the COVID-19 pandemic [85].
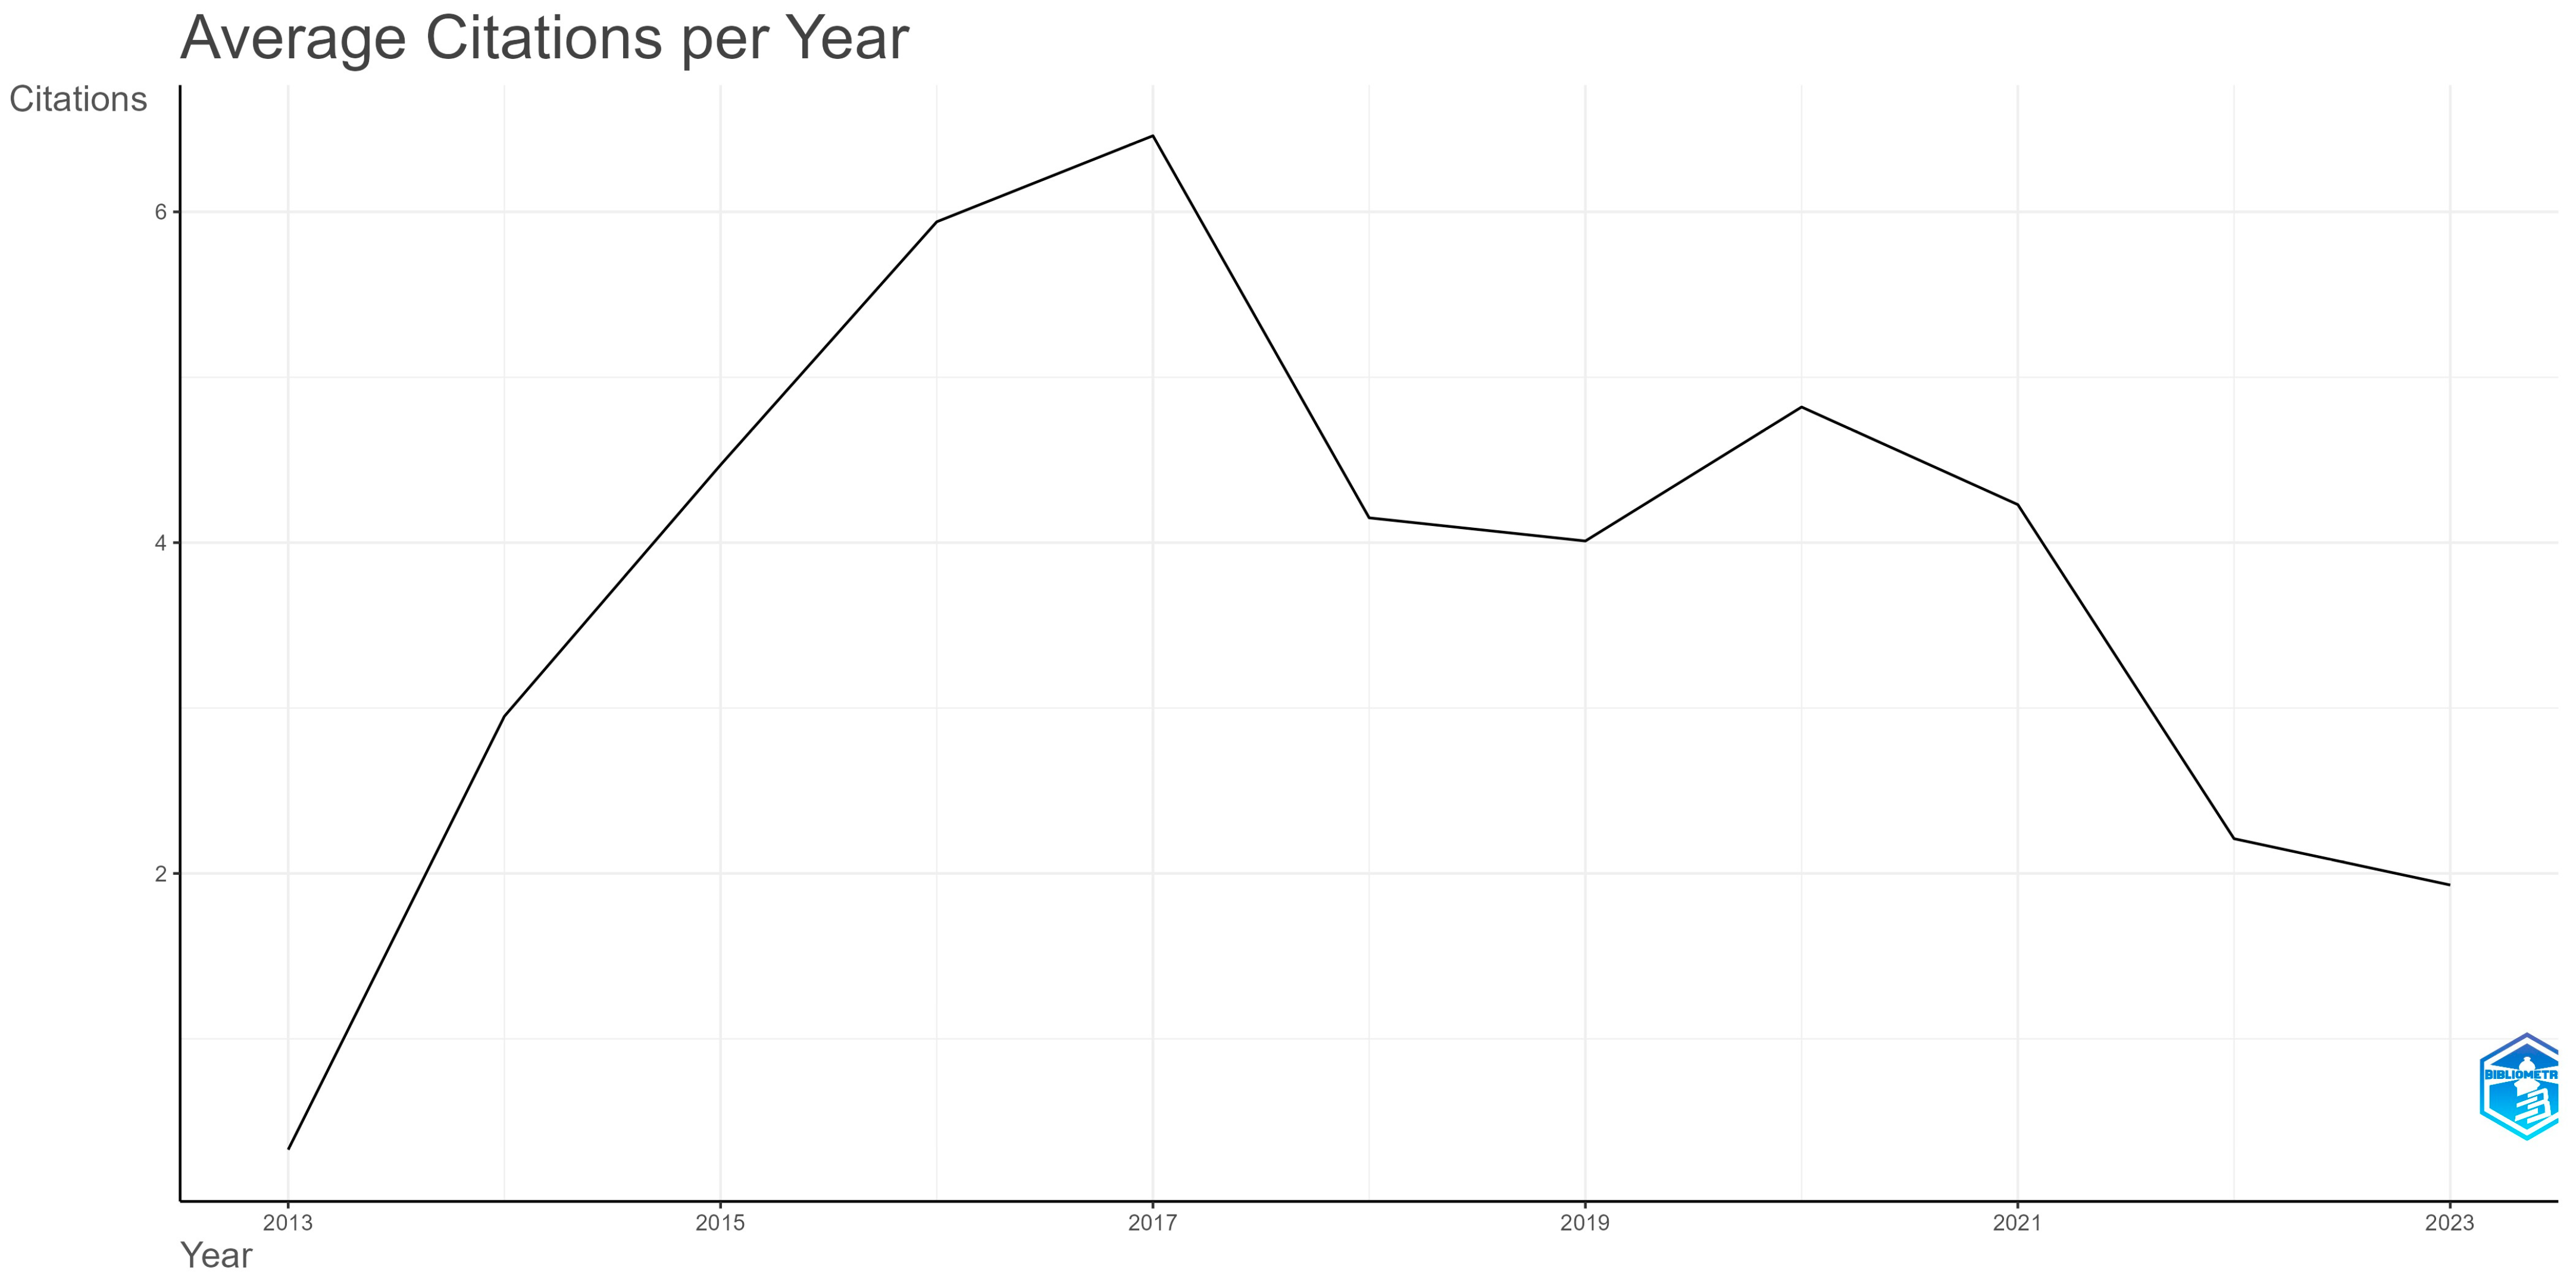
Figure 3 shows the average citations per year for the selected articles in the dataset with regard to MOOC dropout. Until 2017, this indicator steadily increased, starting at 0.33 in 2013 and reaching 6.46 in 2017. During the same period (2013–2017), the “average citations per article” indicator also showed rising values, starting at 4 and reaching 51.7 by 2017. This suggests a growing interest in scientific research in this field during that time.
While the early years showed a steady increase in the average number of citations per year, from 2017 to 2023, this indicator fluctuated, peaking in 2020 with a value of 4.82. These fluctuations may be attributed to heightened curiosity during the initial period, when the field was new and internet resources were less developed, leading to greater reliance on forums and early research.
At the author level, Table 5 indicates that there were a total of 566 authors—determined through the analysis of the extracted dataset. Although this number may seem relatively low, it aligns with the limited number of papers in the dataset. Of these authors, only 20 were published as sole authors, while the remaining 546 collaborated on various research projects. Given the dataset includes 193 papers, this suggests a strong tendency toward teamwork in MOOC abandonment research. The complexity of the field, requiring in-depth analysis and expertise from various disciplines, makes collaboration more advantageous. On average, each document involved approximately three (2.83) authors.
Table 6 provides a clearer view of author collaboration, and the information in it was obtained using the data in the extracted dataset. By dividing the “authors of single-authored documents” by “single-authored documents”, it reveals that, on average, single authors have nearly one paper each (0.95). Additionally, there are, on average, 0.34 papers per author and 2.93 authors per paper. The average number of co-authors per document is 3.45. These data again highlight that authors show a strong interest in collaboration, likely driven by the need to comprehensively analyze the factors influencing MOOC dropout.

3.2. Sources

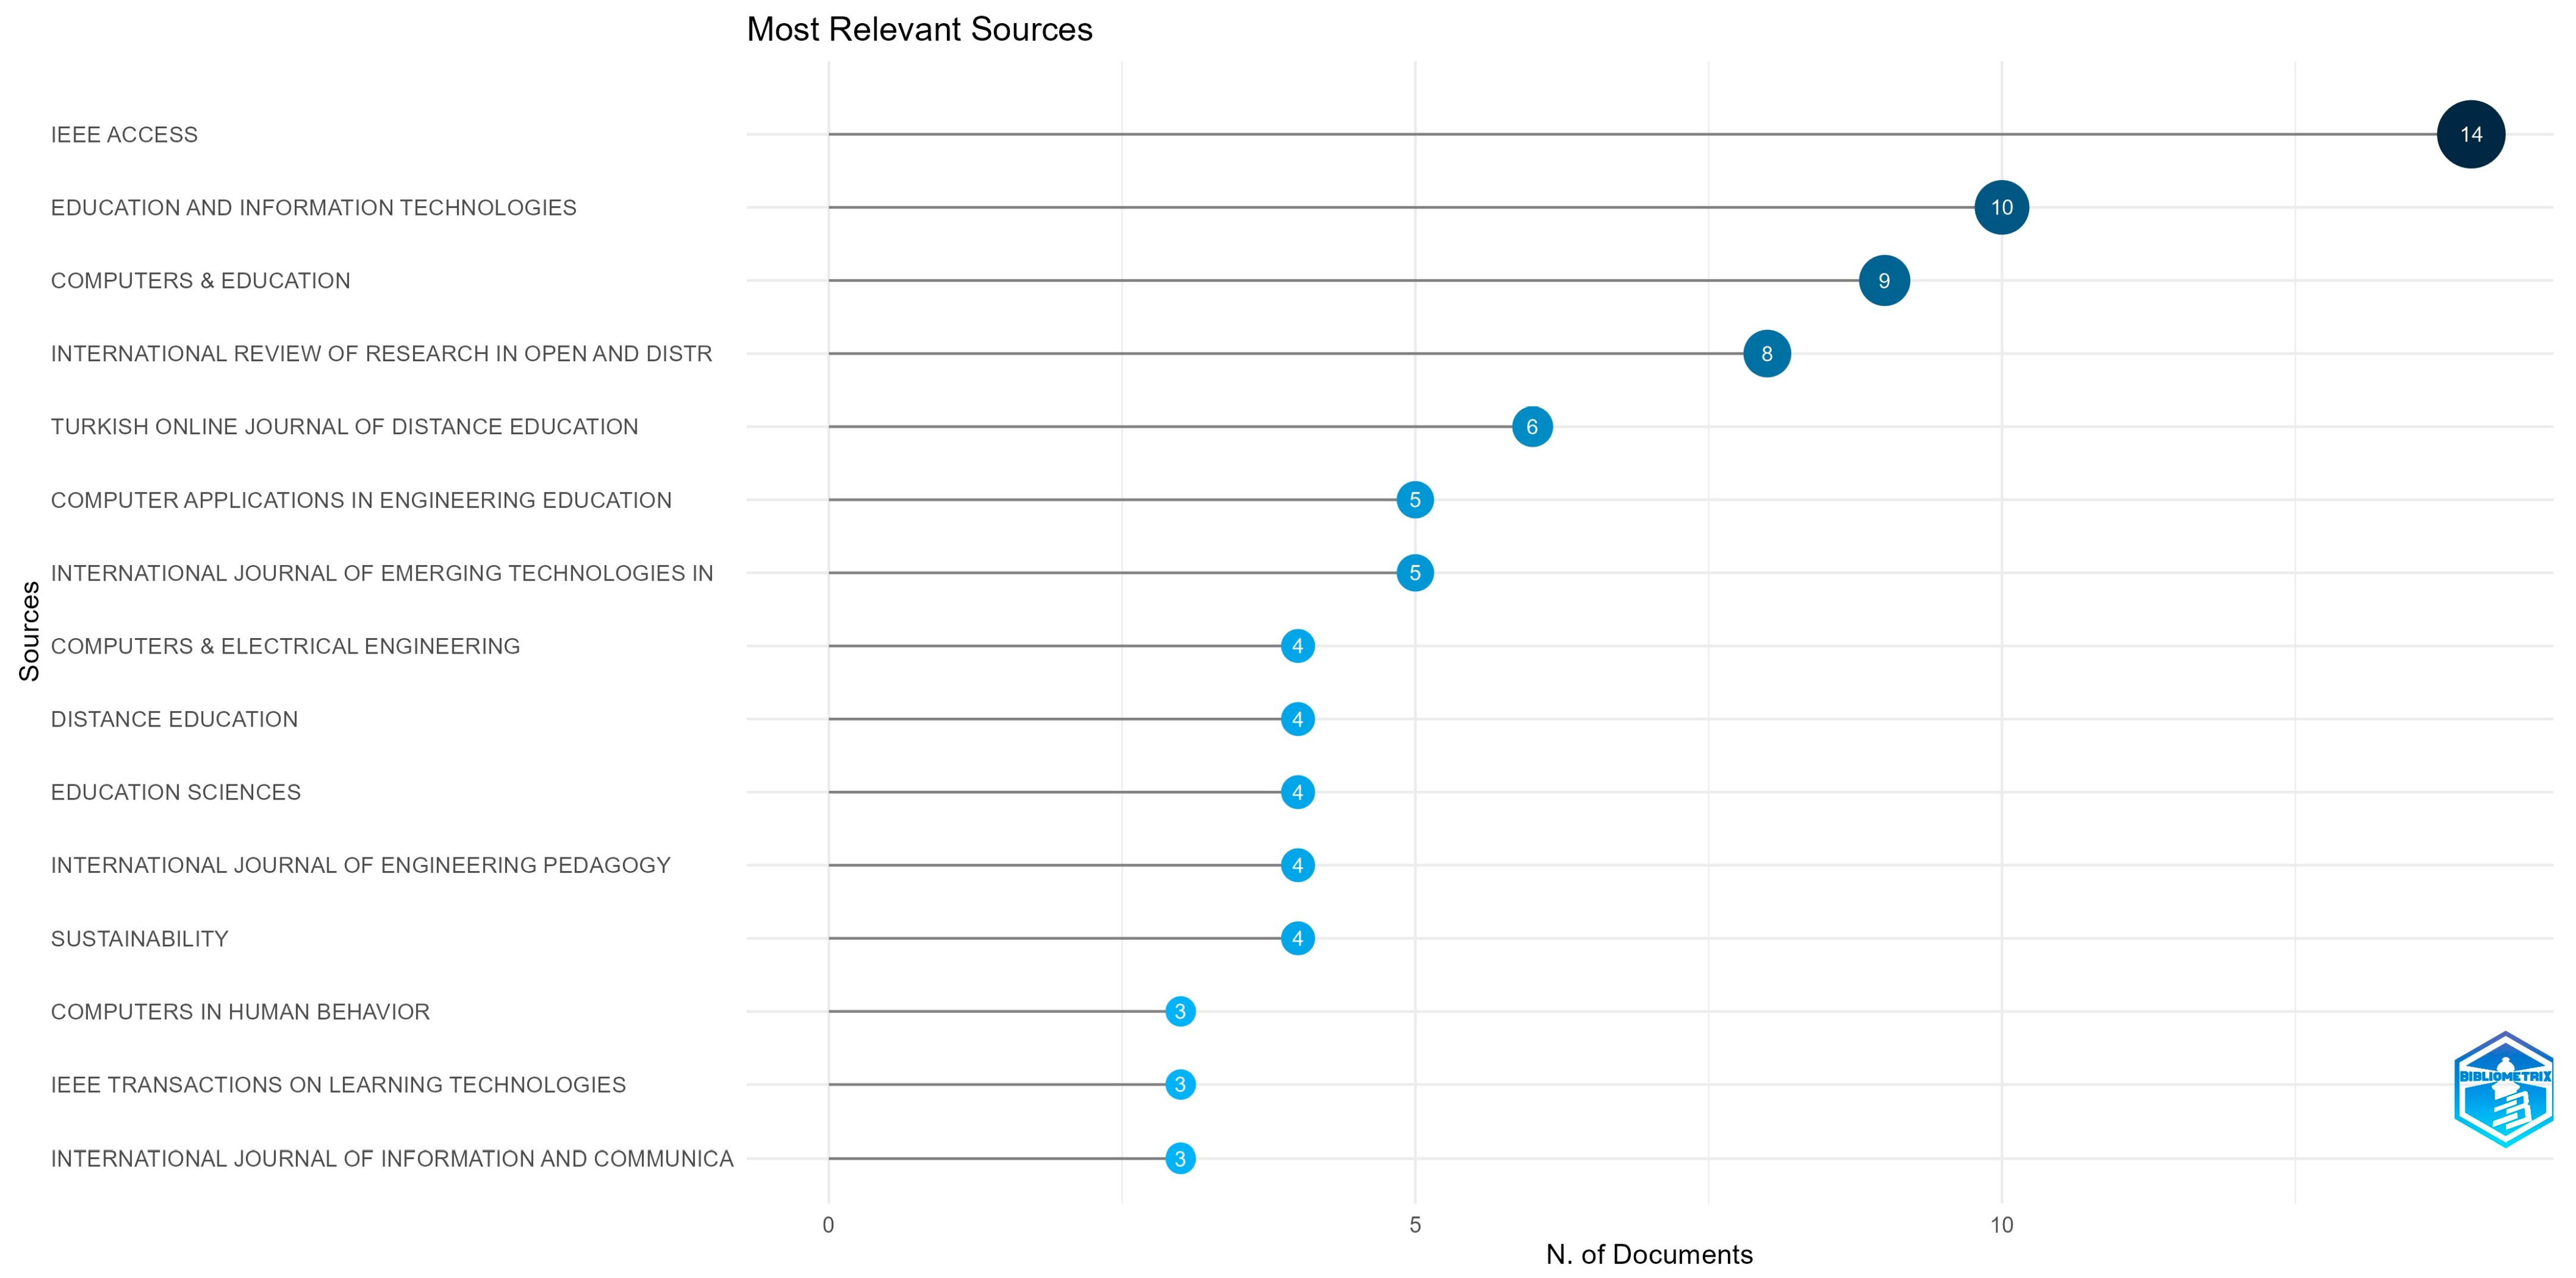
So far, we have discussed the authors, but it is also crucial to note their publication preferences. Figure 4 displays the top 15 preferred journals for publishing research. Leading the list is the journal “IEEE Access”, where 14 papers on MOOC abandonment were published. This journal is interdisciplinary and application-oriented, operating exclusively online, which aligns with the high volume of papers published in this field.
The next journal, “Education and Information Technologies”, has published 10 articles, combining education with information technology to provide insights across various levels. Following this is “Computers & Education” with nine articles and “International Review of Research in Open and Distributed Learning” with eight articles, both of which focus on how technology supports the open learning process in online environments. Additionally, five journals each have four publications in the top list: “Computers & Electrical Engineering”, “Distance Education”, “Education Sciences”, “International Journal of Engineering Pedagogy” and “ Sustainability”.
To examine the most cited publications, Figure 5 applies Bradford’s law. Essentially, Bradford’s law identifies a core group of journals with the highest concentration of articles on a specific topic, surrounded by additional clusters with varying publication frequencies. These peripheral clusters, being further from the central topic, contain fewer articles in the analyzed domain [86,87].
As anticipated, Figure 5 shows that the core or Zone 1 contains the top nine journals with the highest number of publications on MOOC dropout. These journals are “IEEE Access”, “Education and Information Technologies”, “Computers & Education”, “International Review of Research in Open and Distributed Learning”, “Turkish Online Journal of Distance Education”, “Computer Applications in Engineering Education”, “International Journal of Emerging Technologies in Learning”, “Computers & Electrical Engineering”, and “Distance Education”.
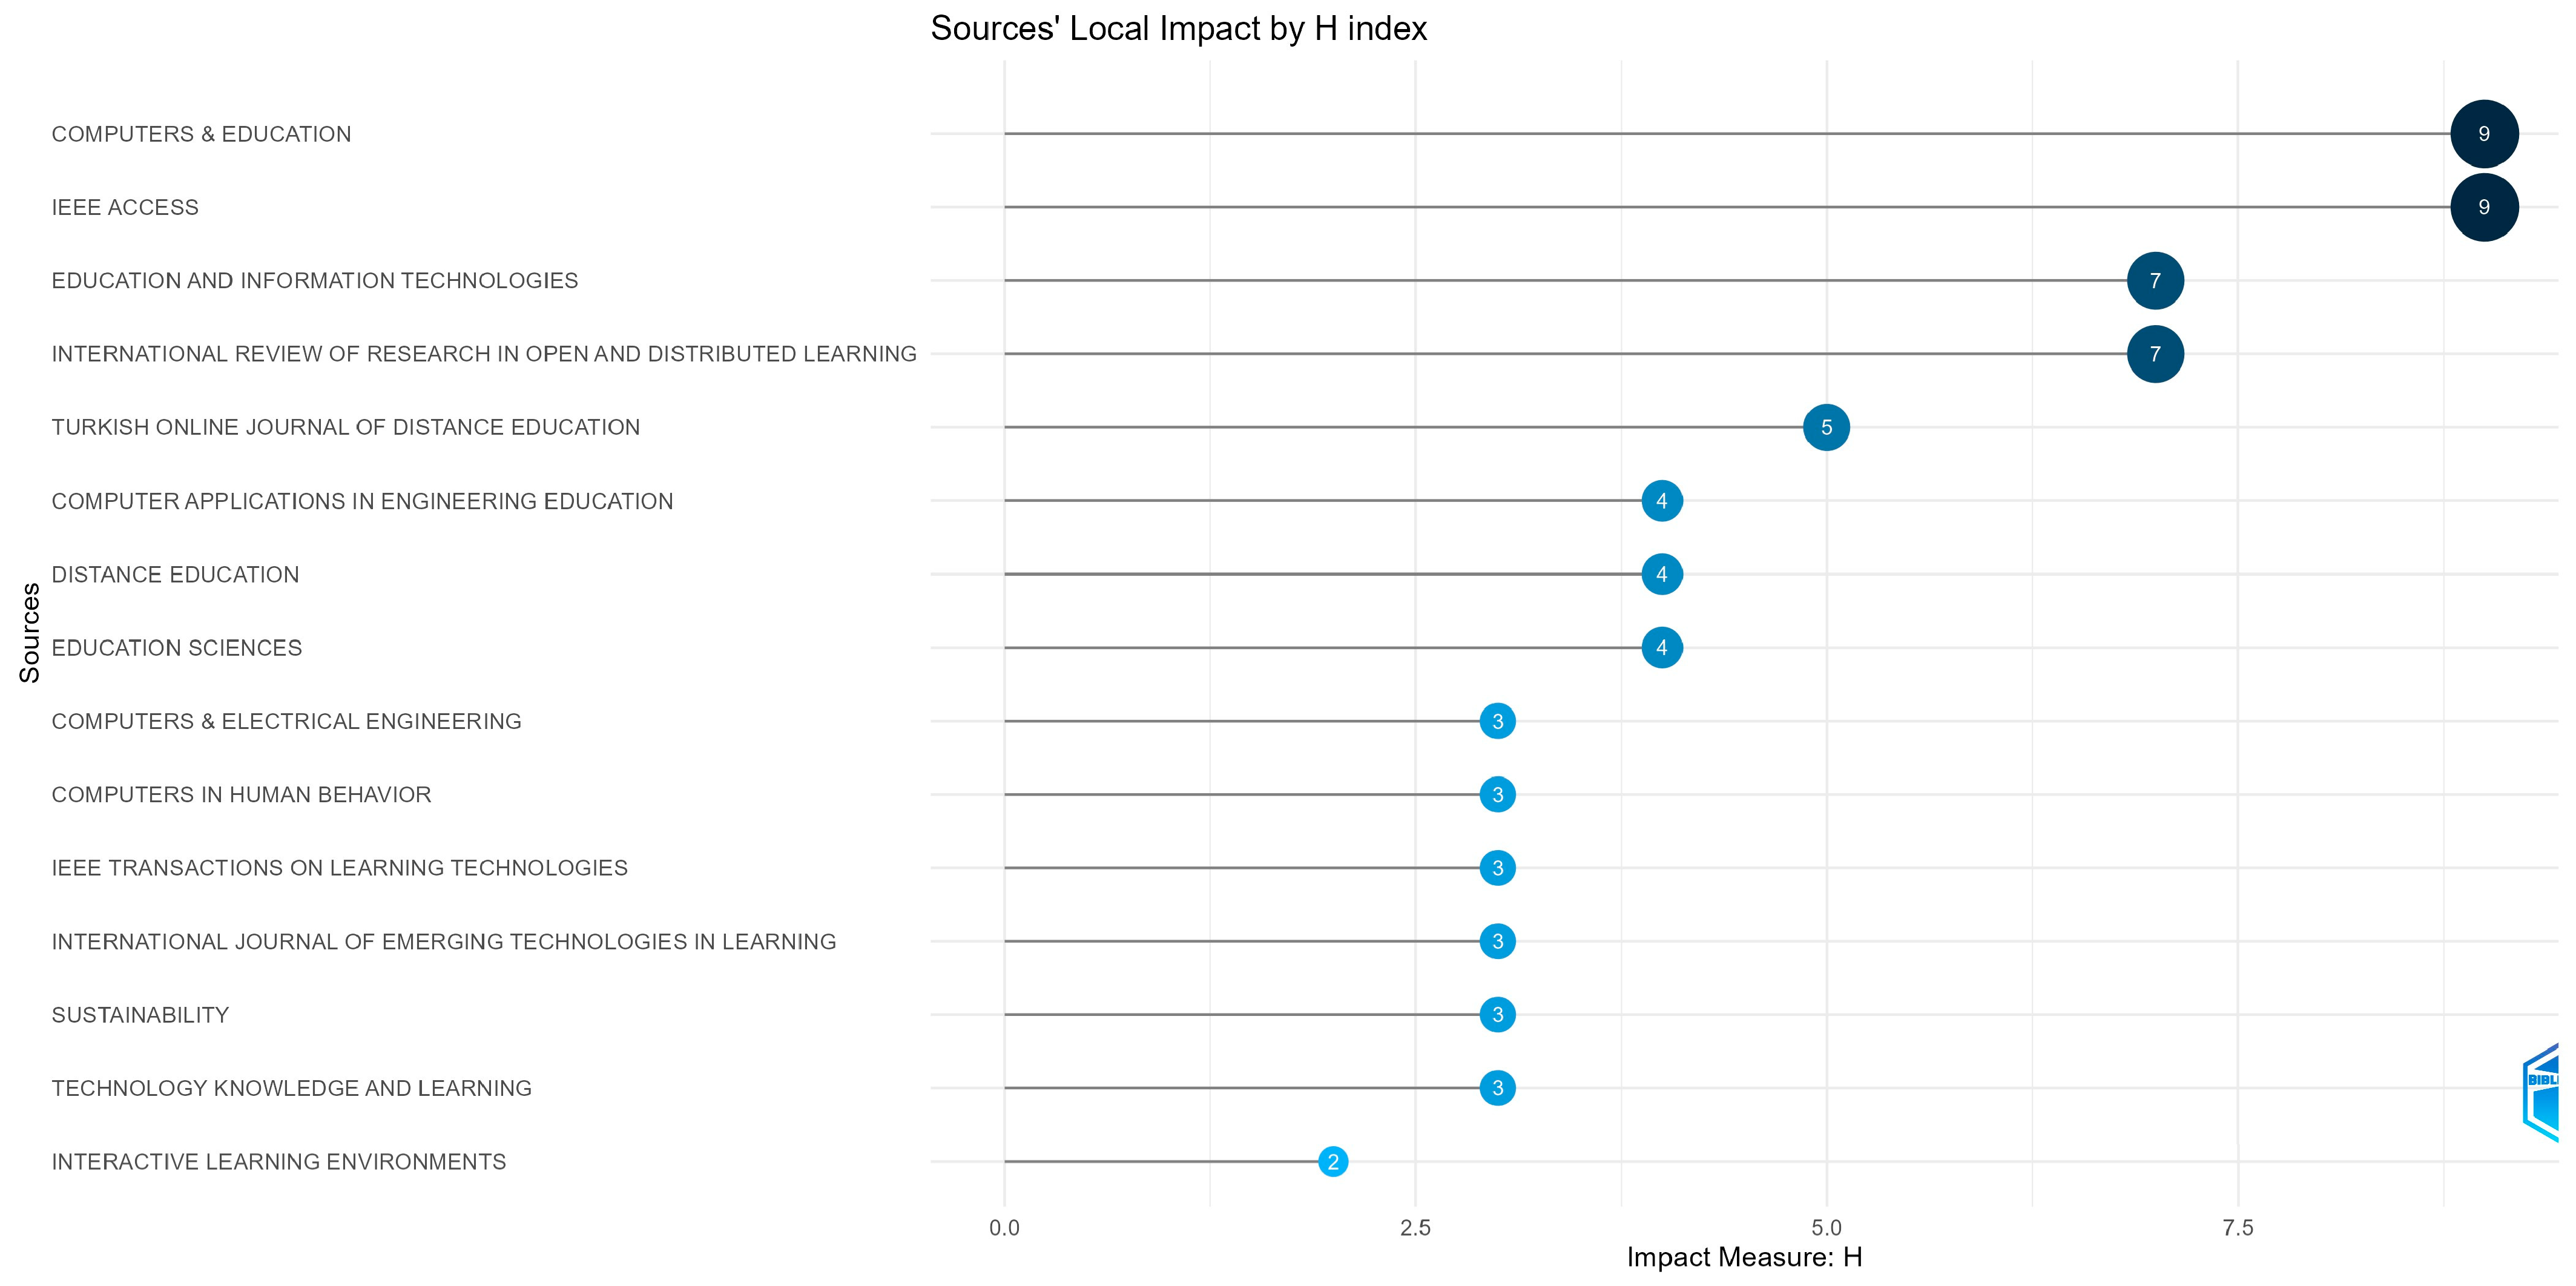
Figure 6 shows that the top two ranked journals, “Computers & Education” and “IEEE Access”, both have an H-index of 9. Most of the journals depicted in the figure also appear in both the core field identified by Bradford’s law (Figure 5) and the list of most relevant journals (Figure 4).
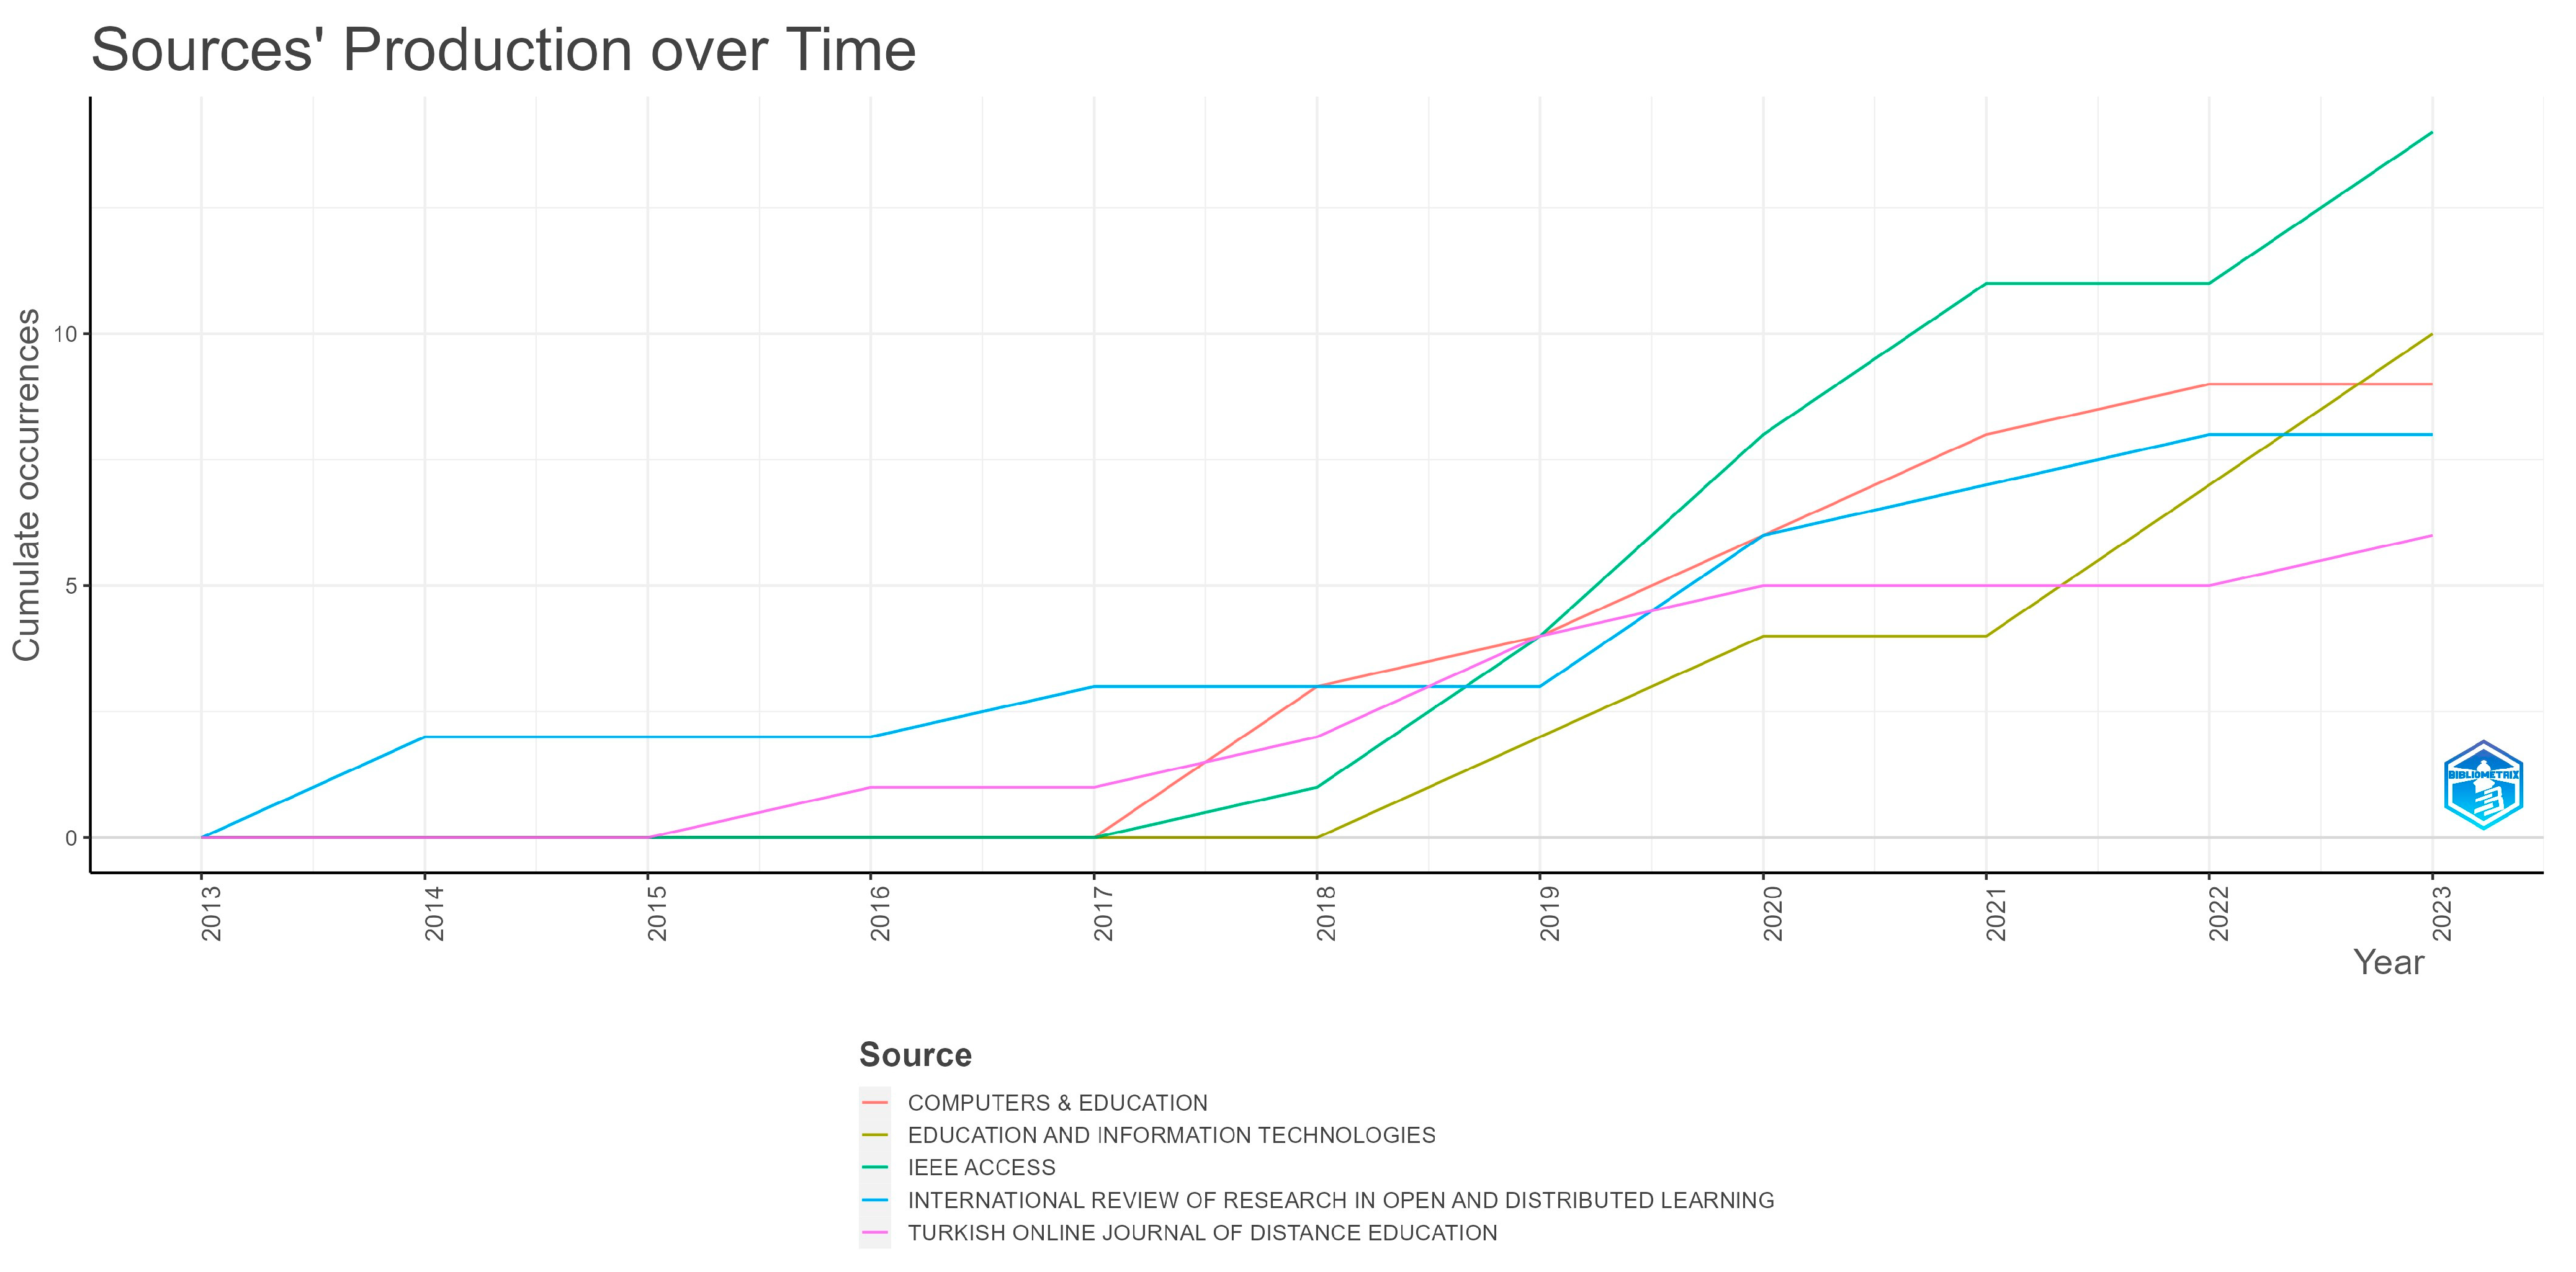
To provide a clearer picture of the most frequently cited publications by authors studying MOOC dropout, Figure 7 illustrates the scientific output over the years for the top 5 journals identified as favorites (Figure 4).
In 2013, none of these journals published articles in the analyzed field. It was not until 2014 that “International Review of Research in Open and Distributed Learning” published two articles. As anticipated, despite its first publication appearing in 2018, “IEEE Access” has the highest number of publications throughout the analyzed period.

3.3. Authors

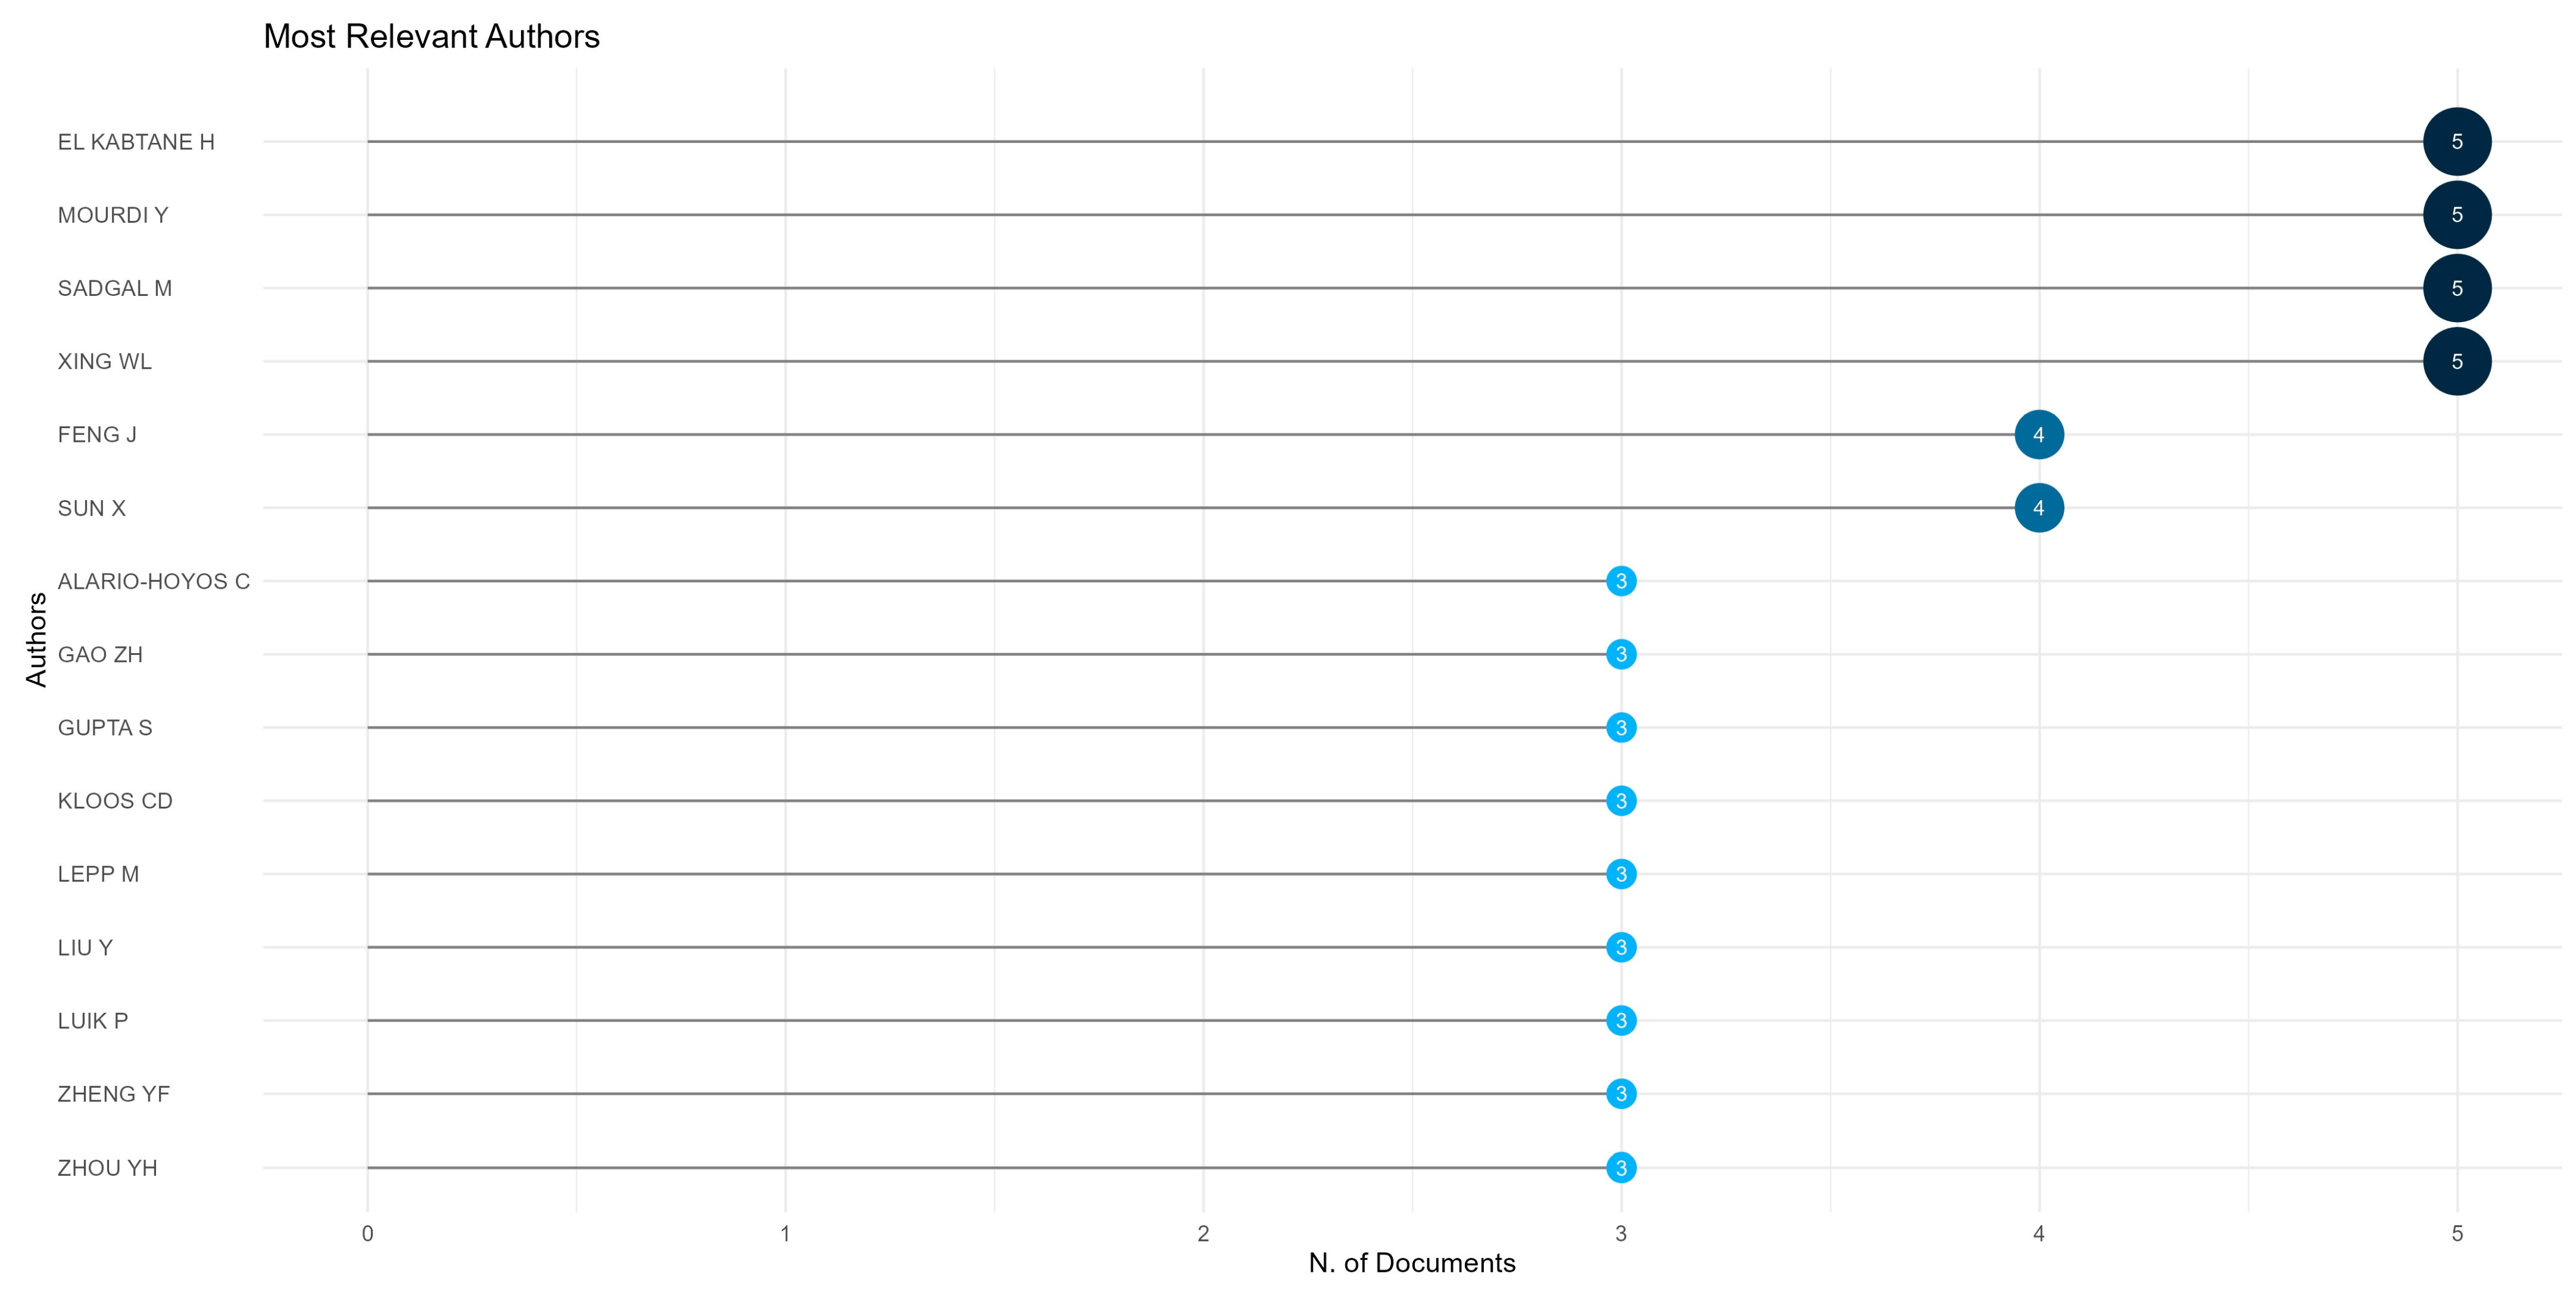
Figure 8 identifies the top 15 authors based on the number of articles published on MOOC abandonment. Among them, four authors (El Kabtane H, Mourdi Y, Sadgal M, and Xing WL) have each published five papers, while two authors (Feng J and Sun X) have published four papers each, and the remaining nine authors have each published three papers. With a total of 193 articles in the dataset, the combined scientific output of the top four authors accounts for 10.36% of the total number of selected articles.
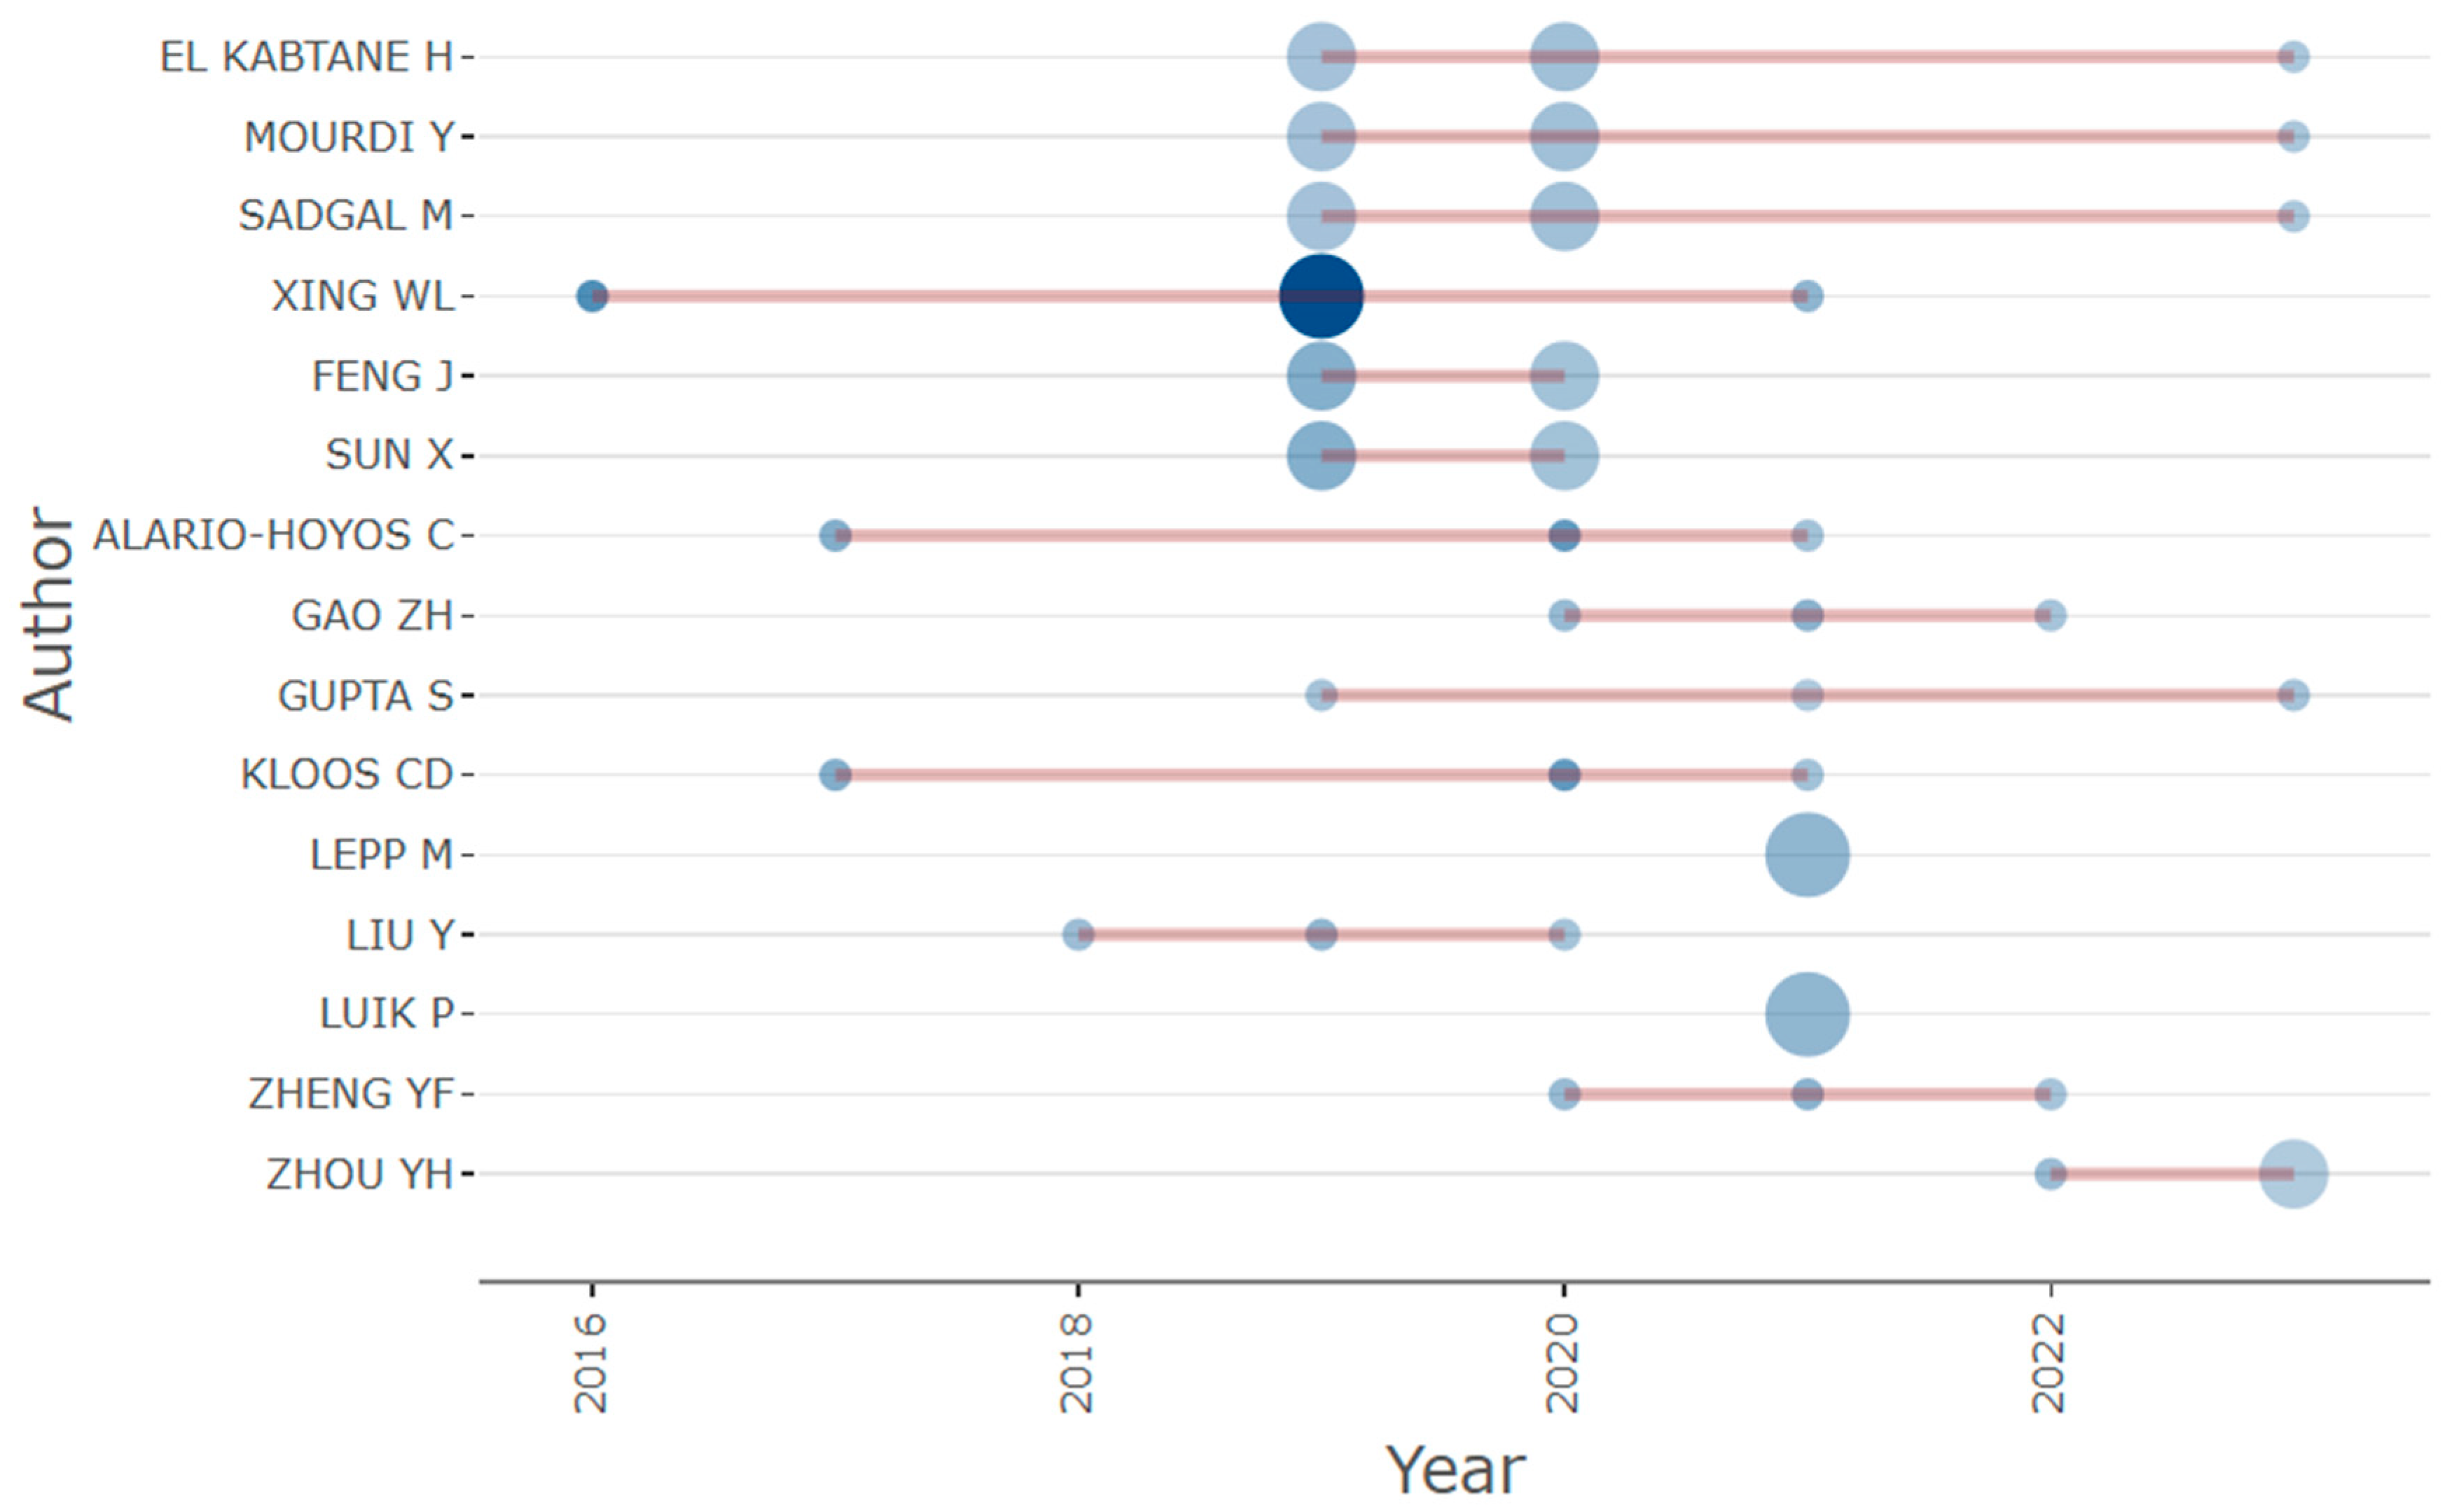
Figure 9 illustrates the scientific output of the top authors from 2016 to 2023. The graph shows that 2019 was a particularly fruitful year for dropout research, with the top five authors (El Kabtane H, Mourdi Y, Sadgal M, Feng J, and Sun X) each publishing two papers, while Xing WL published three papers. This increase aligns with the observed rise in annual scientific output seen in Figure 2, which began to accelerate around 2016 and peaked in 2019.
Table 7 presents the top affiliations of authors based on the number of articles published. “Beijing Normal University” from Beijing and “Cadi Ayyad University of Marrakech” from Morocco occupy the first two positions, with 11 and 6 published articles, respectively, followed by other prestigious institutions. Although only 3 universities appear in the top 15 affiliations—“Abdelmalek Essaadi University of Tetouan”, “Chulalongkorn University”, and “Nanjing Agricultural University”—a total of 14 universities have each published three articles. These include “National Taiwan Normal University”, “Smithsonian Astrophysical Observatory”, “Smithsonian Institution”, “University of California, Berkeley”, “Yeungnam University”, “Amity University Uttar Pradesh”, “Beijing Information Science and Technology University”, “Egyptian Knowledge Bank (EKB)”, “Open University Netherlands”, “Tecnologico de Monterrey”, and “University of Tartu”. Overall, 37.82% of the total number of papers included in the dataset belong to the top 15 universities listed in Table 7.
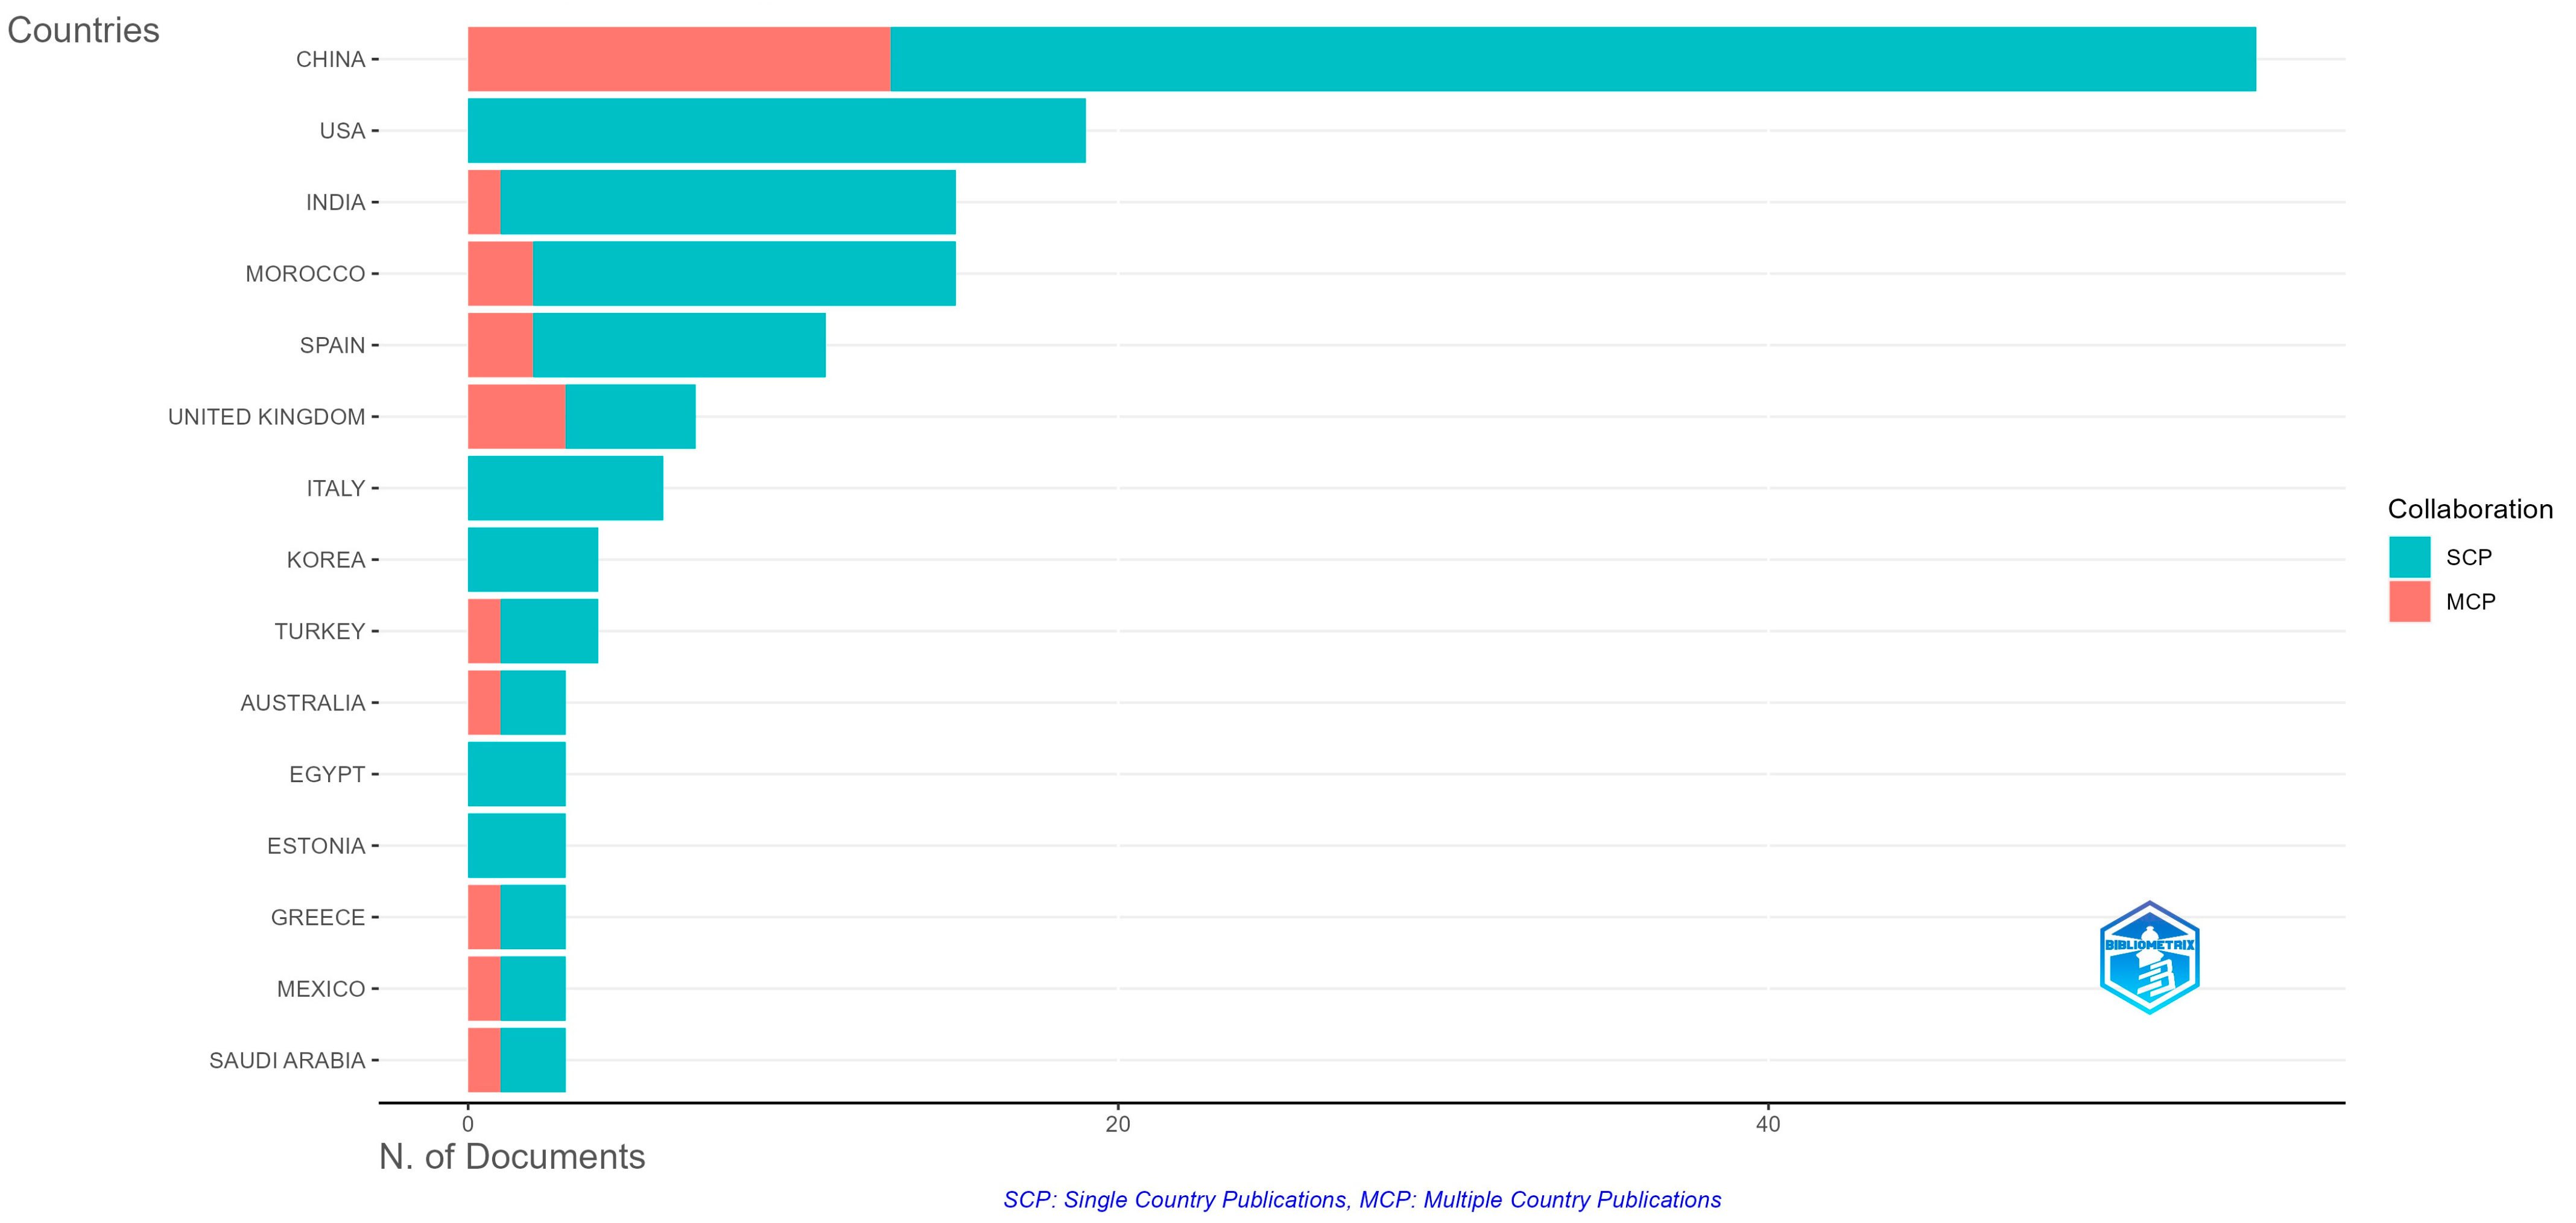
Figure 10 illustrates the country of origin for each author, along with the SCP (Single-Country Publication) and MCP (Multiple-Country Publication) indexes. According to the graph, China leads with the highest number of published articles, totaling 55, which represents 28.5% of the dataset. Of these, 42 articles are indicated by the SCP index, while 13 are noted by the MCP index, reflecting a tendency for more internal collaboration within China. Following China, the USA has 19 published articles, all classified under SCPs, with an MCP value of 0, indicating that these articles were published within the country only. The same pattern is observed for Italy, Korea, Egypt, and Estonia.
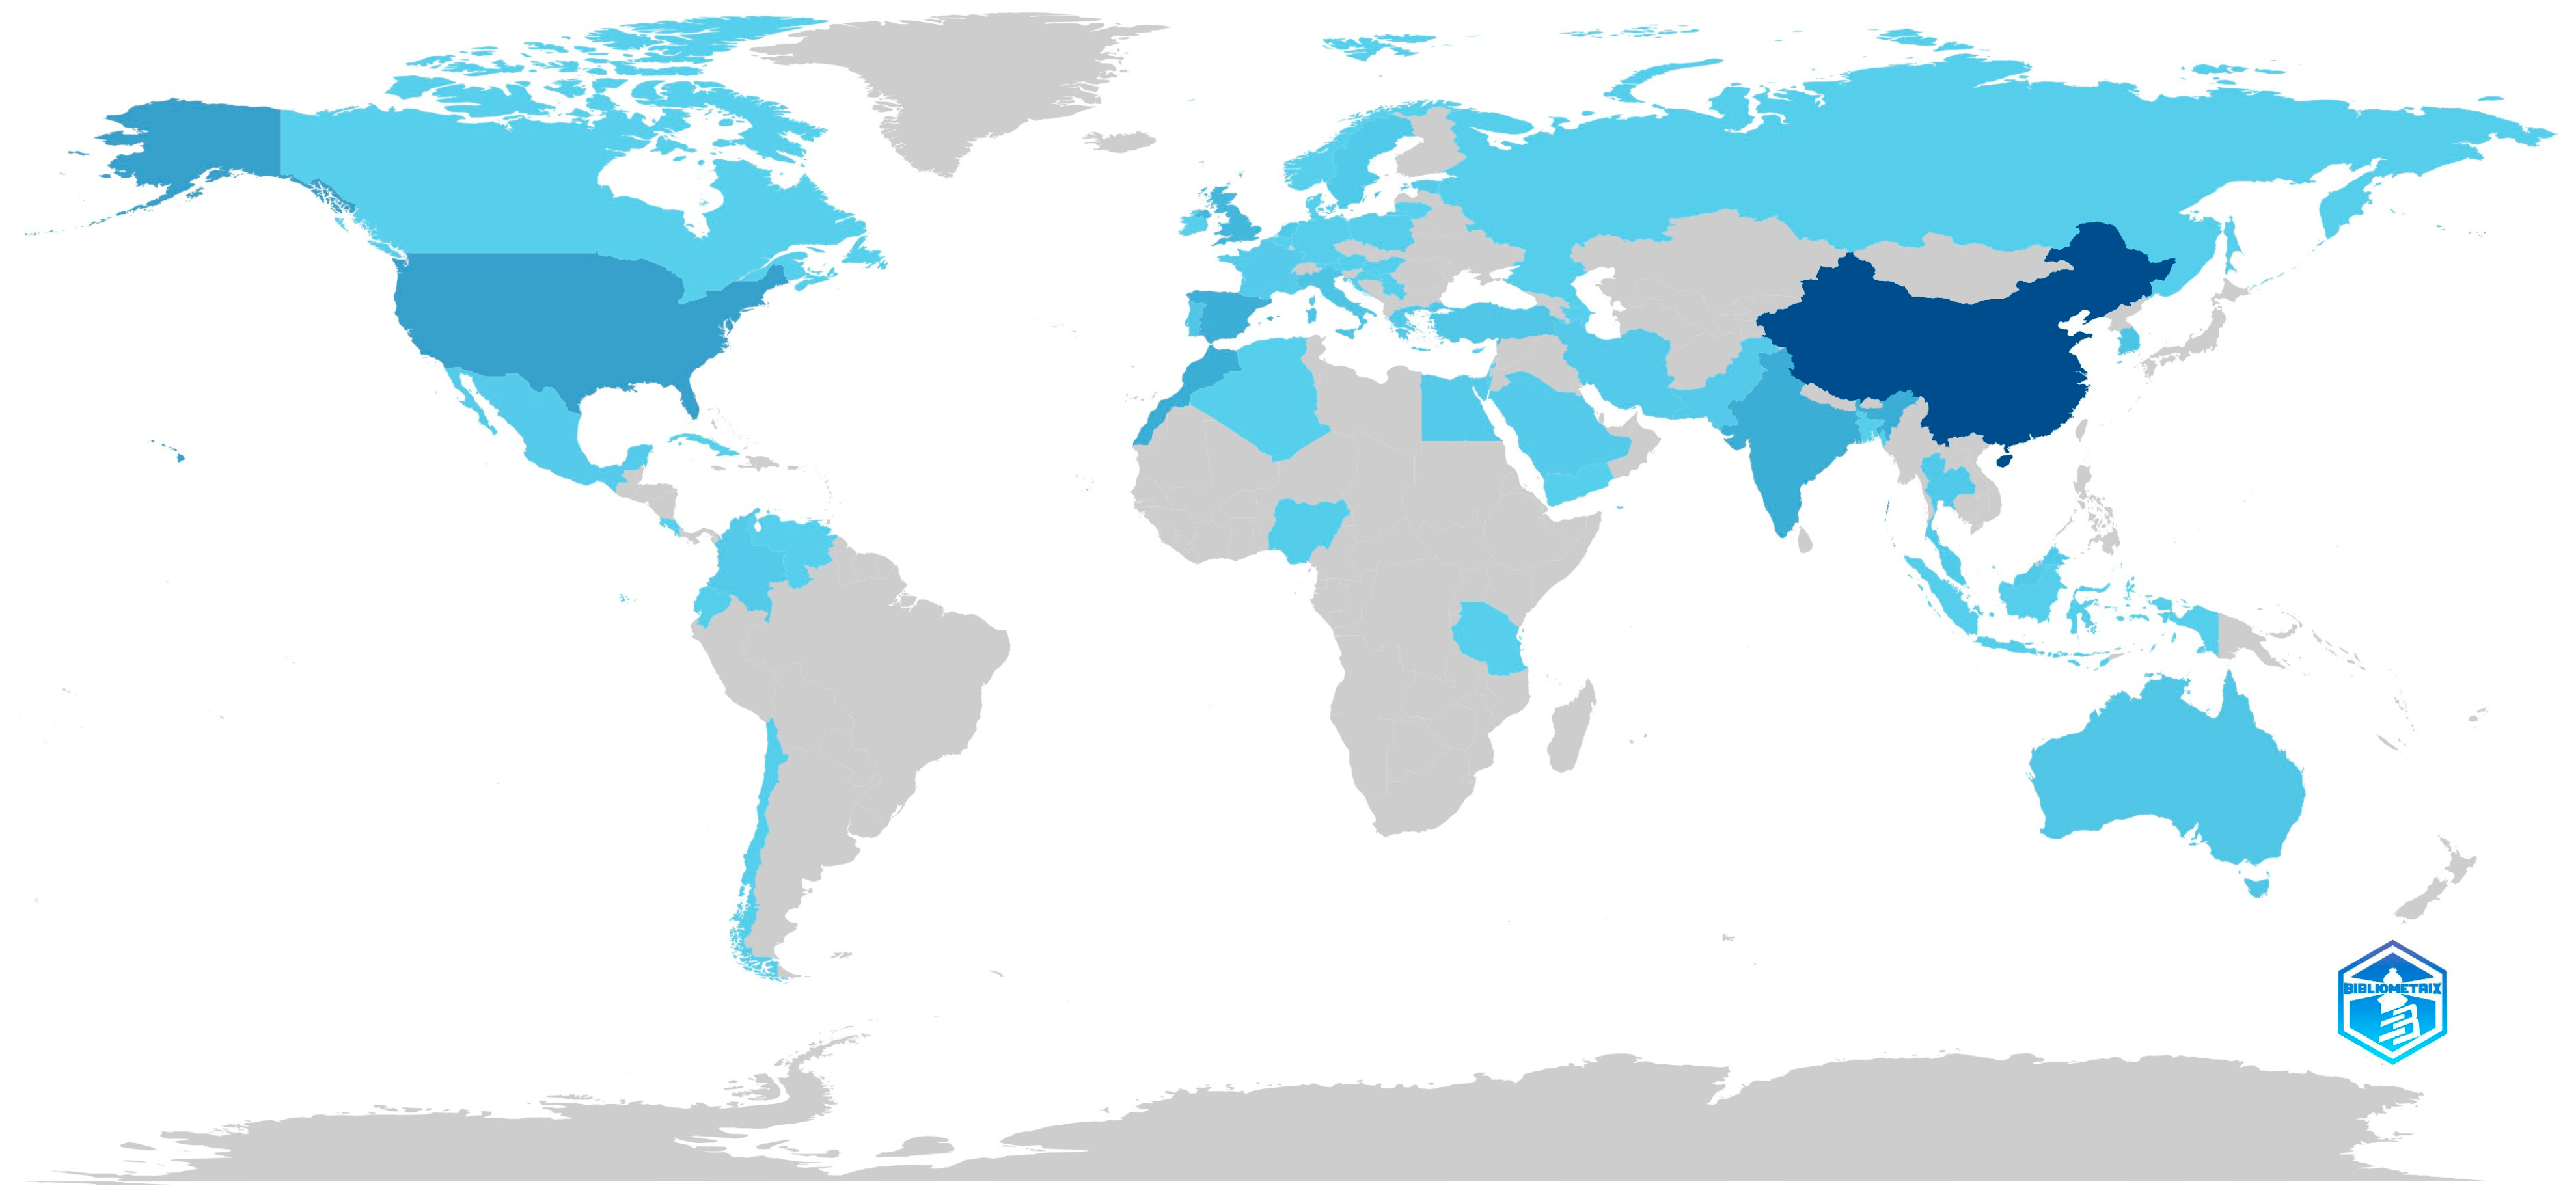
Figure 11 depicts the scientific output by country, with color intensity increasing from light blue to dark blue to represent higher contributions, and with gray areas representing no contribution.
As anticipated from previous analysis, China leads with the highest number of papers, totaling 113. Tan and Tasir [88] observed a substantial increase in MOOCs in China over the past two decades, attributed to the large population and a strong emphasis on education. Ma and Mendez [89] noted that China launched its first comprehensive MOOC platform in 2013, with many others following. The COVID-19 pandemic further boosted MOOC platforms in China, resulting in increased courses and learners. In 2022, China’s Ministry of Education initiated “China’s Smart Education”, consolidating all MOOC platforms under a single website.
Following China, the USA has a notable output with 40 papers, while India and Morocco each have 30. Spain has 28 papers, the UK has 21, and Italy and South Korea each have 10. Australia, Portugal, and Turkey each have eight papers.
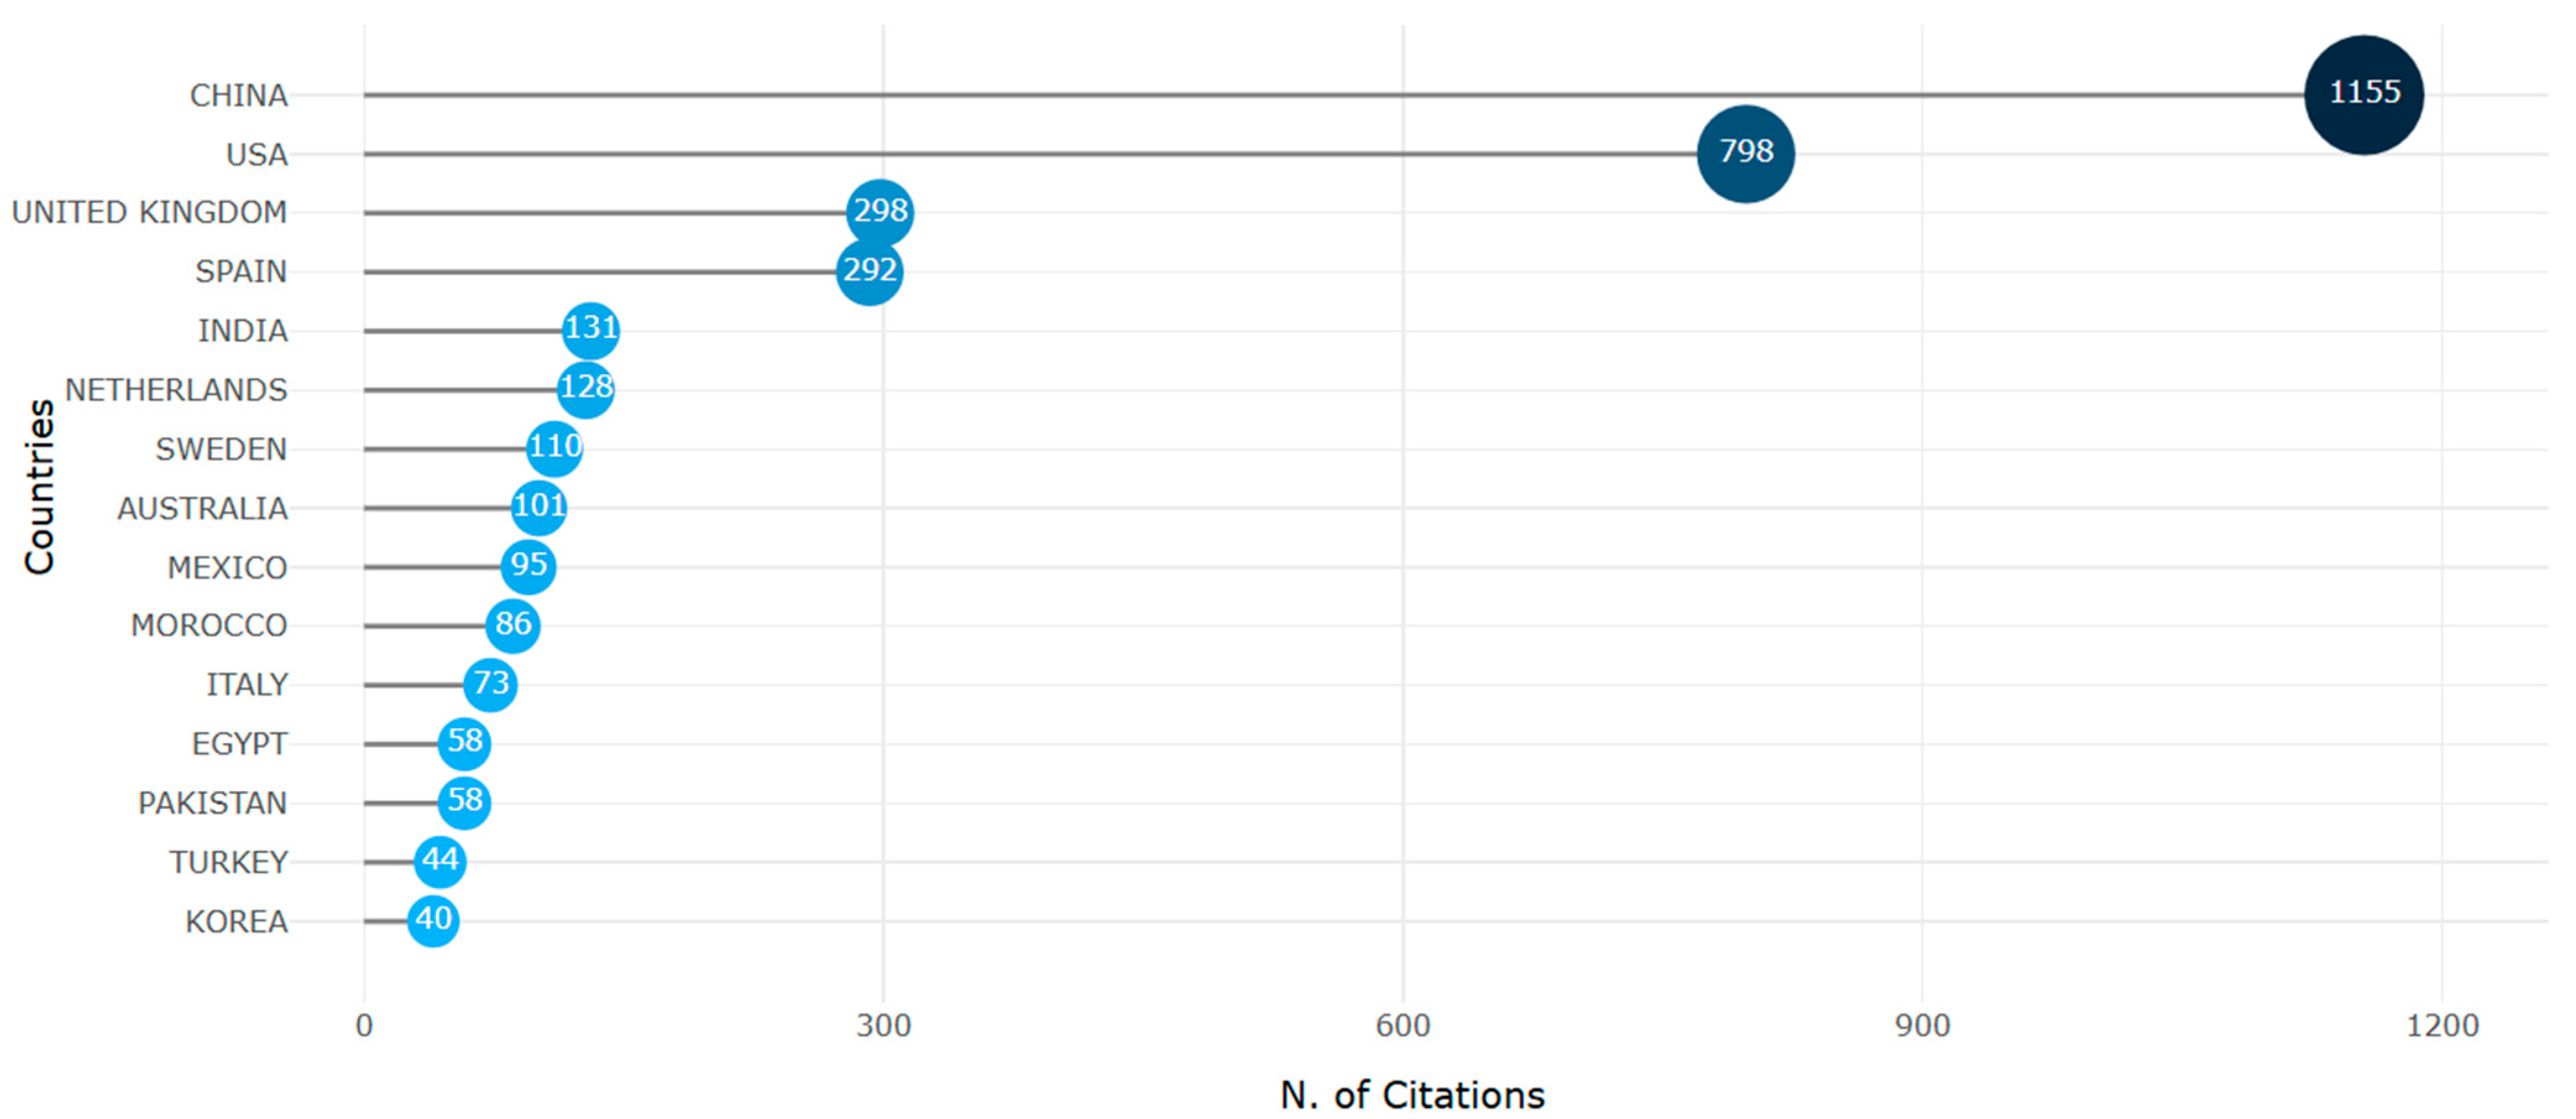
Figure 12 illustrates the number of citations by country. China leads with 1155 total citations (TCs), followed by the US with 798, the UK with 298, and Spain with 292. The remaining countries in the top 15 have a TC value below 200.
The Netherlands tops the list with an average of 64 citations per article, followed by the UK with 42.60, the US with 42, Sweden with 36.7, Australia with 33.7, and Mexico with 31.7. Other countries in the top 15 have average citations per article below 30.
Figure 13 displays a map of international collaborations between countries. It should be noted that the countries with contributions in this area, measured by the number of publications, are marked using various shades of blue, with dark blue representing the highest number of contributions, while the countries with no contributions are marked in grey. Furthermore, the lines in red depict the collaborations among countries, while the size of the line characterize the number of collaborations. China leads with the highest number of collaborations, engaging with 12 countries: Ecuador, Australia, Bangladesh, Indonesia, Korea, Saudi Arabia, Singapore, Spain, Tanzania, the United Kingdom, the USA, and Yemen. The most frequent collaborations were with Australia and the USA (five times each) and with Spain (three times). The UK collaborated with seven countries: Azerbaijan, Hungary, Ireland, Malaysia, the Netherlands, Saudi Arabia, and Sweden, with the highest frequency being two collaborations, which were with Malaysia. The USA engaged with five countries: Australia, Canada, Indonesia, Mexico, and Tanzania, with each collaboration occurring once.
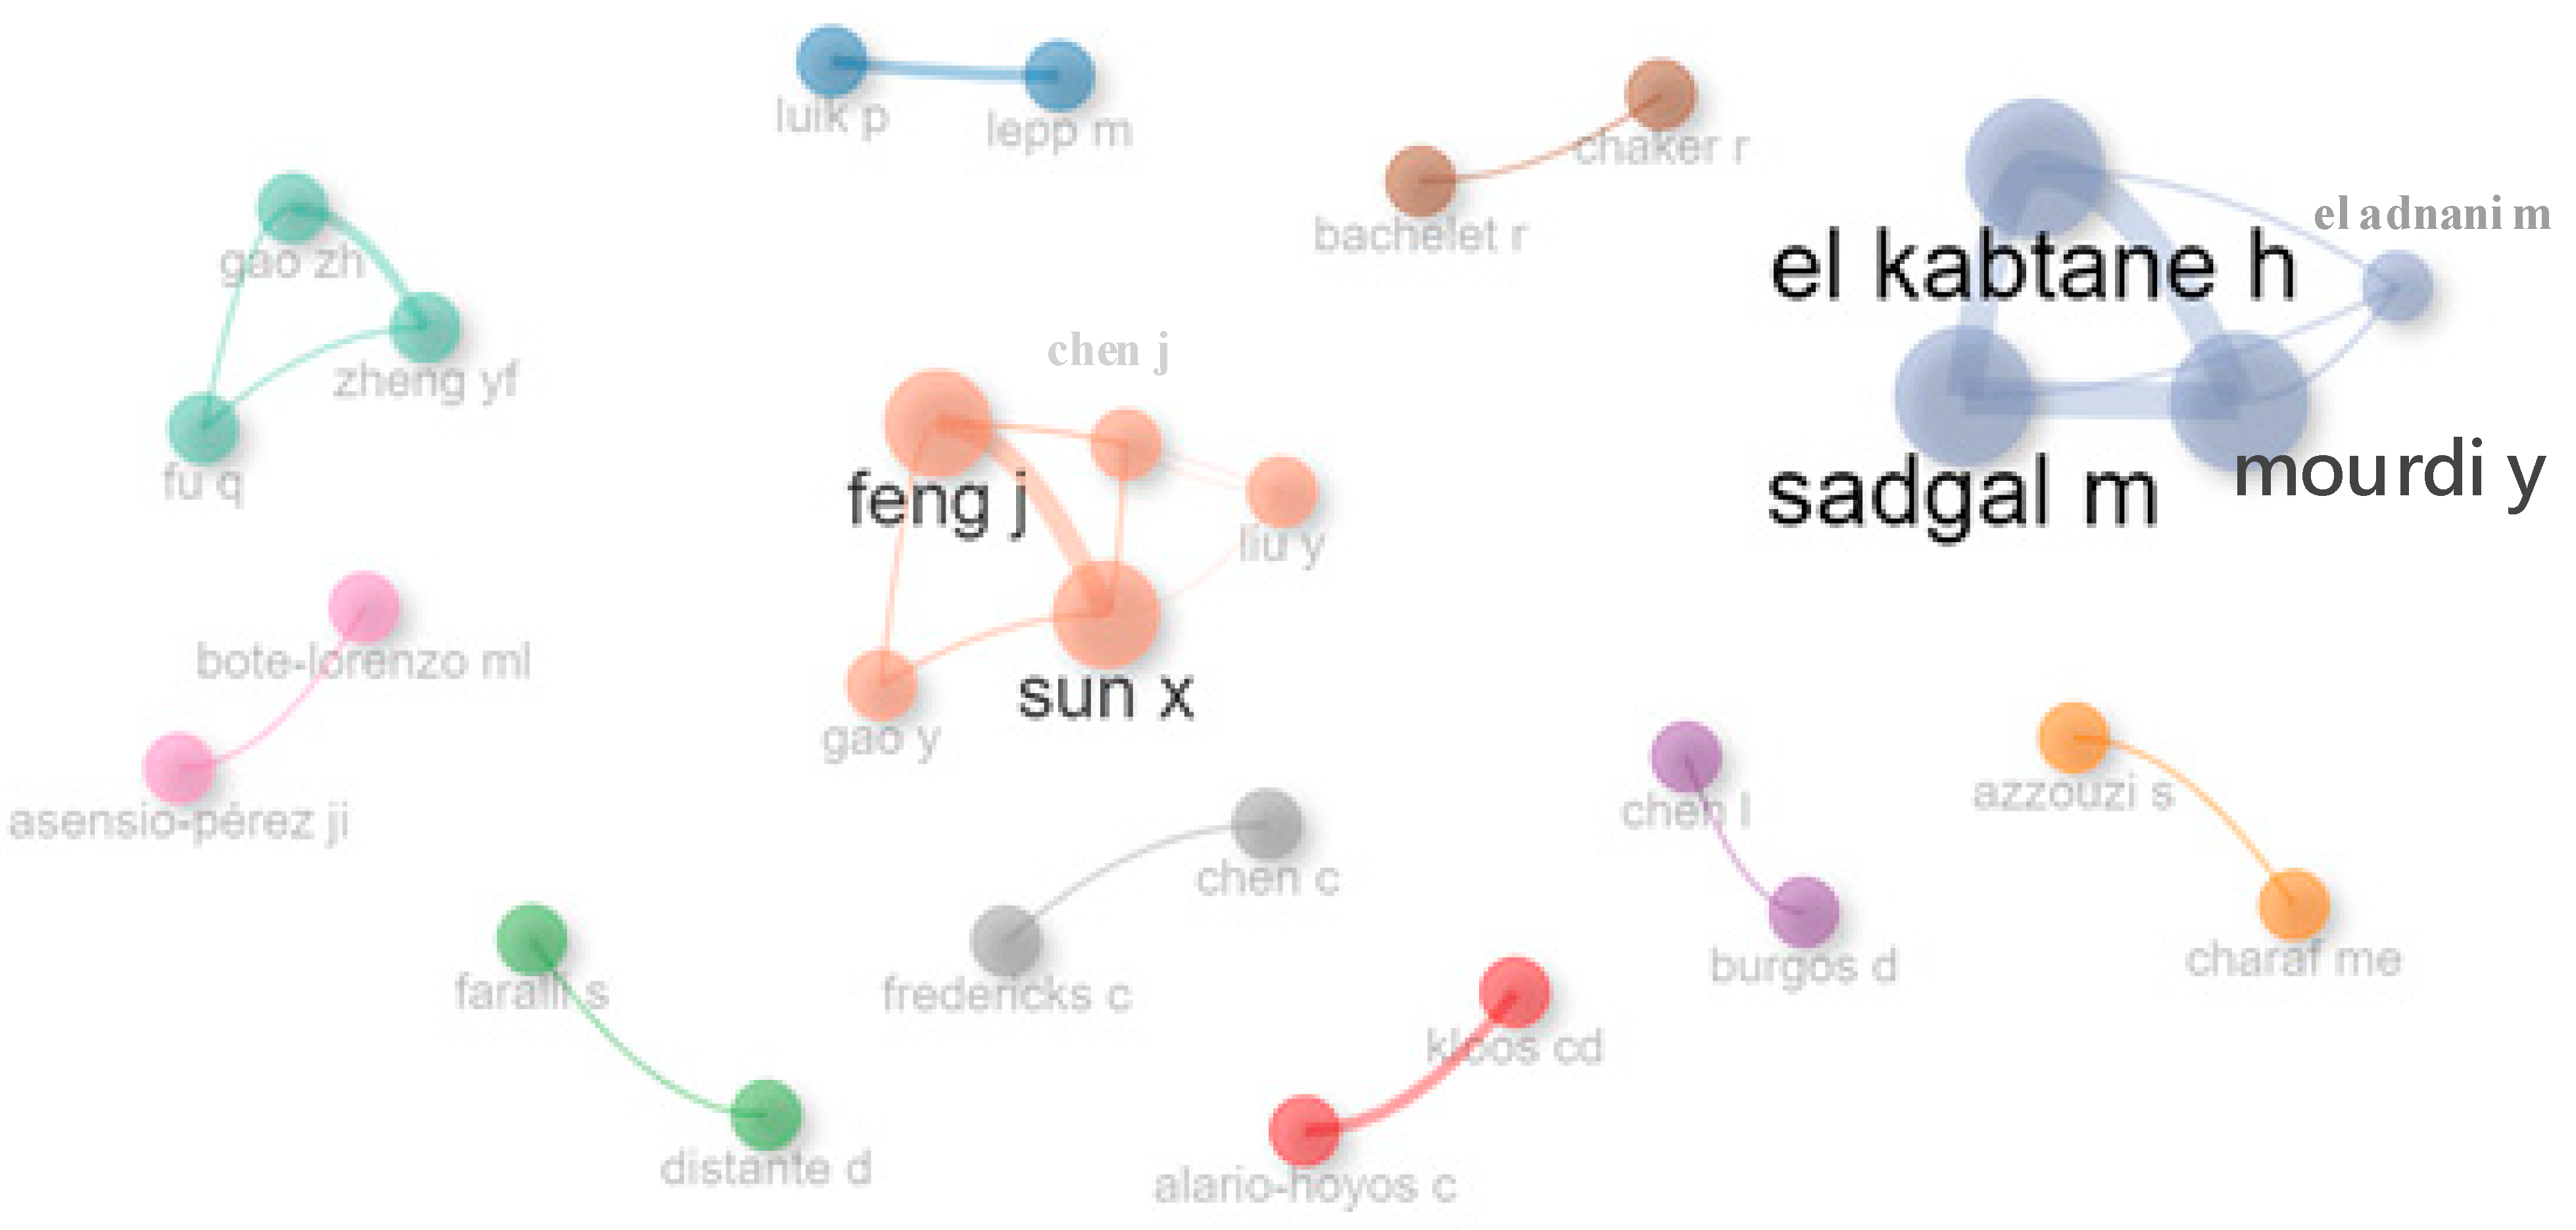
To be able to even better observe the existing collaborations between authors, Figure 14 is attached, representing the collaboration network of the top 40 researchers (being divided from Cluster #1 to Cluster #11). Even though the top 40 were chosen to be displayed, there are authors whose research has no correspondences with other researchers, as well as a setting that does not illustrate isolated nodes. This is why only 28 authors are shown in the figure below.
The obtained clusters consist of two to five authors each. Each cluster includes the following:
  • Cluster #1 (in red): This consists of Alario-Hoyos C and Kloos CD. These two researchers have focused on analyzing how self-regulated learning strategies (SRLs), particularly event-driven and self-reported SRLs, can be integrated into predictive models for self-paced MOOCs [90]. The authors have also investigated the relationships between SRLs and the information obtained from MOOC learners [91].
  • Cluster #2 (in blue): This consists of Lepp M and Luik P. They investigated performance metrics recorded before dropout and identified periods with the highest dropout rates in MOOCs dedicated to computer programming [92]. Using non-parametric tests and descriptive statistics, they analyzed performance in assessments of those who did not complete the courses, those who completed, and those who managed to complete based on involvement or difficulty [93].
  • Cluster #3 (in green): This contains Distante D and Faralli S. This cluster of authors focused on both literature reviews and research related to predicting student dropout using machine learning algorithms [94,95].
  • Cluster #4 (in purple): This includes Burgos D and Chen L. These researchers described the emergence and development of MOOC platforms over time [96], and analyzed the types and amount of support participants receive during courses, based on 14 MOOC platforms and 621 courses in China [97].
  • Cluster #5 (in yellow): This cluster consists of Azzouzi S and Charaf ME. They used optimization algorithms such as ant colony optimization, recurrent neural networks, and classification algorithms to create predictive models aimed at optimizing courses to prevent dropout [98,99].
  • Cluster #6 (in brown): This cluster includes Bachelet R and Chaker R. They employed structural equation modeling and path analysis to investigate causal links between theoretical self-experience, MOOC learning outcomes, and social intentions [100].
  • Cluster #7 (in pink): This consists of Asensio-Pérez JI and Bote-Lorenzo ML. They examined learners’ motivation to participate in MOOCs, focusing on the effects of redeemable tokens or rewards on dropout behavior [101,102].
  • Cluster #8 (in gray): This contains Chen C and Fredericks C. This cluster of authors analyzed how course completion is impacted by students’ misconceptions about the course material [103] and dropout rates related to chapter transitions, using disjoint survival analysis [16].
  • Cluster #9 (in turquoise): This includes Gao ZH, Zheng YF, and Fu Q. They addressed topics such as MOOC dropout prediction using convolutional neural networks, bidirectional short-term memory networks, and deep fusion models [104,105,106];
  • Cluster #10 (in orange): This is the largest cluster, consisting of Feng J, Sun X, Liu Y, Chen J, and Gao Y. The authors focused on developing a new algorithm combining extreme learning machines and decision trees for more accurate dropout predictions [107], creating a hybrid neural network for selecting posts needing immediate teacher attention [108] and developing a parallel neural network for grouping MOOC forum sentiments [109].
  • Cluster #11 (in navy blue): This is the second largest cluster, made up of El Kabtane H, Mourdi Y, Sadgal M, and El Adnani M. The research conducted by the authors included predicting learner behavior leading to dropout [27,110], creating individual learner behavior profiles throughout courses [25] and incorporating online manipulations into MOOCs [28].

3.4. Analysis of the Literature

This section first presents the top 10 most cited articles, detailing the number of authors, the data used, the objectives, the total number of citations, and the methods employed. Additionally, a summary of each article is provided to illustrate how MOOC dropout rates were analyzed. In the latter part of the section, a comprehensive word analysis is conducted.

3.4.1. Top 10 Most Cited Papers—Overview

The most globally cited paper, authored by Xing et al. [111], as shown in Table 8, was published in Computers in Human Behavior. The paper has four authors and has garnered 157 total citations (TCs), with an annual average of 17.44 citations per year (TCY), and a normalized total citation (NTC) score of 2.93. The NTC is calculated by dividing the total number of citations (TCs) by the average number of citations per article published in 2016, which was 53.58. The NTC indicator reflects the relative impact of a paper in comparison to others published in the same year [112]. Based on this metric, the work of Xing et al. [111] was cited 2.93 times more frequently than the average for papers in the dataset.
The second most globally cited paper, authored by Dai et al. [113], and published in Computers & Education, has accumulated 147 total citations (TCs). Notably, it surpasses the first-ranked paper in both annual citation rate, with an average of 29.40 citations per year (TCY), and normalized total citations (NTCs), achieving a score of 6.10, calculated by dividing the 147 total citations by the 24.11 average citations per article in 2020. In third place is a paper published in the Journal of Educational Computing Research [114], with 133 total citations, while the fourth-ranked paper, published in Computers & Education [115], has registered 124 total citations.
Compared to the top four papers, the remaining articles among the most globally cited have fewer than 100 total citations (TCs). Nevertheless, all of these papers have accumulated more than 78 citations, with an annual average of over 10 citations per year (TCY) and a normalized total citation score (NTC) exceeding 1.5. This suggests that these works have provided a foundational basis for significant subsequent analyses in the field of dropout research.

3.4.2. Top 10 Most Cited Papers—Review

This section presents the abstracts of the top 10 most globally cited papers to examine the authors’ approaches to MOOC dropout, the techniques employed, and the results obtained.
The paper by Xing et al. [111] analyzes high dropout in MOOCs and proposes a predictive model for the early identification of students at risk of dropping out. It focuses on learners who are active on forums, considering that they are more likely to complete the course if they receive adequate support. This study uses temporal modeling, combining historical data with current week data, considering that a student’s inactivity actually represents their dropout by taking social interactions into account as well, and applies principal component analysis (PCA) to determine the optimal time to exclude prior information. It also uses a stacking technique to improve the robustness and accuracy of the predictions. Through the results obtained, it was deduced that this method is more efficient than traditional models and provides instructors with a useful technique for targeted interventions, thus contributing to an increase in the retention rate in MOOCs.
In contrast to other studies, Dai et al. [113] focused on identifying the factors that influence learners to persist with MOOCs. Their paper aims to explore the roles of learning, technology, and teaching in this complex process. As an analysis technique, they modified the Expectancy Confirmation Model, incorporating the affective and cognitive variables of ‘attitude’ and ‘curiosity’ to capture both past reflections and future expectations. Two-step structural equation modeling was employed to analyze the interconnectedness and multiple dependency relationships, while confirmatory factor analysis was used to assess validity and reliability. Based on data from 192 Chinese students who completed a survey, the model was found to explain 48% of participants’ intentions to continue with MOOCs, with both newly introduced variables proving significant. Based on the literature review, the researchers start from several hypotheses in which they use the following as influencing variables: confirmation, satisfaction, attitude, curiosity and perceived usefulness. The study shows that although curiosity influences learners’ intention to continue, attitude plays a more important role. To improve retention, interventions should focus on shaping learners’ attitudes. Additionally, instructors should avoid overemphasizing the benefits of MOOCs to prevent negative impacts on learner satisfaction and attitudes.
The study by Xing and Du [114] focuses on a MOOC course hosted on the Canvas platform, which began in August 2014 and lasted eight weeks. The course comprised 11 modules, 14 discussion forums, and 12 multiple-choice quizzes, with a total enrollment of 3617 students. The dataset used in this research was sourced from two main areas: clickstream data from Canvas, which tracked student activity on the platform, and data on discussion forums and quiz scores, extracted via the Canvas API. Utilizing deep learning techniques, along with K-nearest neighbors, support vector machines, and decision trees, the study aimed to optimize a model for predicting MOOC dropout, with a focus on personalizing interventions for at-risk students. The model developed in the study estimates the dropout probability for each individual student. Based on the number of views of announcements, calendar, gradebook, homework, module pages, quizzes, etc., by students not enrolled in the MOOC, the researchers propose as a strategy the use of the prediction model developed to provide teachers with a technique to intervene in time to stop dropout.
The study by Tsai et al. [115] examines the challenges of MOOCs in online teacher training, specifically focusing on the high dropout rates and the low intention of learners to continue their studies. The researchers proposed a model that integrates metacognition and learning interest, drawing on data from 126 respondents. To analyze the data, confirmatory factor analysis and structural equation modeling were employed to test the relationships between variables, starting from different claims that metacognition is influenced by liking, enjoyment and engagement. The results indicated that metacognition positively correlates with the three levels of interest which in turn significantly influence learners’ intention to continue using MOOCs. The study suggests that improving metacognitive skills may foster greater engagement and persistence in online learning, thus supporting the development of effective teacher training programs through MOOCs.
The paper by Henderikx et al. [116] proposes an alternative typology for evaluating MOOC success and dropout, incorporating participants’ intentions and subsequent behaviors. Data were gathered through two questionnaires, administered before and after the course, with participants from two MOOCs. The first questionnaire initially had 689 respondents, later reduced to 163, while the second started with 821 respondents, narrowing down to 126. This exploratory study revealed that although the success rates based on course completion were only 6.5% and 5.6%, the success rates from the participants’ perspectives were considerably higher, reaching 59% and 70%. These findings suggest that course completion alone is an insufficient measure of success and highlight the importance of considering participants’ perspectives in evaluating MOOC outcomes. In the paper, the researchers analyze the following as factors related to dropout, the difference between intention and behavior, the definition of success, the level of commitment, the typologies of participants. Thus, they came to the conclusion that for the fight against dropout, it is very important that the perspective of institutional goals be complemented by that of personal goals.
Drawing on data from semi-structured interviews with 34 learners who participated in two MOOCs (18 from ChM001x and 16 from ChM002x), Eriksson et al. [117] employed a qualitative case study approach to analyze learners’ experiences and identify the factors influencing their decision to drop out or continue. The study identified four hypotheses that were found to impact dropout decisions: (1) the learner’s perception of course content, (2) the learner’s perception of course design, (3) the learner’s social situation and characteristics, and (4) the learner’s ability to manage time effectively. Under the first hypothesis, factors such as motivation and course difficulty were highlighted. The second hypothesis revealed discouragement stemming from poorly designed tasks. The third hypothesis identified external and socio-economic factors, as well as personality traits, while the fourth hypothesis focused on time management challenges and study techniques. Moreover, through in-depth interviews, high workload, lack of time, lack of awareness or pressure, social influence and course content were also identified as factors leading to dropout. As strategies, the authors proposed identifying the best times for MOOCs or their duration, and to adapt them according to the learners (in terms of their language knowledge, expectations, etc.).
The study by Aldowah et al. [24] employed a multiple-criterion decision-making method to identify and analyze factors contributing to the high dropout rates in MOOCs. Through a literature review, twelve primary factors, categorized into four dimensions, were identified. These factors were subsequently evaluated by 17 experienced MOOC instructors. The analysis revealed six core factors that directly influence dropout rates: prior experience, social presence, social support, academic skills, feedback, and course design. Additionally, factors such as engagement, interaction, motivation, time management, course difficulty, and personal circumstances were found to have a secondary impact. The study also described the causal relationships among these factors, providing valuable insights for developing interventions aimed at reducing dropout rates in MOOCs. As strategies, the paper offers an important analysis of the identified factors, deducing which are those with a significant influence, thus being able to analyze the respective factors and subsequently to combat dropout. Moreover, the relationships between the primary and secondary factors have a reciprocal effect and are also interdependent.
Almatrafi et al. [19] have identified the challenge of retaining MOOC learners until course completion, particularly due to the high volume of messages on discussion forums that often go unanswered. They considered as an abandonment factor situations in which urgent messages, crucial for learners’ progress, do not receive timely attention, thus having a negative impact on collaborative learning. The study proposes a model designed to identify these urgent messages that require immediate support from coordinators. By using different data mining techniques and feature sets, the research developed a reliable classification model capable of recognizing urgent messages in different MOOCs. The work helps reduce dropout by using the created model, which helps instructors prioritize responses, thus improving learning support.
Sunar et al. [118] investigated the social behaviors of MOOC participants and the impact of their engagement on course completion. The researchers identified the social interactions that exist between learners as a factor increasing course completion rates. An analysis of discussions from a FutureLearn MOOC, which ran for eight weeks and included 9855 learners, showed that following and interacting with other learners significantly increased the likelihood of course completion. These interactions have been identified as key predictors of success in MOOCs. The present work is of particular importance, providing one of the key factors that can reduce MOOC dropout.
Moreno-Marcos et al. [90] observed that many existing predictive models for identifying learners at risk of dropout in MOOCs fail to incorporate complex high-level variables, such as self-regulated learning (SRL) strategies. This paper addresses the limitations of current predictive models, particularly for self-paced MOOCs, where learners can start the course at any time. The variability in start dates and learner engagement makes early predictions challenging. The study investigates how SRLs can be integrated into predictive models by comparing event-based SRLs with self-reported SRLs to assess their impact on dropout prediction. The paper introduces a novel methodology for analyzing self-paced MOOCs, employing a temporal approach to enhance early prediction capabilities. The results indicate that event-driven SRL techniques possess strong predictive power and can effectively forecast dropout even when other data are sparse. The proposed methodology enables reliable predictions from as early as the first 25–33% of the course duration, offering a new approach to identifying at-risk learners in self-paced MOOCs. Researchers bring a new perspective that the best predictors to be analyzed as a strategy to reduce dropout are interactions between participants and exercises within the platform, as well as openness, skimming and completion of the content presented. By constantly analyzing and intervening on low-activity learners, dropout can also be reduced.
A brief summary of the content of the papers discussed above is provided in Table 9.

3.4.3. Words Analysis

This section examines the most frequently used keywords, including both ‘keywords plus’ and authors’ keywords, as well as keyword groups (bigrams or trigrams) in titles and abstracts, to provide a clearer understanding of the research focus.
Table 10 presents the most commonly used ‘keywords plus’ and authors’ keywords. Among the ‘keywords plus’, ‘students’ appears most frequently, with 31 occurrences, reflecting MOOC participants. Other notable terms include ‘engagement’ (19 occurrences), ‘motivation/motivations’ (18/10 occurrences), and ‘performance’ (15 occurrences), which relate to the characteristics and objectives of MOOC enrollees. Additional frequently occurring terms are ‘education’ (15 occurrences), ‘online’ (13 occurrences), ‘model’ (12 occurrences), ‘open online courses’, and ‘participation’ (both with 10 occurrences).
For authors’ keywords, ‘MOOC/MOOCs’ is the most common term with 103 occurrences, followed by ‘dropout’ (19 occurrences) and ‘e-learning’ (9 occurrences), which are central to the dataset. The most frequent keyword groups include ‘massive open online courses’ (21 occurrences), ‘online learning’ (11 occurrences), and ‘distance education’ (9 occurrences). Keywords related to analytical techniques, such as ‘dropout prediction’ (21 occurrences), ‘machine learning’ (20 occurrences), ‘learning analytics’ (11 occurrences), and ‘deep learning’ (10 occurrences), highlight the methods used to investigate dropout.
This research focused on retaining only those word groups related to analytical techniques and factors influencing MOOC dropout, while excluding groups associated with search terms used in paper selection.
Table 11 displays bigrams at both the title and abstract levels. It is noted that some bigrams appear in both categories. For instance, ‘dropout prediction’ appears 29 times in titles and 54 times in abstracts. Similarly, ‘online courses’ occurs 137 times in abstracts and 20 times in titles; ‘machine learning’ appears 43 times in abstracts and 9 times in titles; ‘student dropout’ is found 30 times in abstracts and 11 times in titles; and ‘continuance intention’ appears 24 times in abstracts and 5 times in titles.
Among abstract-level bigrams, ‘dropout rate/rates’ has the highest frequency, with 160 occurrences, highlighting its significance as a central research interest in this field. Other notable bigrams include ‘continuance intention’. Techniques such as ‘dropout prediction’, ‘machine learning’, ‘neural network’ (29 occurrences in abstracts), and ‘data mining’ (5 occurrences in titles) are prominent at both levels, reflecting methods used to analyze MOOC dropout. Additionally, ‘discussion forums’, found five times in titles, frequently appears in the literature as a factor influencing MOOC dropout both positively and negatively.
In realizing a paper related to the field of education, it could have been expected that the main word clusters identified would be related to both ‘dropout rates’ and ‘dropout predictions’. According to the literature, it has been observed that dropout is one of the most adverse and complex events, whether we are talking about its influence on the student or on the institution [119]. As the identification of predictive factors or patterns, involving consistent datasets and the need to create the most appropriate models, groups of words such as ‘machine learning’, ‘neural network’ or ‘deep learning’ or ‘data mining’ are normally among the most common ones, and researchers often use them in their analysis.
Over the years, there have been numerous researchers who have tried to realize these predictions using different techniques or combinations. Lykourentzou et al. [120] have combined, for the prediction of e-learning course dropout, three different machine learning techniques: support vector machines, feed-forward neural networks and the simplified fuzzy probabilistic ensemble ARTMAP; another example is represented by Lee and Chung [121], who used synthetic minority oversampling and ensemble methods in machine learning, as well as precision–recall curves and ROC (receiver operating characteristic) curve evaluation in order to predict dropout.
Table 12 provides an overview of the 10 most common trigrams at both the title and abstract levels. At the abstract level, ‘online courses MOOC/MOOCs’ is the most prevalent trigram, appearing 97 times. In the category of analytical techniques, ‘dropout prediction model’ appears 12 times in abstracts and 2 times in titles, while ‘student dropout prediction’ is present 6 times in both categories, indicating its significance as a common method for analyzing MOOC dropout.
Other notable trigrams include ‘convolutional neural network/networks’, which appears 16 times in abstracts and 2 times in titles. Additionally, ‘neural network model’ is found 6 times in titles. The trigram ‘Chinese university students’ is noted with 2 occurrences. This observation aligns with the high citation rate from China (Figure 12) and the significant scientific output from Chinese researchers (Figure 10).

3.5. Mixed Analysis

This section presents a mixed analysis using various techniques to examine the correlations between different categories, track their evolution over time, and identify emerging areas of focus for future research.
The thematic map was chosen for this analysis in order to be able to infer the relevance of the theme and its development, each bubble in the figure helping to identify those words or groups of words at the level of the authors that have a high frequency of occurrence, their position being also representative [122]. Factor analysis is relevant because it helps to observe both the areas of interest and the research topics; this representation facilitates the way in which keywords are related to different concepts in the literature [123]. Moreover, both the thematic evolution and the three-fields plot have a special significance, making the reader able to understand the evolution over time as well as the way in which certain words, authors, countries or affiliations have collaborated or been used [122,123]. Each of the analyses mentioned has particular significance, and the information within them is diverse, even though some of the most relevant words or groups of words may be repeated. Considering other papers from the field, the prevalence of these analyses in better shaping and understanding the selected research domain has been observed [124,125].

3.5.1. Thematic Map

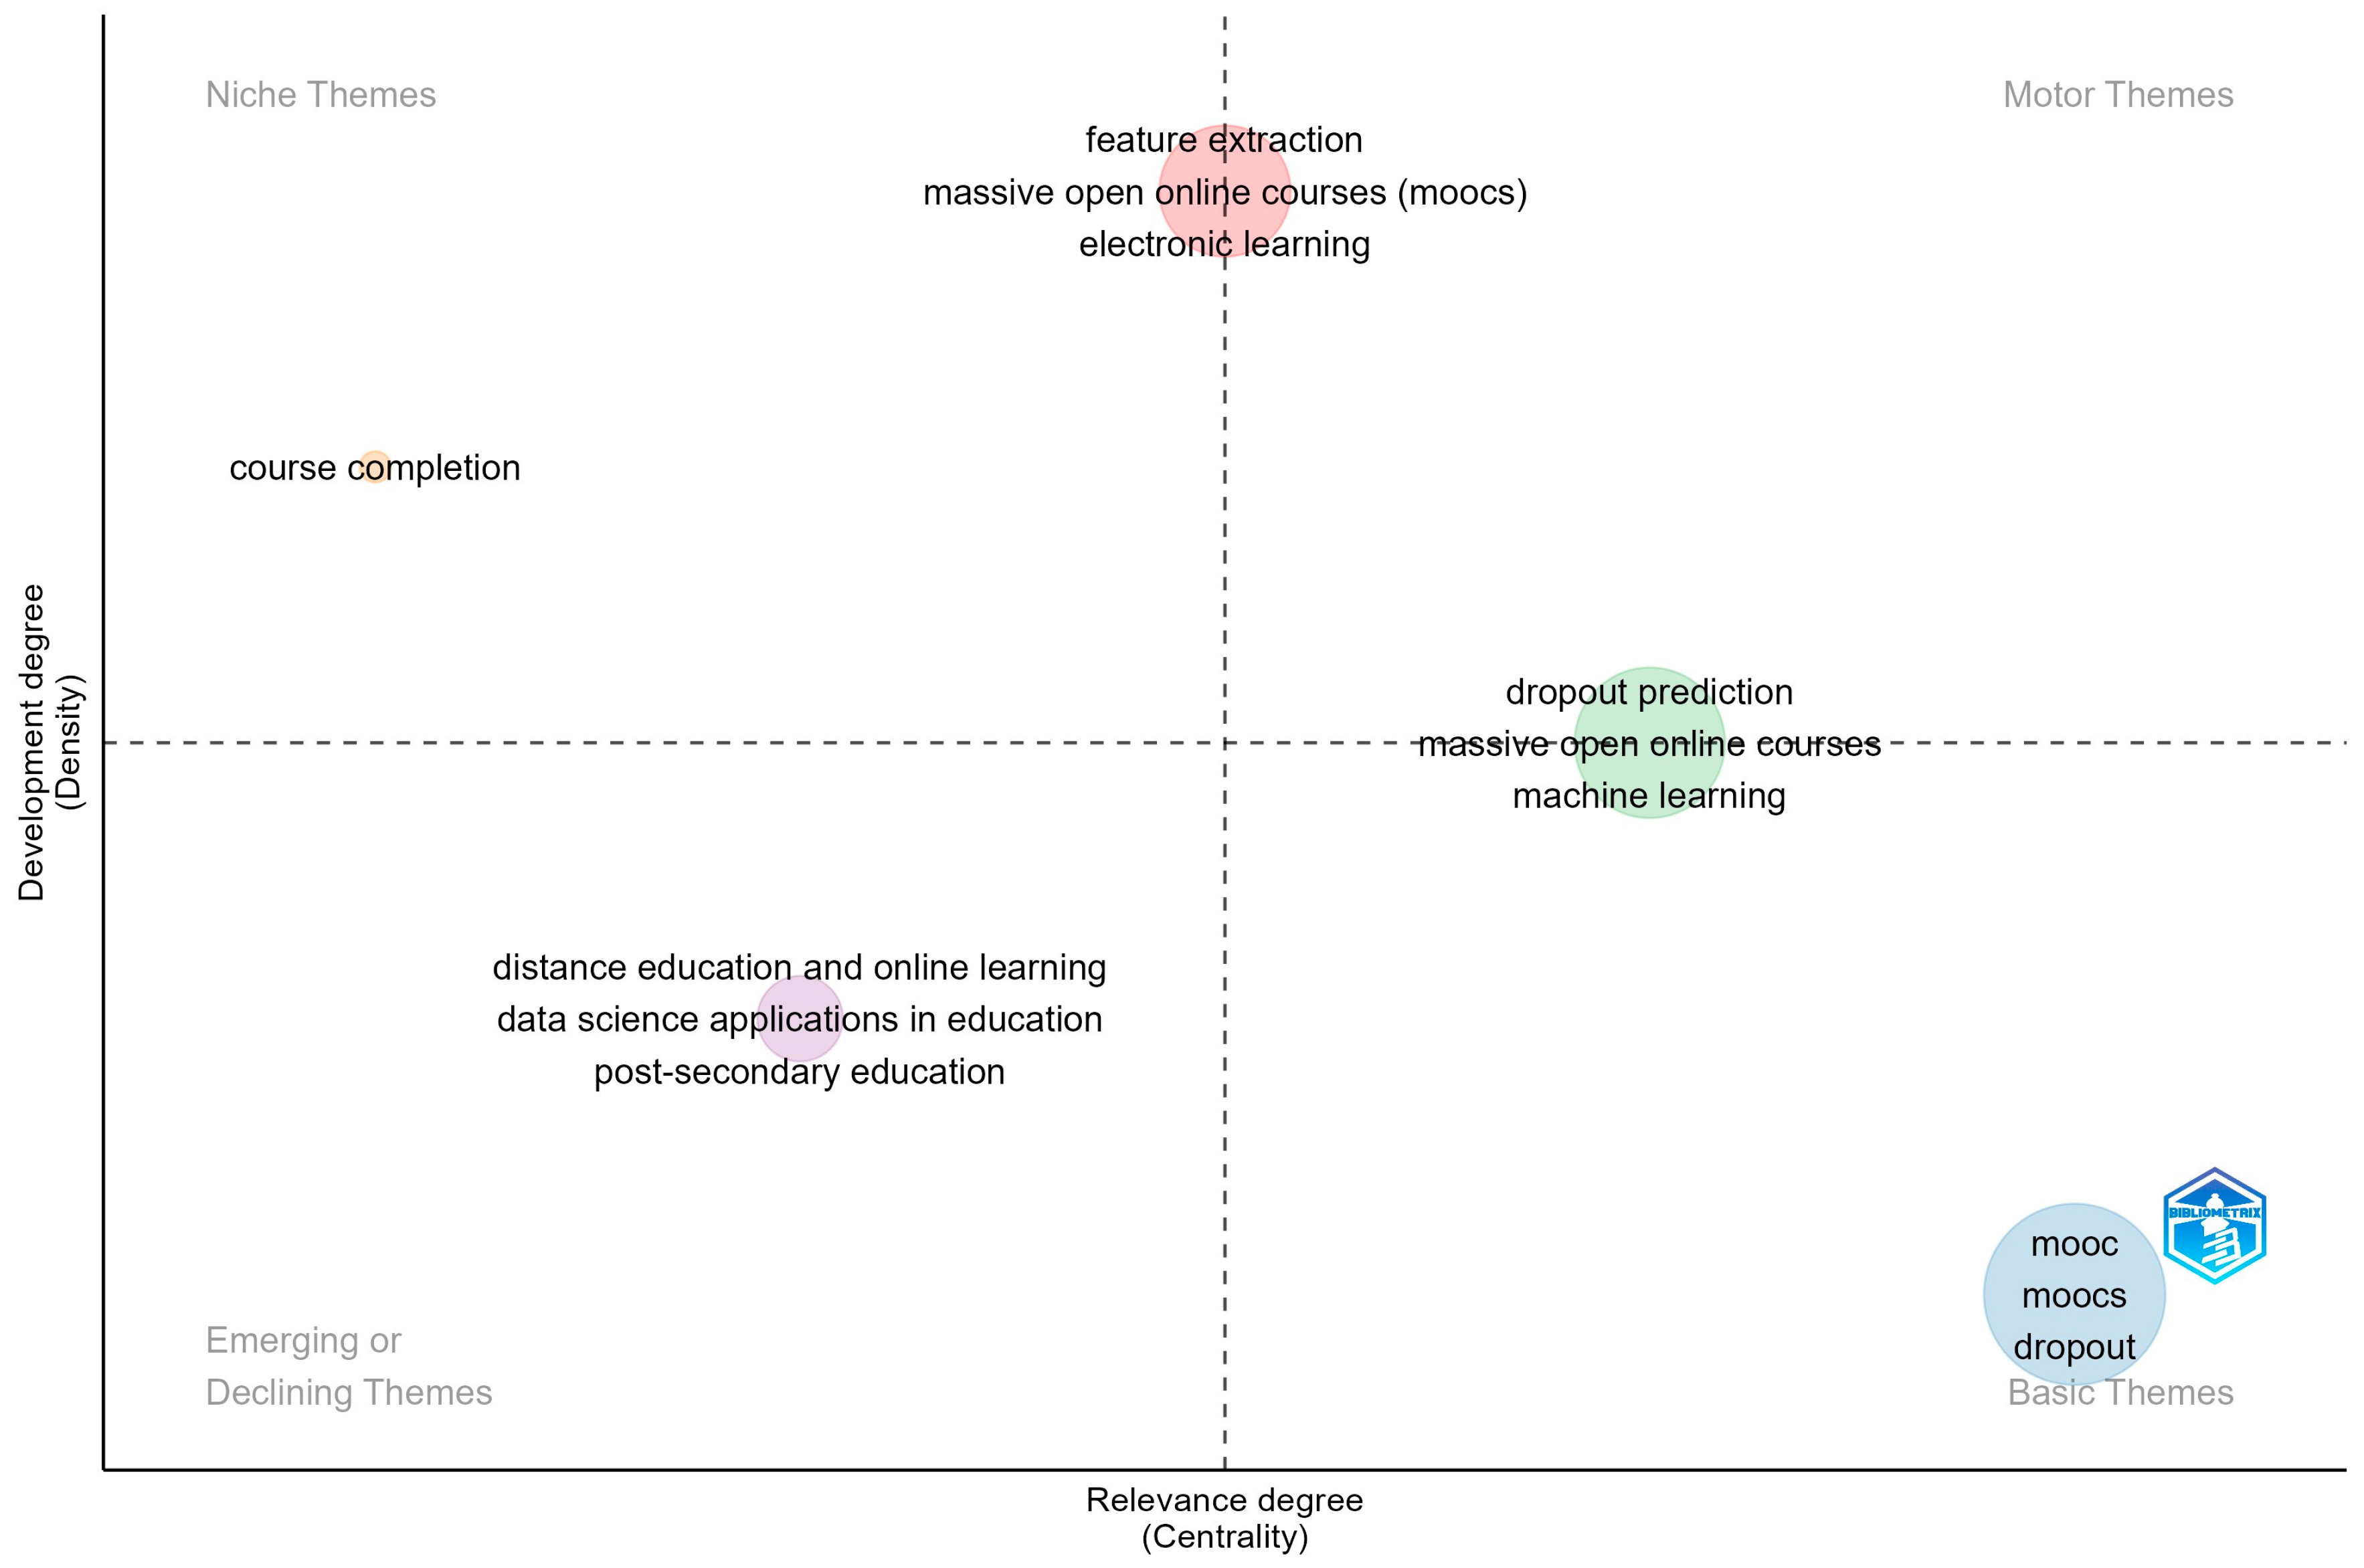
Figure 15 illustrates the thematic map of authors’ keywords, generated using specific filters. A total of 80 keywords were selected, with a minimum cluster frequency of 15 per thousand documents, a tag size of 0.35, and three labels. According to Nasir et al. [126], the thematic map classifies research topics into two dimensions: density and centrality. Density indicates the significance of a theme, while centrality reflects the volume of research effort devoted to it.
The top right quadrant, labeled ‘Motor Themes’, includes well-developed, frequently addressed topics that are highly relevant to the field. Conversely, the top left quadrant, labeled ‘Niche Themes’, features themes that are less prominent. In between these quadrants, the second largest cluster, shown in pink, comprises 15 significant terms. The most frequently occurring terms in this cluster include ‘feature extraction’ (nine occurrences), ‘massive open online courses’ (six occurrences), ‘e-learning’ (five occurrences), and ‘predictive models’ (five occurrences). This cluster encompasses MOOC dropout analysis techniques such as ‘machine learning algorithms’, ‘predictive models’, ‘random forest’, and ‘convolutional neural networks’, as well as domain characteristics like ‘education’, ‘collaboration’, and ‘electronic learning’.
Although small, the ‘Niche Themes’ quadrant contains an orange cluster with a single term: ‘course completion’. This represents a focal point of analyses aimed at identifying factors influencing MOOC completion or dropout, and addressing these factors to improve retention.
The bottom right quadrant, labeled ‘Basic Themes’, includes themes that are still in the developmental stage and require further research. The largest cluster in this quadrant, shown in blue, consists of 35 terms. Key terms with the highest occurrences include ‘MOOC/MOOCs’ (103 occurrences as shown in Table 9), ‘dropout’ (19 occurrences), ‘learning analytics’ (11 occurrences), and ‘online learning’ (11 occurrences). This cluster also includes essential MOOC characteristics such as ‘continuance intention’, ‘learner motivation’, ‘higher education’, ‘completion rate’, ‘connectivism’, ‘distance education’, ‘e-learning’, and ‘engagement’.
On the boundary between ‘Motor Themes’ and ‘Basic Themes’, a green cluster containing 14 terms is observed. The most common terms in this cluster include ‘dropout prediction’ (21 occurrences), ‘massive open online courses’ (21 occurrences), ‘machine learning’ (20 occurrences), and ‘deep learning’ (10 occurrences). These represent research themes and techniques frequently used in dropout studies, hence their positioning at the intersection of the two quadrants.
In the lower-left quadrant, labeled ‘Emerging or Declining Themes’, are topics with low density and centrality, indicating that they are underdeveloped. This quadrant features a purple cluster with three terms, ‘distance education and online learning’, ‘data science applications in education’, and ‘post-secondary education’, which are more general themes.

3.5.2. Thematic Map Evolution

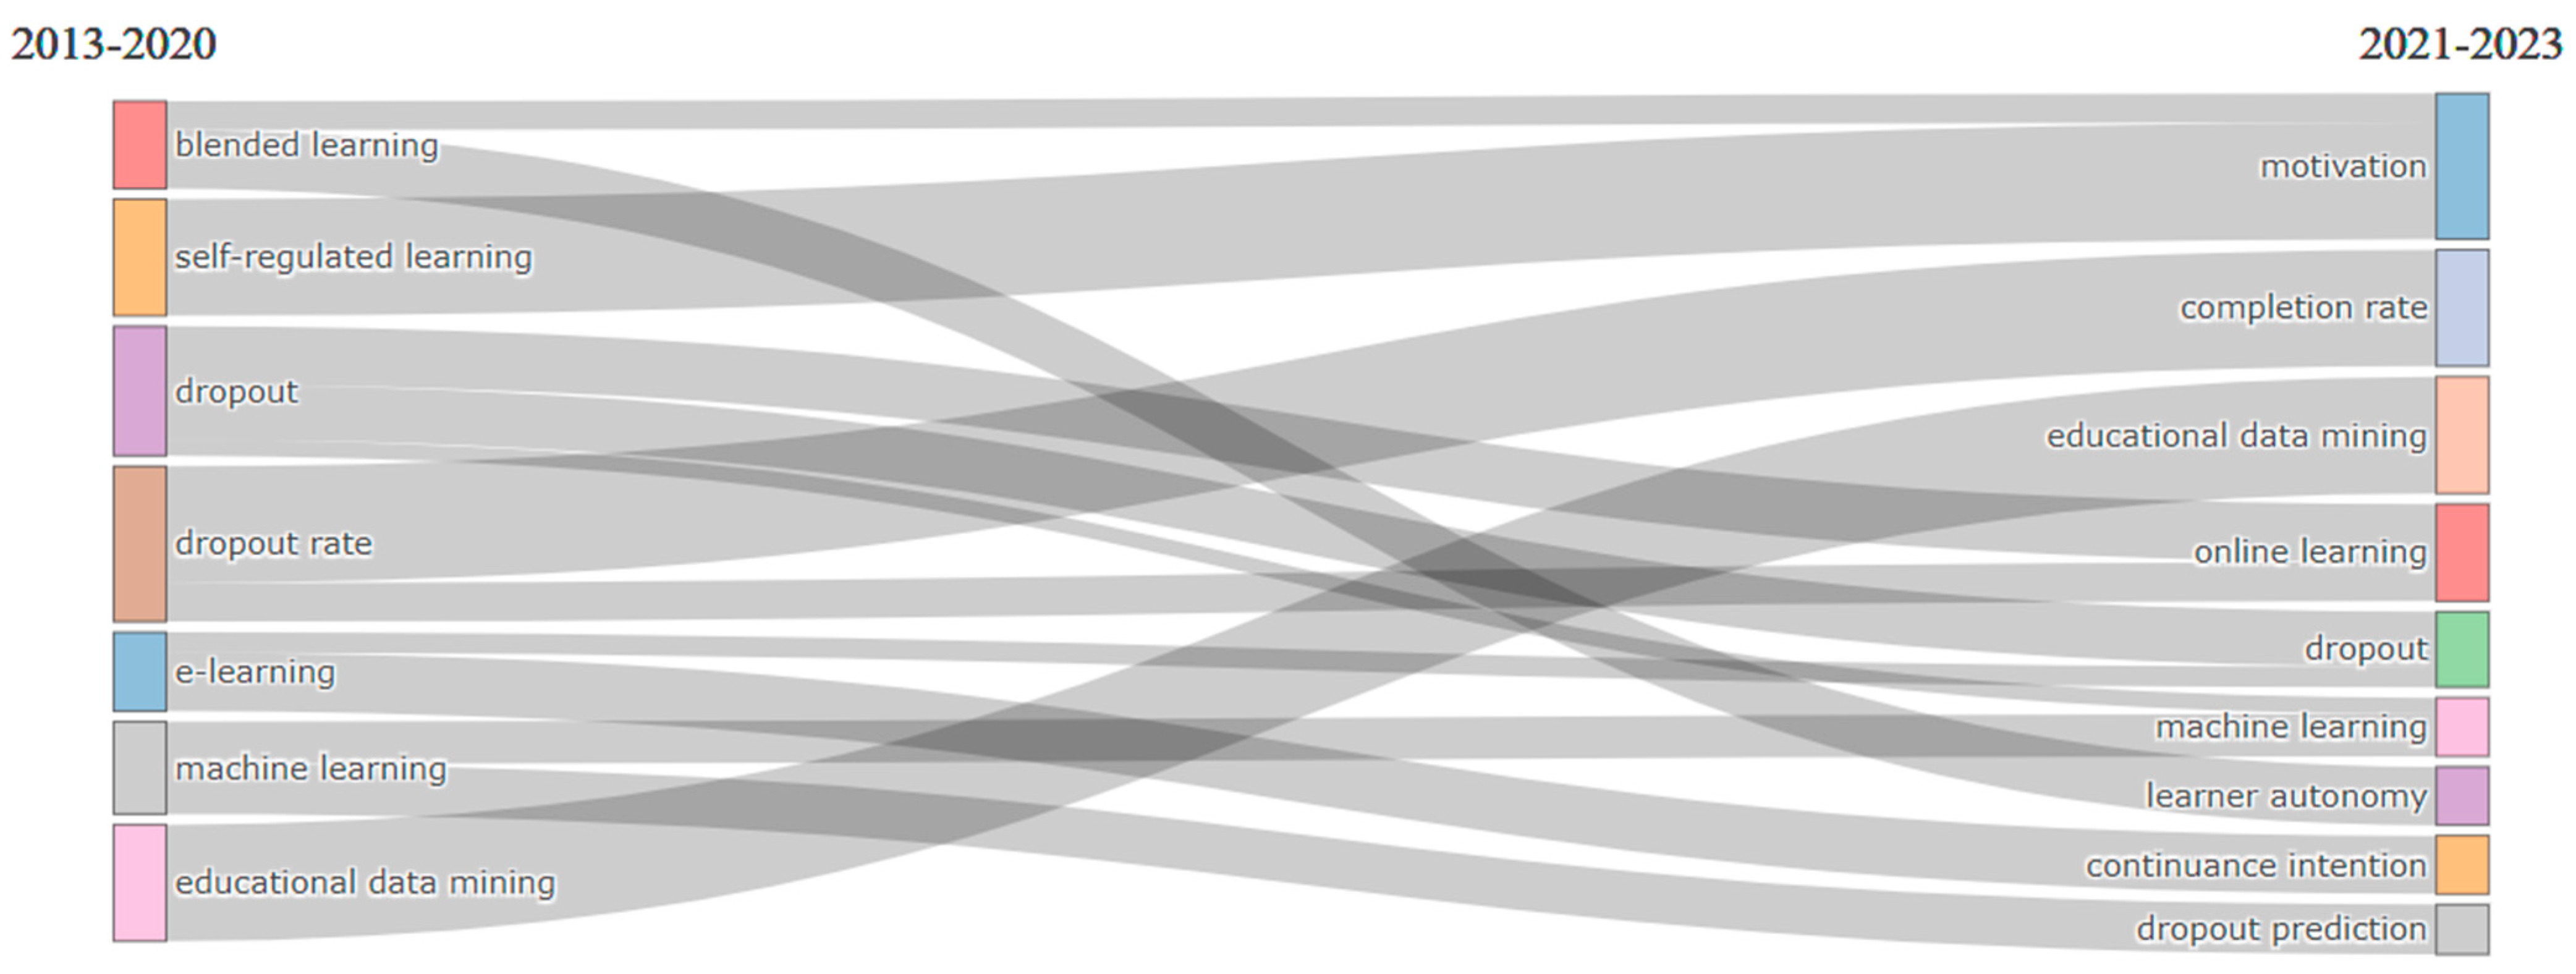
Considering the significant increase in scientific output related to MOOC dropout research in 2020 (Figure 2), analyzing thematic evolution has been deemed relevant, as illustrated in Figure 16. Domain-specific terms such as ‘MOOC’, ‘MOOCs’, ‘massive open online course’, ‘massive open online courses’, ‘massive open online course (MOOC)’, and ‘distance education and online learning’ have been excluded from this analysis to focus on thematic evolution.
Figure 16 reveals the most frequently encountered terms in authors’ keywords between 2013–2020 and 2021–2023, highlighting how these terms have evolved to define new concepts.
Notably, ‘blended learning’ has led to the emergence of terms such as ‘learner autonomy’ and ‘motivation’, which also encompasses ‘self-regulated learning’. Additionally, ‘dropout’ and ‘dropout rate’ have been associated with ‘online learning’, reflecting ongoing challenges in online education. The integration of ‘machine learning’ with ‘dropout prediction’ illustrates the development of advanced techniques for analyzing dropout, a trend evident in the papers selected for our database.
Based on the thematic evolution and considering the papers included in the database, a series of papers related to factors in dropout have been identified in various studies, such as but not limited to the papers discussed in the following. Azhar et al. [127] used semi-structured interviews in order to observe what the factors leading to dropout were, grouping the responses into three main themes: inability to manage time, perception of course content and lack of motivation.
Eriksson et al. [117] interviewed 34 learners and were able to identify a total of four factors that influence the decision to drop out: learners’ ability to manage their time effectively, the learner’s characteristics and social situation, the learner’s perception of the course design, and the learner’s perception of the course. Bozkurt and Akbulut [128] focused their attention on dropout in networked learning, analyzing this phenomenon in terms of cultural contexts. Using a mixed approach (group comparison and social network analysis), the two researchers analyzed a total of 179 MOOC participants. Using the results obtained, the researchers concluded that those students who do not drop out occupy central positions in the network, and that students from high cultural backgrounds tend to drop out more often, while those from low cultural backgrounds are more likely to complete the course.
In terms of dropout, dropout intention and continuance intention, a series of works have been identified in the extracted dataset. For example, Guo et al. [108] identified the problem of identifying those posts in MOOC forums that are considered to be “urgent”, but in most cases end up being influenced by a large volume of information and confusion. As a solution to this problem, the researchers propose a hybrid neural network that identifies urgent posts. This approach helps teachers to prioritize responses and better manage postings, helping to reduce dropout rates and improve course completion rates.
Xing and Du [114] set out to customize interventions for each student on the verge of dropping out. Starting from a temporal prediction mechanism based on deep learning algorithms, the researchers build a dropout prediction model that estimates the probability of dropout for each individual student. By harnessing the power of deep learning, the algorithm allows for both the prioritization and customization of interventions for students at risk of dropping out based on these individual probabilities.
Furthermore, the use of machine learning has been highlighted in various works included in the extracted dataset. It has been observed that due to the increasing developments in recent years in the use of machine learning techniques, there has been a massive use of machine learning in the research found in the database used to create this analysis. The use of machine learning in dropout analysis is extremely valuable due to its ability to identify complex patterns and predict dropout risks based on detailed data analysis.
Based on the high MOOC dropout rate, Chi et al. [129] built prediction models using different machine learning techniques, such as K-nearest neighbor, logistic regression or Random Forest. Subsequently, by evaluating the models with five metrics (accuracy, precision, recall, F1 score, and AUC), they concluded that the random forest-based model performed the best compared to the logistic regression and K-nearest neighbor-based models. Thus, the study suggests that random forest represents the most effective technique in predicting dropout in MOOCs, having the ability to assist educational personnel in making decisions to reduce dropout.
Hong et al. [130] describe the benefits of using a two-layer cascade classifier for dropout prediction, combining three different machine learning techniques: support vector machine, multinomial logistic regression and random forest. The authors choose to use this approach to improve the accuracy of dropout prediction. The experimental results suggest that the technique has an accuracy of 97%, which indicates a very good performance in predicting dropout risk.
Considering the behavior of the students enrolled in the MOOCs, Sr and Saravanan [131] used the frequent pattern growth technique to be able to identify frequent items and create useful features for the prediction model and used artificial neural networks for feature selection, implemented using frequent itemset-3. The obtained prediction models were evaluated using multilayer perceptron and compared with machine learning methods such as naive Bayes, random forest or K-nearest neighbor. The results showed that the feature importance association rule for the artificial neural network model had an accuracy of 92.42%, being about 18% more accurate than the multilayer perceptron–neural network model. The ultimate goal of the research was to reduce dropout rates and increase student retention.
In the study conducted by researcher Şahin [132], the adaptive neuro-fuzzy inference system technique was used to predict dropout rates in MOOCs. This method has the ability to combine two machine learning approaches: fuzzy inference systems and neural networks. The neural network helps with learning from the available data, and the fuzzy system helps with handling uncertainty and variations in the input data. The study compares the performance of this model with that of others developed based on traditional machine learning methods (support vector machine, decision tree, ensemble learning, logistic regression and K-nearest neighbor). The researchers concluded that the adaptive neuro-fuzzy inference system technique resulted in higher statistical accuracy compared to the reference models.
Mourdi et al. [27] conducted an exploratory study as well as a multivariate analysis in order to reduce the dimensionality and obtain the most relevant features. During the analysis, the researchers compared five machine learning algorithms, using association rules to extract similarities between the behaviors of those learners who dropped out of MOOCs. The results of the study showed that deep learning technology provides the most accurate predictions in terms of accuracy, recording an average of 95.8%. What this study contributes, in addition, is the provision of a model capable of not only predicting who the learners at risk of dropping out are, but also who those who will fail or succeed are.

3.5.3. Factorial Analysis

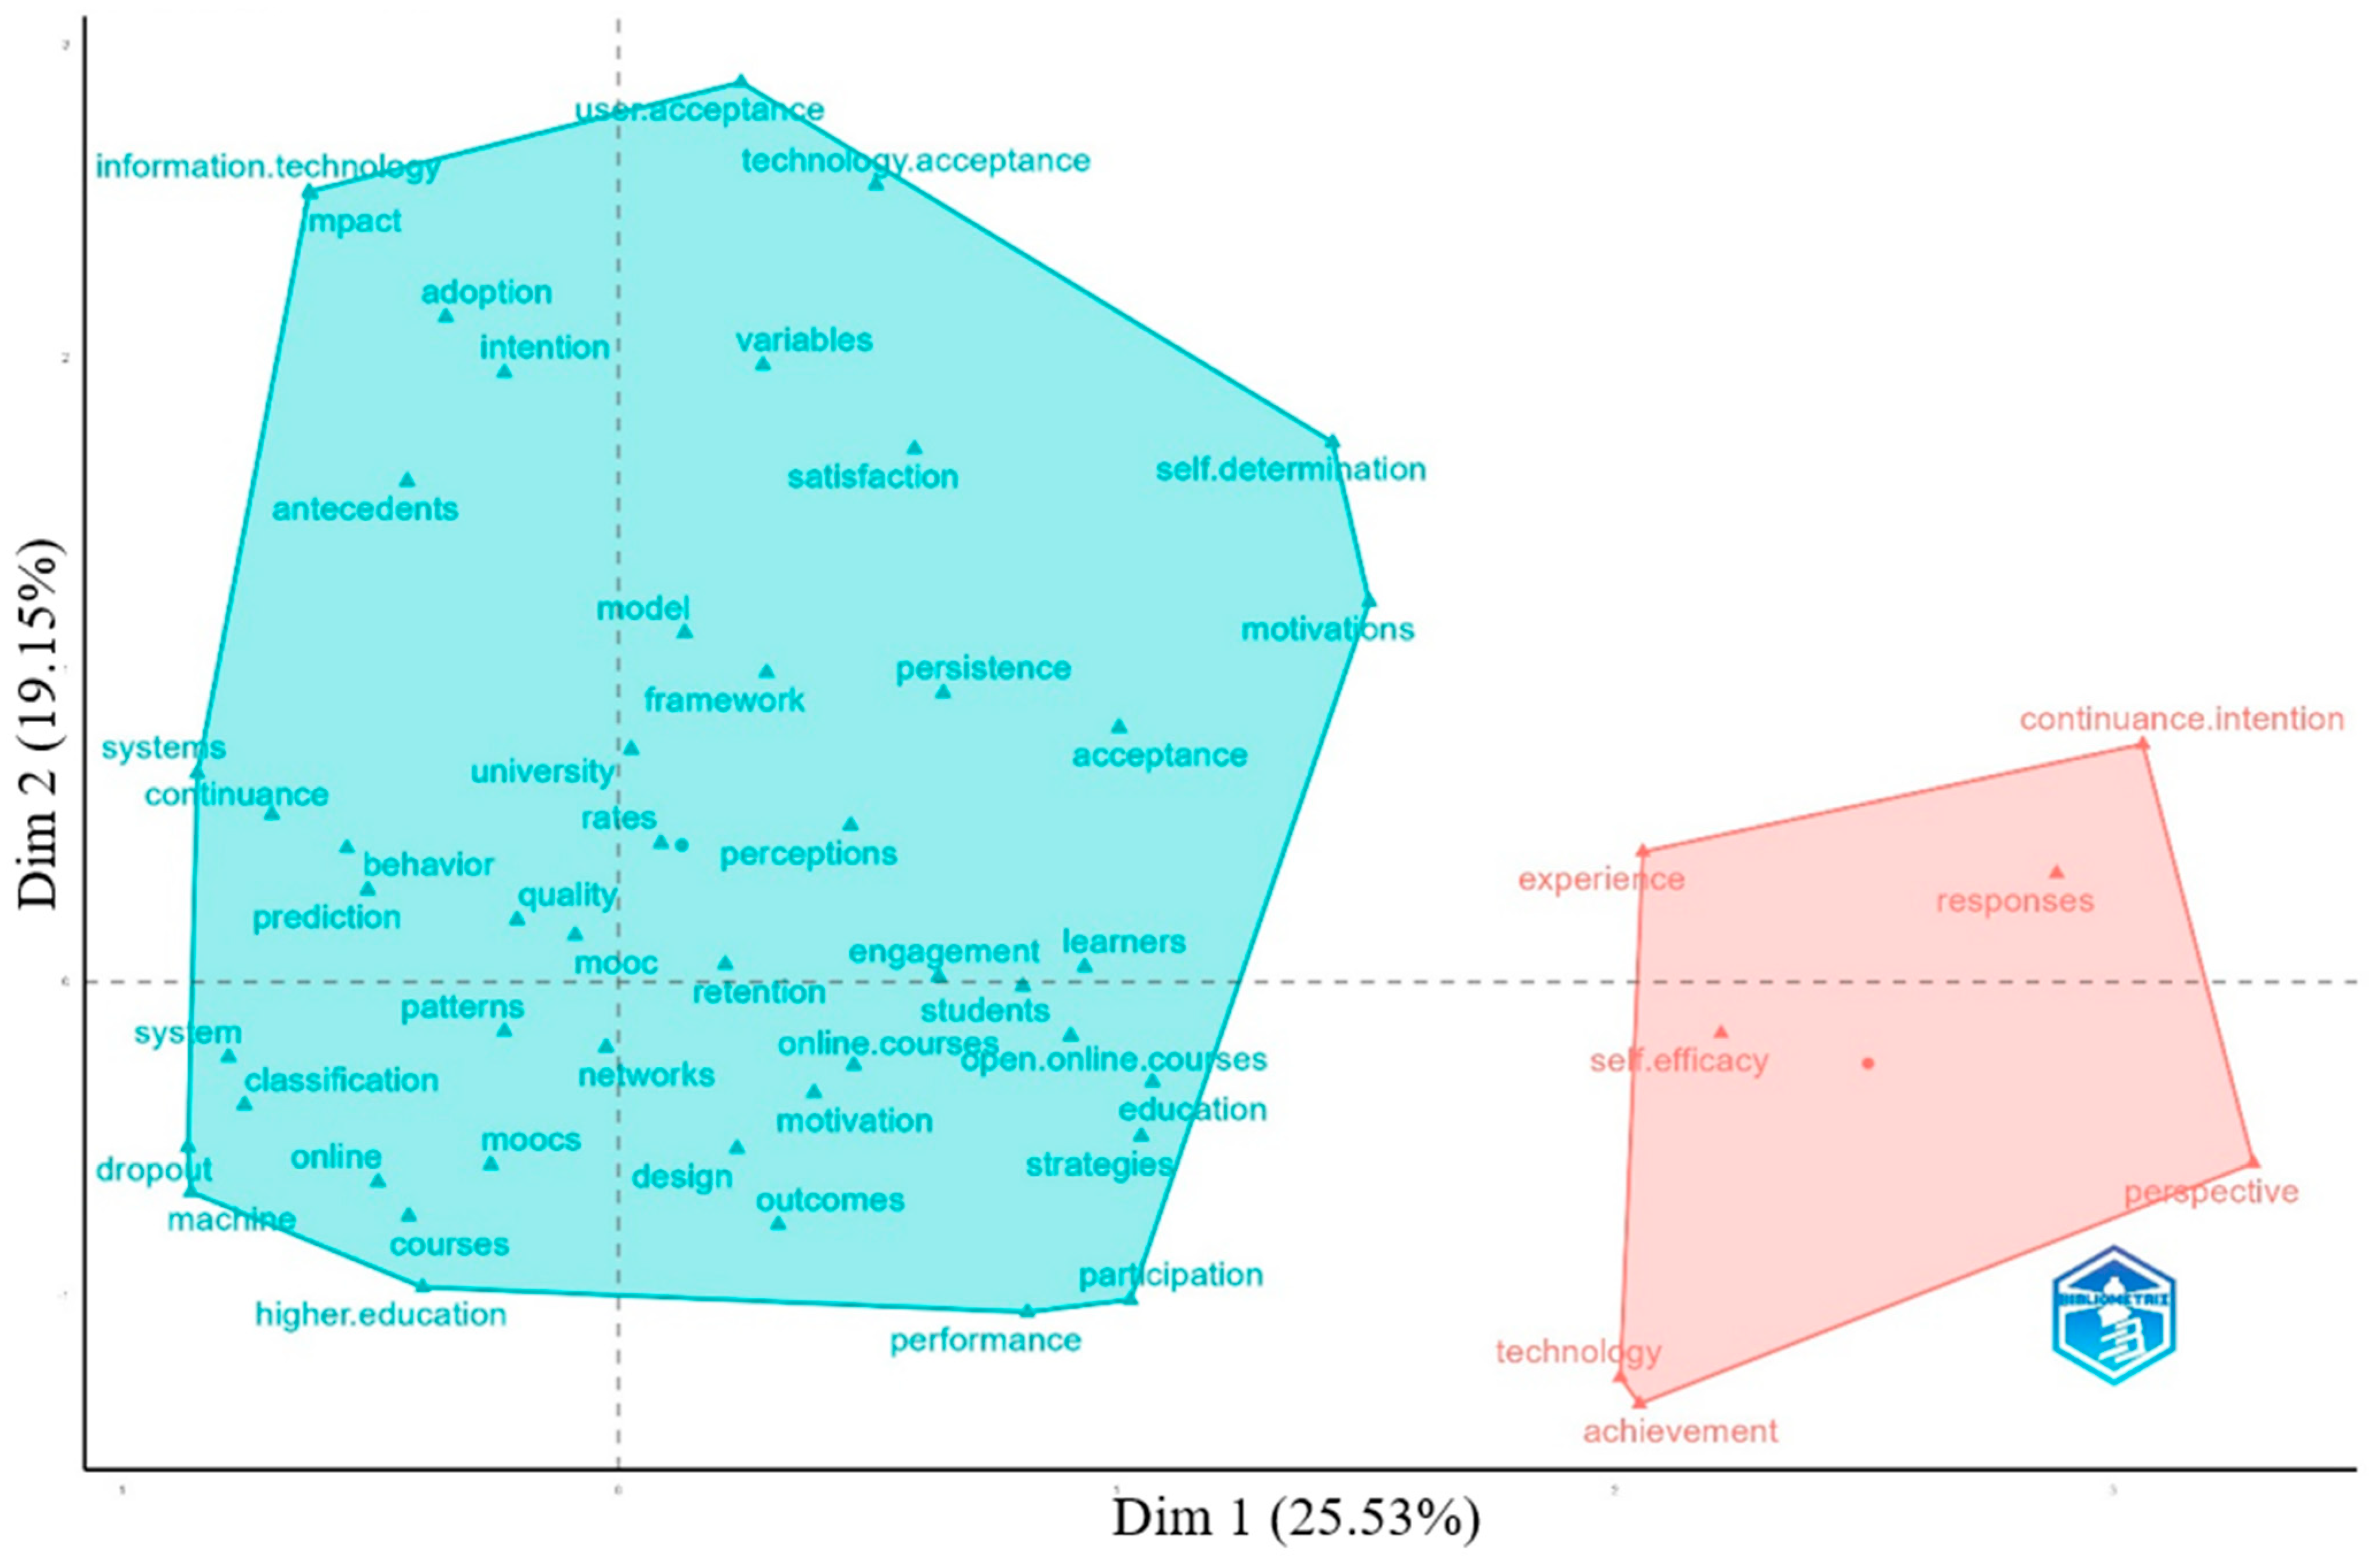
Figure 17 presents a Multiple Correspondence Analysis (MCA) for KeyWords Plus, which extends Correspondence Analysis (CA) by examining relationships between multiple categorical variables [90]. The analysis reduces the initial data dimensions to two primary dimensions, referred to as Dim. 1 and Dim. 2. Dim. 1 accounts for 25.53% of the variation, while Dim. 2 accounts for 19.15% of the variation. These dimensions reveal the main trends and structures within the data, with terms in each dimension clustered based on similarity.
Cluster 1, shown in blue, is larger than Cluster 2, shown in red. Cluster 1 comprises 47 words, whereas Cluster 2 includes only 7 words. Cluster 1 exhibits both positive and negative loadings, with a predominant positive loading in both dimensions. Cluster 2, on the other hand, shows a significantly positive loading on Dim. 1 and mixed positive and negative loadings on Dim. 2, with a predominant negative loading.
Cluster 1 includes terms related to MOOC participant traits such as ‘students’, ‘engagement’, ‘motivation’, ‘performance’, ‘behavior’, ‘patterns’, ‘retention’, ‘satisfaction’, ‘self-determination’, ‘strategies’, ‘classification’, ‘persistence’, and ‘intention’. These terms have been identified as significant determinants of dropout in the selected papers. In contrast, Cluster 2 contains terms such as ‘achievement’, ‘continuance intention’, ‘experience’, ‘perspective’, ‘technology’, ‘responses’, and ‘self-efficacy’, which are central to describing the research field.

3.5.4. Three-Fields Plot

Figure 18 helps us to identify links between countries, authors and publications. As expected, the country with the most authors is China, advancing Gao ZH, Zheng YF, Liu Y, Feng J, Sun X and Zhou YH, which, as seen in Figure 8, are among the top most relevant authors. In contrast to China, the country with the top three authors, among the most relevant ones, is Morocco (El Kabtane H, Mourdi Y, Sadgal M). Most of the authors illustrated in the figure were rather reluctant to collaborate with other countries, with only 4 out of the 20 authors opting to work with another country. This can be considered to be due to the existing educational legislation in each country. A similar situation was found within journals, with most authors choosing to publish in more than one journal, while others remained loyal to the same journal. The most preferred journal was “IEEE Access”, as shown in Figure 4, in top most relevant journals.
Figure 19 contains the second mixed analysis, this time between publications, authors and keywords. The keywords identified in the figure below were later analyzed in our research, and can be consulted in Table 10. The same situation can be observed with the affiliations (Table 7), which are part of the top of the authors’ most chosen publications.
“Cadi Ayyad University of Marrakech” from Morocco is connected with several authors, namely El Kabtane H, Mourdi Y, and Sadgal M, who have distinguished themselves by consistent contributions to the research on the factors leading to MOOC dropout. It is worth mentioning that there were five authors who were not affiliated to one of the universities included in the figure, even though they are among the most significant writers.
Analyzing the annual scientific output since 2013, a significant increase was observed from 2016 to 2019. Later increases were also identified in years such as 2021 and 2022. The flourishing period in 2019 may have been due to the COVID-19 pandemic; according to other studies conducted by other researchers, the COVID-19 period was a beneficial period for MOOCs, with dedicated courses for different fields of activity [133,134]. The bibliometric analysis by Liu et al. [135] also showed a significant increase in 2019, even though their number of articles entered in the research was higher (1078 articles). Moreover, a steady increase in the number of articles for the period 2013–2019 was also observed in our study. The work of Wahid et al. [136], which contains a total number of 3118 articles in the MOOC field, observed the highest increase in 2018, with a total of 678 articles published compared to the total, 2019 for which they identified only 298.
Regarding the most relevant sources identified, the journals “IEEE Access”, “Education and Information Technologies” and “International Review of Research in Open and Distributed Learning” represented the top three journals that stood out for their high number of articles published on MOOC dropout, due to their high interest in education. “IEEE Access” even has a dedicated section for educational technology and theory entitled “IEEE Access: IEEE Education Society Section”. Compared to the work of Wahid et al. [136], “International Review of Research in Open and Distributed Learning” is ranked fourth in terms of number of sources, which means that this journal is a significant one, having more publications related to our research area. Moreover, it denotes that the publication has a solid reputation, being able to give visibility and credibility to the published work. Making another comparison between the article cited above and our paper, we can see that Alario-Hoyos C., who appears in the top authors identified in terms of scientific creation, is also found in the cited article, but with a higher number of publications.
Regarding regional contributions to the field, China stands out with the highest number of publications, totaling 133 papers. These papers have accumulated a total of 1155 citations, and China has demonstrated the most extensive collaboration with other countries in the region. Following China, the USA has produced 40 papers with a total of 798 citations. In addition to these two countries, the United Kingdom, Spain, India, Morocco and India were also considered representative. In the paper by Wahid et al. [136], the top five significant countries are the USA, China, Spain, UK and Australia, a result that is very similar to ours. Another paper by Liu et al. [135] identifies USA, UK and Spain as the most significant countries.
Based on the papers included in the dataset, the following sections highlights some research directions, as well as a sample of papers from the identified research areas. Some of the research directions focus on the methods used (e.g., machine learning algorithms), while other focus more on the practical aspects related to MOOCs, such as motivational and psychological factors.

4. Conclusions and Limitations

The aim of this paper was to highlight the most significant papers indexed in the ISI Web of Science database related to school dropout and the factors contributing to it. The study covered the period from 2013 to 2023, with papers selected using specific filters relevant to our research. These papers were then subjected to a comprehensive bibliometric analysis to extract the most pertinent information.
MOOC analysis is particularly important as it is an essential technique for democratizing education, providing access to quality learning for a global and diverse audience. By analyzing the most globally significant MOOCs, one can better understand how learners interact with learning materials, what factors influence course success or dropout, and how pedagogical and technological strategies can be improved to enhance their effectiveness. It also helps to identify barriers to access and participation, enabling the development of solutions to make online education more inclusive and tailored to learners’ individual needs. With this work, the importance of education has been highlighted, regardless of the channel (online/offline) on which it is realized, as well as the importance of stopping dropout.
Based on the analysis conducted in the paper, aside from the identification of the top researchers in terms of citations and number of papers, top universities and journals, the description of the most cited papers, the characteristics of the collaboration networks, and the most used keywords, the research has also pointed out a series of research directions that can be followed in future research in the area. As a result, based on the thematic map, the prevalence of the transition from “self-regulated learning” to “motivation” and “learner autonomy”, which could be further supported by building personalized learning strategies that can boost the learners’ motivation, is underlined in this study.
Also, a more proactive approach that shifts the focus from an analysis of the “dropout rate” to an analysis of a “completion rate” or “continuance intention” could be another avenue for research in which the focus could be on developing models tailored for exploring predictive models and engagement strategies in order to boost student retention in the learning process.
Nevertheless, the analysis of the psychological and social factors that might affect the success of MOOCs could be another research direction, as can the analysis of other learning options one might find freely available in the online environment which could influence MOOC adoption and retention rates.
For a more comprehensive future study in this field to be conducted, we aim to expand the research by including indexed papers from additional databases to capture a broader spectrum of published work. Furthermore, an interesting area of research is represented by the integration of sustainable education frameworks into the MOOCs in order to provide a higher retention rate, which could bring long-term benefits to various learning communities.
Although the analysis provides significant information on MOOC dropout, it is essential to acknowledge and describe its limitations. Based on the database used, the selection of articles was restricted to those available in the WoS database. While this database includes many relevant papers, relying solely on WoS may be seen as a limitation. Incorporating other databases, such as Scopus, could have provided a more comprehensive view of the research domain. Limiting the analysis to English-language papers or those classified as “article” may also be seen as a constraint, as relevant studies in other languages or with different classifications might have been excluded, potentially affecting the findings. By focusing solely on articles indexed as “article” in the WoS database, the analysis includes both conference papers and journal articles. Additionally, the time frame restriction to 2013–2023 could mean that some research was omitted, as papers published after this date are not included in the analysis.

Author Contributions

Conceptualization, I.-D.C., L.-A.C., B.R.C. and C.D.; data curation, I.-D.C., B.R.C. and C.D.; formal analysis, L.-A.C., B.R.C. and C.D.; investigation, I.-D.C., L.-A.C., B.R.C. and C.D.; methodology, I.-D.C., L.-A.C., B.R.C. and C.D.; project administration, C.D.; resources, B.R.C. and C.D.; software, L.-A.C., B.R.C. and C.D.; supervision, C.D.; validation, I.-D.C., L.-A.C., B.R.C. and C.D.; visualization, I.-D.C., L.-A.C., B.R.C. and C.D.; writing—original draft, B.R.C. and C.D.; writing—review and editing, I.-D.C. and L.-A.C. All authors have read and agreed to the published version of the manuscript.

Funding

This paper was co-financed by The Bucharest University of Economic Studies during the PhD program. The work is supported by a grant of the Romanian Ministry of Research, Innovation and Digitalization, project CF 178/31 July 2023—‘JobKG—A Knowledge Graph of the Romanian Job Market based on Natural Language Processing’.

Institutional Review Board Statement

Not applicable.

Informed Consent Statement

Not applicable.

Data Availability Statement

The original contributions presented in this study are included in the article. Further inquiries can be directed to the corresponding author.

Conflicts of Interest

The authors declare no conflicts of interest.

References

  1. Li, S.; Zhao, Y.; Guo, L.; Ren, M.; Li, J.; Zhang, L.; Li, K. Quantification and Prediction of Engagement: Applied to Personalized Course Recommendation to Reduce Dropout in MOOCs. Inf. Process. Manag. 2024, 61, 103536. [Google Scholar] [CrossRef]
  2. Galikyan, I.; Admiraal, W.; Kester, L. MOOC Discussion Forums: The Interplay of the Cognitive and the Social. Comput. Educ. 2021, 165, 104133. [Google Scholar] [CrossRef]
  3. Knox, J. Massive Open Online Courses (MOOCs). In Encyclopedia of Educational Philosophy and Theory; Peters, M.A., Ed.; Springer: Singapore, 2017; pp. 1372–1378. ISBN 978-981-287-588-4. [Google Scholar]
  4. Margaryan, A.; Bianco, M.; Littlejohn, A. Instructional Quality of Massive Open Online Courses (MOOCs). Comput. Educ. 2015, 80, 77–83. [Google Scholar] [CrossRef]
  5. Clark, R.; Marks, L. MOOCs and Medical Education: Hope or Hype? MedEdPublish 2020, 9, 124. [Google Scholar] [CrossRef]
  6. da Silva, J.M.C.; Pedroso, G.H.; Veber, A.B.; Maruyama, Ú.G.R. Learner Engagement and Demographic Influences in Brazilian Massive Open Online Courses: Aprenda Mais Platform Case Study. Analytics 2024, 3, 178–193. [Google Scholar] [CrossRef]
  7. Huang, S.; Cheng, H.; Luo, M. Comparative Study on Barriers of Supply Chain Management MOOCs in China: Online Review Analysis with a Novel TOPSIS-CoCoSo Approach. J. Theor. Appl. Electron. Commer. Res. 2024, 19, 1793–1811. [Google Scholar] [CrossRef]
  8. Kaplan, A.M.; Haenlein, M. Higher Education and the Digital Revolution: About MOOCs, SPOCs, Social Media, and the Cookie Monster. Bus. Horiz. 2016, 59, 441–450. [Google Scholar] [CrossRef]
  9. Gong, Z. The Development of Medical MOOCs in China: Current Situation and Challenges. Med. Educ. Online 2018, 23, 1527624. [Google Scholar] [CrossRef]
  10. Kumar, G. Massive Open Online Courses’ (MOOCS’) Role in Promoting Educational Equity and SDG 4. Int. Educ. Sci. Res. J. 2024, 10, 18–23. [Google Scholar]
  11. Harting, K.; Erthal, M.J. History of Distance Learning. Inf. Technol. Learn. Perform. J. 2005, 23, 35–44. [Google Scholar]
  12. Kovanovic, V.; Joksimovic, S.; Gasevic, D.; Siemens, G.; Hatala, M. What Public Media Reveals about MOOCs: A Systematic Analysis of News Reports. Br. J. Educ. Technol. 2015, 46, 510–527. [Google Scholar] [CrossRef]
  13. Crosslin, M.; Al, E. Chapter 1: Overview of Online Courses. In Creating Online Learning Experiences; Mavs Open Press: Arlington, TX, USA, 2018. [Google Scholar]
  14. Xiong, Y.; Ling, Q.; Li, X. Ubiquitous E-Teaching and e-Learning: China’s Massive Adoption of Online Education and Launching MOOCs Internationally during the COVID-19 Outbreak. Wirel. Commun. Mob. Comput. 2021, 2021, 6358976. [Google Scholar] [CrossRef]
  15. Alamri, M.M. Investigating Students’ Adoption of MOOCs during COVID-19 Pandemic: Students’ Academic Self-Efficacy, Learning Engagement, and Learning Persistence. Sustainability 2022, 14, 714. [Google Scholar] [CrossRef]
  16. Chen, C.; Sonnert, G.; Sadler, P.M.; Sasselov, D.D.; Fredericks, C.; Malan, D.J. Going over the Cliff: MOOC Dropout Behavior at Chapter Transition. Distance Educ. 2020, 41, 6–25. [Google Scholar] [CrossRef]
  17. Jin, C. MOOC Student Dropout Prediction Model Based on Learning Behavior Features and Parameter Optimization. Interact. Learn. Environ. 2023, 31, 714–732. [Google Scholar] [CrossRef]
  18. Deng, R.; Benckendorff, P.; Gannaway, D. Learner Engagement in MOOCs: Scale Development and Validation. Br. J. Educ. Technol. 2020, 51, 245–262. [Google Scholar] [CrossRef]
  19. Almatrafi, O.; Johri, A.; Rangwala, H. Needle in a Haystack: Identifying Learner Posts That Require Urgent Response in MOOC Discussion Forums. Comput. Educ. 2018, 118, 1–9. [Google Scholar] [CrossRef]
  20. Vilkova, K.; Shcheglova, I. Deconstructing Self-Regulated Learning in MOOCs: In Search of Help-Seeking Mechanisms. Educ. Inf. Technol. 2021, 26, 17–33. [Google Scholar] [CrossRef]
  21. Narayanasamy, S.K.; Elçi, A. An Effective Prediction Model for Online Course Dropout Rate. Int. J. Distance Educ. Technol. (IJDET) 2020, 18, 94–110. [Google Scholar] [CrossRef]
  22. Huang, H.; Jew, L.; Qi, D. Take a MOOC and Then Drop: A Systematic Review of MOOC Engagement Pattern and Dropout Factor. Heliyon 2023, 9, e15220. [Google Scholar] [CrossRef]
  23. Celik, B.; Cagiltay, K. Did You Act According to Your Intention? An Analysis and Exploration of Intention–Behavior Gap in MOOCs. Educ. Inf. Technol. 2024, 29, 1733–1760. [Google Scholar] [CrossRef]
  24. Aldowah, H.; Al-Samarraie, H.; Alzahrani, A.I.; Alalwan, N. Factors Affecting Student Dropout in MOOCs: A Cause and Effect Decision-making Model. J. Comput. High. Educ. 2020, 32, 429–454. [Google Scholar] [CrossRef]
  25. Mourdi, Y.; Sadgal, M.; Elalaoui Elabdallaoui, H.; El Kabtane, H.; Allioui, H. A Recurrent Neural Networks Based Framework for At-Risk Learners’ Early Prediction and MOOC Tutor’s Decision Support. Comput. Appl. Eng. Educ. 2023, 31, 270–284. [Google Scholar] [CrossRef]
  26. El Kabtane, H.; El Adnani, M.; Sadgal, M.; Mourdi, Y. Virtual Reality and Augmented Reality at the Service of Increasing Interactivity in MOOCs. Educ. Inf. Technol. 2020, 25, 2871–2897. [Google Scholar] [CrossRef]
  27. Mourdi, Y.; Sadgal, M.; El Kabtane, H.; Berrada Fathi, W. A Machine Learning-Based Methodology to Predict Learners’ Dropout, Success or Failure in MOOCs. Int. J. Web Inf. Syst. 2019, 15, 489–509. [Google Scholar] [CrossRef]
  28. El Kabtane, H.; El Adnani, M.; Sadgal, M.; Mourdi, Y. Augmented Reality-Based Approach for Interactivity in MOOCs. Int. J. Web Inf. Syst. 2018, 15, 134–154. [Google Scholar] [CrossRef]
  29. Zhu, M.; Sari, A.R.; Lee, M.M. A Comprehensive Systematic Review of MOOC Research: Research Techniques, Topics, and Trends from 2009 to 2019. Educ. Technol. Res. Dev. 2020, 68, 1685–1710. [Google Scholar] [CrossRef]
  30. Zhu, M.; Sari, A.; Lee, M. A Systematic Review of Research Methods and Topics of the Empirical MOOC Literature (2014–2016). Internet High. Educ. 2018, 37, 31–39. [Google Scholar] [CrossRef]
  31. Doulani, A. A Bibliometric Analysis and Science Mapping of Scientific Publications of Alzahra University during 1986–2019. Libr. Hi Tech 2020, 39, 915–935. [Google Scholar] [CrossRef]
  32. Khan, M.A.; Pattnaik, D.; Ashraf, R.; Ali, I.; Kumar, S.; Donthu, N. Value of Special Issues in the Journal of Business Research: A Bibliometric Analysis. J. Bus. Res. 2021, 125, 295–313. [Google Scholar] [CrossRef]
  33. Donthu, N.; Kumar, S.; Pattnaik, D.; Lim, W.M. A Bibliometric Retrospection of Marketing from the Lens of Psychology: Insights from Psychology & Marketing. Psychol. Mark. 2021, 38, 834–865. [Google Scholar] [CrossRef]
  34. Sandu, A.; Cotfas, L.-A.; Stănescu, A.; Delcea, C. Guiding Urban Decision-Making: A Study on Recommender Systems in Smart Cities. Electronics 2024, 13, 2151. [Google Scholar] [CrossRef]
  35. Sandu, A.; Cotfas, L.-A.; Delcea, C.; Ioanăș, C.; Florescu, M.-S.; Orzan, M. Machine Learning and Deep Learning Applications in Disinformation Detection: A Bibliometric Assessment. Electronics 2024, 13, 4352. [Google Scholar] [CrossRef]
  36. Domenteanu, A.; Delcea, C.; Florescu, M.-S.; Gherai, D.S.; Bugnar, N.; Cotfas, L.-A. United in Green: A Bibliometric Exploration of Renewable Energy Communities. Electronics 2024, 13, 3312. [Google Scholar] [CrossRef]
  37. Donthu, N.; Kumar, S.; Lim, W.M. Research Constituents, Intellectual Structure, and Collaboration Patterns in Journal of International Marketing: An Analytical Retrospective. J. Int. Mark. 2021, 29, 1–25. [Google Scholar] [CrossRef]
  38. Verma, S.; Gustafsson, A. Investigating the Emerging COVID-19 Research Trends in the Field of Business and Management: A Bibliometric Analysis Approach. J. Bus. Res. 2020, 118, 253–261. [Google Scholar] [CrossRef]
  39. Delcea, C.; Oprea, S.-V.; Dima, A.M.; Domenteanu, A.; Bara, A.; Cotfas, L.-A. Energy Communities: Insights from Scientific Publications. Oeconomia Copernic. 2024, 15, 1101–1155. [Google Scholar] [CrossRef]
  40. Domenteanu, A.; Cotfas, L.-A.; Diaconu, P.; Tudor, G.-A.; Delcea, C. AI on Wheels: Bibliometric Approach to Mapping of Research on Machine Learning and Deep Learning in Electric Vehicles. Electronics 2025, 14, 378. [Google Scholar] [CrossRef]
  41. Herther, N.K. Research Evaluation and Citation Analysis: Key Issues and Implications. Electron. Libr. 2009, 27, 361–375. [Google Scholar] [CrossRef]
  42. Passas, I. Bibliometric Analysis: The Main Steps. Encyclopedia 2024, 4, 1014–1025. [Google Scholar] [CrossRef]
  43. Zong, B.; Sun, Y.; Li, L. Advances, Hotspots, and Trends in Outdoor Education Research: A Bibliometric Analysis. Sustainability 2024, 16, 10034. [Google Scholar] [CrossRef]
  44. Hallinger, P.; Jayaseelan, S.; Speece, M.W. The Evolution of Educating for Sustainable Development in East Asia: A Bibliometric Review, 1991–2023. Sustainability 2024, 16, 8900. [Google Scholar] [CrossRef]
  45. Basheer, N.; Ahmed, V.; Bahroun, Z.; Anane, C. Exploring Sustainability Assessment Practices in Higher Education: A Comprehensive Review through Content and Bibliometric Analyses. Sustainability 2024, 16, 5799. [Google Scholar] [CrossRef]
  46. Dönmez, İ. Sustainability in Educational Research: Mapping the Field with a Bibliometric Analysis. Sustainability 2024, 16, 5541. [Google Scholar] [CrossRef]
  47. Alghamdi, S.; Soh, B.; Li, A. A Comprehensive Review of Dropout Prediction Methods Based on Multivariate Analysed Features of MOOC Platforms. Multimodal Technol. Interact. 2025, 9, 3. [Google Scholar] [CrossRef]
  48. Alsuhaimi, R.; Almatrafi, O. Identifying Learners’ Confusion in a MOOC Forum Across Domains Using Explainable Deep Transfer Learning. Information 2024, 15, 681. [Google Scholar] [CrossRef]
  49. Luo, Z.; Li, H. The Involvement of Academic and Emotional Support for Sustainable Use of MOOCs. Behav. Sci. 2024, 14, 461. [Google Scholar] [CrossRef]
  50. Swacha, J.; Muszyńska, K. Predicting Dropout in Programming MOOCs through Demographic Insights. Electronics 2023, 12, 4674. [Google Scholar] [CrossRef]
  51. Donthu, N.; Kumar, S.; Mukherjee, D.; Pandey, N.; Lim, W.M. How to Conduct a Bibliometric Analysis: An Overview and Guidelines. J. Bus. Res. 2021, 133, 285–296. [Google Scholar] [CrossRef]
  52. Crețu, R.F.; Țuțui, D.; Banța, V.C.; Șerban, E.C.; Barna, L.E.L.; Crețu, R.C. The Effects of the Implementation of Artificial Intelligence-Based Technologies on the Skills Needed in the Automotive Industry—A Bibliometric Analysis. Amfiteatru Econ. 2024, 3, 658–673. [Google Scholar] [CrossRef]
  53. Moreno-Guerrero, A.-J.; López-Belmonte, J.; Marín-Marín, J.-A.; Soler-Costa, R. Scientific Development of Educational Artificial Intelligence in Web of Science. Future Internet 2020, 12, 124. [Google Scholar] [CrossRef]
  54. Yu, J.; Muñoz-Justicia, J. A Bibliometric Overview of Twitter-Related Studies Indexed in Web of Science. Future Internet 2020, 12, 91. [Google Scholar] [CrossRef]
  55. Berniak-Woźny, J.; Szelągowski, M. A Comprehensive Bibliometric Analysis of Business Process Management and Knowledge Management Integration: Bridging the Scholarly Gap. Information 2024, 15, 436. [Google Scholar] [CrossRef]
  56. Ravšelj, D.; Umek, L.; Todorovski, L.; Aristovnik, A. A Review of Digital Era Governance Research in the First Two Decades: A Bibliometric Study. Future Internet 2022, 14, 126. [Google Scholar] [CrossRef]
  57. Fatma, N.; Haleem, A. Exploring the Nexus of Eco-Innovation and Sustainable Development: A Bibliometric Review and Analysis. Sustainability 2023, 15, 12281. [Google Scholar] [CrossRef]
  58. Stefanis, C.; Giorgi, E.; Tselemponis, G.; Voidarou, C.; Skoufos, I.; Tzora, A.; Tsigalou, C.; Kourkoutas, Y.; Constantinidis, T.C.; Bezirtzoglou, E. Terroir in View of Bibliometrics. Stats 2023, 6, 956–979. [Google Scholar] [CrossRef]
  59. Marín-Rodríguez, N.J.; González-Ruiz, J.D.; Valencia-Arias, A. Incorporating Green Bonds into Portfolio Investments: Recent Trends and Further Research. Sustainability 2023, 15, 14897. [Google Scholar] [CrossRef]
  60. Anaç, M.; Gumusburun Ayalp, G.; Erdayandi, K. Prefabricated Construction Risks: A Holistic Exploration through Advanced Bibliometric Tool and Content Analysis. Sustainability 2023, 15, 11916. [Google Scholar] [CrossRef]
  61. Cibu, B.; Delcea, C.; Domenteanu, A.; Dumitrescu, G. Mapping the Evolution of Cybernetics: A Bibliometric Perspective. Computers 2023, 12, 237. [Google Scholar] [CrossRef]
  62. Modak, N.M.; Merigó, J.M.; Weber, R.; Manzor, F.; Ortúzar, J.d.D. Fifty Years of Transportation Research Journals: A Bibliometric Overview. Transp. Res. Part A Policy Pract. 2019, 120, 188–223. [Google Scholar] [CrossRef]
  63. Profiroiu, C.M.; Cibu, B.; Delcea, C.; Cotfas, L.-A. Charting the Course of School Dropout Research: A Bibliometric Exploration. IEEE Access 2024, 12, 71453–71478. [Google Scholar] [CrossRef]
  64. Tătaru, G.-C.; Domenteanu, A.; Delcea, C.; Florescu, M.S.; Orzan, M.; Cotfas, L.-A. Navigating the Disinformation Maze: A Bibliometric Analysis of Scholarly Efforts. Information 2024, 15, 742. [Google Scholar] [CrossRef]
  65. Ciucu-Durnoi, A.N.; Delcea, C.; Stănescu, A.; Teodorescu, C.A.; Vargas, V.M. Beyond Industry 4.0: Tracing the Path to Industry 5.0 through Bibliometric Analysis. Sustainability 2024, 16, 5251. [Google Scholar] [CrossRef]
  66. Mulet-Forteza, C.; Martorell-Cunill, O.; Merigó, J.M.; Genovart-Balaguer, J.; Mauleon-Mendez, E. Twenty Five Years of the Journal of Travel & Tourism Marketing: A Bibliometric Ranking. J. Travel Tour. Mark. 2018, 35, 1201–1221. [Google Scholar] [CrossRef]
  67. Bakır, M.; Özdemir, E.; Akan, Ş.; Atalık, Ö. A Bibliometric Analysis of Airport Service Quality. J. Air Transp. Manag. 2022, 104, 102273. [Google Scholar] [CrossRef]
  68. Using VOSviewer as a Bibliometric Mapping or Analysis Tool in Business, Management & Accounting. Available online: https://library.smu.edu.sg/topics-insights/using-vosviewer-bibliometric-mapping-or-analysis-tool-business-management (accessed on 28 July 2024).
  69. Aria, M.; Cuccurullo, C. Bibliometrix: An R-Tool for Comprehensive Science Mapping Analysis. J. Informetr. 2017, 11, 959–975. [Google Scholar] [CrossRef]
  70. Liu, F. Retrieval Strategy and Possible Explanations for the Abnormal Growth of Research Publications: Re-Evaluating a Bibliometric Analysis of Climate Change. Scientometrics 2023, 128, 853–859. [Google Scholar] [CrossRef]
  71. Liu, W. The Data Source of This Study Is Web of Science Core Collection? Not Enough. Scientometrics 2019, 121, 1815–1824. [Google Scholar] [CrossRef]
  72. Billsberry, J.; Alony, I. The MOOC Post-Mortem: Bibliometric and Systematic Analyses of Research on Massive Open Online Courses (MOOCs), 2009 to 2022. J. Manag. Educ. 2024, 48, 634–670. [Google Scholar] [CrossRef]
  73. Kurulgan, M. A Bibliometric Analysis of Research on Dropout in Open and Distance Learning. Turk. Online J. Distance Educ. 2024, 25, 200–229. [Google Scholar] [CrossRef]
  74. Raman, A.; Thannimalai, R.; Don, Y.; Rathakrishnan, M. A Bibliometric Analysis of Blended Learning in Higher Education: Perception, Achievement and Engagement. Int. J. Learn. Teach. Educ. Res. 2021, 20, 126–151. [Google Scholar] [CrossRef]
  75. Irwanto, I.; Wahyudiati, D.; Saputro, A.; Lukman, I.R. Massive Open Online Courses (MOOCs) in Higher Education: A Bibliometric Analysis (2012–2022). Int. J. Inf. Educ. Technol. 2023, 13, 223–231. [Google Scholar] [CrossRef]
  76. Alazaiza, M.Y.D.; Alzghoul, T.M.; Al Maskari, T.; Amr, S.A.; Nassani, D.E. Analyzing the Evolution of Research on Student Awareness of Solid Waste Management in Higher Education Institutions: A Bibliometric Perspective. Sustainability 2024, 16, 5422. [Google Scholar] [CrossRef]
  77. Rojas-Sánchez, M.A.; Palos-Sánchez, P.R.; Folgado-Fernández, J.A. Systematic Literature Review and Bibliometric Analysis on Virtual Reality and Education. Educ. Inf. Technol. 2023, 28, 155–192. [Google Scholar] [CrossRef]
  78. Donner, P. Document Type Assignment Accuracy in the Journal Citation Index Data of Web of Science. Scientometrics 2017, 113, 219–236. [Google Scholar] [CrossRef]
  79. Cretu, D.M.; Morandau, F. Initial Teacher Education for Inclusive Education: A Bibliometric Analysis of Educational Research. Sustainability 2020, 12, 4923. [Google Scholar] [CrossRef]
  80. Swacha, J. State of Research on Gamification in Education: A Bibliometric Survey. Educ. Sci. 2021, 11, 69. [Google Scholar] [CrossRef]
  81. Desai, N.; Veras, L.; Gosain, A. Using Bradford’s Law of Scattering to Identify the Core Journals of Pediatric Surgery. J. Surg. Res. 2018, 229, 90–95. [Google Scholar] [CrossRef]
  82. Hjørland, B.; Nicolaisen, J. Bradford’s Law of Scattering: Ambiguities in the Concept of “Subject”. In Information Context: Nature, Impact, and Role, Proceedings of the 5th International Conference on Conceptions of Library and Information Sciences, CoLIS 2005, Glasgow, UK, 4–8 June 2005; Springer: Berlin/Heidelberg, Germany, 2005; Volume 3507, p. 106. ISBN 978-3-540-26178-0. [Google Scholar]
  83. Ireland, T.; MacDonald, K.; Stirling, P. The H-Index: What Is It, How Do We Determine It, and How Can We Keep Up With It? In Science and the Internet; Düsseldorf University Press: Düsseldorf, Germany, 2012. [Google Scholar]
  84. Shah, D. By The Numbers: MOOCs in 2019; The Report by Class Central; Class Central: Santa Clara, CA, USA, 2019. [Google Scholar]
  85. Impey, C.; Formanek, M. MOOCS and 100 Days of COVID: Enrollment Surges in Massive Open Online Astronomy Classes during the Coronavirus Pandemic. Soc. Sci. Humanit. Open 2021, 4, 100177. [Google Scholar] [CrossRef]
  86. Mayr, P. Relevance Distributions across Bradford Zones: Can Bradfordizing Improve Search? In Proceedings of the ISSI 2013—14th International Society of Scientometrics and Informetrics Conference, Vienna, Austria, 15–19 July 2013; Volume 2. [Google Scholar]
  87. Venable, G.; Shepherd, B.; Loftis, C.; McClatchy, S.; Roberts, M.; Fillinger, M.; Tansey, B.; Klimo, P. Bradford’s Law: Identification of the Core Journals for Neurosurgery and Its Subspecialties. J. Neurosurg. 2015, 124, 569–579. [Google Scholar] [CrossRef]
  88. Tan, X.; Tasir, Z. A Systematic Review on Massive Open Online Courses in China from 2019 to 2023. Int. J. Acad. Res. Progress. Educ. Dev. 2024, 13, 160–182. [Google Scholar]
  89. Ma, R.; Mendez, M.C.; Bowden, P.; Massive List of Chinese Online Course Platforms in 2025. The Report by Class Central. 2025. Available online: https://www.classcentral.com/report/chinese-mooc-platforms/ (accessed on 15 February 2025).
  90. Moreno-Marcos, P.M.; Muñoz-Merino, P.J.; Maldonado-Mahauad, J.; Pérez-Sanagustín, M.; Alario-Hoyos, C.; Delgado Kloos, C. Temporal Analysis for Dropout Prediction Using Self-Regulated Learning Strategies in Self-Paced MOOCs. Comput. Educ. 2020, 145, 103728. [Google Scholar] [CrossRef]
  91. Alonso-Mencía, M.E.; Alario-Hoyos, C.; Estévez-Ayres, I.; Kloos, C.D. Analysing Self-Regulated Learning Strategies of MOOC Learners through Self-Reported Data. Australas. J. Educ. Technol. 2021, 37, 56–70. [Google Scholar] [CrossRef]
  92. Rõõm, M.; Lepp, M.; Luik, P. Dropout Time and Learners’ Performance in Computer Programming MOOCs. Educ. Sci. 2021, 11, 643. [Google Scholar] [CrossRef]
  93. Feklistova, L.; Lepp, M.; Luik, P. Learners’ Performance in a MOOC on Programming. Educ. Sci. 2021, 11, 521. [Google Scholar] [CrossRef]
  94. Prenkaj, B.; Distante, D.; Faralli, S.; Velardi, P. Hidden Space Deep Sequential Risk Prediction on Student Trajectories. Future Gener. Comput. Syst. 2021, 125, 532–543. [Google Scholar] [CrossRef]
  95. Prenkaj, B.; Velardi, P.; Stilo, G.; Distante, D.; Faralli, S. A Survey of Machine Learning Approaches for Student Dropout Prediction in Online Courses. ACM Comput. Surv. 2020, 53, 1–34. [Google Scholar] [CrossRef]
  96. Zheng, Q.; Chen, L.; Burgos, D. Emergence and Development of MOOCs. In The Development of MOOCs in China; Zheng, Q., Chen, L., Burgos, D., Eds.; Springer: Singapore, 2018; pp. 11–24. ISBN 978-981-10-6586-6. [Google Scholar]
  97. Zheng, Q.; Chen, L.; Burgos, D. Learning Support of MOOCs in China. In The Development of MOOCs in China; Zheng, Q., Chen, L., Burgos, D., Eds.; Springer: Singapore, 2018; pp. 229–244. ISBN 978-981-10-6586-6. [Google Scholar]
  98. Smaili, E.M.; Daoudi, M.; Oumaira, I.; Azzouzi, S.; Charaf, M.E.H. Towards an Adaptive Learning Model Using Optimal Learning Paths to Prevent MOOC Dropout. Int. J. Eng. Pedagog. (IJEP) 2023, 13, 128–144. [Google Scholar] [CrossRef]
  99. Sraidi, S.; Smaili, E.M.; Azzouzi, S.; Charaf, M.E.H. A Neural Network-Based System to Predict Early MOOC Dropout. Int. J. Eng. Pedagog. (IJEP) 2022, 12, 86–101. [Google Scholar] [CrossRef]
  100. Chaker, R.; Bouchet, F.; Bachelet, R. How Do Online Learning Intentions Lead to Learning Outcomes? The Mediating Effect of the Autotelic Dimension of Flow in a MOOC. Comput. Hum. Behav. 2022, 134, 107306. [Google Scholar] [CrossRef]
  101. Ortega-Arranz, A.; Er, E.; Martínez-Monés, A.; Bote-Lorenzo, M.L.; Asensio-Pérez, J.I.; Muñoz-Cristóbal, J.A. Understanding Student Behavior and Perceptions toward Earning Badges in a Gamified MOOC. Univers. Access Inf. Soc. 2019, 18, 533–549. [Google Scholar] [CrossRef]
  102. Ortega-Arranz, A.; Bote-Lorenzo, M.L.; Asensio-Pérez, J.I.; Martínez-Monés, A.; Gómez-Sánchez, E.; Dimitriadis, Y. To Reward and beyond: Analyzing the Effect of Reward-Based Strategies in a MOOC. Comput. Educ. 2019, 142, 103639. [Google Scholar] [CrossRef]
  103. Chen, C.; Sonnert, G.; Sadler, P.M.; Sasselov, D.; Fredericks, C. The Impact of Student Misconceptions on Student Persistence in a MOOC. J. Res. Sci. Teach. 2020, 57, 879–910. [Google Scholar] [CrossRef]
  104. Zheng, Y.; Gao, Z.; Wang, Y.; Fu, Q. MOOC Dropout Prediction Using FWTS-CNN Model Based on Fused Feature Weighting and Time Series. IEEE Access 2020, 8, 225324–225335. [Google Scholar] [CrossRef]
  105. Fu, Q.; Gao, Z.; Zhou, J.; Zheng, Y. CLSA: A Novel Deep Learning Model for MOOC Dropout Prediction. Comput. Electr. Eng. 2021, 94, 107315. [Google Scholar] [CrossRef]
  106. Zheng, Y.; Shao, Z.; Deng, M.; Gao, Z.; Fu, Q. MOOC Dropout Prediction Using a Fusion Deep Model Based on Behaviour Features. Comput. Electr. Eng. 2022, 104, 108409. [Google Scholar] [CrossRef]
  107. Chen, J.; Feng, J.; Sun, X.; Wu, N.; Yang, Z.; Chen, S. MOOC Dropout Prediction Using a Hybrid Algorithm Based on Decision Tree and Extreme Learning Machine. Math. Probl. Eng. 2019, 2019, 8404653. [Google Scholar] [CrossRef]
  108. Guo, S.X.; Sun, X.; Wang, S.X.; Gao, Y.; Feng, J. Attention-Based Character-Word Hybrid Neural Networks with Semantic and Structural Information for Identifying of Urgent Posts in MOOC Discussion Forums. IEEE Access 2019, 7, 120522–120532. [Google Scholar] [CrossRef]
  109. Gao, Y.; Sun, X.; Wang, X.; Guo, S.; Feng, J. A Parallel Neural Network Structure for Sentiment Classification of MOOCs Discussion Forums. J. Intell. Fuzzy Syst. 2020, 38, 4915–4927. [Google Scholar] [CrossRef]
  110. Youssef, M.; Mohammed, S.; Hamada, E.K.; Wafaa, B.F. A Predictive Approach Based on Efficient Feature Selection and Learning Algorithms’ Competition: Case of Learners’ Dropout in MOOCs. Educ. Inf. Technol. 2019, 24, 3591–3618. [Google Scholar] [CrossRef]
  111. Xing, W.; Chen, X.; Stein, J.; Marcinkowski, M. Temporal Predication of Dropouts in MOOCs: Reaching the Low Hanging Fruit through Stacking Generalization. Comput. Hum. Behav. 2016, 58, 119–129. [Google Scholar] [CrossRef]
  112. Carhuallanqui-Ciocca, E.I.; Echevarría-Quispe, J.Y.; Hernández-Vásquez, A.; Díaz-Ruiz, R.; Azañedo, D. Bibliometric Analysis of the Scientific Production on Inguinal Hernia Surgery in the Web of Science. Front. Surg. 2023, 10, 1138805. [Google Scholar] [CrossRef]
  113. Dai, H.M.; Teo, T.; Rappa, N.A.; Huang, F. Explaining Chinese University Students’ Continuance Learning Intention in the MOOC Setting: A Modified Expectation Confirmation Model Perspective. Comput. Educ. 2020, 150, 103850. [Google Scholar] [CrossRef]
  114. Xing, W.; Du, D. Dropout Prediction in MOOCs: Using Deep Learning for Personalized Intervention. J. Educ. Comput. Res. 2019, 57, 547–570. [Google Scholar] [CrossRef]
  115. Tsai, Y.; Lin, C.; Hong, J.; Tai, K. The Effects of Metacognition on Online Learning Interest and Continuance to Learn with MOOCs. Comput. Educ. 2018, 121, 18–29. [Google Scholar] [CrossRef]
  116. Henderikx, M.A.; Kreijns, K.; Kalz, M. Refining Success and Dropout in Massive Open Online Courses Based on the Intention–Behavior Gap. Distance Educ. 2017, 38, 353–368. [Google Scholar] [CrossRef]
  117. Eriksson, T.; Adawi, T.; Stöhr, C. “Time Is the Bottleneck”: A Qualitative Study Exploring Why Learners Drop out of MOOCs. J. Comput. High. Educ. 2017, 29, 133–146. [Google Scholar] [CrossRef]
  118. Sunar, A.S.; White, S.; Abdullah, N.A.; Davis, H.C. How Learners’ Interactions Sustain Engagement: A MOOC Case Study. IEEE Trans. Learn. Technol. 2017, 10, 475–487. [Google Scholar] [CrossRef]
  119. Jadrić, M.; Garača, Ž.; Čukušić, M. Student Dropout Analysis with Application of Data Mining Methods. Manag. J. Contemp. Manag. Issues 2010, 15, 31–46. [Google Scholar]
  120. Lykourentzou, I.; Giannoukos, I.; Nikolopoulos, V.; Mpardis, G.; Loumos, V. Dropout Prediction in E-Learning Courses through the Combination of Machine Learning Techniques. Comput. Educ. 2009, 53, 950–965. [Google Scholar] [CrossRef]
  121. Lee, S.; Chung, J.Y. The Machine Learning-Based Dropout Early Warning System for Improving the Performance of Dropout Prediction. Appl. Sci. 2019, 9, 3093. [Google Scholar] [CrossRef]
  122. Dilaver, I.; Karakullukcu, S.; Gurcan, F.; Topbas, M.; Ursavas, O.F.; Beyhun, N.E. Climate Change and Non-Communicable Diseases: A Bibliometric, Content, and Topic Modeling Analysis. Sustainability 2025, 17, 2394. [Google Scholar] [CrossRef]
  123. Liu, T.; Wang, Y.; Zhang, L.; Xu, N.; Tang, F. Outdoor Thermal Comfort Research and Its Implications for Landscape Architecture: A Systematic Review. Sustainability 2025, 17, 2330. [Google Scholar] [CrossRef]
  124. Nica, I.; Chiriță, N.; Georgescu, I. Triple Bottom Line in Sustainable Development: A Comprehensive Bibliometric Analysis. Sustainability 2025, 17, 1932. [Google Scholar] [CrossRef]
  125. Nica, I. Bibliometric Mapping in the Landscape of Cybernetics: Insights into Global Research Networks. Kybernetes 2024. ahead of print. [Google Scholar] [CrossRef]
  126. Nasir, A.; Shaukat, K.; Hameed, I.A.; Luo, S.; Alam, T.M.; Iqbal, F. A Bibliometric Analysis of Corona Pandemic in Social Sciences: A Review of Influential Aspects and Conceptual Structure. IEEE Access 2020, 8, 133377–133402. [Google Scholar] [CrossRef]
  127. Azhar, K.A.; Iqbal, N.; Shah, Z.; Ahmed, H. Understanding High Dropout Rates in MOOCs—A Qualitative Case Study from Pakistan. Innov. Educ. Teach. Int. 2024, 61, 764–778. [Google Scholar] [CrossRef]
  128. Bozkurt, A.; Akbulut, Y. Dropout Patterns and Cultural Context in Online Networked Learning Spaces|Open Praxis. Available online: https://openpraxis.org/articles/10.5944/openpraxis.11.1.940 (accessed on 15 February 2025).
  129. Chi, Z.; Zhang, S.; Shi, L. Analysis and Prediction of MOOC Learners’ Dropout Behavior. Appl. Sci. 2023, 13, 1068. [Google Scholar] [CrossRef]
  130. Hong, B.; Wei, Z.; Yang, Y. A Two-Layer Cascading Method for Dropout Prediction in MOOC. Mechatron. Syst. Control. 2019, 47, 91–97. [Google Scholar]
  131. Sr, N.; Saravanan, U. MOOC Dropout Prediction Using FIAR-ANN Model Based on Learner Behavioral Features. Int. J. Adv. Comput. Sci. Appl. 2022, 13, 607–617. [Google Scholar] [CrossRef]
  132. Şahin, M. A Comparative Analysis of Dropout Prediction in Massive Open Online Courses. Arab. J. Sci. Eng. 2021, 46, 1845–1861. [Google Scholar] [CrossRef]
  133. Tlili, A.; Altinay, F.; Altinay, Z.; Aydin, C.H.; Huang, R.; Sharma, R. Reflections on Massive Open Online Courses (MOOCS) During the COVID-19 Pandemic: A Bibliometric Mapping Analysis. Turk. Online J. Distance Educ. 2022, 23, 1–17. [Google Scholar] [CrossRef]
  134. Aljarrah, A.; Ababneh, M.; Cavus, N. The Role of Massive Open Online Courses during the COVID-19 Era. New Trends Issues Proc. Humanit. Soc. Sci. 2020, 7, 142–152. [Google Scholar] [CrossRef]
  135. Liu, C.; Zou, D.; Chen, X.; Xie, H.; Chan, W.H. A Bibliometric Review on Latent Topics and Trends of the Empirical MOOC Literature (2008–2019). Asia Pac. Educ. Rev. 2021, 22, 515–534. [Google Scholar] [CrossRef]
  136. Wahid, R.; Ahmi, A.; Alam, A.S.A.F. Growth and Collaboration in Massive Open Online Courses: A Bibliometric Analysis. IRRODL 2020, 21, 292–322. [Google Scholar] [CrossRef]
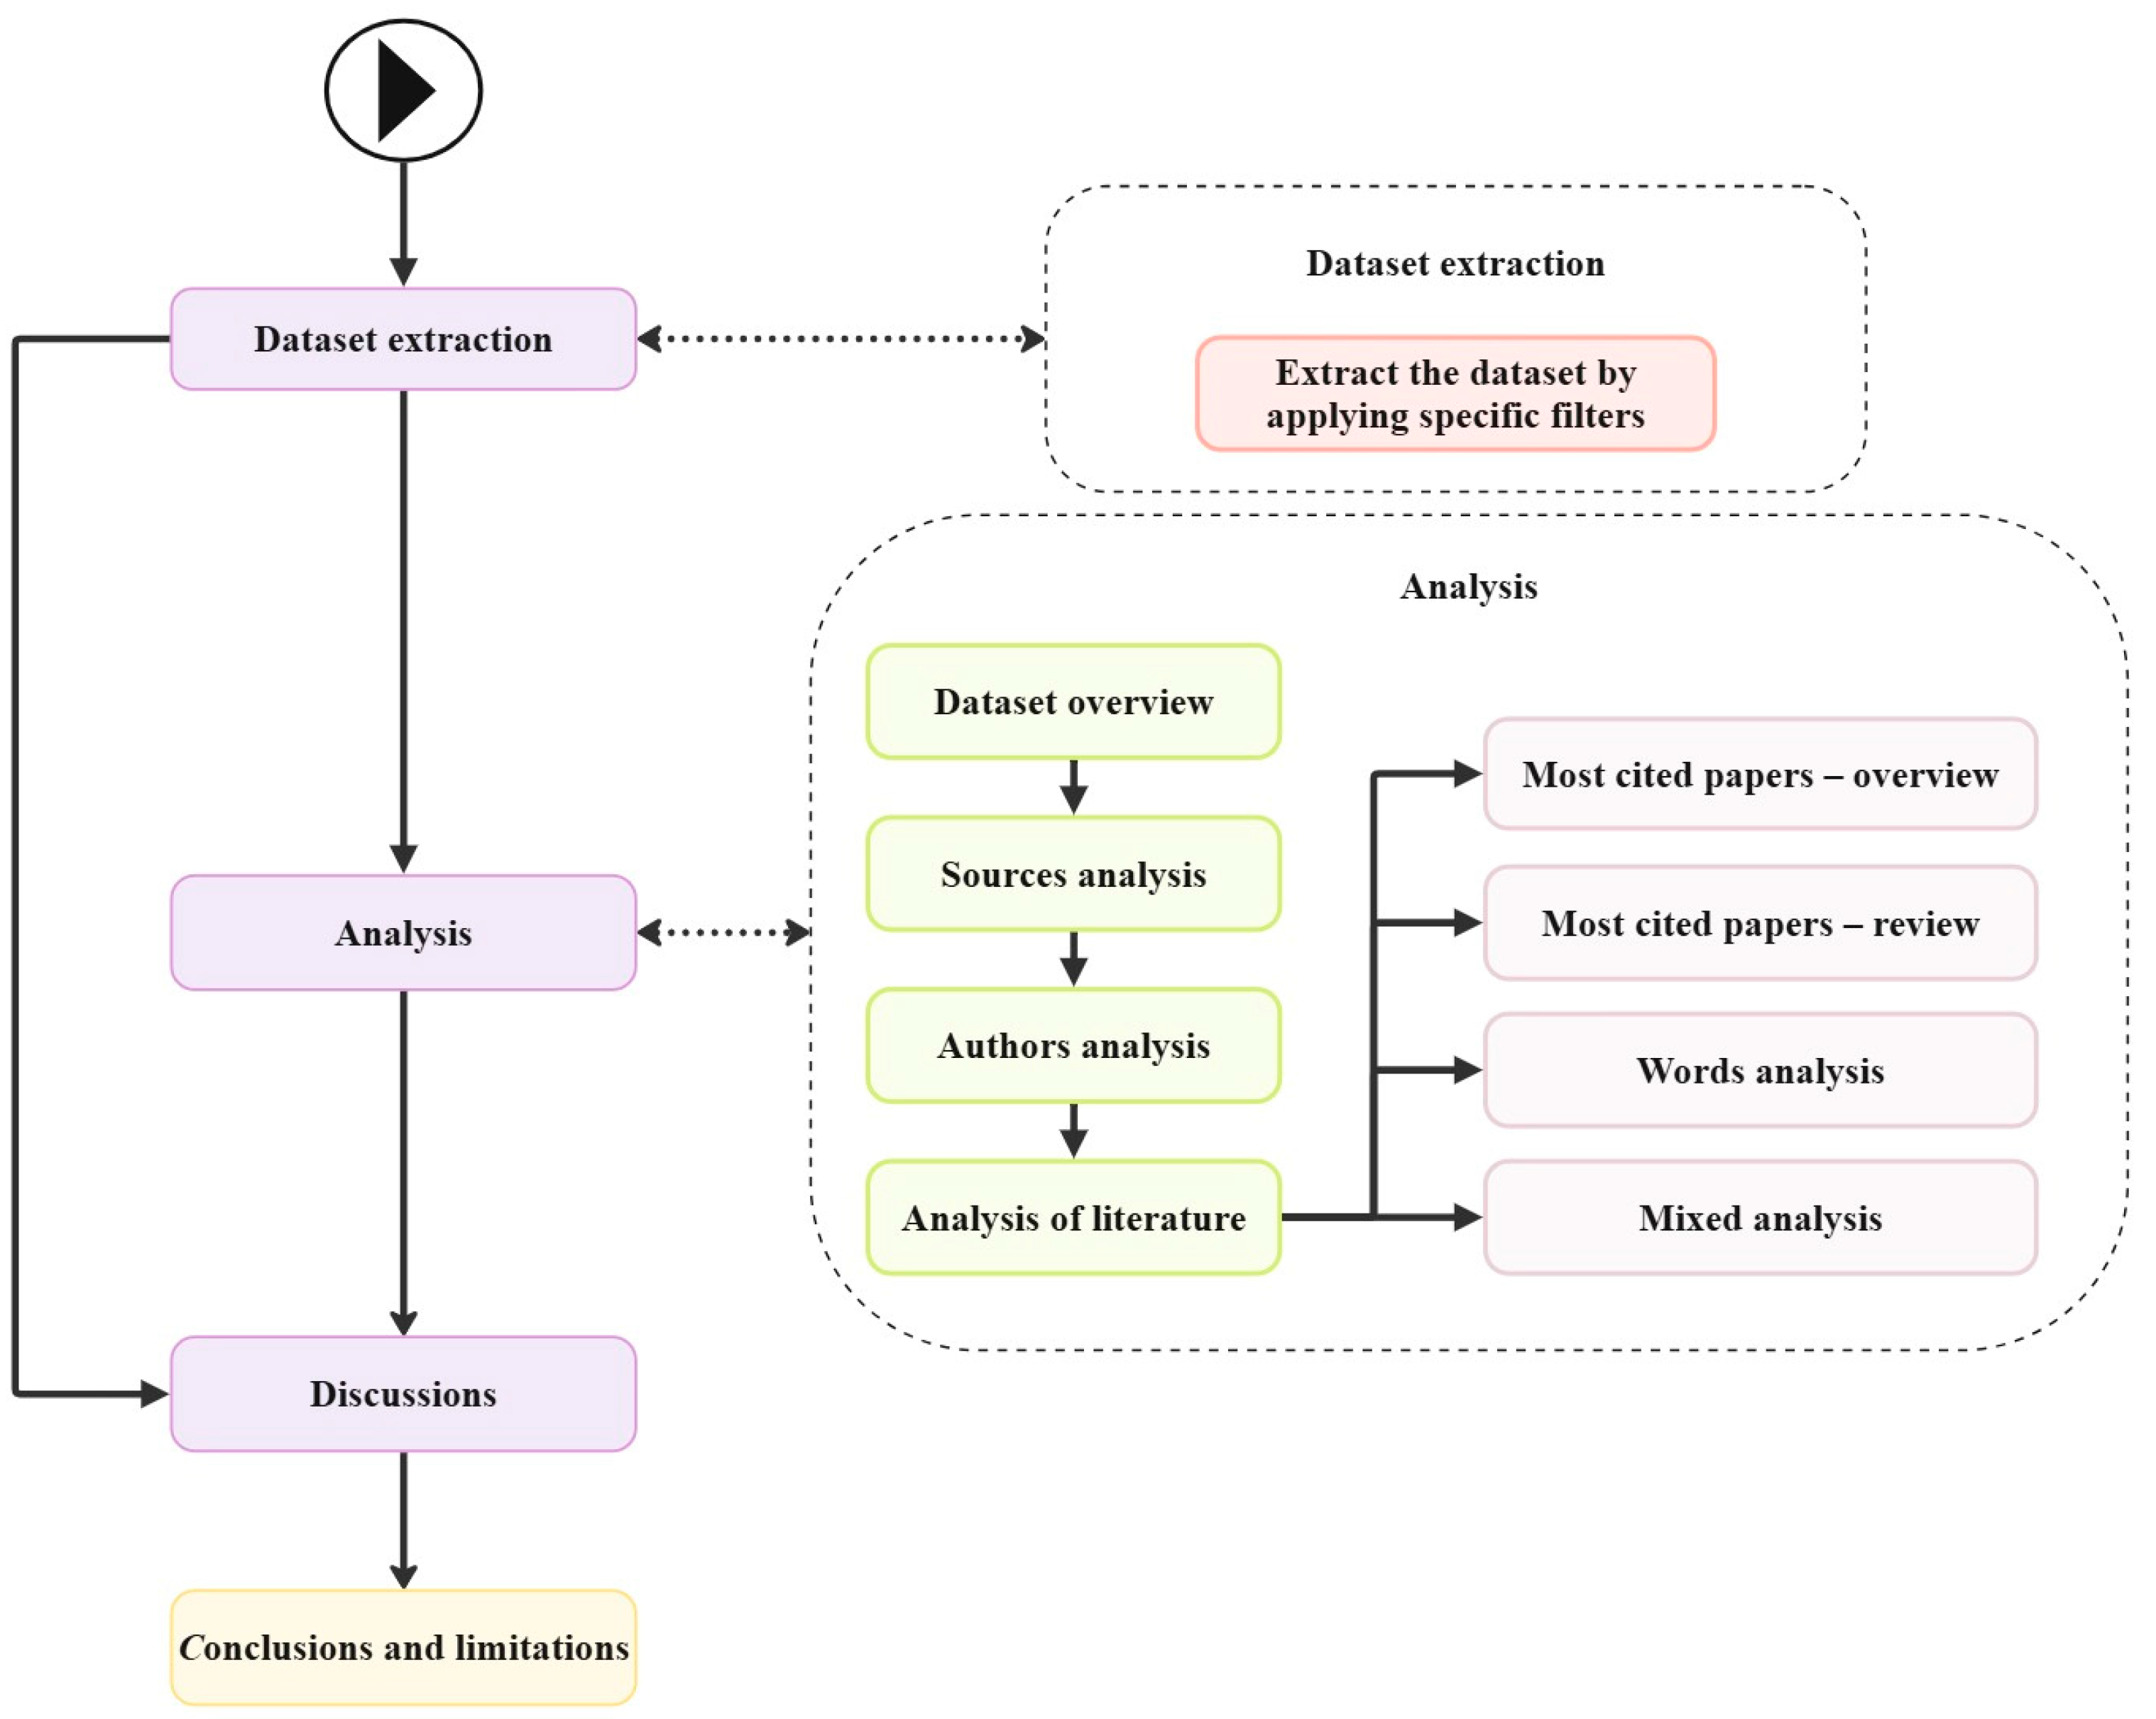
Figure 1. The steps considered in the analysis.
Sustainability 17 02952 g001
Figure 2. Annual scientific production evolution in MOOC dropout.
Sustainability 17 02952 g002
Figure 3. Annual average article citations per year evolution in MOOCs dropout.
Sustainability 17 02952 g003
Figure 4. Top 15 most relevant journals.
Sustainability 17 02952 g004
Figure 5. Bradford’s law on source clustering.
Sustainability 17 02952 g005
Figure 6. Journals’ impact based on H-index.
Sustainability 17 02952 g006
Figure 7. Journals’ growth (cumulative) based on the number of papers.
Sustainability 17 02952 g007
Figure 8. Top 15 authors based on number of documents.
Sustainability 17 02952 g008
Figure 9. Top 15 authors’ production over time.
Sustainability 17 02952 g009
Figure 10. Top 15 most relevant corresponding author’s country.
Sustainability 17 02952 g010
Figure 11. Scientific production based on country.
Sustainability 17 02952 g011
Figure 12. Top 15 countries with the most citations.
Sustainability 17 02952 g012
Figure 13. Country collaboration map.
Sustainability 17 02952 g013
Figure 14. Top 40 authors in the collaboration network.
Sustainability 17 02952 g014
Figure 15. Thematic map author’s keywords.
Sustainability 17 02952 g015
Figure 16. Thematic evolution.
Sustainability 17 02952 g016
Figure 17. Factorial analysis.
Sustainability 17 02952 g017
Figure 18. Three-fields plot: countries (left), authors (middle), journals (right).
Sustainability 17 02952 g018
Figure 19. Three-fields plot: affiliations (left), authors (middle), keywords (right).
Sustainability 17 02952 g019
Table 1. Summary of previous bibliometric and review research papers on MOOC dropout.
ReferenceFocus
Zong et al. [43]Outdoor education, highlighting the thematic transition from environmental governance to environmental education.
Hallinger et al. [44]Developing research on education for sustainable development in East Asia between 1991 and 2023.
Basheer et al. [45]Engaging higher education institutions in achieving the SDGs.
Dönmez [46]Sustainability in education, highlighting the increase in the number of publications and the shift in emphasis from environmental education to education for sustainable development.
Alghamdi et al. [47]Limitations of traditional models for predicting dropout in MOOCs and exploration of the use of advanced artificial intelligence methods to improve prediction accuracy and support effective interventions in online education.
Alsuhaimi and Almatrafi [48]Applying a transferable deep learning method for automatically classifying MOOC forum posts based on confusability indicators, thus improving student support and reducing dropout rates through early and personalized responses.
Luo and Li [49]Examination of the impact of academic and emotional support on the sustainable use of MOOC platforms in English language learning.
Swacha and Muszyńska [50]Use of demographic data to predict early student dropout in MOOCs, identifying factors such as age, educational level, student status, nationality and disability as predictors of dropout.
Table 2. Indexes used for WoS dataset.
Index NamePeriod
Science Citation Index Expanded (SCIE)1900–present
Social Sciences Citation Index (SSCI)1975–present
Emerging Sources Citation Index (ESCI)2005–present
Arts & Humanities Citation Index (A&HCI)1975–present
Conference Proceedings Citation Index—Social Sciences and Humanities (CPCI-SSH)1990–present
Conference Proceedings Citation Index—Science (CPCI-S)1990–present
Book Citation Index—Science (BKCI-S)2010–present
Book Citation Index—Social Sciences and Humanities (BKCI-SSH)2010–present
Current Chemical Reactions (CCR-Expanded)2010–present
Index Chemicus (IC)2010–present
Table 3. Dataset selection.
Exploration StepsFilters on WoSDescriptionQueryQuery NumberCount
1Title/Abstract/KeywordsContains specific keywords related to MOOCs((TI=(MOOC*)) OR AB=(MOOC*)) OR AK=(MOOC*)#18443
Contains specific keywords related to dropout((TI=(dropout)) OR AB=(dropout)) OR AK=(dropout)#232,480
Contains specific keywords related to MOOCs and dropout#1 AND #2#3455
2LanguageLimited to English(#13) AND LA=(English)#4432
3Document TypeLimited to Articles(#14) AND DT=(Article)#5212
4Year publishedExcludes 2024(#15) NOT PY=(2024)#6193
Table 4. Main information about data and document contents.
IndicatorValue
Timespan2013:2023
Sources101
Documents193
Average citations per documents19.68
References6560
Keywords plus255
Author’s keywords573
Table 5. Authors.
Table 5. Authors.
IndicatorValue of the Indicator
Authors566 authors
Authors of single-authored documents20 authors
Authors of multi-authored documents546 authors
Table 6. Author collaboration.
IndicatorValue of the Indicator
Single-authored documents21 documents
Documents per author0.34 documents/author
Authors per document2.93 authors/document
Co-authors per documents3.45 co-authors/document
Table 7. Top 15 most relevant affiliations.
AffiliationsArticlesPercentage
Beijing Normal University115.70%
Cadi Ayyad University of Marrakech63.11%
Harvard University52.59%
IBN Tofail University of Kenitra52.59%
Texas Tech University52.59%
Mohammed V University in Rabatg42.07%
Cadi Ayyad University of Marrakech42.07%
Guilin University of Electronic Technology42.07%
Central China Normal University42.07%
Northwest University Xi’an42.07%
Texas Tech University System42.07%
Universidad Carlos III de Madrid31.55%
Abdelmalek Essaadi University of Tetouan31.55%
Chulalongkorn University31.55%
Nanjing Agricultural University31.55%
Table 8. Top 10 most global cited documents.
No.Paper (First Author, Year, Journal, Reference)Number of AuthorsRegionTotal
Citations (TC)
TC per
Year (TCY)
Normalized
TC (NTC)
1Xing WL, 2016, Computers in Human Behavior [111] 4USA15717.442.93
2Dai HM, 2020, Computers & Education [113]4China14729.406.10
3Xing WL, 2019, Journal of Educational Computing Research [114]2USA13322.175.53
4Tsai YH, 2018, Computers & Education [115]4Taiwan12417.714.27
5Henderikx MA, 2017, Distance Education [116]3Netherlands9712.131.88
6Eriksson T, 2017, Journal of Computing in Higher Education [117]3Sweden9712.131.88
7Aldowah H, 2020, Journal of Computing in Higher Education [24]4United Kingdom8717.403.61
8Almatrafi O, 2018, Computers & Education [19]3USA8712.432.99
9Sunar AS, 2017, IEEE Transactions on Learning Technologies [118]4United Kingdom, Asia8510.631.64
10Moreno-Marcos PM, 2020, Computers & Education [90]6Spain, Chile7815.603.24
Table 9. Brief summary of the content of top 10 most globally cited documents.
No.Paper (First Author, Year, Journal, Reference)TitleMethods UsedDataPurpose
1Xing WL, 2016, Computers in Human Behavior [111]Temporal predication of dropouts in MOOCs: Reaching the low hanging fruit through stacking generalizationMachine learning methods, principal components analysis14 discussion forums and 12 multiple-choice quizzes, gathered from a course that had 3617 students enrolledTo create a mechanism to identify students at risk of dropping out as accurately as possible
2Dai HM, 2020, Computers & Education [113]Explaining Chinese university students’ continuance learning intention in the MOOC setting: A modified expectation confirmation model perspectiveExpectation confirmation model, structural equation modeling, confirmatory factor analysis192 Chinese students were recruited as participants to complete a questionnaireTo identify and explore the factors that influence students to continue MOOC studies
3Xing WL, 2019, Journal of Educational Computing Research [114]Dropout Prediction in MOOCs: Using Deep Learning for Personalized InterventionTechniques of deep learning,
K-nearest neighbors, support vector machines, anddecision tree, baseline algorithms
3617 students participants in a course organized by Canvas. JSON data for test scores or discussion form data, as well as trace or click-stream dataTo optimize a MOOC dropout prediction model customized to intervention
4Tsai YH, 2018, Computers & Education [115]The effects of metacognition on online learning interest and continuance to learn with MOOCsFirst order confirmatory factor analysis, structural equation modelingData were collected from a total of 126 respondentsTo create a unified model that combines both learning interest and metacognition to investigate MOOCs’ continuance intention
5Henderikx MA, 2017, Distance Education [116]Refining success and dropout in massive open online courses based on the intention–behavior gapThe traditional approach tracking course success ratesData were collected using two questionnaires (before and after the course) completed by the participants of two MOOCs. The first questionnaire had a total of 689 respondents, subsequently completed by 163 respondents, and the second questionnaireinitially had 821 respondents and subsequently had 126 respondentsThe aim was to test the applicability of the typology by conducting an exploratory study
6Eriksson T, 2017, Journal of Computing in Higher Education [117]“Time is the bottleneck”: a qualitative study exploring why learners drop out of MOOCsQualitative case study approachApplication of semi-structured interviews, on a total of 34 learners who recorded different degrees of course completion for two MOOCsTo identify the reasons that influence participants to both complete and abandon the MOOC
7Aldowah H, 2020, Journal of Computing in Higher Education [24]Factors affecting student dropout in MOOCs: a cause and effect decision-making modelMulti-criteria decision-makingIdentification of 12 factors from the literatureTo find the underlying factors and possible causal relationships that are responsible for the rather high dropout rate in MOOCs
8Almatrafi O, 2018, Computers & Education [19]Needle in a haystack: Identifying learner posts that require urgent response in MOOC discussion forumsLinguistic inquiry and word count, metadata, term frequency, classification methods and sampling groupsThe Stanford MOOCPosts dataset (with a large number of
posts—29,604. 29,584, after excluding posts with insignificant information
To create a model that is able to identify posts of an urgent nature that need the immediate attention of the coordinator
9Sunar AS, 2017, IEEE Transactions on Learning Technologies [118]How Learners’ Interactions Sustain Engagement: A MOOC Case StudySocial network analysis techniques, prediction modelDiscussions in a FutureLearn MOOC, which had a total of 9855 registered learnersTo investigatet the social behaviors learners exhibit in MOOCs and what the impact of engagement is in terms of course completion
10Moreno-Marcos PM, 2020, Computers & Education [90]Temporal analysis for dropout prediction using self-regulated learning strategies in self-paced MOOCsPredictive models, self-regulated learningQuestionnaire for MOOC participants on Electronics, named
“Electrons in Action”, Open edX platform
To explore how self-regulated learning (SRL) strategies can be integrated into predictive models for self-paced MOOCs; it also introduces a new temporal analysis methodology for self-paced MOOCs aimed at early detection of learners at risk of dropout
Table 10. Top 10 most frequent words in keywords plus and authors’ keywords.
Keywords PlusOccurrences Keywords PlusAuthors KeywordsOccurrences Authors Keywords
students31mooc/moocs103
engagement19dropout prediction21
motivation18massive open online courses21
education15machine learning20
performance15dropout19
online13learning analytics11
model12online learning11
motivations10deep learning10
open online courses10distance education9
participation10e-learning9
Table 11. Top 10 most frequent bigrams in abstracts and titles.
Bigrams in AbstractsOccurrencesBigrams in TitlesOccurrences
dropout rate/rates160dropout prediction29
online courses137online courses20
moocs92mooc dropout14
dropout prediction54student dropout11
online learning54machine learning9
machine learning43mooc learners8
student dropout30deep learning7
neural network29data mining5
completion rates24discussion forums5
continuance intention24continuance intention5
Table 12. Top 10 most frequent trigrams in abstracts and titles.
Trigrams in AbstractsOccurrencesTrigrams in TitlesOccurrences
online courses mooc/moocs97mooc dropout prediction10
machine learning algorithms14student dropout prediction6
dropout prediction model12mooc discussion forums3
convolutional neural network/networks16online courses moocs3
structural equation modeling8self-regulated learning strategies3
low completion rates6Chinese university students2
neural network model6convolutional neural networks2
self-regulated learning srl6deep learning model2
student dropout prediction6dropout prediction model2
accuracy precision recall5educational data mining2
Disclaimer/Publisher’s Note: The statements, opinions and data contained in all publications are solely those of the individual author(s) and contributor(s) and not of MDPI and/or the editor(s). MDPI and/or the editor(s) disclaim responsibility for any injury to people or property resulting from any ideas, methods, instructions or products referred to in the content.