1. Introduction
It is well recognized that climate change has significant impacts on the society, environment, and economy. Indeed, in the last few decades we have witnessed strong efforts worldwide to control carbon emissions in order to mitigate climate change and its related impacts. In recent years, China has produced a large number of policies and has made remarkable achievements towards its carbon peak goal. Its carbon emission intensity has continued to decline [
1]. China’s carbon emission intensity dropped by 48.4% in 2020 compared with the 2005 level. The proportion of coal in the total energy consumption of China declined from 72.4% in 2005 to 56.0% in 2021. In 2023, China’s energy intensity decreased by 0.5% compared with 2022, and its carbon emission intensity remains at a similar level [
2]. Despite the declining carbon emission intensity in China, its total carbon emissions continue to rise. In addition, the spatial distribution of its carbon emissions is unbalanced, with a tendency to concentrate in less-developed regions [
3].
Compared to other major economies, China’s carbon reduction efforts demonstrate both opportunities and challenges. The European Union has established a comprehensive policy framework, including the Emissions Trading System (ETS), stringent renewable energy targets, and clear sector-specific pathways. The United States, whilst less centralized in its climate policies, has made significant advancements in renewable energy technologies and state-level initiatives. Japan has focused heavily on improving energy efficiency across industries and developing a hydrogen-based economy. Policies such as the Top Runner Program, which mandates efficiency improvements in appliances and industrial processes, have contributed to significant reductions in energy intensity. Meanwhile, Japan is pioneering green hydrogen production and infrastructure that China can learn from. However, China’s approach differs from these economies as it places emphasis on balancing rapid industrialization with emission reduction goals. China has prioritized coal-to-clean energy transitions, investing heavily in renewable energy capacity expansion, electric vehicle adoption, and large-scale afforestation projects. In the EU, market-based mechanisms like carbon pricing and cap-and-trade systems are key drivers of emission reductions. In contrast, China has relied more on centralized industrial policies, large-scale infrastructure investments, and provincial-level emission reduction mandates. US and Japan have made breakthroughs in renewable technologies and private sector-led decarbonization. On the contrary, China leads in renewable energy deployment, with the largest installed capacity of solar, wind, and hydroelectric power globally. Its key challenges include managing regional disparities in emissions, reducing coal dependency, and integrating advanced carbon reduction technologies such as smart grids and carbon capture, utilization, and storage (CCUS) [
4,
5]. In addition, total carbon emissions continue to rise, and their spatial distribution remains highly uneven, with emissions increasingly concentrated in less-developed regions. These disparities call for tailored carbon reduction strategies to ensure sustainable and equitable transitions across provinces and municipalities.
Despite the progress, notable gaps remain in the understanding of the dynamics of achieving carbon peaking in China. The existing research predominantly focuses on either the national or the regional level, often neglecting the interplay between macro- and micro-level factors. As a result, it remains unclear how national policies interact with localized factors such as urbanization rates, industrial structures, and demographic trends. Furthermore, existing studies employ inconsistent variable selection, methodologies, and scenario settings to predict carbon peaks in different provinces and municipalities. Some emphasize urbanization and economic growth, while others focus on technological progress or energy consumption structures. This has led to fragmented insights that are difficult to compare or generalize. These limitations underscore the need for a unified framework capable of addressing the heterogeneity of carbon emissions and governance across regions.
This study aims to fill this critical knowledge gap by developing an innovative framework that systematically analyzes carbon peaking dynamics at both the macro and micro level. It seeks to answer key research questions, including the following: (1) What are the primary drivers influencing carbon emissions in different provinces and municipalities in China? (2) How do urbanization, economic development, and industrial transformation impact regional carbon peaking trajectories? (3) Which carbon peaking scenario is most suitable for each province and municipality, considering their unique economic, industrial, and energy structures? (4) How can policymakers formulate differentiated and adaptive carbon reduction strategies based on scientific projections? By addressing these questions, this research contributes to a more holistic and practical understanding of China’s pathway to carbon peaking. It provides an analytical foundation to design effective, region-specific carbon policies that balance economic growth and emission reduction goals.
An extended STIRPAT model is developed in this study. The model incorporates consistent variables, including urbanization rate, per capita GDP, population size, technological progress, and the proportion of the tertiary industry, to comprehensively capture the diverse drivers of carbon emissions. Furthermore, a scenario-based analysis is introduced in this research that is aligned with China’s ”14th Five-Year Plan for National Economic and Social Development of the People’s Republic of China and the Outline of Long-term Goals for 2035” (referred to as the “14th Five-Year Plan”) and long-term development objectives, enabling the systematic prediction and comparison of carbon peaking trajectories across provinces and municipalities. By employing standardized variable selection and scenario settings, this approach ensures comparability and practical applicability across different regions.
The findings of this study contribute to both theory and practice. From a theoretical perspective, this study enhances predictive accuracy by introducing a standardized, multi-level analytical framework that systematically evaluates the key drivers of carbon emissions at both the macro and micro levels. By incorporating consistent variable selection and scenario settings, this approach enables comparability across different provinces and municipalities, allowing for a more refined, data-driven understanding of carbon peaking trajectories. This theoretical innovation provides empirical evidence to support the development of more accurate and scalable carbon peaking models, helping to bridge the existing gaps in fragmented regional and national studies. From a practical perspective, this research offers concrete insights for policymakers. This enables the formulation of region-specific, adaptive carbon peaking strategies that take into account each province’s economic structure, industrial composition, and energy reliance. By identifying the most suitable scenario for each province and municipality, the study provides a scientific basis for differentiated policy design, ensuring that carbon reduction strategies align with local economic and environmental conditions. Moreover, the integration of scenario-based analysis allows decision-makers to anticipate the impacts of different policy choices, enabling more effective and proactive interventions.
Beyond China, this study also holds global relevance by establishing a comparative and scalable framework that can be adapted to other developing and transition economies facing similar heterogeneity issues in carbon emissions and policy design. Many countries with regional economic disparities, energy transition challenges, and industrial transformation pressures can benefit from this approach and develop more targeted, data-driven climate policies. By addressing the interplay between macroeconomic policies and localized factors, this research not only advances the academic discourse on carbon peaking but also provides practical solutions that can inform global climate governance and sustainability strategies.
The structure of this paper is as follows:
Section 2 presents a literature review.
Section 3 presents the development of an extended STIRPAT model tailored to this study, along with its testing and analysis.
Section 4 predicts the progress of carbon peaking across provinces and cities under different scenarios and influencing factors. Finally,
Section 5 provides policy recommendations.
4. China’s Progress in Achieving Carbon Peak and Influencing Factors
It is a very complex process to achieve carbon peaking, as it is contingent upon a large number of factors. Meanwhile, there are significant differences in the factors and processes for achieving carbon peak goals in different regions. Achieving carbon peak in a region does not necessarily mean achieving carbon peak as a whole, and vice versa. Therefore, it is necessary to understand the mechanism of how these factors and processes affect the achievement of carbon peak.
4.1. The Factors Affecting Achievements of Carbon Peak at the National Level
A comprehensive analysis of the progress of achieving carbon peak and its influencing factors at the national level can help to better understand achieving carbon peak at the macro level, as well as the possibility of achieving carbon peak targets at the national level under different scenarios. This provides useful references for formulating carbon peak-related policies.
4.1.1. Scenario Design
Scenario analysis is a commonly used method in carbon emission prediction-related studies. The fundamental principle of the scenario analysis method is to set corresponding data for relevant indicators under different future development speed scenarios based on historical development conditions so that future carbon emissions can be predicted. The scientific nature of scenario design plays a crucial role in the accuracy of the forecast results. Based on the significance test results of carbon emission causality, urbanization rate, per capita GDP, population size, proportion of tertiary industry, and technological progress were selected as variables in this study, and scenario parameters were set for their changes [
22,
25,
26].
The main basis for setting the scenario parameters was that the proportion of the tertiary industry will reach the target of about 58%, as determined in the “14th Five-Year Plan”, and that the actual growth rates of the tertiary industry in 2021–2023 were 2.1%, 2.3%, and 5.8%, respectively. Taking into account the actual situation of China’s vigorous development of new quality productivity, after consulting relevant experts, this study assumed that the growth rate of China’s tertiary industry will increase by 4%, 5%, and 6%, respectively, in 2024–2025, 2026–2027, and 2028–2030; technological progress is closely related to a decline in carbon emission intensity. Carbon emission intensity was used in this study to represent the degree of technological progress. According to the goal of reducing carbon emission intensity by 65% by 2030 compared with 2005 in China’s 14th Five-Year Plan and the actual annual average decline of 3.4% in carbon emission intensity between 2012 and 2022, after consulting relevant experts, this study assumed that China’s carbon emission intensity will decrease by 3%, 3.5%, and 4%, respectively, between 2024–2025, 2026–2027, and 2028–2030. On this basis, this study focuses on the impacts of changes in urbanization rate, per capita GDP, and population size on achieving carbon peak.
Meanwhile, experts were consulted to consolidate the data. A total of 21 experts were consulted in this study. They were drawn from government authorities, industry associations, and top researchers. They were presented with the basic settings of scenario design in the first instance, and were consequently asked to provide feedback on the following: (1) the appropriateness of these scenarios and (2) the parameter settings in each scenario. These experts were asked to take both the current situation and future development into consideration.
Firstly, based on the national “14th Five-Year Plan” and the long-term goals of 2035, as well as the historical data of China’s urbanization rate, per capita GDP growth, and population size changes, the scenario parameters were set for the changes in China’s urbanization rate, per capita GDP, and population size from 2024 to 2030 (see
Table 5). Urbanization rate was chosen as a key classification factor for scenario design because it reflects investment trends, which are a fundamental driver of carbon emissions. From the perspective of carbon emission mechanisms, rapid investment growth, as indicated by increasing urbanization, often leads to significant resource consumption and environmental degradation, making investment the root cause of emissions in many cases. This is particularly relevant in the context of China’s rapid urbanization, which has resulted in challenges such as “empty cities” and “ghost towns”, where excessive real estate investment has caused unsold properties and drastic price reductions, highlighting the environmental and economic consequences of overinvestment. Moreover, urbanization impacts multiple dimensions of economic activity, including infrastructure development, industrial production, and energy consumption, making it a comprehensive indicator for analyzing carbon emissions rather than a single-factor variable.
Secondly, using the high-urbanization-rate-growth scenario (U1), the urbanization rate medium-growth scenario (U2), and the urbanization rate low-growth scenario (U3) unchanged scenarios, we calculated the changes in carbon emissions in different scenario combinations (see
Table 6), which analyzed and predicted the changes in China’s overall carbon emissions and the process of achieving carbon peaks. Finally, based on the prediction results, China’s carbon emissions were drawn under three different scenarios based on the high-urbanization-rate-growth scenario (U1), the medium-urbanization-rate-growth scenario (U2), and the low-urbanization-rate-growth scenario (U3) [
27,
28,
29,
30].
4.1.2. Scenario Results Analysis
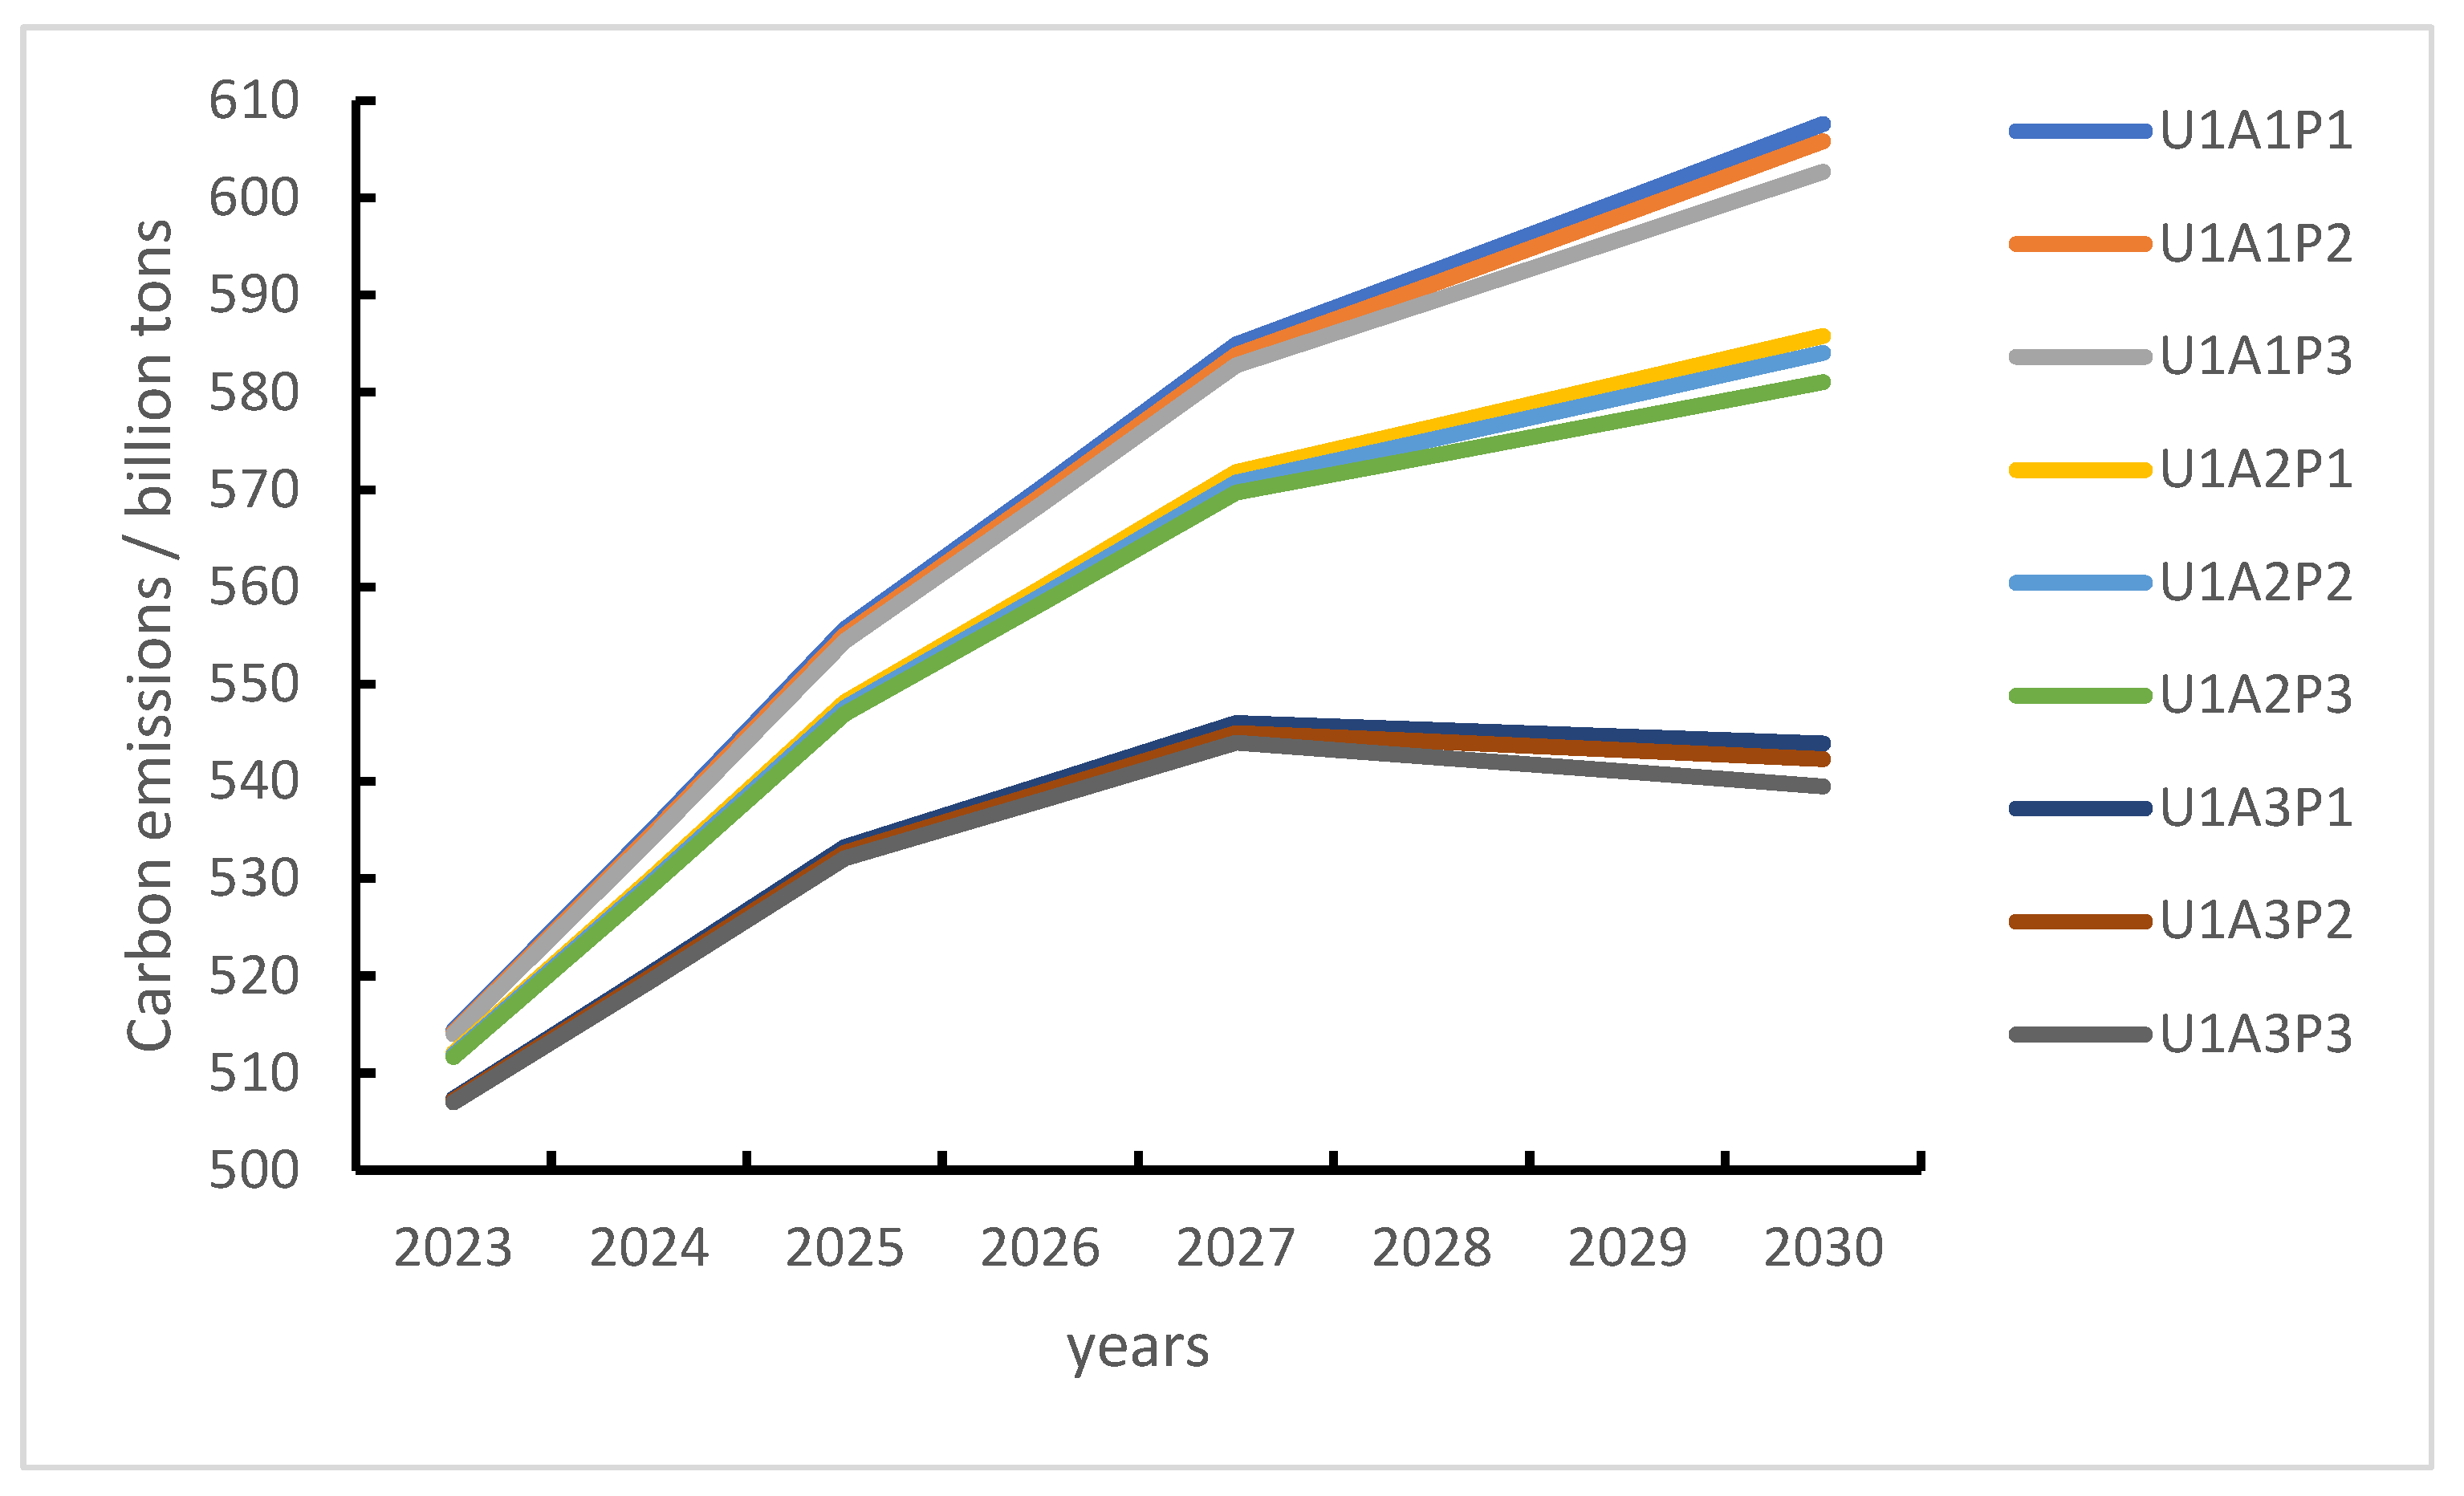
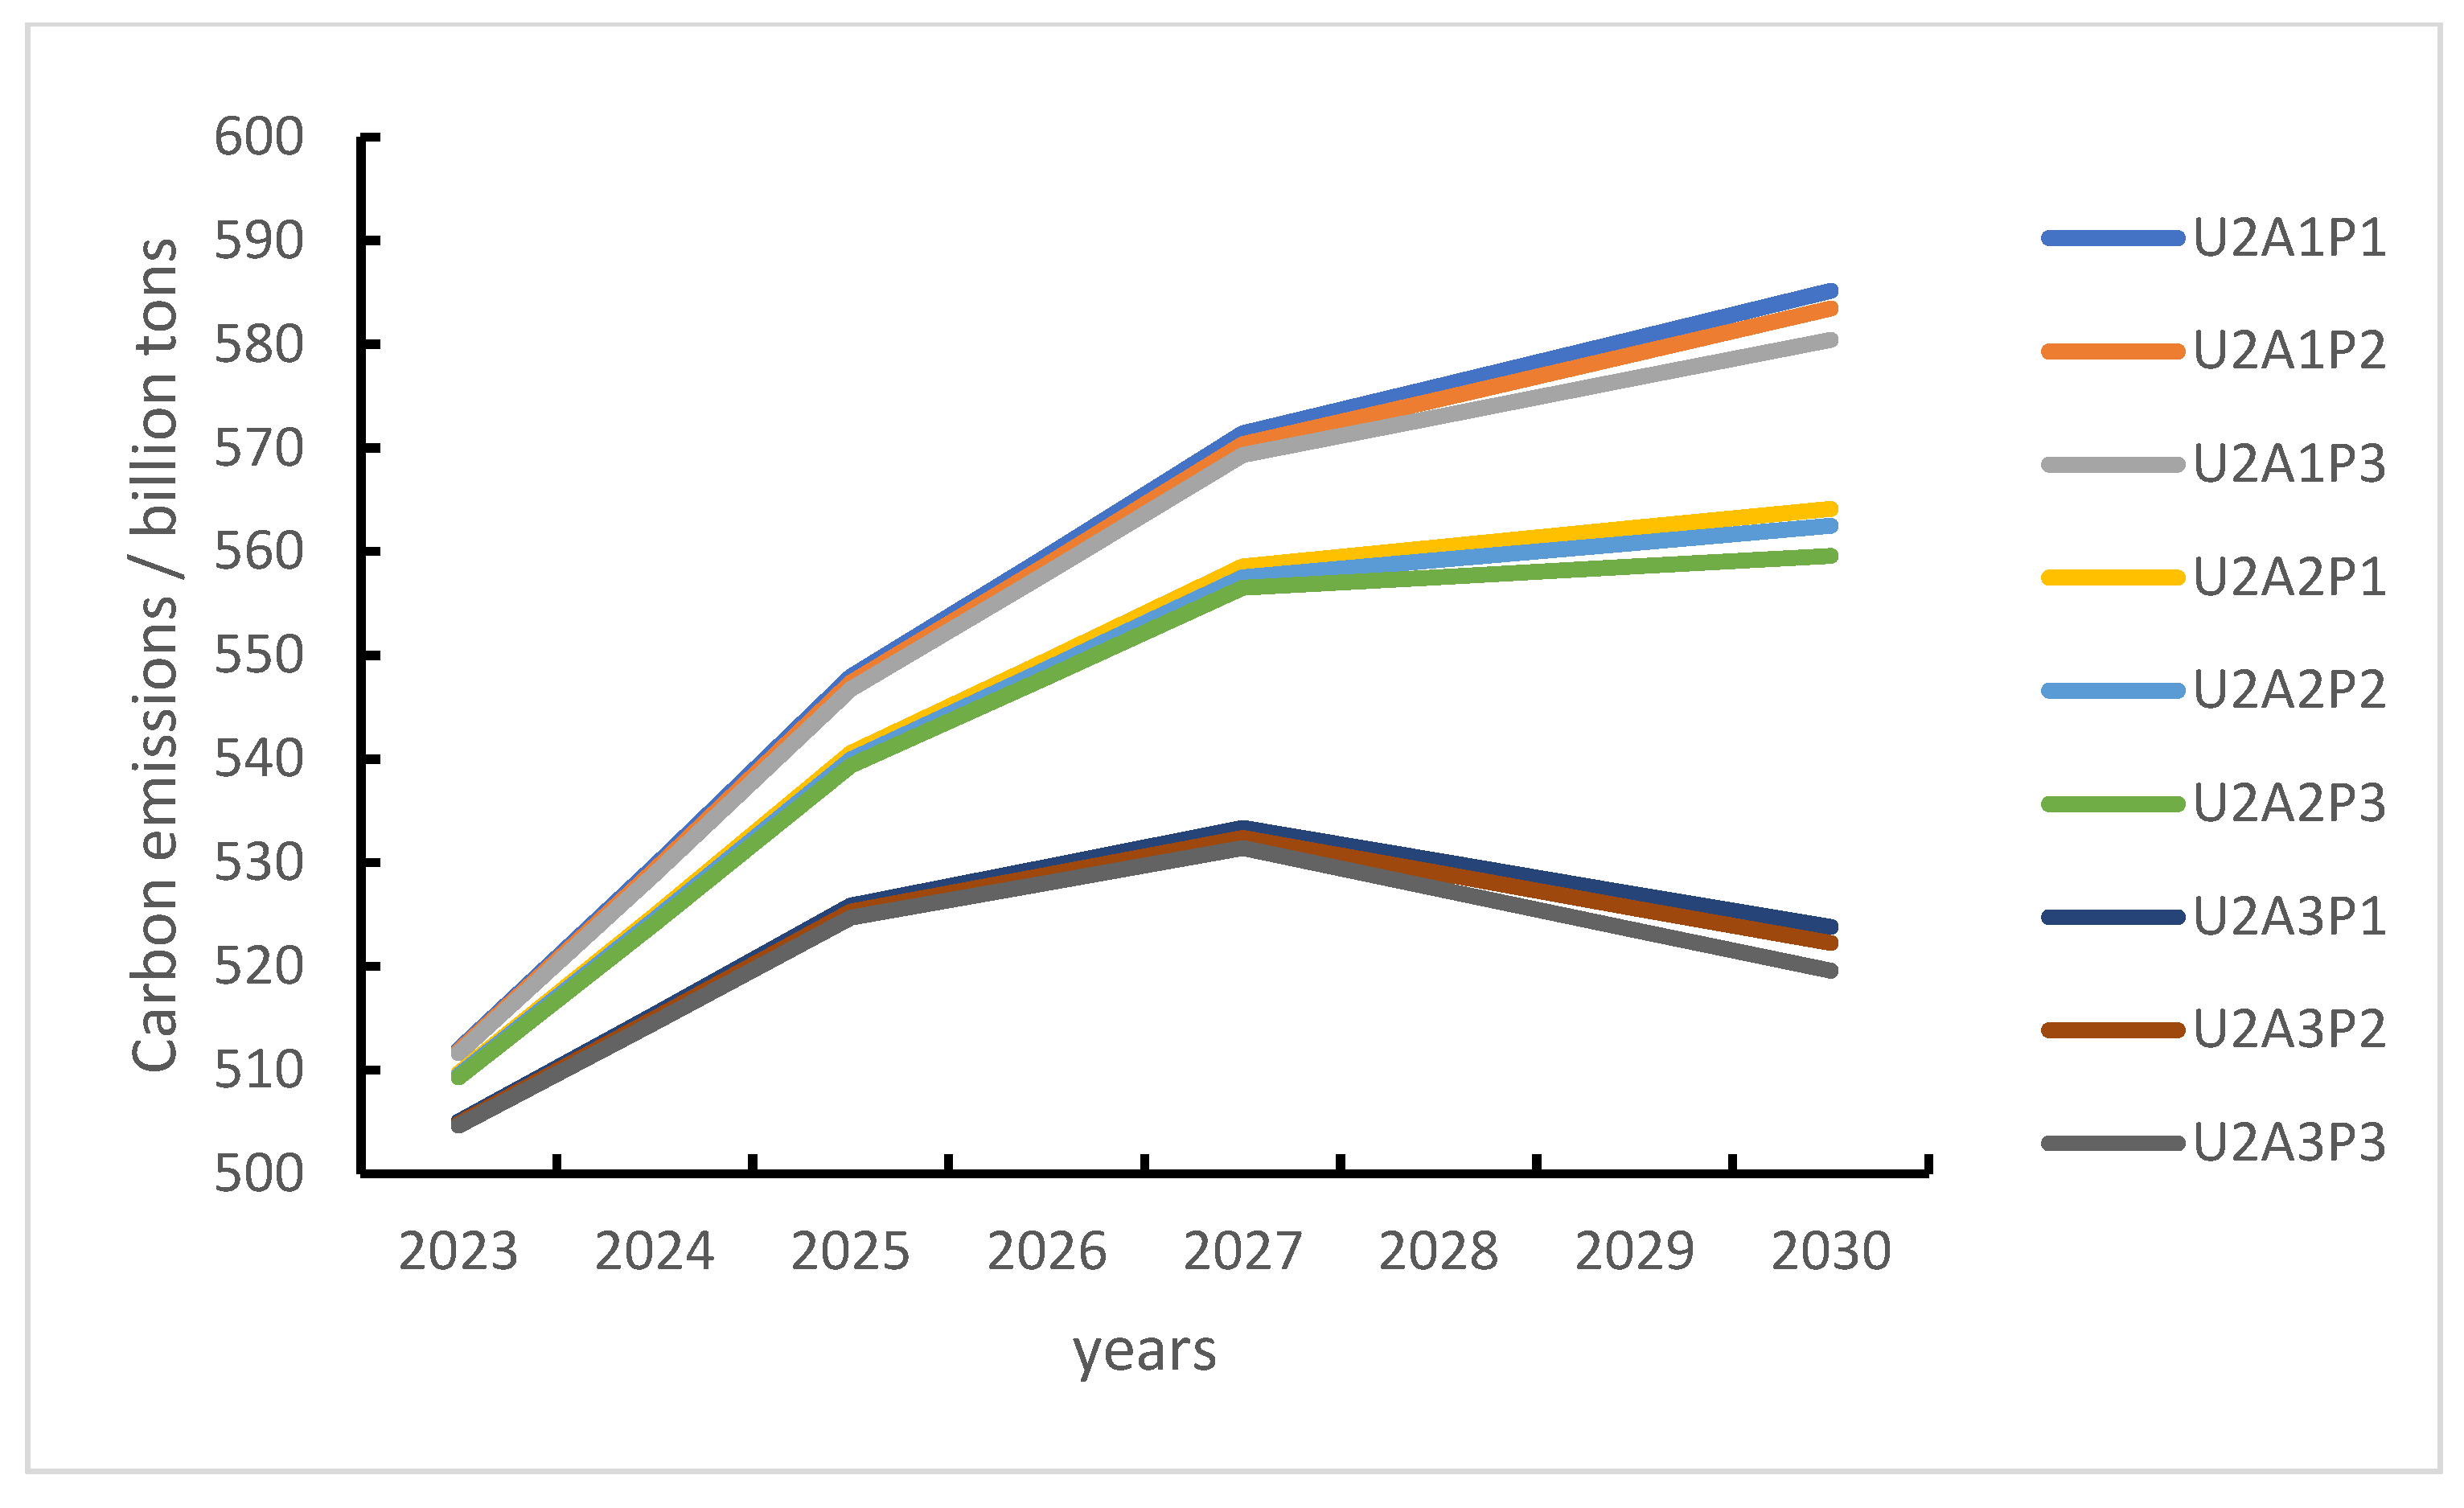
Substituting the scenario setting parameters into Formula (5), 27 different prediction results can be obtained. This paper took the high-urbanization-rate-growth scenario (U1), the medium-urbanization-rate-growth scenario (U2) and the low-urbanization-rate-growth scenario (U3) as the unchanged scenarios, calculated the changes in carbon emissions under different scenario combinations, and analyzed and predicted the changes in China’s overall carbon emissions. Based on the prediction results, this paper draws a carbon emission change diagram under three different scenarios, with the high-urbanization-rate-growth scenario (U1), the medium-urbanization-rate-growth scenario (U2) and the low-urbanization-rate-growth scenario (U3) as the background (see
Figure 1,
Figure 2 and
Figure 3).
As can be observed from
Figure 1, under the scenario of high urbanization rate growth and low per capita GDP growth, China can achieve the its peak goal prior to 2030, regardless of whether the population size is in a high-, medium- or low-growth scenario. Under other development models in the scenario of high urbanization rate growth, China will not be able to achieve its carbon peak. As can be seen from
Figure 2, under the scenario of medium urbanization rate growth, if China’s per capita GDP maintains a high-growth model, regardless of whether the population size is high, medium, or low, China cannot achieve carbon peak before 2030. Similarly, under other development models in the scenario of medium urbanization rate growth, China can achieve carbon peak. As can be seen from
Figure 3, under the scenario of low urbanization rate growth, China can achieve carbon peak before 2030, regardless of the development model adopted.
It can be seen that under different scenarios there are large differences in the degree of China’s realization of its carbon peak. Under normal scenarios, China can achieve carbon peak before 2030, and under some scenarios China will still experience certain difficulties in achieving carbon peak before 2030. The findings of this study showed that the main factors affecting the achievement of the carbon peak target in China are urbanization rate, per capita GDP, and population size. In particular, in the scenario where urbanization rate and per capita GDP grow at the same time, China cannot achieve the carbon peak target prior to 2030.
Therefore, the determination of development goals has to be scientific and reasonable. It is necessary to integrate the speed of development with quality and efficiency, rather than purely measuring the economic indicators such as GDP. In the process of selecting development goals, it is crucial to take a comprehensive approach, combining urbanization with rural revitalization and balancing economic development with environmental protection. Efforts are required to incorporate environmental governance and the realization of carbon peak goals into all stages and links of economic and social development. Under the background of maintaining stable and healthy economic development, it is paramount to jointly promote the realization of carbon peak goals and high-quality economic and social development [
31,
32]. Furthermore, there is an urgent need to further understand the dynamic relationship between environmental performance and economic and social development.
4.2. The Progress and Influencing Factors in Achieving Carbon Peak at the Provincial Level
This paper adopted the above method, selected the same variables and scenario parameter settings, and used the same standards and specifications to analyze the progress and influencing factors for achieving carbon peak in various provinces and municipalities in China [
33]. Under the general scenario, all provinces and municipalities in China can achieve carbon peak before 2030, and some provinces and municipalities can achieve carbon peak ahead of schedule. Under some scenarios, some provinces and regions still have certain difficulties in achieving carbon peak before 2030. According to the current prediction results, under the scenario of the high growth of all factors (U1A1P1), that is, the scenario of the rapid growth of urbanization rate, per capita GDP, and other factors, the Inner Mongolia Autonomous Region and Shanxi Province will experience certain difficulties in achieving carbon peak before 2030. Under other scenarios, the Inner Mongolia Autonomous Region and Shanxi Province can achieve their carbon peak targets. This indicates that China can achieve its carbon peak target before 2030, but it is necessary to attach great importance to the determination of development goals. If the development target is set too high, more resources will be consumed in order to achieve this target. As a result, more carbon emissions will be generated, and there will be a serious phenomenon of diminishing marginal efficiency. If the development target is set too low, it will not meet the residents’ growing spiritual and cultural needs, nor will it effectively promote China’s modernization. To scientifically and rationally determine the development target, it is necessary to solve the most prominent problems in economic and social development with a consideration of the provincial and national conditions.
Upon analyzing the optimal scenario selections from 2022 to 2030 across various provinces and cities in China, a clear trend emerges. Most provinces are more suitably aligned with the low-growth scenario of urbanization, GDP, and population (U3A3P3) for the majority of the period studied. By 2029 and 2030, however, there is a notable shift toward a scenario characterized by high urbanization combined with low GDP and population growth (U1A3P3). This trend reflects an adaptive adjustment in urban planning and development strategies, aiming to balance the demands of economic development and key factors of environmental sustainability. In the earlier years, provinces’ suitability for the U3A3P3 scenario may stem from considerations of environmental sustainability, namely controlling carbon emissions and resource consumption by limiting the speeds of urbanization, GDP, and population growth. This choice could be influenced by government policies encouraging low-growth strategies to meet national or regional carbon reduction targets. However, as time progresses, especially by 2029 and 2030, economic development pressures and urbanization needs grow, prompting provinces to align with the U1A3P3 scenario.
Furthermore, technological advancements may play a key role in this transition, enhancing energy efficiency and reducing the environmental impact of GDP growth, enabling provinces to manage carbon emissions effectively while increasing urbanization rates. To ensure that increased urbanization does not compromise carbon reduction goals, government and urban planning departments must reassess and refine urban development strategies, prioritizing the quality of urbanization and implementing measures to control emissions. This approach is essential for aligning urban expansion with long-term carbon neutrality objectives.
Although most provinces show a similar scenario preference pattern, some regions like Hebei, Shanxi, and Heilongjiang opted for a high-urbanization-rate scenario (U1A3P3) as early as 2022. These differences could be linked to each region’s economic development stage, industrial base, and governmental policies. For example, resource-based provinces might need to accelerate their urbanization earlier to foster economic transformation and upgrading.
In terms of the choice of the path to achieve carbon reduction targets, it is crucial to perform overall planning at the national level so that provinces and regions with low carbon reduction costs, high efficiencies, and strong comparative advantages can bear more carbon reduction tasks. Meanwhile, provinces and regions with high carbon reduction costs, low efficiencies, and weak comparative advantages can bear fewer carbon reduction tasks. This will help to coordinate the development of developed and underdeveloped regions and provide underdeveloped regions with more development opportunities. To effectively utilize technological advancements, regions with high carbon emissions should integrate digital technologies, renewable energy solutions, and energy efficiency measures into their carbon reduction strategies. Digital technologies can play a transformative role by enabling smarter energy use in urban environments, optimizing industrial processes through automation and data analytics, and enhancing the efficiency of transportation systems. Renewable energy technologies, such as solar and wind, should be aggressively deployed in these provinces to replace carbon-intensive energy sources. In addition, energy efficiency measures should be rigorously applied, particularly in buildings, industrial processes, and transportation sectors, to reduce the overall energy demand and associated emissions.
In the process of carbon emission reduction resource allocation, relevant authorities should adhere to the principle of common but differentiated carbon emission reduction responsibilities, optimize the allocation of carbon emission reduction resources, implement differentiated classification management for different provinces and municipalities to achieve carbon peak targets, and introduce targeted carbon emission reduction policies in response to the specific circumstances of different provinces and municipalities in achieving carbon peak targets. This will help to coordinate the overall progress of the national carbon peak target and achieve the Pareto optimality of resource allocation for carbon emission reduction across various municipalities and provinces of China.
5. Discussion and Conclusions
In recent years, China has been accelerating its progress in achieving its carbon peak target, with increasing efforts to reduce carbon emissions, and has achieved remarkable results in moving toward achieving its carbon peak target. However, due to the different situations in various provinces and municipalities in China, and the different factors affecting carbon emissions and carbon governance, there are also large differences in terms of the progress of achieving carbon peak in various provinces and municipalities.
Based on the classic IPAT model, an extended STIRPAT model was employed in this study o identify the main driving factors of China’s carbon emissions from 2000 to 2022. In addition to the three primary factors of carbon emissions in the IPAT model—population size, economic development, and technological progress—the extended model incorporated urbanization and the proportion of tertiary industry as influencing factors. A quantitative analysis of the impact mechanisms of various influencing factors during the 2000–2022 period in China was conducted. Scenario analysis was used to predict the progress of achieving carbon peaking in provinces and cities. The main conclusions are as follows:
This study revealed that urbanization rate, per capita GDP, and population size are important factors that affect carbon emissions. Meanwhile, the proportion of tertiary industry is negatively correlated with carbon emissions, and technological progress can promote the realization of carbon peak targets. The study revealed that China as a whole can achieve its carbon peak target by 2030, with some provinces likely to achieve this goal ahead of schedule. However, significant differences emerge under various scenarios. In a scenario of high urbanization growth and low per capita GDP growth, China can achieve its carbon peak target before 2030 regardless of population growth. Conversely, under a scenario of high urbanization growth combined with high per capita GDP growth, the carbon peak target becomes challenging to achieve, even if population growth is constrained. Similarly, when urbanization growth is moderate and per capita GDP grows rapidly, the target is still difficult to meet. In contrast, under scenarios of low or medium–low urbanization growth, China can reach its carbon peak target before 2030, regardless of changes in other variables.
At the regional level, provinces demonstrate varying capacities and policy needs in regard to achieving their carbon peak targets. Most provinces are likely to reach the target under general scenarios, with some achieving it ahead of schedule. However, in certain extreme scenarios, specific regions may still face challenges. These findings underscore that while China as a whole can meet its carbon peak target by 2030, there are significant regional differences in progress and the challenges faced during the process.
Our analysis of the optimal scenario selections for Chinese provinces and cities revealed that cities are more suitably aligned with specific scenarios that result in lower carbon emissions. This alignment suggests that provinces are not just passively selecting scenarios but actively engaging with those that align with their unique environmental, economic, and demographic contexts. For instance, most provinces have shown a preference for the U3A3P3 scenario from 2022 to 2028, which suggests a suitability for scenarios that emphasize low urbanization, low GDP growth, and low population growth. This preference shifts to the U1A3P3 scenario by 2029 and 2030, indicating a shift towards higher urbanization rates while maintaining low GDP- and population-growth rates. This nuanced understanding of scenario suitability provides a foundational basis for regional policy differentiation, allowing for tailored approaches that reflect the specific needs and capacities of each province and city. For example, high-emission, coal-reliant provinces (e.g., Shanxi, Inner Mongolia, Xinjiang) are heavily dependent on fossil fuel industries and require stringent coal phase-out policies, financial subsidies for clean energy transition, and targeted industrial restructuring programs. A gradual yet enforceable decarbonization roadmap is essential to minimize economic disruptions. But rapidly urbanizing coastal provinces (e.g., Guangdong, Zhejiang, Jiangsu) have high energy demands due to industrial activity and urban expansion, necessitating strict building energy efficiency regulations, investment in smart grids, and enhanced carbon pricing mechanisms to incentivize sustainable urban development. In addition, provinces with advanced service economies (e.g., Beijing, Shanghai, Tianjin) are better positioned to reach carbon peaking ahead of schedule due to their growing reliance on the tertiary sector. Future policies should focus on expanding green finance, digital transformation, and AI-driven energy management to further optimize their low-carbon transition. Less-developed regions with slow economic growth (e.g., Guizhou, Yunnan, Gansu) will have to deal with challenges in balancing economic development and carbon reduction. These regions require stronger financial support, technology transfer programs, and infrastructure improvements to prevent economic stagnation while ensuring carbon peaking is achieved.
This study revealed that although China as a whole can achieve its carbon peak target before 2030, there are large differences between different scenarios and different provinces and municipalities. Therefore, it is necessary to implement a regional, differentiated, and precise ecological and environmental management system, improve the ecological and environmental monitoring and evaluation system, and improve the national ecological security coordination mechanism in accordance with national policies and strategies. It is crucial to carry out the differentiated management of carbon peak targets in different provinces and municipalities, establish a coordination mechanism, and ensure that the carbon peak targets are achieved under the background of economic growth. To this end, the following policy recommendations are put forward.
First, a focus should be placed on key factors. Urbanization rate, per capita GDP, population size, and the proportion of tertiary industry are key factors that affect carbon emissions. Among them, urbanization rate, per capita GDP, and population size have a positive impact on carbon emissions, while the proportion of tertiary industry has a negative impact on carbon emissions. Therefore, it is paramount to steadily advance the urbanization process, organically combining urbanization with rural revitalization strategies. At the same time, it is necessary to develop new quality productivity, develop emerging industries, transform traditional industries with digital technology, promote the transformation and upgrading of industrial structures, continuously improve energy efficiency, and reduce carbon emissions. However, several challenges exist in the implementation of these policies. Local governments often face capacity constraints, including limited financial resources, a lack of technical expertise, and administrative inefficiencies, which can slow down the adoption of low-carbon strategies. Similarly, businesses may be reluctant to transition due to high initial investment costs, particularly in energy-intensive and coal-dependent industries. Public participation in carbon reduction efforts also varies across regions, with more environmentally conscious behaviors in developed urban areas than in rural or industrial regions. To address these challenges, the government should enhance fiscal support, provide capacity-building programs for local administrations, offer tax incentives for businesses adopting green technologies, and strengthen public awareness campaigns to encourage sustainable behavioral.
Second, a focus should be placed on key areas. According to the findings of this study, China’s provinces and regions differ in resource endowments, industrial structures, carbon emission intensity, and carbon governance capacity, necessitating differentiated carbon reduction strategies. Therefore, it is recommended that the relevant authorities could conduct a comprehensive analysis of the national carbon emissions and carbon reduction performance, adopt differentiated carbon reduction policies based on the specific conditions of different provinces and regions, and introduce specific policy measures for key provinces and regions to facilitate breakthroughs. Efforts need to be made to avoid adopting “one-size-fits-all” policies to reduce carbon emissions in each province/region. For example, highly urbanized provinces (e.g., Guangdong, Jiangsu, Zhejiang) should focus on sustainable urban development, smart city initiatives, and stricter building energy codes, while coal-dependent regions (e.g., Shanxi, Inner Mongolia) require strict coal phase-out policies, renewable energy expansion, and carbon capture and storage (CCS) adoption. Industrial hubs (e.g., Hubei, Sichuan) should prioritize green manufacturing and energy efficiency improvements, whereas service-driven cities (e.g., Beijing, Shanghai) can accelerate green finance, AI-driven carbon management, and low-carbon investments. Provinces with high renewable energy potential (e.g., Qinghai, Gansu, Tibet) should receive targeted investment in solar, wind, and hydropower, along with grid modernization. To support a coordinated transition, national and regional policies should strengthen carbon pricing mechanisms, expand emission trading markets, and leverage AI-powered monitoring systems for real-time emissions tracking. These tailored approaches would ensure that China’s carbon peaking efforts align with each region’s economic, environmental, and industrial realities, maximizing the efficiency and effectiveness of carbon reduction strategies.
Third, a focus should be placed on overall coordination. According to the findings of this study, there are large differences in the degree of carbon peak achieved by different combinations under different scenarios. This requires the relevant government authorities to systematically plan and coordinate development goals, optimize resource allocation, improve resource allocation efficiency, and take comprehensive measures to minimize carbon emissions on the premise of ensuring high-quality economic and social development.
Fourth, a focus should be placed on policy improvement. Achieving the “dual carbon” goal is largely contingent upon innovation and policy support. A key challenge in policy implementation is that carbon reduction policies are often reactive rather than proactive, i.e., responding to crises rather than integrating long-term predictive planning models. This requires the relevant authorities to have a mechanism in place to evaluate the performance of existing carbon emission-related policies so that improvements can be made in a continuous manner. This feedback could be sought from industries so that a closed-loop system can be achieved.
It is worth noting that the findings of this study are the results of calculations under specific conditions and predictions may change if conditions shift. Therefore, ongoing monitoring needs to be performed in a regular manner in order to understand the heterogeneity issues within a country or region. The corresponding measures can then be introduced. In terms of the selection of influencing factors, this paper selected the same variables and scenario settings in the process of predicting the carbon peak in different provinces and municipalities. The biggest advantage of this model is that it can use unified standards and scales to measure the progress of different provinces and municipalities toward achieving carbon peak. This can help decision-makers to better understand the progress of different provinces and municipalities in achieving carbon peak from a macro-level perspective. Future research could further refine provincial-level predictions by incorporating diverse scenario settings.


