
The Regulatory Effect of Government Fiscal Intervention on Carbon Reduction—A System Analysis Based on Economy–Energy–Environment


Abstract
1. Introduction
2. Literature Review
2.1. Factors Influencing Carbon Emissions
2.2. Duality of Government Intervention
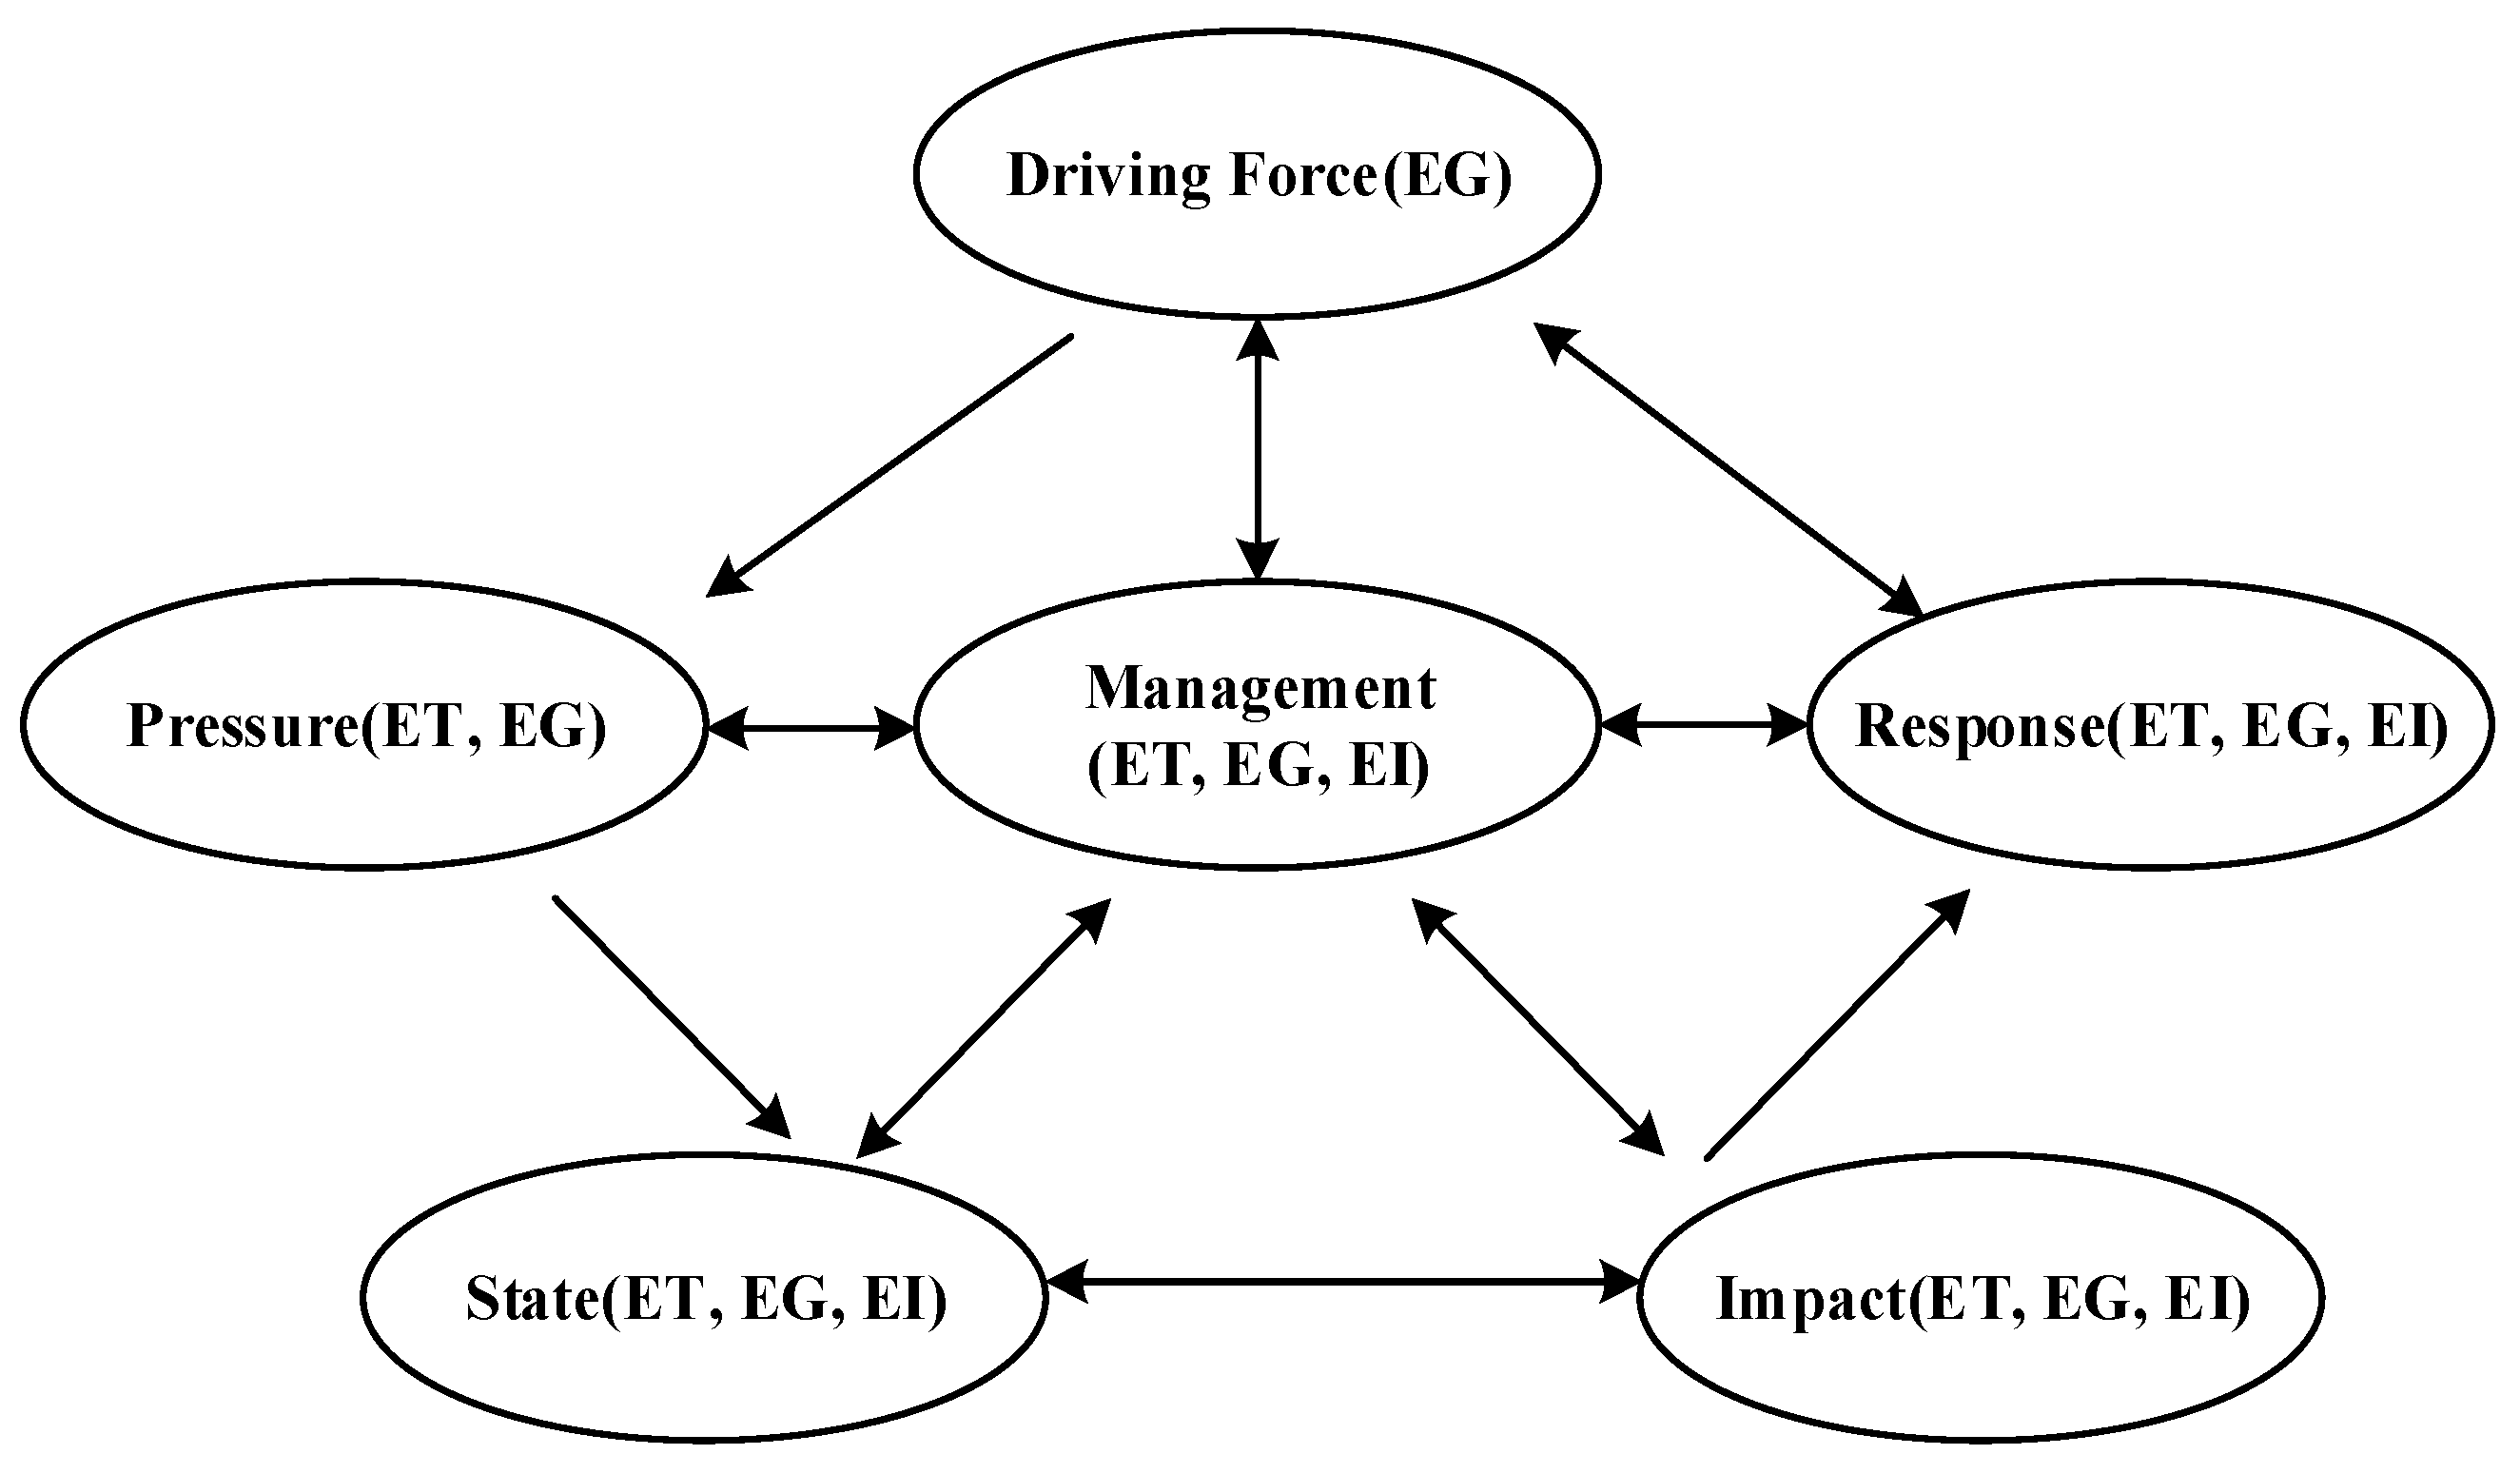
2.3. DPSIRM Theoretical Model
3. Model Construction and Variable Selection
3.1. Construction of a Comprehensive Evaluation Index System for Coordinated Development of Economic Growth, Energy Transformation, and Environmental Improvement
3.2. Calculation of Carbon Emissions
3.3. Variable Selection and Data Sources
- (1)
- Dependent variable and explanatory variable.
- (2)
- Control variables and threshold variables.
- (3)
- Data source.
3.4. Construction of Econometric Models
- (1)
- Fixed panel model.
- (2)
- Construction of threshold effect model.
4. Empirical Results and Analysis
4.1. Fixed Effects Regression Model Analysis
4.2. Threshold Effect Regression Analysis
- (1)
- Unit root test.
- (2)
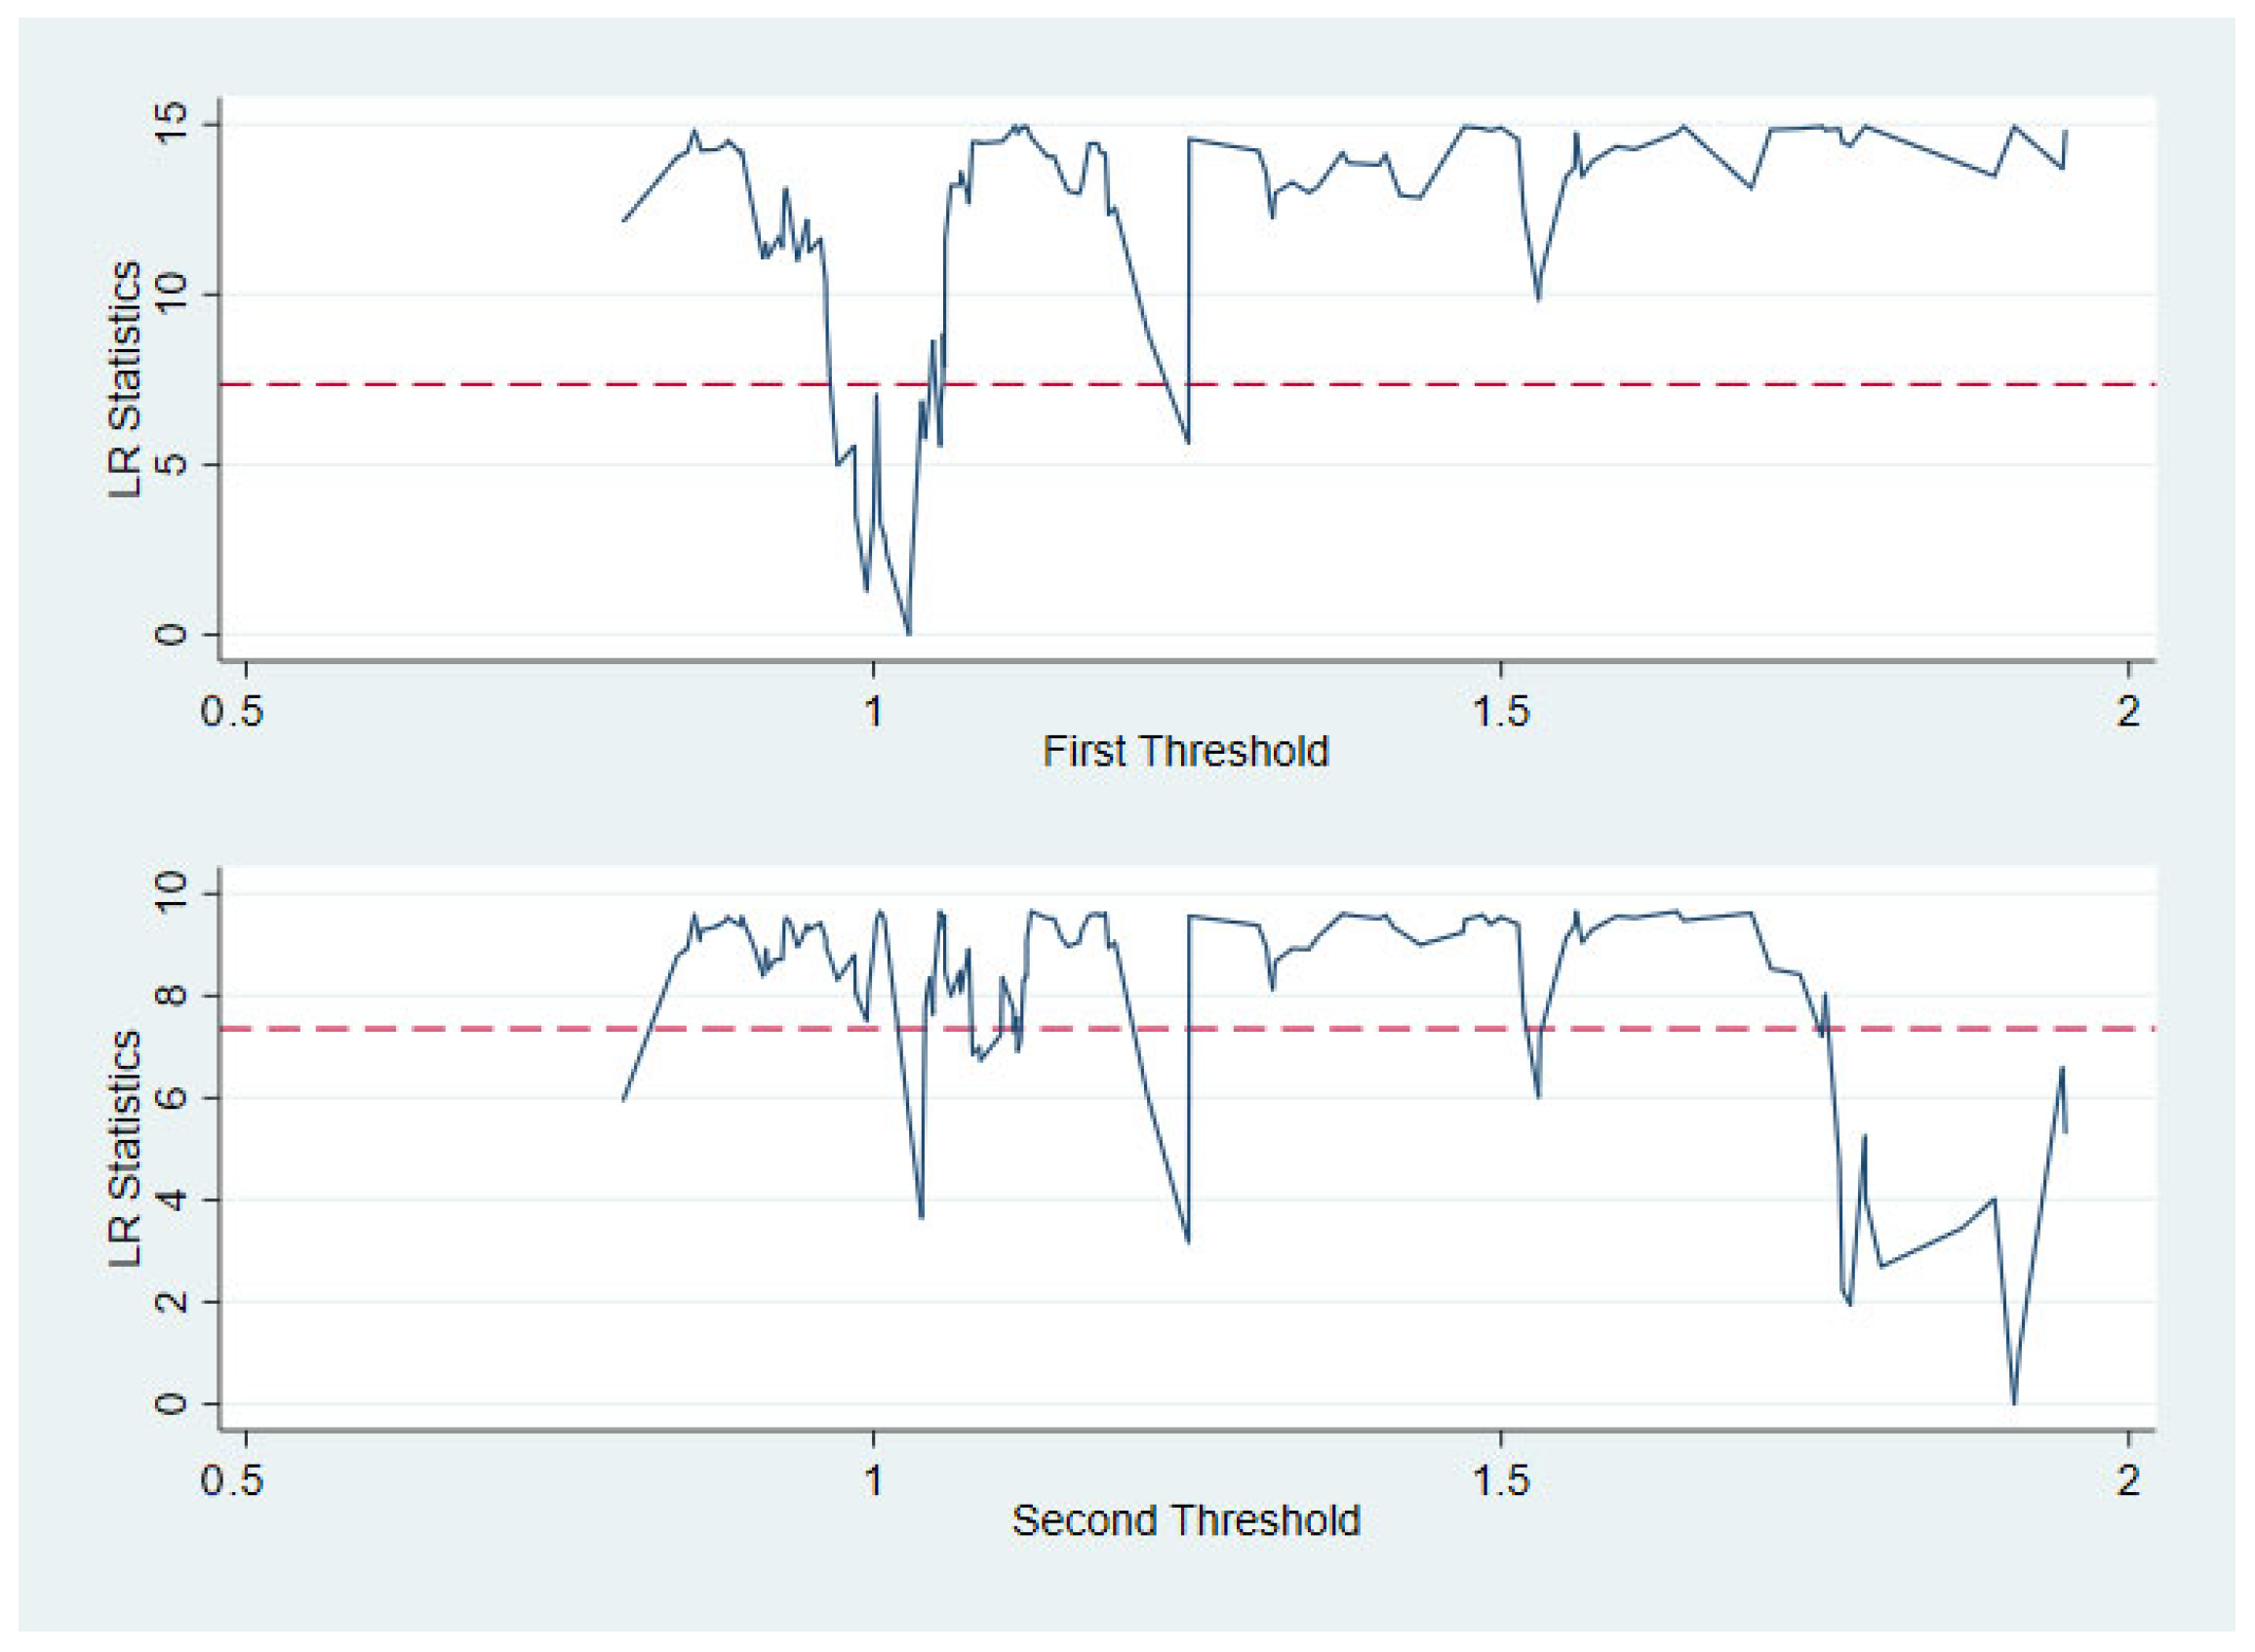
- Estimation of threshold value.
- (3)
- Significance test.
- (1)
- When economic growth is the explanatory variable, the single- and double-threshold F-value all passed the 1% significance test, and the triple threshold did not pass the test, indicating that with changes in government financial intervention intensity, economic growth has a double-threshold effect on carbon reduction in Jiangsu Province.
- (2)
- When energy transformation is the explanatory variable, the single-threshold F-test was statistically significant at the 1% level, and the double threshold passed the test, indicating that energy transformation has a dual-threshold effect on carbon reduction in Jiangsu Province with changes in government financial intervention intensity.
- (3)
- When environmental improvement is the explanatory variable, the single- and double-threshold F-value all passed the 1% significance test, and the three thresholds did not pass the test, indicating that environmental improvement has a double-threshold effect on carbon reduction in Jiangsu with changes in government financial intervention intensity.
- (4)
- Confidence interval test.
- (a)
- Dual thresholds for economic growth;
- (b)
- Dual thresholds for energy transformation;
- (c)
- Dual thresholds for environmental improvement.
- (5)
- Regression analysis of the threshold for carbon neutrality in the economic growth, energy transformation, and environmental improvement under government financial intervention.
- (1)
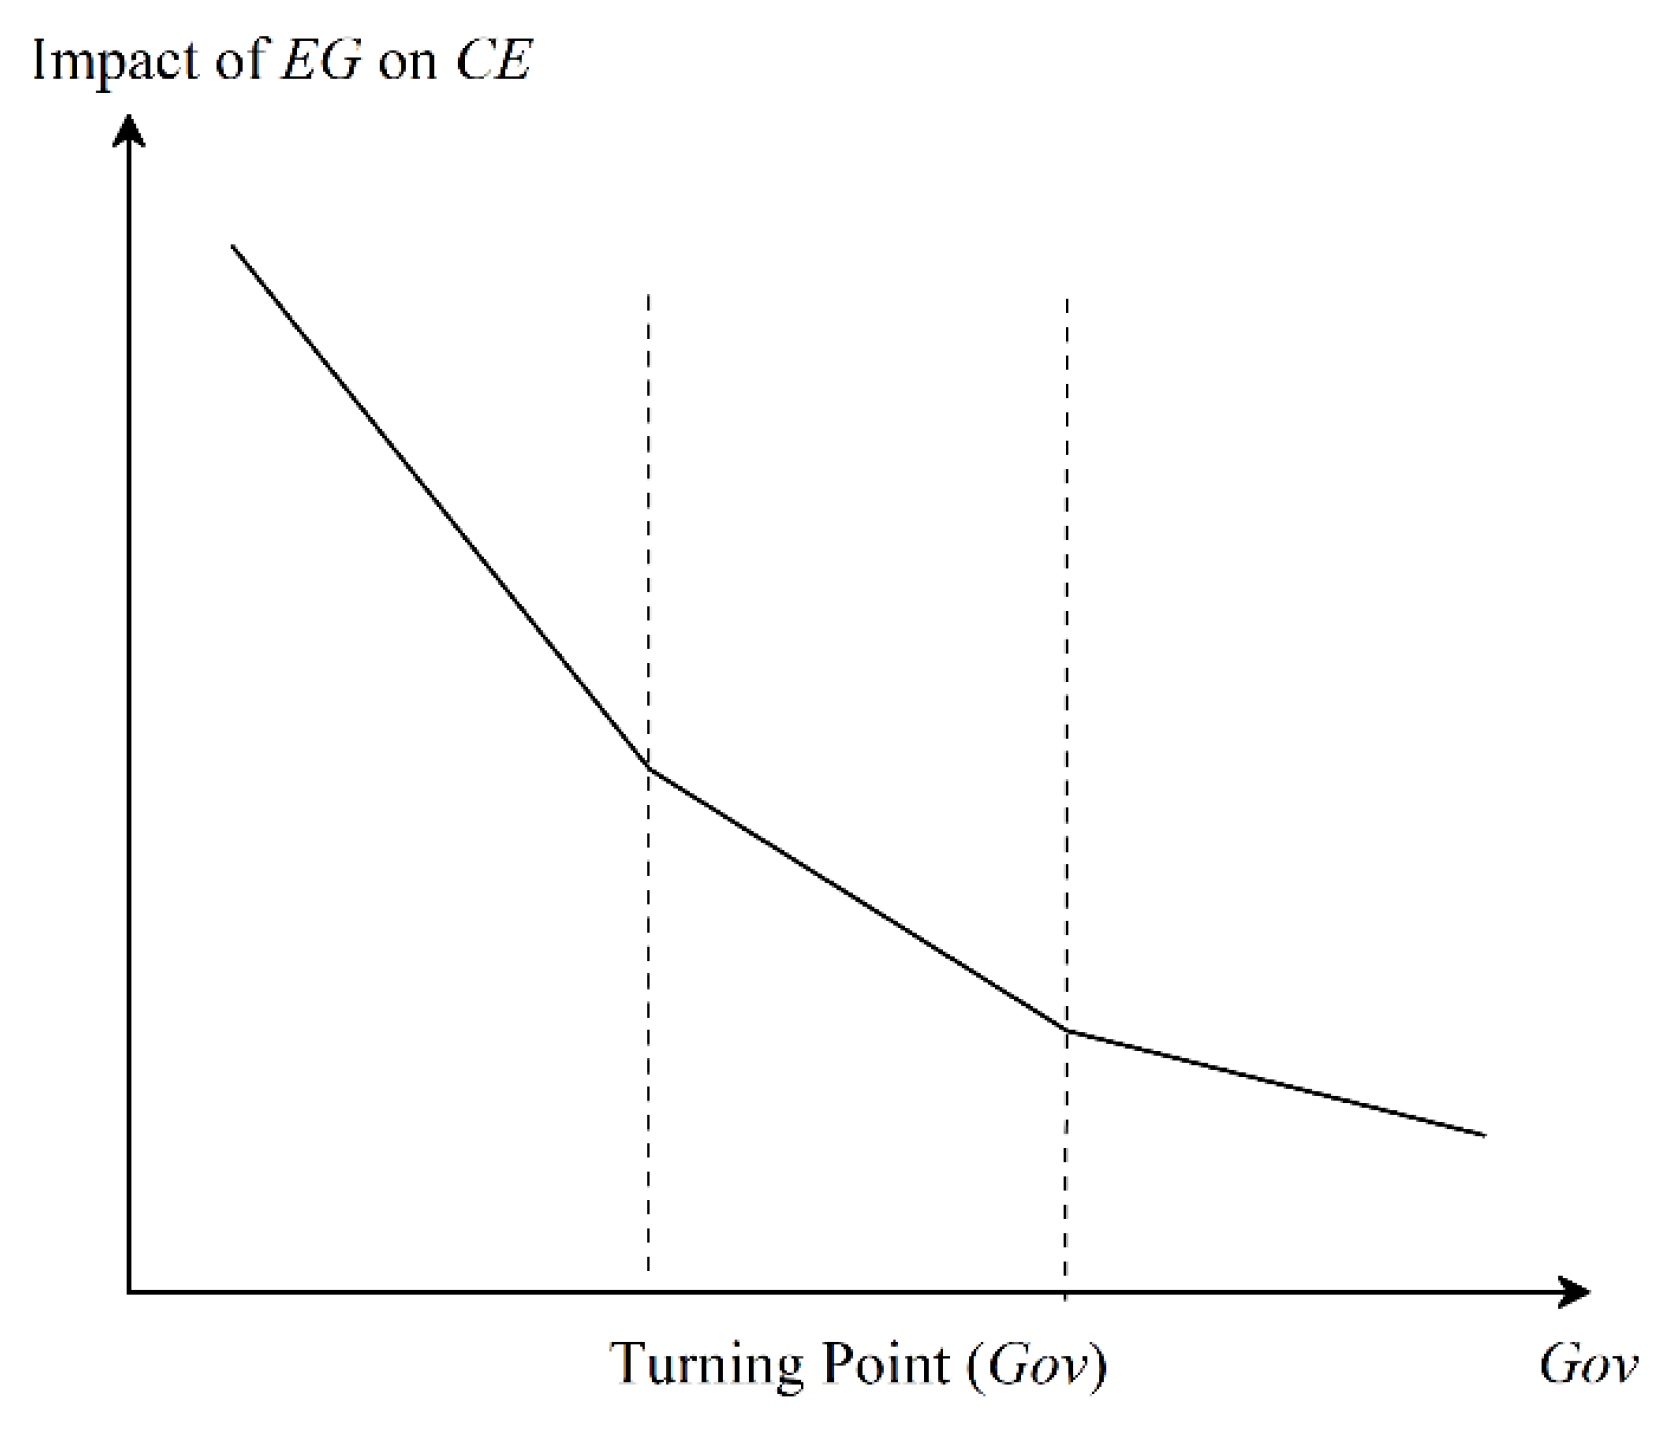
- Analysis of threshold effect on economic growth.
- (2)
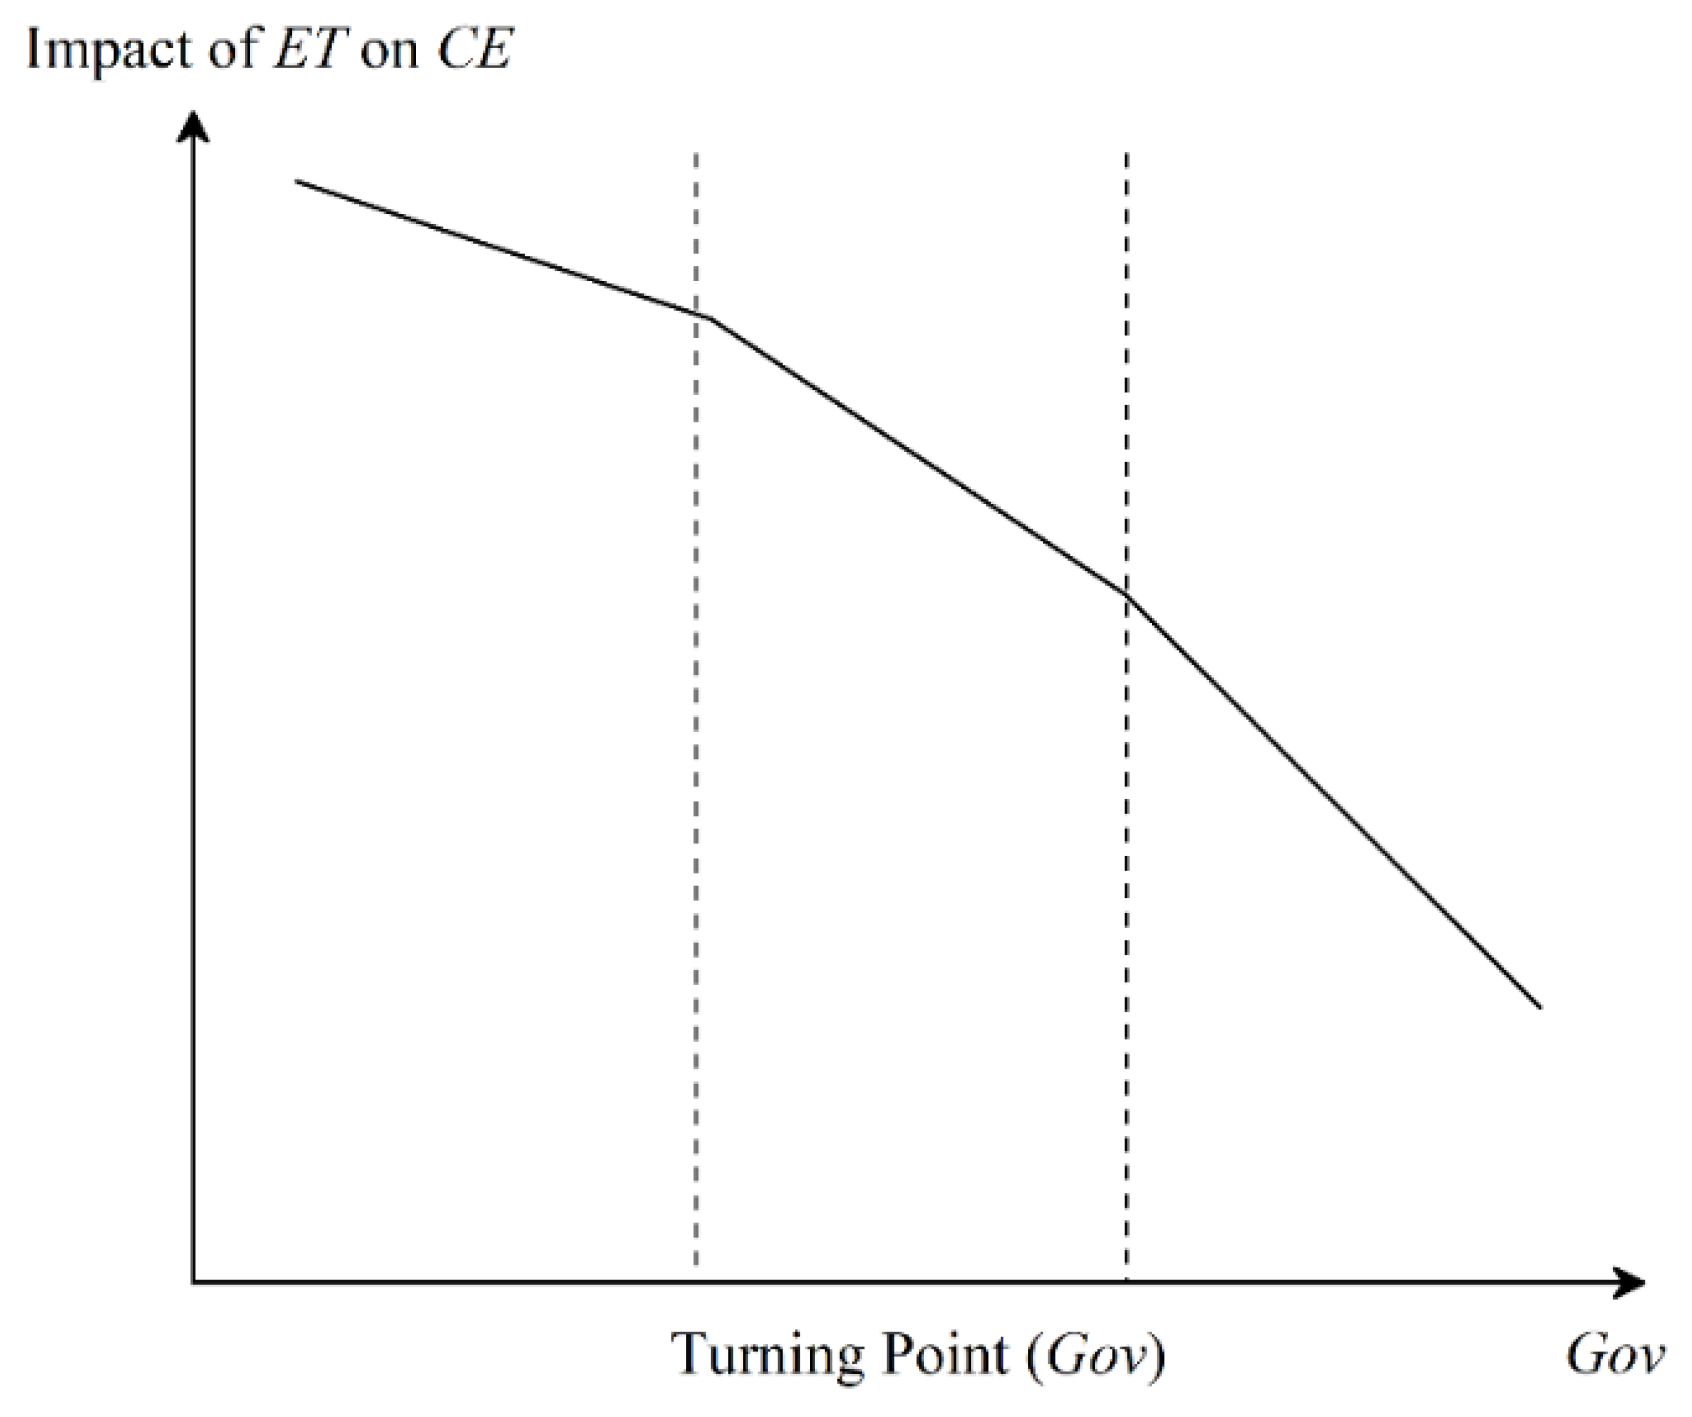
- Analysis of the threshold effect on energy transformation.
- (3)
- Analysis of the threshold effect on environmental improvement.
4.3. Internal Mechanism Analysis
5. Discussion
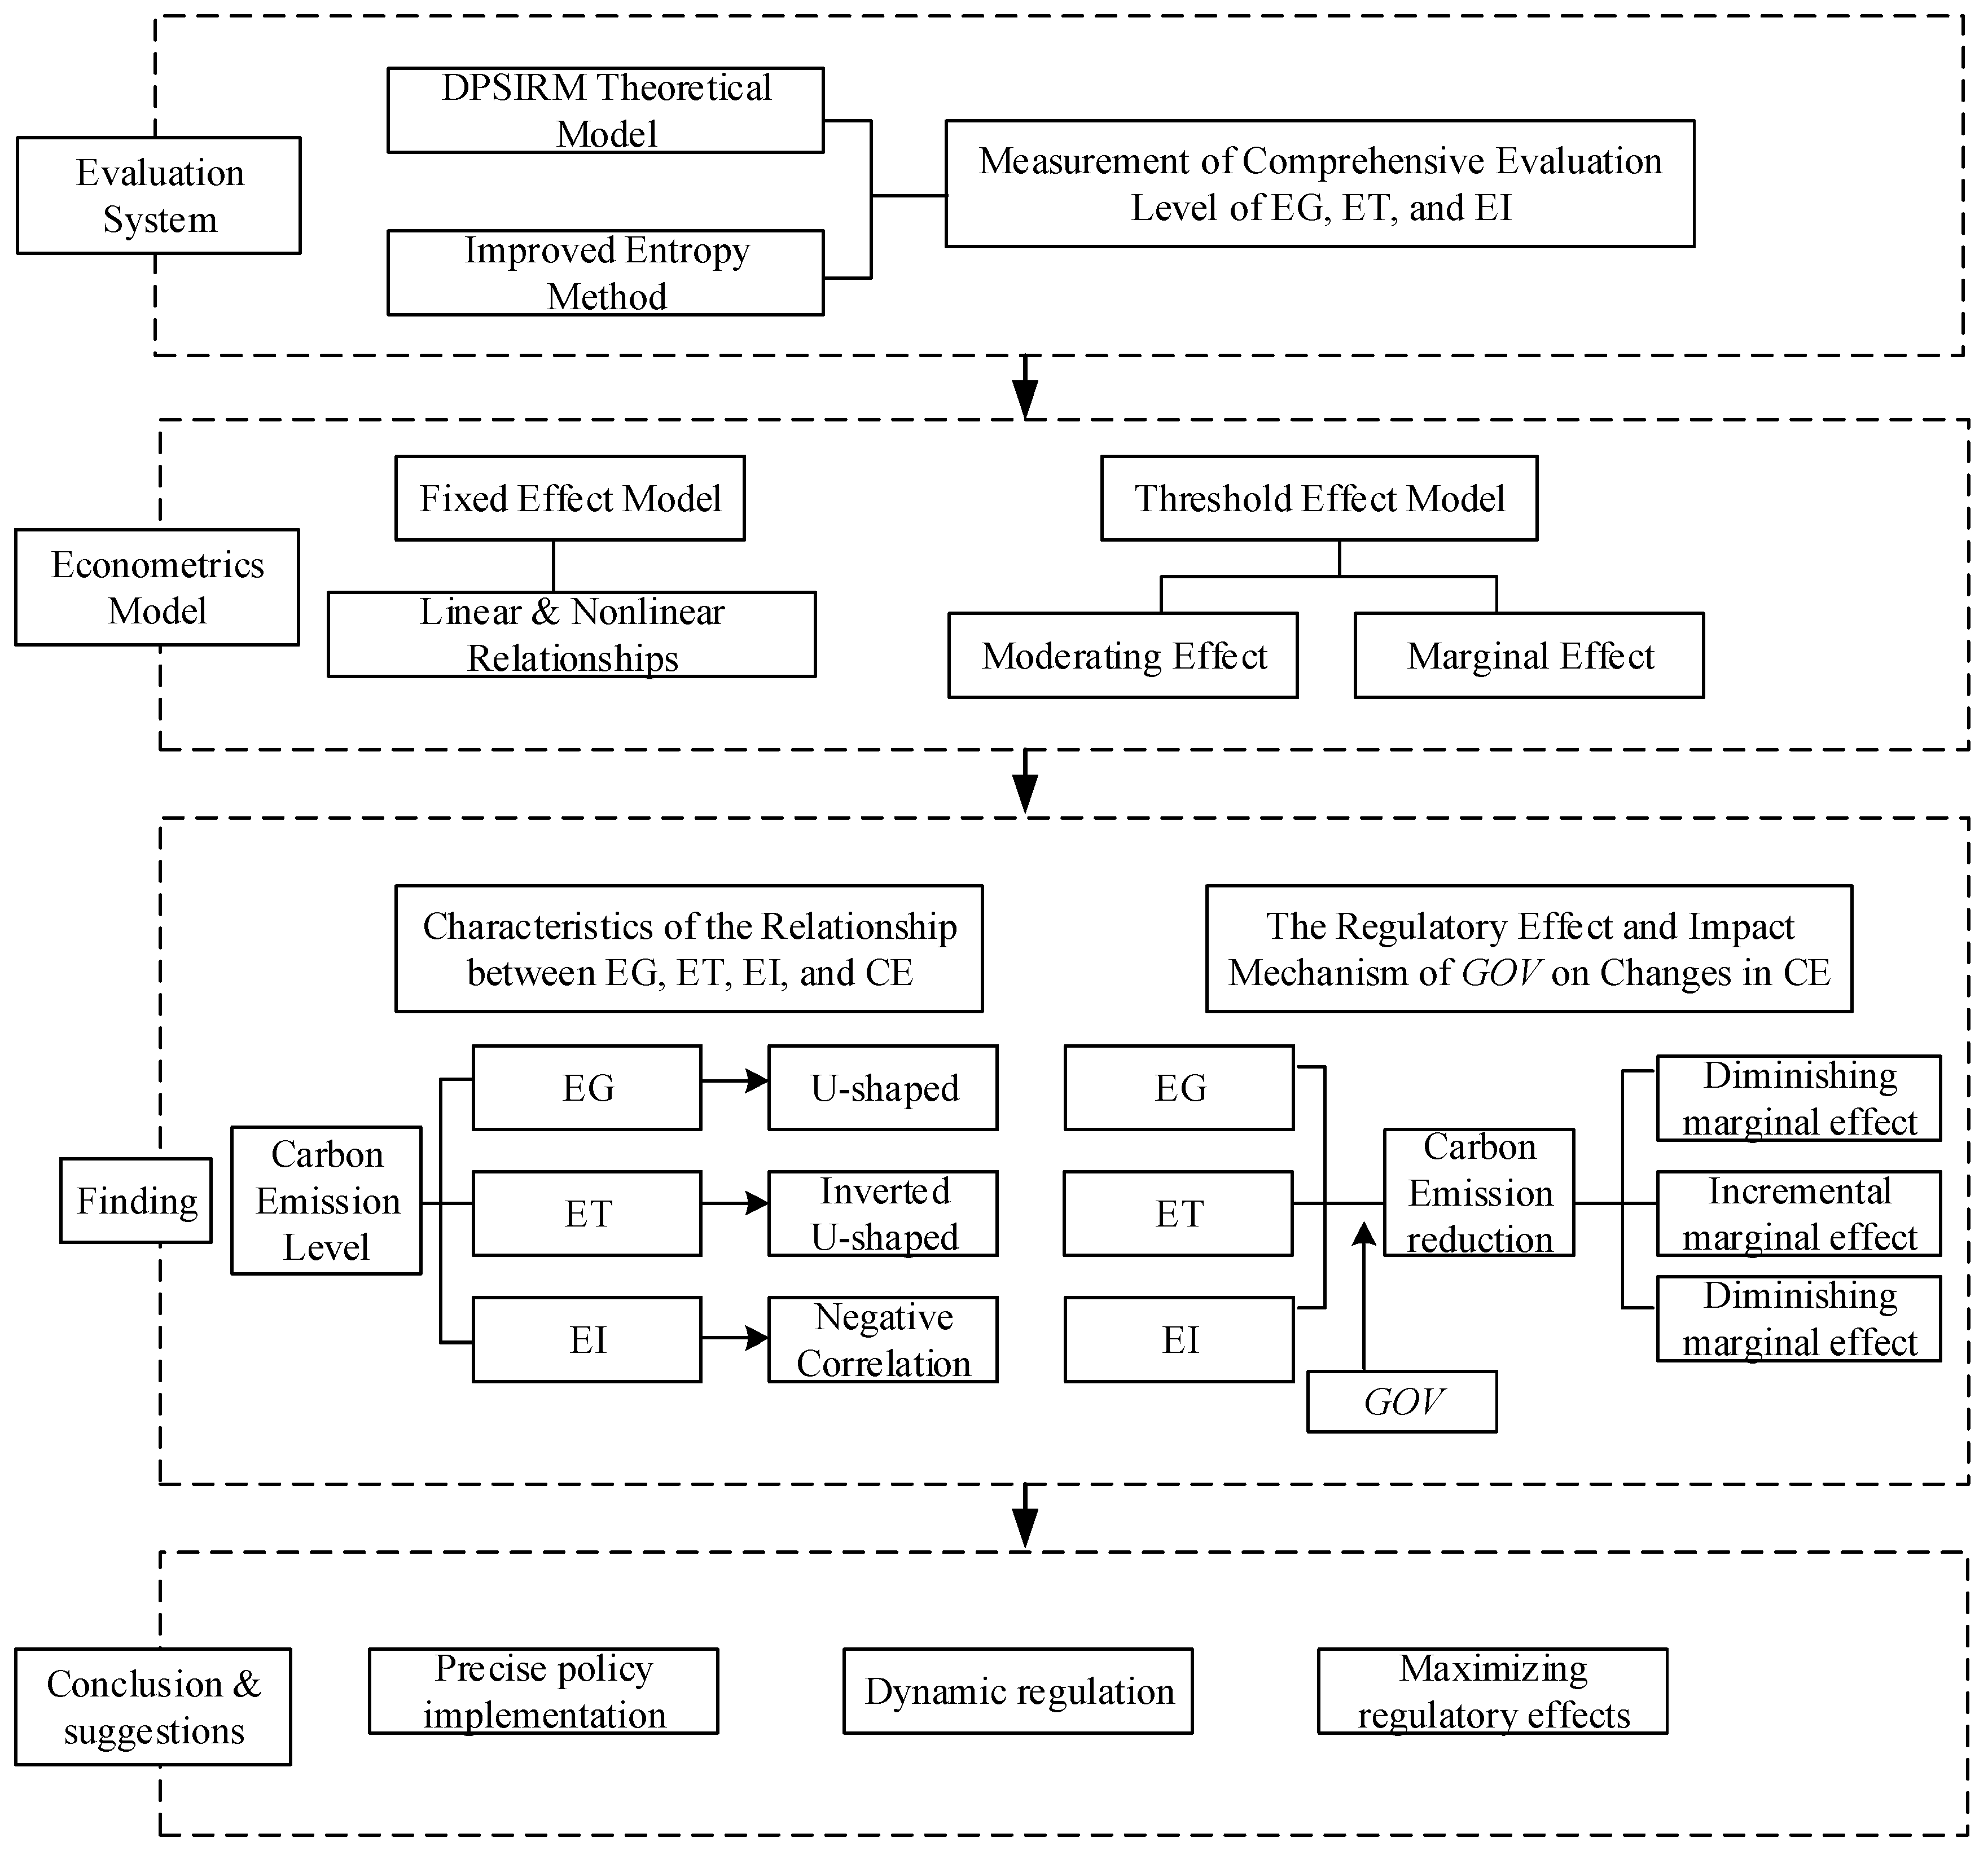
- (1)
- The economic development of Jiangsu Province has a U-shaped relationship with carbon emissions, which means that during the process of economic development, carbon emissions will first decrease and then increase with economic growth. There is an inverted U-shaped relationship between energy transformation and carbon emission levels. In the process of energy transformation, carbon emissions will first increase and then decrease with the energy transformation. Environmental improvement in Jiangsu has always had a negative effect on carbon emissions, reflecting the role of the environmental improvement system in promoting carbon emission reduction. Environmental improvement suppresses carbon emissions by formulating and implementing policies such as environmental standards, emission limits, and economic instruments, prompting enterprises and individuals to adopt low-carbon technologies and management measures. Based on the principle of the environmental Kuznets curve, Fan et al. [21] contend that an empirical analysis of panel data reveals a suppressive influence of green finance development on carbon emissions. The development of an innovative economy can effectively reduce carbon dioxide emissions and enhance carbon productivity, mainly through upgrading industrial structure, stimulating social public awareness of environmental protection [59], promoting technological diversification, and improving the efficiency of energy use [60] and other strategies to realize the low-carbon transformation of the production and lifestyle, and then improve the regional carbon emission reduction energy transformation through energy transformation policy, promote technological innovation, and improve environmental regulation so as to realize carbon emission reduction [22]. Overall, the widespread application of energy innovations reduces the demand for fossil fuels and provides an opportunity to accelerate the clean energy transformation globally. Global energy demand growth in 2023 is stronger than in 2022, and the rapid advancement of the clean energy transformation plays a role in controlling carbon dioxide emissions. EG, ET, and EI are mutually reinforcing in achieving carbon neutrality. The interactions within the three systems are complex, and their optimal state is manifested in a coordinated relationship among the three subsystems [61]. Energy transformation, environmental improvement, and the sustainability of economic growth are interdependent and indispensable, while the coordination among the three promotes the stability and sustainable development of the whole system, thus effectively reducing carbon emissions [62].
- (2)
- This article conducts an in-depth analysis of provincial government financial intervention as a threshold-moderating variable. The research results show that the degree of government financial intervention has a significant moderating effect on the effect of energy transformation on suppressing carbon emissions. Specifically, as the degree of government fiscal intervention increases, the inhibitory effect of energy transformation on carbon emissions gradually strengthens. Dong et al. [63] studied the carbon emission reduction effect of the low-carbon pilot policy on high-energy-consuming industries and found that the policy can effectively reduce the carbon emissions of high-energy-consuming industries and achieve carbon emission reduction by promoting industrial upgrading and optimizing the energy structure. The new energy demonstration city policy is able to reduce carbon emissions by increasing the intensity of government environmental regulation, mainly through environmental regulation to reduce carbon emissions from regional and manufacturing industries [64]. In order to develop the new energy industry, local governments incentivize technological innovation, actively guide the direction of investment, and enhance the endogenous motivation of technological innovation of enterprises [65]. Energy transformation technology innovation activities are longer, riskier, and more difficult than traditional technology innovation activities, and effective policies can guide the flow of funds to new energy technology innovation [66].
- (3)
- Using Jiangsu provincial government financial intervention as a threshold adjustment variable, this study explores the impact of government financial intervention on the relationship between economic growth, environmental improvement, and carbon emissions. The research results show that government fiscal intervention plays a key regulatory role. This study indicates that when the degree of government fiscal intervention is low, economic growth and environmental improvement have a negative impact on carbon emissions, that is, to suppress carbon emissions. However, when the level of government fiscal intervention surpasses a certain threshold, both economic growth and environmental improvement paradoxically exhibit a positive correlation with carbon emissions, effectively promoting them. This means that moderate government financial intervention is favorable to economic growth and environmental improvement to promote carbon emission reduction, while excessive government financial intervention may inhibit carbon emission reduction. A moderate environmental target responsibility system can improve environmental quality, promote technological innovation, and enhance social welfare, which in turn is conducive to carbon emission reduction. However, if the government intervenes excessively, it may inhibit economic growth and technological innovation, which ultimately affects the effect of carbon emission reduction [67]. The effectiveness of China’s carbon market in reducing carbon emissions was found to diminish as the intensity of government administrative intervention increased. This suggests that excessive intervention may distort the market mechanism, inhibit the enthusiasm of enterprises to reduce emissions on their own, and ultimately affect the effect of carbon emission reduction [42]. Government financial intervention influences both the economy and environment of a region, with a higher level of intervention leading to a greater degree of involvement in both these domains. The government, as the main body of regulation and resource allocation, is an important guiding force for realizing green development and carbon neutrality [68]. Local government financial intervention has a positive effect on industrial transformation and upgrading and environmental quality improvement, and the stronger the intervention is, the more obvious the effect on environmental quality improvement is [69]. In the short term, governments at all levels, as policy decision-makers and implementers, are limited in the growth of fiscal revenues due to the implementation of tax cuts and fee reductions, which restricts the effective play of the government. In the long run, tax and fee reductions will encourage enterprise innovation, improve productivity, and ensure revenue growth, thus realizing a “win-win” situation for both the government and enterprises [70]. For regions with a low level of government fiscal intervention, local governments prefer gradual over mandatory environmental regulations, and such guided interventions may rely on external mechanisms to drive green transformation. In regions with high government fiscal intervention, the impact of environmental information disclosure quality on enterprise green transformation is weakened, suggesting a threshold effect. Nevertheless, environmental information disclosure remains crucial for green transformation. This indicates that there is a certain threshold effect of government fiscal intervention [71]. Government financial intervention can significantly affect carbon emission efficiency, and the specific effect depends on whether the government financial intervention is a “crowding out effect” or a “forcing effect” [72].
- (4)
- This study reveals that while factors such as the level of openness to external entities, industrial structure upgrading, and urbanization contribute to economic growth, they also tend to be accompanied by increased energy consumption, which hinders carbon emission reduction efforts. On the contrary, technological progress, the enhancement of the informatization level, and the strengthening of government financial intervention can effectively reduce the intensity of energy consumption, which in turn reduces carbon emissions and promotes carbon emission reduction. Some scholars have proposed that urbanization will accelerate the growth of carbon emissions mainly by affecting the economy [73]. In the research of BRICS countries, urbanization and carbon emissions show a relationship of mutual constraints and interactions [74]. Urbanization causes an increase in energy consumption and environmental pressure, inhibiting carbon emission reduction, and the process of urbanization must be subject to reasonable disruption [75]. Industrial structure transformation can promote structural rationalization, strengthen inter-industry coordination and cooperation, optimize resource allocation, promote industrial transformation and structural upgrading, improve overall production efficiency, and effectively reduce carbon emissions [76]. Some scholars believe that the rationalization of the industrial structure is correlated with carbon emissions, while industrial structure upgrading is conducive to reducing carbon emissions [77,78]. Technological progress promotes the improvement of dynamic carbon emission efficiency, and technological progress has a significant effect on its convergence [79]. Wen et al. [80] found that technological innovation is an important mechanism for green finance to exert emission reduction effects. To effectively control carbon emissions, it is crucial to balance economic development with environmental protection, optimize economic structures, foster green and low-carbon tech innovation, and strengthen government–market synergies.
6. Conclusions and Policy Recommendations
6.1. Main Conclusions
- (1)
- The energy transformation in Jiangsu Province has an inverted “U”-shaped relationship with carbon emissions, while economic development has a “U”-shaped relationship with carbon emissions. Environmental improvement has a significant negative impact on carbon emissions. Within the research interval, carbon emissions will first increase and then decrease during the energy transformation process. This discovery highlights the importance of policy support for technological innovation and infrastructure development, especially in the early stages of energy transformation. Although there may be short-term increases in carbon emissions, effective policy interventions can accelerate the transition to a mature low-carbon energy system, ultimately achieving a significant reduction in carbon emissions. In the process of economic development, carbon emissions will first decrease and then increase with economic growth. At the beginning, economic development may lead to a reduction in carbon emissions due to technological progress and industrial structure optimization. With sustained economic growth and increasing population, energy demand may rise again, highlighting the urgent need for proactive environmental policies and strategic energy transformation to decouple economic growth from carbon emissions exceeding a certain threshold. Contrary to the nonlinear relationship observed in economic growth and energy transformation, environmental improvement in Jiangsu Province has a sustained negative effect on carbon emissions, further confirming the effectiveness of strict environmental regulations, emission limits, and economic tools in promoting sustainable practices and technology adoption. The sustained inhibitory effect of environmental governance not only demonstrates the crucial role of effectively implemented environmental policies in achieving sustained carbon emission reduction but also emphasizes the crucial importance of the sustainability and stability of policy interventions in ensuring emission reduction effectiveness throughout the entire transformation process. This study provides empirical evidence for this collaborative relationship in the specific context of Jiangsu Province. The U-shaped curve of economic growth and the inverted U-shaped curve of energy transformation highlight the importance of strategic policies to maximize positive impacts and minimize negative consequences during the transition period. The sustained inhibitory impact of environmental improvement highlights the need for effective policy intervention throughout the entire process.
- (2)
- This article found that local government fiscal intervention has a significant effect on carbon reduction changes, which is called the regulatory effect of fiscal intervention. Specifically, with the increasing degree of government fiscal intervention, energy transformation, economic growth, and environmental improvement have all shown positive impacts on reducing carbon emissions, and the impacts have shown a differentiated marginal effect trend. In terms of energy transition, its contribution to carbon reduction shows an increasing marginal effect, which means that with the increase in fiscal support and the optimization and upgrading of energy structure not only continue to advance, but also its emission reduction effect becomes more significant. This reflects the unique advantages and high efficiency of fiscal policy in accelerating energy technology innovation and promoting the development of new energy. In contrast, the marginal effect of carbon reduction in the fields of economic growth and environmental improvement shows a decreasing trend. Although economic growth can indirectly promote carbon reduction, with the expansion of economic scale, its inherent carbon emission pressure may gradually increase, requiring more refined policy regulation to balance the relationship between development and emission reduction. In the field of environmental improvement, the increasing difficulty of governance and rising marginal costs may lead to a gradual decrease in emission reduction efficiency, requiring the government to continuously innovate governance models and increase investment. The increase in the marginal rate of return in this study indicates that fiscal intervention measures have been successful in creating a supportive environment for energy transformation.
- (3)
- This study deeply analyzed the economic and social development factors, such as the degree of opening up to the outside world, upgrading of industrial structure, and improvement of the urbanization level, as well as the impact mechanism of policy measures such as technological progress, the improvement of information technology level, and government financial intervention on carbon emissions, revealing the complex role of these factors in the process of carbon reduction. Specifically, the increase in openness to the outside world, the upgrading of industrial structures to a higher level, and the rapid improvement of urbanization have to some extent promoted economic and social development, but at the same time, accompanied by the growth of energy consumption, they have also had a restraining effect on carbon emission mitigation. This discovery indicates that while enjoying the economic benefits brought by globalization dividends, industrial structure optimization, and accelerated urbanization, it is necessary to pay close attention to the potential environmental pressures it may bring, especially the increase in carbon emissions, in order to avoid falling into the development trap of “pollution first, treatment later”. However, research has also found that technological progress, improvement in information technology, and increased government financial intervention are important ways to effectively reduce energy consumption intensity, decrease carbon emissions, and promote carbon reduction. Technological progress has reduced carbon emissions from the source by improving energy efficiency and developing clean energy and low-carbon technologies. The improvement of the informatization level has reduced energy consumption and carbon emission intensity through optimizing resource allocation, improving management efficiency, and promoting information sharing. The strengthening of government fiscal intervention, through means such as financial support, policy guidance, and market supervision, has promoted the development of green and low-carbon industries, suppressed the disorderly expansion of high-energy-consuming and high-emission industries, and thus achieved effective control of carbon emissions.
6.2. Policy Recommendations
- (1)
- We should stimulate industrial transformation and promote the ecological transformation of conventional industries; we should improve green finance, promote the innovative development of green financial products, and provide more convenient and low-cost financial support for the green industry. We should encourage green consumption, advocate green lifestyles and develop the market for sustainable products and services. We should vigorously develop renewable energy and formulate development goals and support policies. We should optimize energy utilization efficiency; intensify the research, development, and deployment of energy-saving technologies; elevate energy productivity; and minimize energy consumption waste. We should build an intelligent energy system and promote the construction of the energy Internet. We should strengthen the management of environmental pollution, formulate environmental protection standards, and increase environmental enforcement. We should protect the ecological environment, promote ecological restoration, maintain the balance of ecosystems, and improve the carbon sink capacity of ecosystems. We should encourage green scientific and technological innovation and promote green technological innovation in enterprises.
- (2)
- We should optimize the design of fiscal policy and avoid excessive intervention. The government should formulate scientific and reasonable fiscal policies, avoid over-reliance on financial subsidies, focus on playing the pivotal role of market mechanisms in allocating resources, and guide enterprises to innovate independently to realize sustainable carbon emission reduction. We should strengthen the precise input of financial funds. The government should focus financial funds on key areas and weak links, such as promoting the application of clean energy and improving the carbon emission trading system so as to enhance the effectiveness of financial fund utilization. We should strengthen the synergy between government guidance and market mechanisms. The government ought to enhance its guidance and oversight of the energy transformation process, and it should utilize market mechanisms effectively, encourage enterprises to actively participate in energy transformation, and form a good situation of government guidance, with a market-driven, enterprising main body and social participation.
- (3)
- We should set scientific and reasonable carbon emission targets and formulate corresponding carbon emission control programs. We should develop a robust carbon emission trading market and leverage market mechanisms to incentivize enterprises to cut down on carbon emissions. We should implement carbon tax policy, levy carbon tax on high-carbon-emission industries and promote carbon emission reductions among businesses. The government fiscal intervention policy needs to be combined with the market mechanism. Carbon neutrality is a complex systematic project that requires the government to set clear carbon neutrality targets and timetables, and in this regard, the government needs to encourage enterprises and individuals to actively participate in carbon emission reduction through policy guidance so as to form a situation of joint efforts by the whole society. Environmental pollution and climate change caused by carbon emissions are typical negative externalities that cannot be effectively addressed by market mechanisms. The government needs to internalize the cost of carbon emissions and guide enterprises to reduce carbon emissions by formulating carbon emission standards, levying carbon taxes, and implementing carbon emission trading and other policies.
- (4)
- Enhancing openness will facilitate the introduction of advanced emission reduction technologies, thereby boosting the overall efficiency of carbon reduction in industries. Additionally, the tertiary industry boasts relatively low carbon emissions, and its development is beneficial for decreasing carbon emission intensity. Strengthening the construction of urban infrastructure can effectively reduce carbon emissions. The improvement of the urban management level can effectively reduce energy waste and improve carbon emission reduction efficiency. Advances in new energy technology can provide clean, low-carbon energy alternatives; improving the level of informatization is conducive to information sharing, promoting coordination and cooperation among all parties, and improving the efficiency of carbon emission reduction. Informatization technology can realize accurate energy management, effectively reduce energy waste, and improve carbon emission reduction efficiency.
Author Contributions
Funding
Institutional Review Board Statement
Informed Consent Statement
Data Availability Statement
Conflicts of Interest
Appendix A

| (1) | (2) | (3) | |
|---|---|---|---|
| Variables | |||
| −0.0460 ** | |||
| (0.0196) | |||
| −0.243 ** | |||
| (0.120) | |||
| −0.153 | |||
| (0.111) | |||
| 0.0017 ** | 0.0022 *** | 0.0020 *** | |
| (0.0007) | (0.0007) | (0.0007) | |
| 0.0075 | 0.0053 | 0.0053 | |
| (0.0050) | (0.0049) | (0.0049) | |
| 0.0300 *** | 0.0242 *** | 0.0246 *** | |
| (0.0062) | (0.0058) | (0.0059) | |
| −0.0389 | −0.0604 ** | −0.0462 | |
| (0.0279) | (0.0273) | (0.0282) | |
| 0.0280 | −0.0463 | −0.0300 | |
| (0.0458) | (0.0356) | (0.0366) | |
| −2.977 *** | −2.975 *** | −2.013 ** | |
| (0.794) | (0.806) | (0.864) | |
| Constant | 0.532 * | 0.977 *** | 0.663 ** |
| (0.286) | (0.299) | (0.281) | |
| Observations | 143 | 143 | 143 |
| R-squared | 0.662 | 0.659 | 0.653 |
| Variables | (1) | (2) |
|---|---|---|
| 0.7379 | ||
| (0.0605) *** | ||
| −0.2420 | ||
| (0.1249) ** | ||
| KP rk LM statistic | 8.169 | |
| [0.0043] | ||
| KP rk Wald F | 108.115 | |
| {9.08} | ||
| Control | YES | YES |
| Time | YES | YES |
| City | YES | YES |
| R2 | 0.9604 | 0.9861 |
| Variables | (1) | (2) |
|---|---|---|
| 0.8583 | ||
| (0.0593) *** | ||
| −0.2159 | ||
| (0.2529) * | ||
| KP rk LM statistic | 10.622 | |
| [0.0011] | ||
| KP rk Wald F | 134.595 | |
| {9.08} | ||
| Control | YES | YES |
| Time | YES | YES |
| City | YES | YES |
| R2 | 0.8596 | 0.9858 |
| Variable | PP-Fisher |
|---|---|
| 43.6818 *** | |
| 51.3933 *** | |
| 80.6059 *** | |
| 13.7183 * | |
| 59.5755 *** | |
| 10.4997 * | |
| −5.2888 * | |
| 3.4854 * | |
| 50.0775 *** | |
| 38.0268 ** |
References
- Cai, J.; Zheng, H.; Vardanyan, M.; Shen, Z. Achieving carbon neutrality through green technological progress: Evidence from China. Energy Policy 2023, 173, 113397. [Google Scholar]
- Wu, G.C.; Leslie, E.; Sawyerr, O.; Cameron, D.R.; Brand, E.; Cohen, B.; Allen, D.; Ochoa, M.; Olson, A. Low-impact land use pathways to deep decarbonization of electricity. Environ. Res. Lett. 2020, 15, 074044. [Google Scholar]
- Figueiredo, A.; Rebelo, F.; Castanho, R.A.; Oliveira, R.; Lousada, S.; Vicente, R.; Ferreira, V.M. Implementation and challenges of the passive house concept in Portugal: Lessons learnt from successful experience. Sustainability 2020, 12, 8761. [Google Scholar] [CrossRef]
- Lee, C.C.; Wang, C.W.; Ho, S.J.; Wu, T.P. The impact of natural disaster on energy consumption: International evidence. Energy Econ. 2021, 97, 105021. [Google Scholar] [CrossRef]
- Wen, H.; Lee, C.C. Impact of fiscal decentralization on firm environmental performance: Evidence from a county-level fiscal reform in China. Environ. Sci. Pollut. Res. 2020, 27, 36147–36159. [Google Scholar]
- Hong, Q.Q.; Cui, L.H.; Hong, P.H. The Impact of Carbon Emissions Trading on Energy Efficiency: Evidence from Quasi-Experiment in China’s Carbon Emissions Trading Pilot. Energy Econ. 2022, 110, 106025. [Google Scholar]
- Chen, L.F.; Wang, K.F. The spatial spillover effect of low-carbon city pilot scheme on green efficiency in China’s cities: Evidence from a quasi-natural experiment. Energy Econ. 2022, 110, 106018. [Google Scholar]
- Zhang, L.; Wang, Q.Y.; Zhang, M. Environmental regulation and CO2 emissions: Based on strategic interaction of environmental governance. Ecol. Complex. 2021, 45, 100893. [Google Scholar]
- Yan, J.; Li, M.; Han, J.P. Green Development and Carbon Reduction: A Study on the Inter provincial Path of China Based on Dynamic Time Planning. Price Theory Pract. 2024, 11, 38–43. [Google Scholar]
- Razzaq, A.; Sharif, A.; An, H.; Aloui, C. Testing the directional predictability between carbon trading and sectoral stocks in China: New insights using cross-quantilogram and rolling window causality approaches. Technol. Forecast. Soc. Change 2022, 182, 121846. [Google Scholar]
- Wang, X.; Zhang, C.; Zha, Z. Pollution haven or porter? The impact of environmental regulation on location choices of pollution-intensive firms in China. Environ. Manag. 2019, 248, 109248. [Google Scholar]
- Li, J.; Hu, J.L.; Wang, X. The Carbon Emission Reduction Effect and Mechanism of Digital Economy Development from a Global Perspective. China Popul. Resour. Environ. 2024, 8, 3–12. [Google Scholar]
- Xu, L.; Fan, M.; Yang, L.; Shao, S. Heterogeneous green innovations and carbon emission performance: Evidence at China’s city level. Energy Econ. 2021, 99, 105269. [Google Scholar]
- Li, L.; Hong, X.; Wang, J. Evaluating the impact of clean energy consumption and factor allocation on China’s air pollution: A spatial econometric approach. Energy 2020, 195, 116842. [Google Scholar] [CrossRef]
- Zhang, C.; Tian, L.X.; Fang, G.C. Analysis of sustainable transformation development patterns and heterogeneity of Chinese cities based on spatial general equilibrium model. Environ. Dev. Sustain. 2024, 26, 25689–25715. [Google Scholar] [CrossRef]
- Zhang, X.; Geng, Y.; Shao, S.; Wilson, J.; Song, X.Q.; You, W. China’s non-fossil energy development and its 2030 CO2 reduction targets: The role of urbanization. Appl. Energy 2020, 261, 114353. [Google Scholar]
- Barua, S. Chapter 14—Green growth and energy transition: An assessment of selected emerging economies. In Energy-Growth Nexus in an Era of Globalization; Elsevier Inc.: Amsterdam, The Netherlands, 2022; pp. 323–352. [Google Scholar]
- Han, B. Research on the influence of technological innovation on carbon productivity and countermeasures in China. Environ. Sci. Pollut. Res. 2021, 28, 16880–16894. [Google Scholar]
- Weng, Q.; Xu, H. A review of China’s carbon trading market. Renew. Sustain. Energy Rev. 2018, 91, 613–619. [Google Scholar] [CrossRef]
- Chen, T.; Dong, H.; Lin, C. Institutional shareholders and corporate social responsibility. J. Financ. Econ. 2020, 135, 483–504. [Google Scholar]
- Fan, D.C.; Zhang, X.F. Analysis of the Effect of Green Finance Reform and Innovation on Carbon Reduction in High Emission Enterprises. Front. Sci. Technol. Eng. Manag. 2022, 41, 55–61. [Google Scholar]
- Jing, G.W.; Wang, D. The Carbon Reduction Effect of Energy Transition Policies: A Quasi Natural Experiment Based on New Energy Demonstration Cities. J. Ind. Technol. Econ. 2024, 43, 106–115. [Google Scholar]
- Sun, F.; Guo, J.; Huang, X.; Shang, Z.; Jin, B. Spatio-temporal characteristics and coupling coordination relationship between industrial green water efficiency and science and technology innovation: A case study in China. Ecol. Indic. 2024, 159, 111651. [Google Scholar]
- Liu, W.; Huang, X.H.; He, Z.; Wang, Y.X.; Han, L.Y.; Qiu, W.X. Input-Output Benefit Analysis of Green Building Incremental Cost Based on DEA-Entropy Weight Method. Building 2023, 12, 2239. [Google Scholar]
- Bai, R.; Lin, B.Q.; Liu, X.Y. Government subsidies and firm-level renewable energy investment: New evidence from partially linear functional-coefficient models. Energy Policy 2021, 159, 112610. [Google Scholar]
- Qi, X.Y.; Guo, Y.S.; Guo, P.B.; Yao, X.L.; Liu, X.L. Do subsidies and R&D investment boost energy transition performance? Evidence from Chinese renewable energy firms. Energy Policy 2022, 164, 112909. [Google Scholar]
- Wang, Z.; Huo, J. Do government intervention measures promote e-waste recycling in China? J. Environ. Manag. 2023, 342, 118138. [Google Scholar]
- Wang, H.; Lu, X.; Li, Z.; Wang, M.; Jiang, X.; Tang, Y. The impact of local government’s environmental attention on industrial land leasing intervention in urban China. Environ. Dev. Sustain. 2024, 1–23. [Google Scholar] [CrossRef]
- Zhou, Y.W.; Tian, L.X.; Yang, X.G.; Wan, B.Y. Robust green Schumpeterian endogenous growth model and spatial Kuznets curve. Energy Econ. 2024, 133, 107520. [Google Scholar]
- Al-Mulali, U.; Weng-Wai, C.; Sheau-Ting, L.; Mohammed, A.H. Investigating the environmental Kuznets curve (ekc) hypothesis by utilizing the ecological footprint as an indicator of environmental degradation. Ecol. Indic. 2015, 48, 315–323. [Google Scholar] [CrossRef]
- Zhou, Y.N.; Yang, Y.; Cheng, B.; Huang, J. Regional differences in the coupling relationship between China’s economic growth and carbon emissions based on decoupling index and LMDI. J. Univ. Chin. Acad. Sci. 2020, 37, 295–307. [Google Scholar]
- Gao, Y.; Yao, X.; Wang, W.; Liu, X. Dynamic effect of environ mental tax on export trade: Based on DSGE mode. Energy Environ. 2019, 30, 1275–1290. [Google Scholar]
- Gao, X.; Yuan, K.H. Regulation of Clean Production Environment and the Complexity of Enterprise Export Technology: Micro evidence and Impact Mechanism. J. Int. Trade 2020, 2, 93–109. [Google Scholar]
- Zhang, C.; Tian, L.X.; Zhen, Z.L. The impact of green behavior on spatial heterogeneity of city green development-the case of Yangtze River Delta city cluster. Environ. Dev. Sustain. 2024, 10, 1007. [Google Scholar]
- Huang, X.L.; Zhang, X.C.; Liu, Y. Has China’s carbon trading policy achieved environmental dividends? Econ. Rev. 2018, 6, 86–99. [Google Scholar]
- Jiang, H.D.; Liu, L.J.; Dong, K.Y.; Fu, Y.W. How Will Sectoral Coverage in the Carbon Trading System Affect the Total Oil Consumption in China? A CGE-based Analysis. Energy Econ. 2022, 110, 105996. [Google Scholar]
- Zhou, Y.W.; Tian, L.X.; Yang, X.G. Schumpeterian endogenous growth model under green innovation and its enculturation effect. Energy Econ. 2023, 127, 107109. [Google Scholar]
- Lu, Z.N.; Zhu, X.L. Analysis of the Impact of Industrial Agglomeration on Carbon Emission Intensity from the Perspective of Government financial intervention. J. Ind. Technol. Econ. 2018, 37, 121–127. [Google Scholar]
- Zhao, X.C.; Long, L.C.; Zhou, Y. Green finance, government intervention, and regional carbon emission efficiency. Stat. Decis. 2023, 39, 149–154. [Google Scholar]
- Wang, K.L.; Zhao, B.; Ding, L.L.; Miao, Z. Government intervention, market development, and pollution emission efficiency: Evidence from China. Sci. Total Environ. 2021, 757, 143738. [Google Scholar]
- Li, X. Local government decision-making competition and regional carbon emissions: Experience evidence and emission reduction measures. Sustain. Energy Technol. Assess. 2022, 50, 101800. [Google Scholar]
- Wu, Y.Y.; Qi, J.; Xian, Q.; Chen, J.D. Research on the Carbon Emission Reduction Effect of China’s Carbon Market: A Collaborative Perspective of Market Mechanisms and Administrative Intervention. China Ind. Econ. 2021, 8, 114–132. [Google Scholar]
- Yuan, W.P.; Sun, H.; Yan, M. Can dual environmental regulations help achieve a win-win development of high-quality economy and carbon reduction—From the perspective of Chinese style decentralized governance system. J. Yunnan Financ. Trade Inst. 2021, 37, 67–86. [Google Scholar]
- Yang, Z.A.; Liu, Z.S.; Chen, M.H. Fiscal decentralization, government innovation preference, and environmental governance. Friends Account. 2024, 8, 93–101. [Google Scholar]
- Zhang, K.; Xu, D.; Li, S.; Wu, T.; Cheng, J. Strategic interactions in environmental regulation enforcement: Evidence from Chinese cities. Environ. Sci. Pollut. Res. 2021, 28, 1992–2006. [Google Scholar] [CrossRef]
- OECD. OECD Core Set of Indicators for Environmental Performance Reviews: A Synthesis Report by the Group on the State of the Environment; Organization for the Economic Co-Operation and Development: Paris, France, 1993. [Google Scholar]
- Shen, J.Q.; Sun, Y. The Evaluation Index System of Regional Green GDP Based on DPSIR Model. J. Hohai Univ. (Philos. Soc. Sci.) 2016, 18, 56. [Google Scholar]
- Cui, X.Y.; Fang, L.; Wang, X.R.; Kang, J.F. Study on evaluation of ecological security of Yangtze River Delta Urban Agglomeration based on DPSIR modeling. Ecol. Lett. 2021, 41, 302–319. [Google Scholar]
- Wu, J.; He, T.R.; Ren, J.J. Exploring the ecological security of Chengkou County, Chongqing Municipality based on DPSIR modeling. J. Chongqing Norm. Univ. (Nat. Sci. Ed.) 2019, 36, 55–61. [Google Scholar]
- Li, L. Evaluation of land ecological security in Jinan City based on DPSIR modeling. J. Shandong Agric. Eng. Coll. 2022, 39, 13–20. [Google Scholar]
- Gregory, A.J.; Atkins, J.P.; Burdon, D.; Elliott, M. A problem structuring method for ecosystem-based management: The dpsir modelling process. Eur. J. Oper. Res. 2013, 227, 558–569. [Google Scholar] [CrossRef]
- Xiang, L.; Zhou, W.; Ren, J.; Huang, Y.H.; Guan, Y.J. Ecological security evaluation of plateau urban wetland based on DPSIRM model: With Xining section of Huangshui Basin as an example. Chin. J. Ecol. 2022, 41, 2064–2071. [Google Scholar]
- Dong, Y.Y. Construction of ecological safety evalustion system based on ‘ecological elements-DPSIRM’. Res. Soil Water Conserv. 2020, 27, 333–339. [Google Scholar]
- Zhang, F.; Yang, J.; Xi, J.C.; Li, X.M.; Chen, P. Ecosystem health assessment of Nansihu Lake based on DPSIRM and health distance model. Resour. Sci. 2014, 36, 831–839. [Google Scholar]
- Hansen, B.E. Threshold effects in non-dynamic panels: Estimation, testing, and inference. J. Econ. 1999, 93, 345–368. [Google Scholar]
- Fikru, M.G. Policy preference for a net zero carbon economy: Results from a us national survey. Energy Policy 2025, 198, 114479. [Google Scholar]
- Fan, Y.; Jia, J.J.; Wang, X.; Xu, J.H. What policy adjustments in the EU ets truly affected the carbon prices? Energy Policy 2017, 103, 145–164. [Google Scholar]
- Putri, H.O.; Hutapea, R.S. Analysis of implementation of carbon tax policy in efforts to address climate change issues with studies in Australia, Japan, Colombia, and Indonesia. Indones. J. Econ. Manag. 2024, 4, 305–316. [Google Scholar]
- Yang, J.; Shi, Y.T. Has the digital economy improved regional carbon emissions levels from the perspectives of emission reduction and efficiency improvement. Wuhan Financ. 2023, 5, 51–58. [Google Scholar]
- Song, A.F.; Rasool, Z.; Nazar, R.; Anser, M.K. Towards a greener future: How green technology innovation and energy efficiency are transforming sustainability. Energy 2024, 290, 129891. [Google Scholar]
- Zuo, Z.L.; Guo, H.X.; Cheng, J.H.; Li, Y.L. How to achieve new progress in ecological civilization construction?–Based on cloud model and coupling coordination degree model. Ecol. Indic. 2021, 127, 107789. [Google Scholar]
- Wang, H. The Coupled and Coordinated Development of Energy Economy Environment System in Xinjiang Region. Mod. Bus. Trade Ind. 2022, 43, 32–34. [Google Scholar]
- Dong, T.T.; Jia, X.X.; Fang, J.D. Low carbon pilot policies and carbon reduction in high energy consuming industries: Internal mechanisms and empirical evidence. Oper. Res. Fuzziology 2023, 13, 5165–5176. [Google Scholar]
- Liu, C.; Xin, L.; Li, J. Environmental regulation and manufacturing carbon emission China: A New perspective on local government competition. Environ. Sci. Pollut. Res. 2022, 29, 36351–36375. [Google Scholar]
- Li, Y.X.; Cheng, H.F.; Ni, C.J. Energy Transition Policies and Urban Green Innovation Vitality: A Quasi Natural Experiment Based on New Energy Demonstration City Policies. China Popul. Resour. Environ. 2023, 33, 137–149. [Google Scholar]
- Balthasar, A.; Schreurs, M.A.; Varone, F. Energy transition in Europe and the United States: Policy entrepreneurs and veto players in federalist systems. J. Environ. Dev. 2019, 29, 3–25. [Google Scholar]
- Yan, C.L.; Zhao, F.Y.; Niu, H. Environmental target responsibility system, environmental governance, and endogenous economic growth. Econ. Res. J. 2024, 59, 133–152. [Google Scholar]
- Wang, W.Y.; Bei, D.G. Digital inclusive finance, government fiscal intervention, and county-level economic growth: Empirical analysis based on threshold panel regression. Econ. Theory Bus. Manag. 2022, 2, 41–53. [Google Scholar]
- Sun, L.P.; Yang, Y. Empirical Study on the Transformation and Upgrading of Western Industries, Improvement of 37 Environmental Quality, and Local Government financial intervention: Based on Provincial Panel Data Model. J. Qujing Norm. Univ. 2022, 41, 102–107. [Google Scholar]
- Chen, X.D.; Lu, H.Y. Tax reduction and fee reduction, government financial intervention, and green total factor productivity: Analysis based on dynamic panel threshold model. Commer. Res. 2023, 2, 49–56. [Google Scholar]
- Wang, H.; Wang, H.M. Quality of Environmental Information Disclosure, Government financial intervention, and Corporate Green Transformation. Commer. Sci. Res. 2024, 31, 64–76. [Google Scholar]
- Zhang, X.Y.; Shi, F. Pilot of innovative cities, government financial intervention strategies, and high-quality economic development. Res. Econ. Manag. 2022, 43, 3–19. [Google Scholar]
- Xu, Q.; Dong, Y.; Yang, R. Urbanization impact on carbon emissions in the Pearl River Delta region: Kuznets curve relationships. J. Clean. Prod. 2018, 180, 514–523. [Google Scholar]
- Wang, Y.; Li, L.; Kubota, J.; Han, R.; Zhu, X.; Lu, G. Does urbanization lead to more carbon emission? Evidence from a panel of BRICS countries. Appl. Energy 2016, 168, 375–380. [Google Scholar] [CrossRef]
- Zhou, Y.; Liu, Y. Does population have a larger impact on carbon dioxide emissions than income? Evidence from a cross-regional panel analysis in China. Appl. Energy 2016, 180, 800–809. [Google Scholar] [CrossRef]
- Dong, B.; Ma, X.; Zhang, Z.; Zhang, H.; Chen, R.; Song, Y.; Shen, M.; Xiang, R. Carbon emissions, the industrial structure and economic growth: Evidence from heterogeneous industries in China. Environ. Pollut. 2020, 262, 114322. [Google Scholar] [CrossRef]
- Wang, Z.; Lia, C.; Liu, Q.; Niu, B.; Peng, S.; Deng, L.; Kang, P.; Zhang, X. Pollution haven hypothesis of domestic trade in China: A perspective of SO2 emissions. Sci. Total Environ. 2019, 663, 198–205. [Google Scholar] [CrossRef]
- Guo, S.; Tang, X.; Meng, T.; Chu, J.; Tang, H. Industrial Structure, R&D Staff, and Green Total Factor Productivity of China: Evidence from the Low-Carbon Pilot Cities. Complexity 2021, 2021, 6690152. [Google Scholar]
- Hu, J.B.; Wang, K.W. The spatiotemporal differences and spatial convergence of carbon emission efficiency among Chinese provinces. J. Xinxiang Educ. Coll. 2022, 35, 36–52. [Google Scholar]
- Wen, S.Y.; Shi, H.M.; Guo, J. The Emission Reduction Effect of Green Finance from the Perspective of General 16 Equilibrium Theory: From Model Construction to Empirical Testing. Chin. J. Manag. Sci. 2022, 30, 173–184. [Google Scholar]


| Primary Indicator | Theory | Secondary Indicators | Indicator Attribute | Unit | Weight |
|---|---|---|---|---|---|
| driving force | AGDP | + | CNY | 0.0841 | |
| Urban population ratio | + | % | 0.0979 | ||
| state | Per capita income | + | CNY | 0.0817 | |
| Tertiary industry growth rate | + | % | 0.0858 | ||
| impact | Per capita ratio | + | % | 0.0766 | |
| Per capita disposable income | + | CNY | 0.1204 | ||
| Per capita living consumption expenditure | + | CNY | 0.0862 | ||
| Social labor productivity | + | % | 0.188 | ||
| response | Patent authorization quantity | + | unit | 0.091 | |
| management | R&D budget expenditure | + | 100 m RMB | 0.0883 | |
| pressure | Energy consumption per-unit GDP | - | 10 kt /100 m Y | 0.1001 | |
| Per capita domestic energy consumption | - | 10 kt/10 k people | 0.1788 | ||
| state | Industrial electricity consumption | - | GWh | 0.1521 | |
| Social electricity consumption | - | GWh | 0.1668 | ||
| Total energy consumption growth | - | % | 0.0997 | ||
| impact | Elasticity of energy consumption | + | % | 0.2045 | |
| response | Energy utilization rate | + | % | 0.047 | |
| management | Investment in energy technology R&D | + | 100 m RMB | 0.051 | |
| pressure | Industrial SO2 emissions | - | ton | 0.0838 | |
| Industrial wastewater discharge | - | stere | 0.1161 | ||
| Industrial smoke and dust emissions | - | ton | 0.1464 | ||
| state | Urban precipitation | + | mm | 0.1037 | |
| Total water resources | + | Gm3 | 0.1025 | ||
| impact | Green coverage rate | + | 0.0616 | ||
| response | Utilization rate of industrial solid waste | + | % | 0.1060 | |
| Urban sewage treatment rate | + | % | 0.0810 | ||
| Harmless treatment of domestic garbage | + | % | 0.0768 | ||
| management | Environmental protection budget expenditure | + | 100 m RMB | 0.1223 |
| Variable | Observations | Mean Value | SD. | Min Value | Max Value |
|---|---|---|---|---|---|
| 143 | 1.701 | 0.354 | 0.786 | 2.374 | |
| 143 | 4.118 | 2.627 | 0.01 | 10.006 | |
| 143 | 4.686 | 1.564 | 1.641 | 8.412 | |
| 143 | 4.733 | 2.031 | 1.402 | 9.507 | |
| 143 | 53.748 | 59.705 | 2 | 333 | |
| 143 | 5.654 | 4.178 | −24.454 | 19.179 | |
| 143 | 65.734 | 9.482 | 48.3 | 86.8 | |
| 143 | 6.559 | 1.701 | 3.581 | 10.143 | |
| 143 | 2.832 | 1.319 | 1.095 | 6.324 | |
| 143 | 1.241 | 0.321 | 0.8 | 2.067 |
| Explanatory Variable | (1) | (2) | (3) |
|---|---|---|---|
| −0.173 ** | |||
| (0.085) | |||
| 0.0028 * | |||
| (0.0023) | |||
| −0.243 ** | |||
| (0.120) | |||
| −0.0030 *** | |||
| (0.0012) | |||
| −0.153 * | |||
| (0.111) | |||
| −0.0003 | |||
| (0.0013) | |||
| 0.018 *** | 0.022*** | 0.019 *** | |
| (0.007) | (0.007) | (0.007) | |
| 0.067 * | 0.053 | 0.053 | |
| (0.050) | (0.049) | (0.049) | |
| 0.262 *** | 0.042 *** | 0.246 *** | |
| (0.059) | (0.058) | (0.058) | |
| −0.543 ** | −0.604 ** | −0.462 * | |
| (0.272) | (0.273) | (0.282) | |
| −0.222 | −0.463 * | −0.300 | |
| (0.366) | (0.356) | (0.366) | |
| −0.2099 *** | −0.2975 *** | −0.2013 ** | |
| (0.0802) | (0.0806) | (0.0864) | |
| Constant | 0.5917 ** | 0.9765 *** | 0.6631 ** |
| (0.2825) | (0.2991) | (0.2807) | |
| 0.6591 | 0.6588 | 0.6535 |
| Explanatory Variable | (1) | (2) | (3) |
|---|---|---|---|
| −0.018 ** | |||
| (0.009) | |||
| −0.025 ** | |||
| (0.012) | |||
| −0.019 | |||
| (0.012) | |||
| 0.002 ** | 0.002 *** | 0.002 ** | |
| (0.001) | (0.001) | (0.001) | |
| 0.006 | 0.005 | 0.004 | |
| (0.005) | (0.005) | (0.005) | |
| 0.028 *** | 0.026 *** | 0.028 *** | |
| (0.007) | (0.007) | (0.007) | |
| −0.051 * | −0.058 ** | −0.04 | |
| (0.028) | (0.028) | (0.029) | |
| −0.035 | −0.06 | −0.05 | |
| (0.044) | (0.043) | (0.043) | |
| −0.004 | −0.004 | −0.006 | |
| (0.007) | (0.007) | (0.007) | |
| −0.217 *** | −0.307 *** | −0.204 ** | |
| (0.081) | (0.083) | (0.086) | |
| Constant | 0.506 | 0.899 *** | 0.513 |
| (0.324) | (0.33) | (0.332) | |
| 0.660 | 0.660 | 0.655 |
| Explanatory Variable | (1) | (2) | (3) |
|---|---|---|---|
| −0.022 *** | |||
| (0.003) | |||
| −0.015 *** | |||
| (0.005) | |||
| −0.031 *** | |||
| (0.004) | |||
| −0.001 *** | −0.001 *** | −0.001 *** | |
| (0.001) | (0.001) | (0.001) | |
| 0.003 * | 0.006 *** | 0.004 ** | |
| (0.002) | (0.002) | (0.002) | |
| 0.002 | 0.003 | 0.004 * | |
| (0.002) | (0.002) | (0.002) | |
| −0.002 | −0.004 | −0.019 * | |
| (0.01) | (0.011) | (0.01) | |
| 0.036 *** | 0.056 *** | 0.037 *** | |
| (0.014) | (0.015) | (0.013) | |
| 0.04 | 0.065 ** | −0.011 | |
| (0.03) | (0.034) | (0.03) | |
| Constant | 7.509 *** | 7.483 *** | 7.476 *** |
| (0.105) | (0.125) | (0.099) | |
| 0.539 | 0.418 | 0.579 |
| Variable | LLC Test |
|---|---|
| −4.4852 *** | |
| −5.9924 *** | |
| −5.4258 *** | |
| −4.9214 *** | |
| −5.6539 *** | |
| −6.4971 *** | |
| −2.5091 *** | |
| −5.3368 *** | |
| 2.9885 * | |
| −2.8661 *** |
| Explanatory Variable | Threshold Variable | Threshold Value | 95% Confidence Interval | |
|---|---|---|---|---|
| 1.1145 | (1.1120, 1.1254) | |||
| 1.5295 | (1.3522, 1.5309) | |||
| 1.028 | (0.9876, 1.0283) | |||
| 1.9085 | (1.8254, 1.9124) | |||
| 1.1145 | (1.1075, 1.1167) | |||
| 1.5309 | (1.5145, 1.5514) | |||
| Explaining Variable | Threshold Variable | Number | BS Frequency | F-Value | p-Value | 10% Critical Level | 5% Critical Level | 1% Critical Level | |
|---|---|---|---|---|---|---|---|---|---|
| Single threshold | 500 | 18.98 | 0.000 | 16.638 | 16.638 | 16.638 | |||
| Double threshold | 500 | 11.39 | 0.000 | 11.032 | 11.032 | 11.032 | |||
| Single threshold | 500 | 12.77 | 0.000 | 5.788 | 5.788 | 5.788 | |||
| Double threshold | 500 | 10.36 | 0.000 | 7.744 | 7.744 | 7.744 | |||
| Single threshold | 500 | 17.17 | 0.000 | 15.408 | 15.408 | 15.408 | |||
| Double threshold | 500 | 15.25 | 0.000 | 14.699 | 14.699 | 14.699 | |||
| Explaining Variable | (1) | (2) | (3) |
|---|---|---|---|
| −0.14 *** | |||
| (0.041) | |||
| −0.024 * | |||
| (0.032) | |||
| −0.016 *** | |||
| (0.040) | |||
| −0.043 * | |||
| (0.038) | |||
| −0.149 *** | |||
| (0.031) | |||
| −0.322 *** | |||
| (0.063) | |||
| −0.133 ** | |||
| (0.044) | |||
| −0.11 | |||
| (0.035) | |||
| −0.014 *** | |||
| (0.046) | |||
| 0.04 ** | 0.03 *** | 0.004 ** | |
| (0.02) | (0.02) | (0.002) | |
| −0.03 | 0.015 * | −0.006 | |
| (0.12) | (0.012) | (0.012) | |
| 0.127 *** | 0.109 *** | 0.127 *** | |
| (0.029) | (0.026) | (0.026) | |
| −0.01 | −0.001 | −0.001 | |
| (0.113) | (0.11) | (0.0117) | |
| 0.006 | −0.019 * | −0.0101 | |
| (0.15) | (0.0136) | (0.0143) | |
| −0.1092 *** | −0.0574 * | −0.1356 *** | |
| (0.0413) | (0.044) | (0.0445) | |
| Constant | 0.861 *** | 1.0564 *** | 1.0564 *** |
| (0.189) | (0.1402) | (0.1402) | |
| 0.5585 | 0.5678 | 0.5678 |
Disclaimer/Publisher’s Note: The statements, opinions and data contained in all publications are solely those of the individual author(s) and contributor(s) and not of MDPI and/or the editor(s). MDPI and/or the editor(s) disclaim responsibility for any injury to people or property resulting from any ideas, methods, instructions or products referred to in the content. |
© 2025 by the authors. Licensee MDPI, Basel, Switzerland. This article is an open access article distributed under the terms and conditions of the Creative Commons Attribution (CC BY) license (https://creativecommons.org/licenses/by/4.0/).
Share and Cite
Ye, J.; Tian, L. The Regulatory Effect of Government Fiscal Intervention on Carbon Reduction—A System Analysis Based on Economy–Energy–Environment. Sustainability 2025, 17, 2873. https://doi.org/10.3390/su17072873
Ye J, Tian L. The Regulatory Effect of Government Fiscal Intervention on Carbon Reduction—A System Analysis Based on Economy–Energy–Environment. Sustainability. 2025; 17(7):2873. https://doi.org/10.3390/su17072873
Chicago/Turabian StyleYe, Jing, and Lixin Tian. 2025. "The Regulatory Effect of Government Fiscal Intervention on Carbon Reduction—A System Analysis Based on Economy–Energy–Environment" Sustainability 17, no. 7: 2873. https://doi.org/10.3390/su17072873
APA StyleYe, J., & Tian, L. (2025). The Regulatory Effect of Government Fiscal Intervention on Carbon Reduction—A System Analysis Based on Economy–Energy–Environment. Sustainability, 17(7), 2873. https://doi.org/10.3390/su17072873