
Sustainable Utilization of Dewatered Sewage Sludge via Hydrothermal Conversion: Focus on Steroid Transformation

 ,
,
Abstract
1. Introduction
2. Materials and Methods
2.1. Materials and Apparatus
2.2. Methods
2.2.1. Preparation and Separation of the Products
2.2.2. Sludge and Products Analysis
3. Results and Discussion
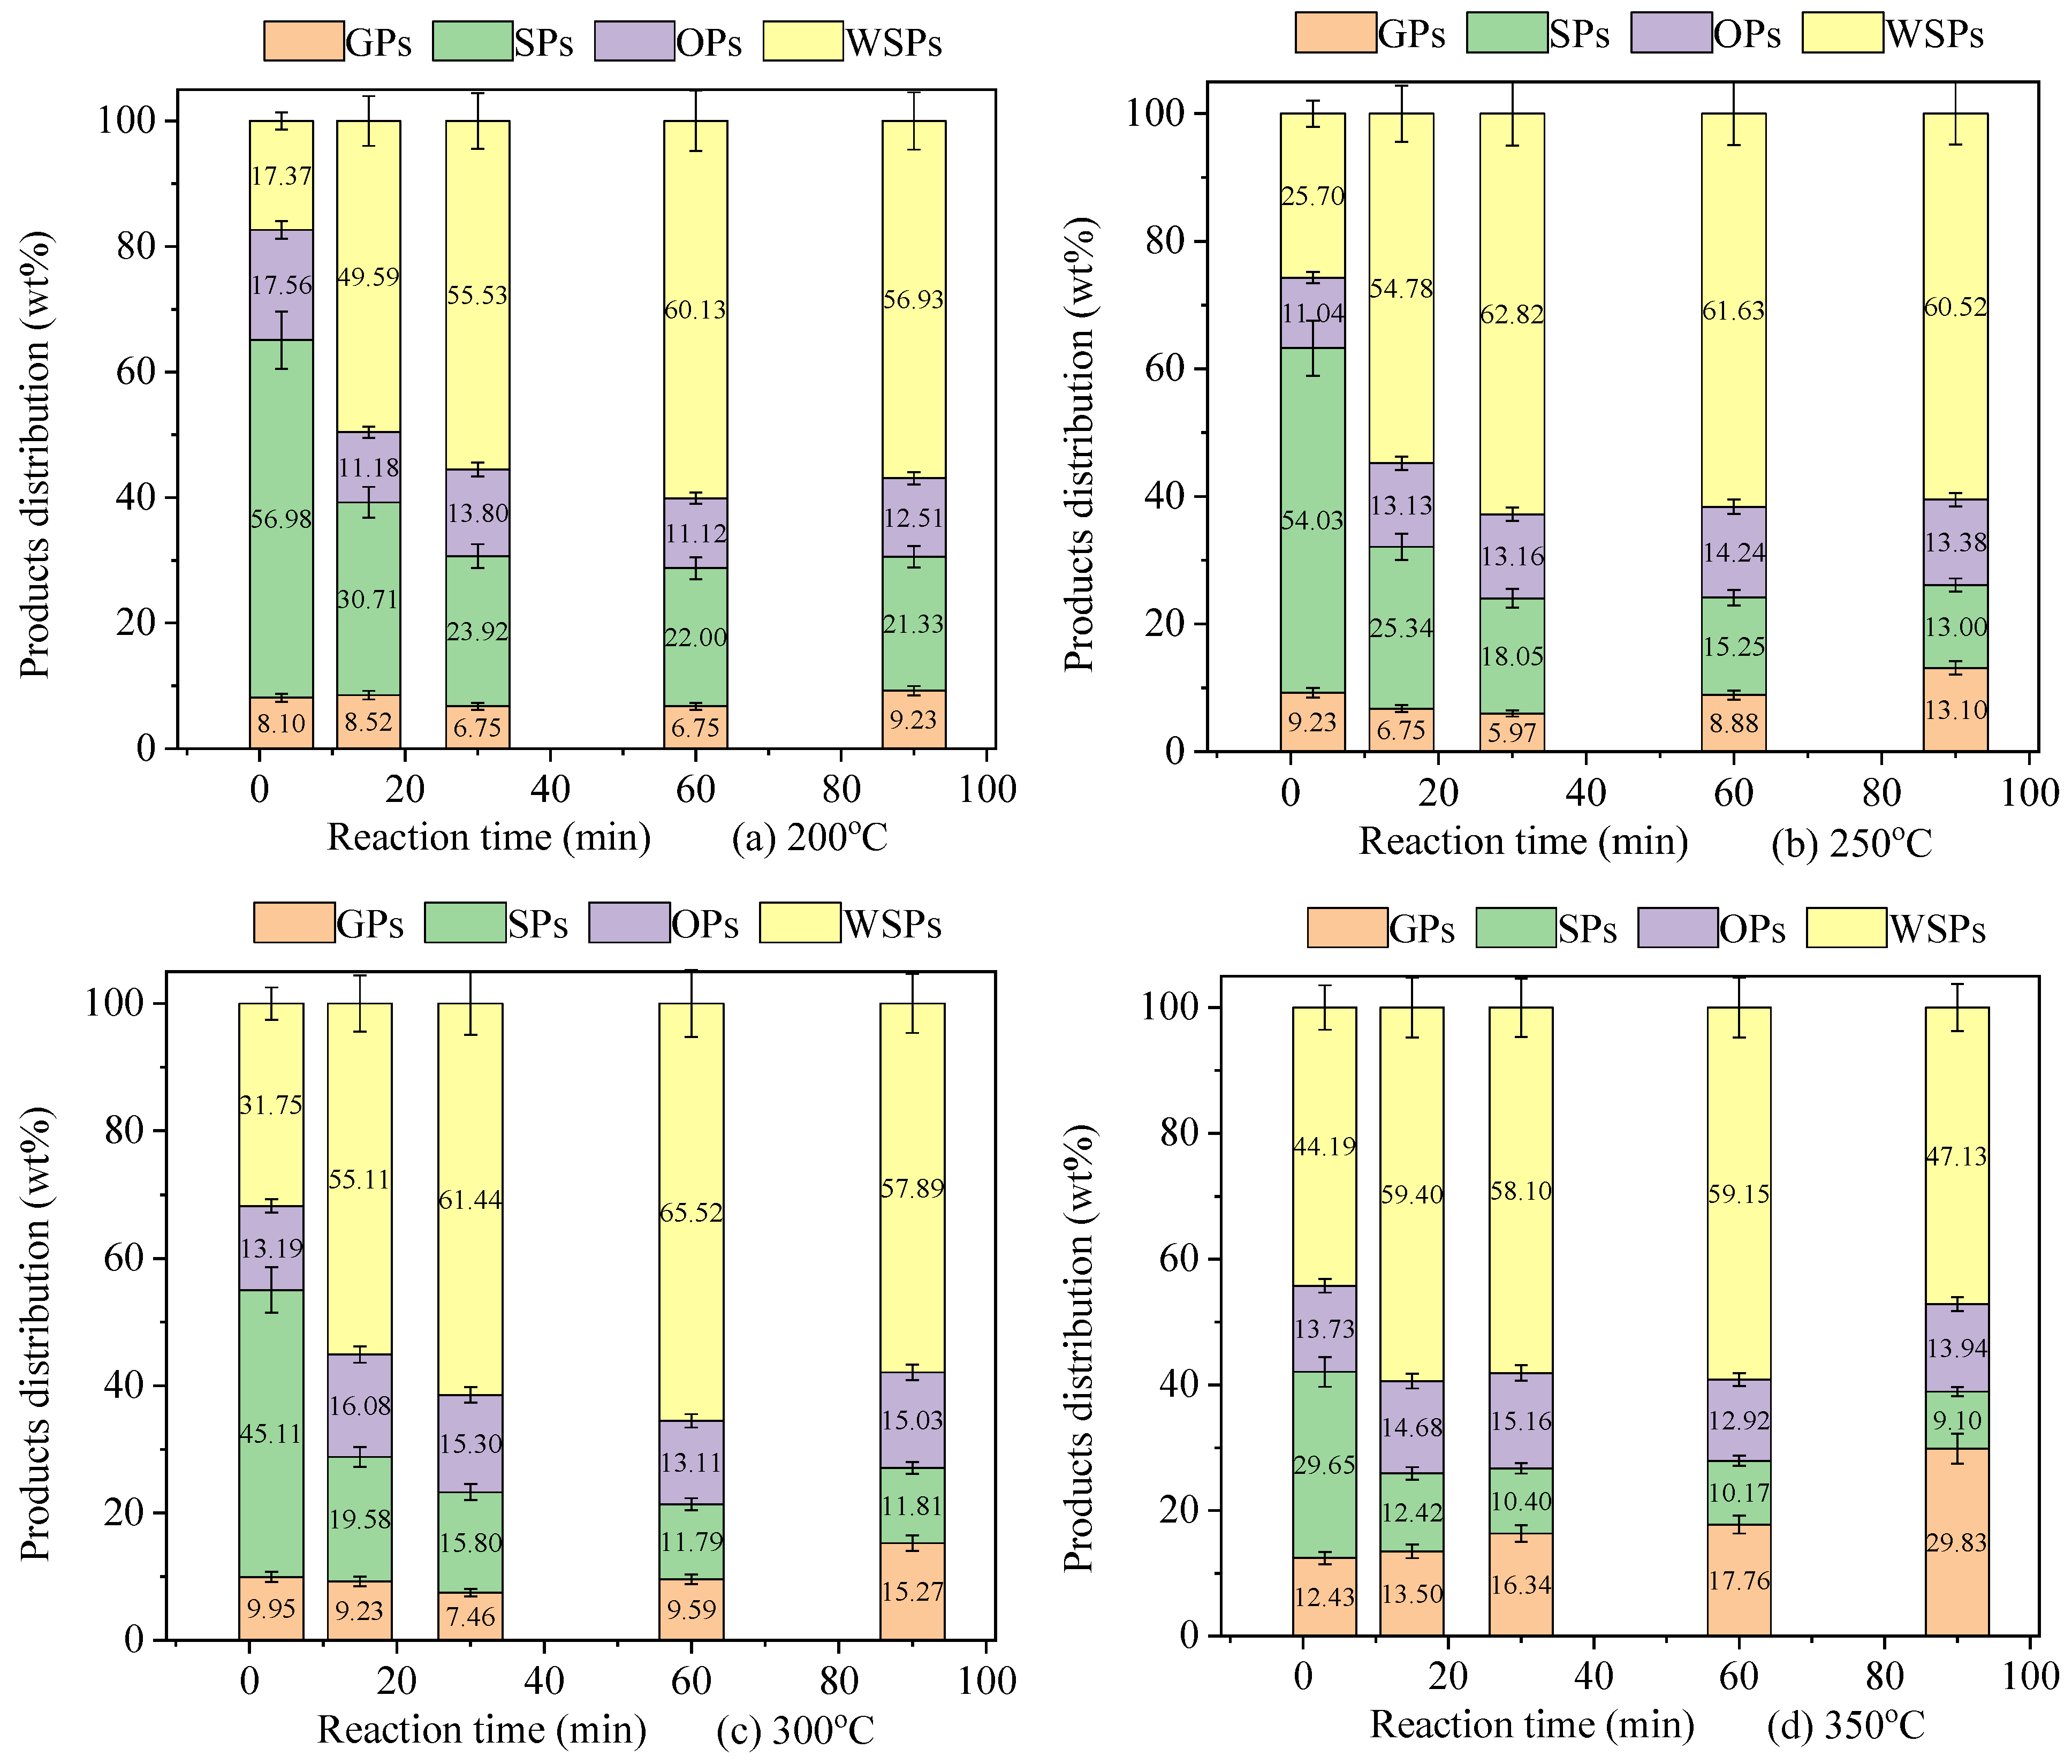
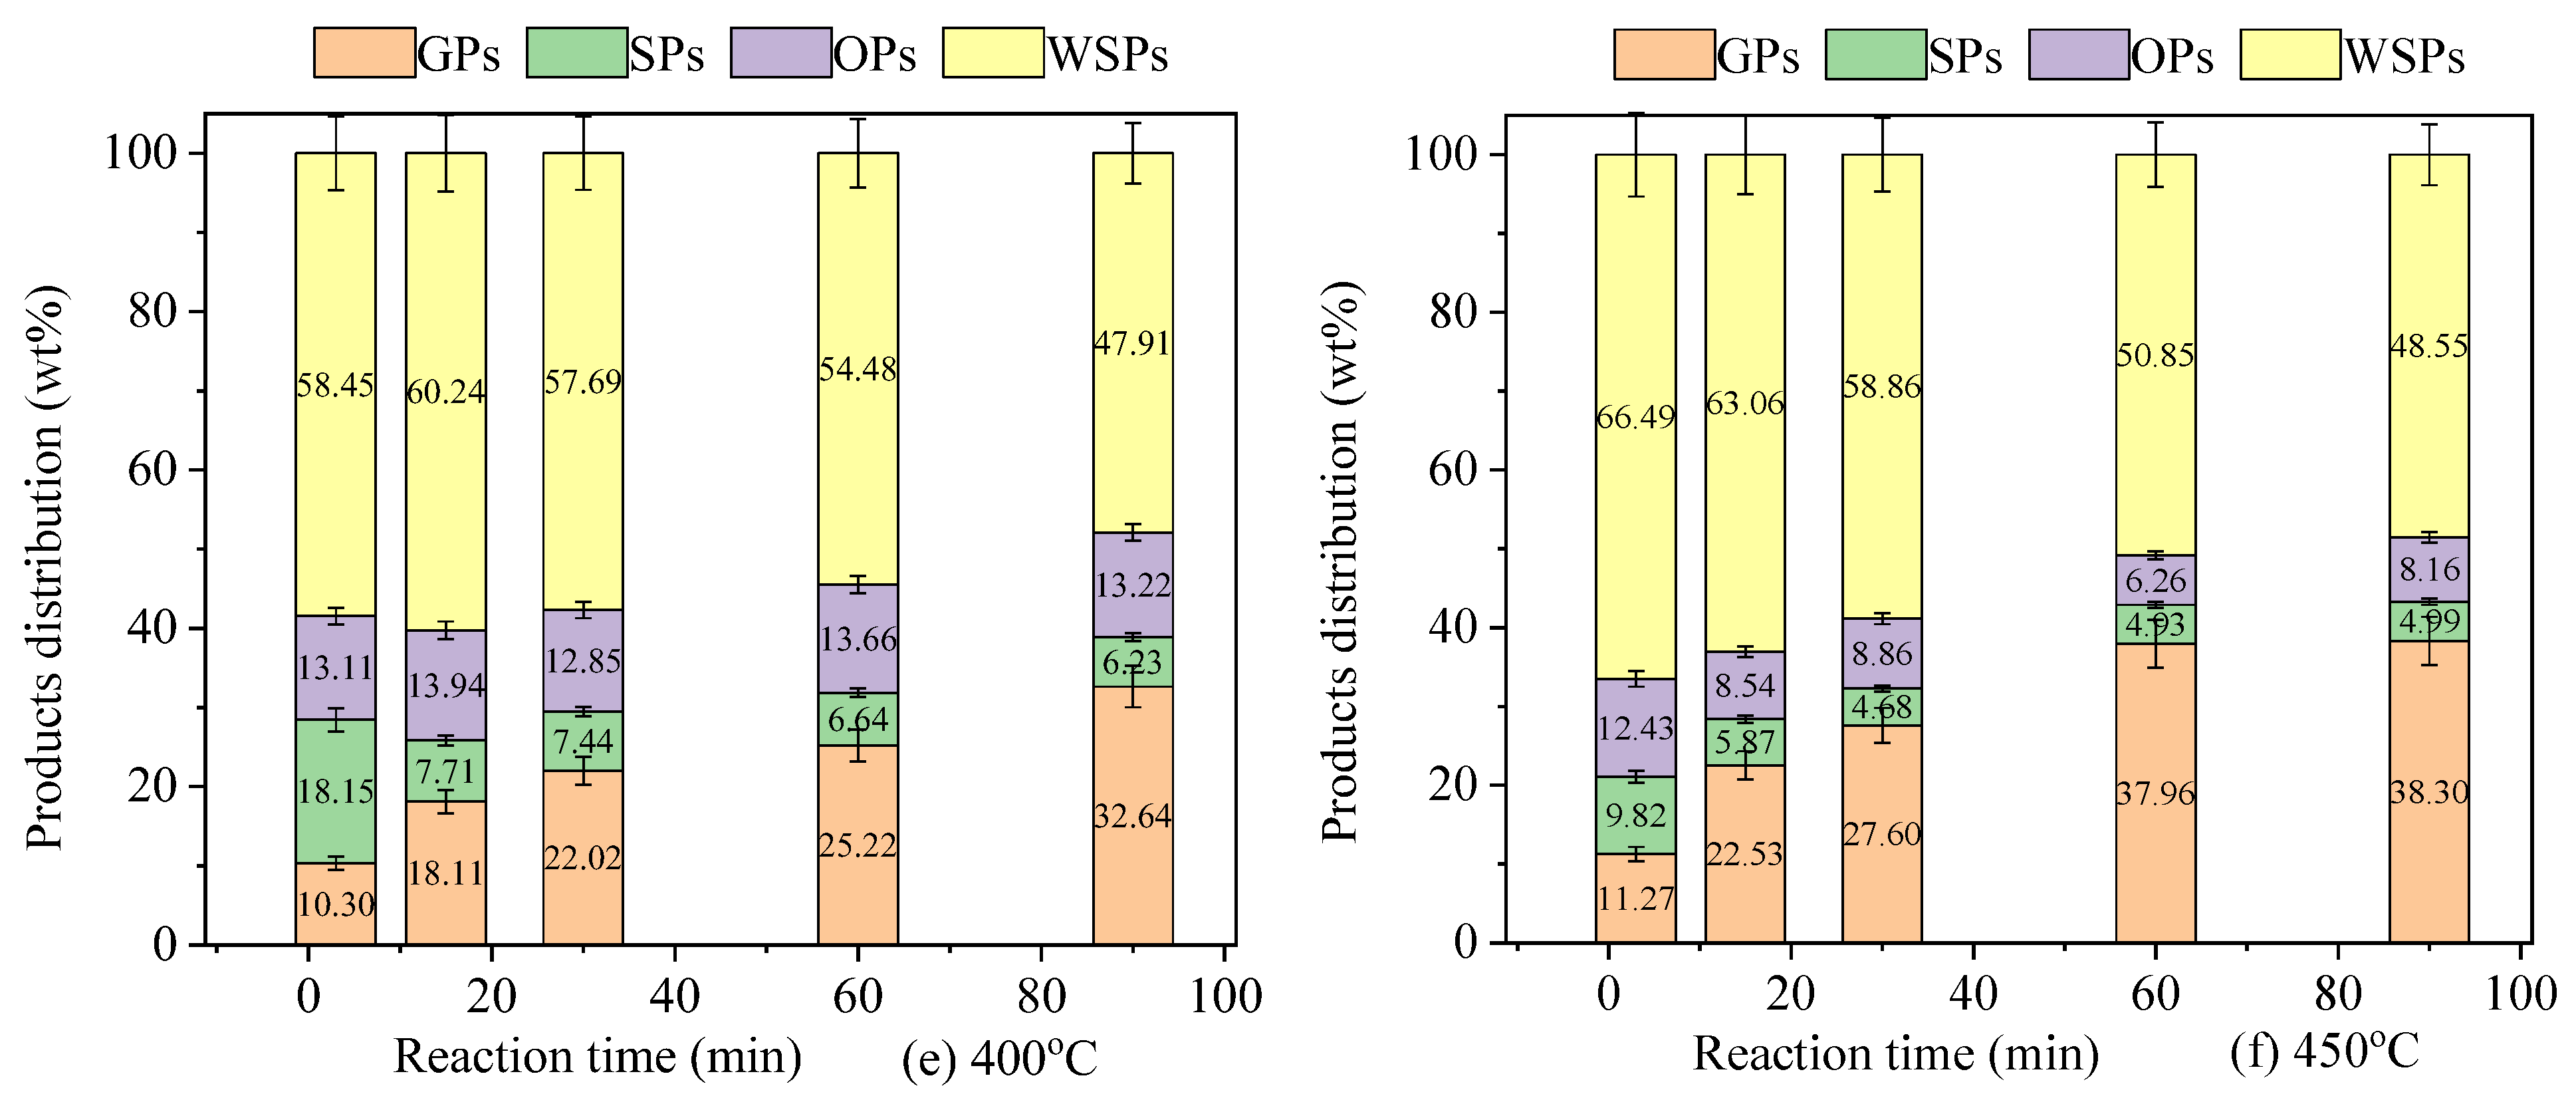
3.1. Analysis of General Products
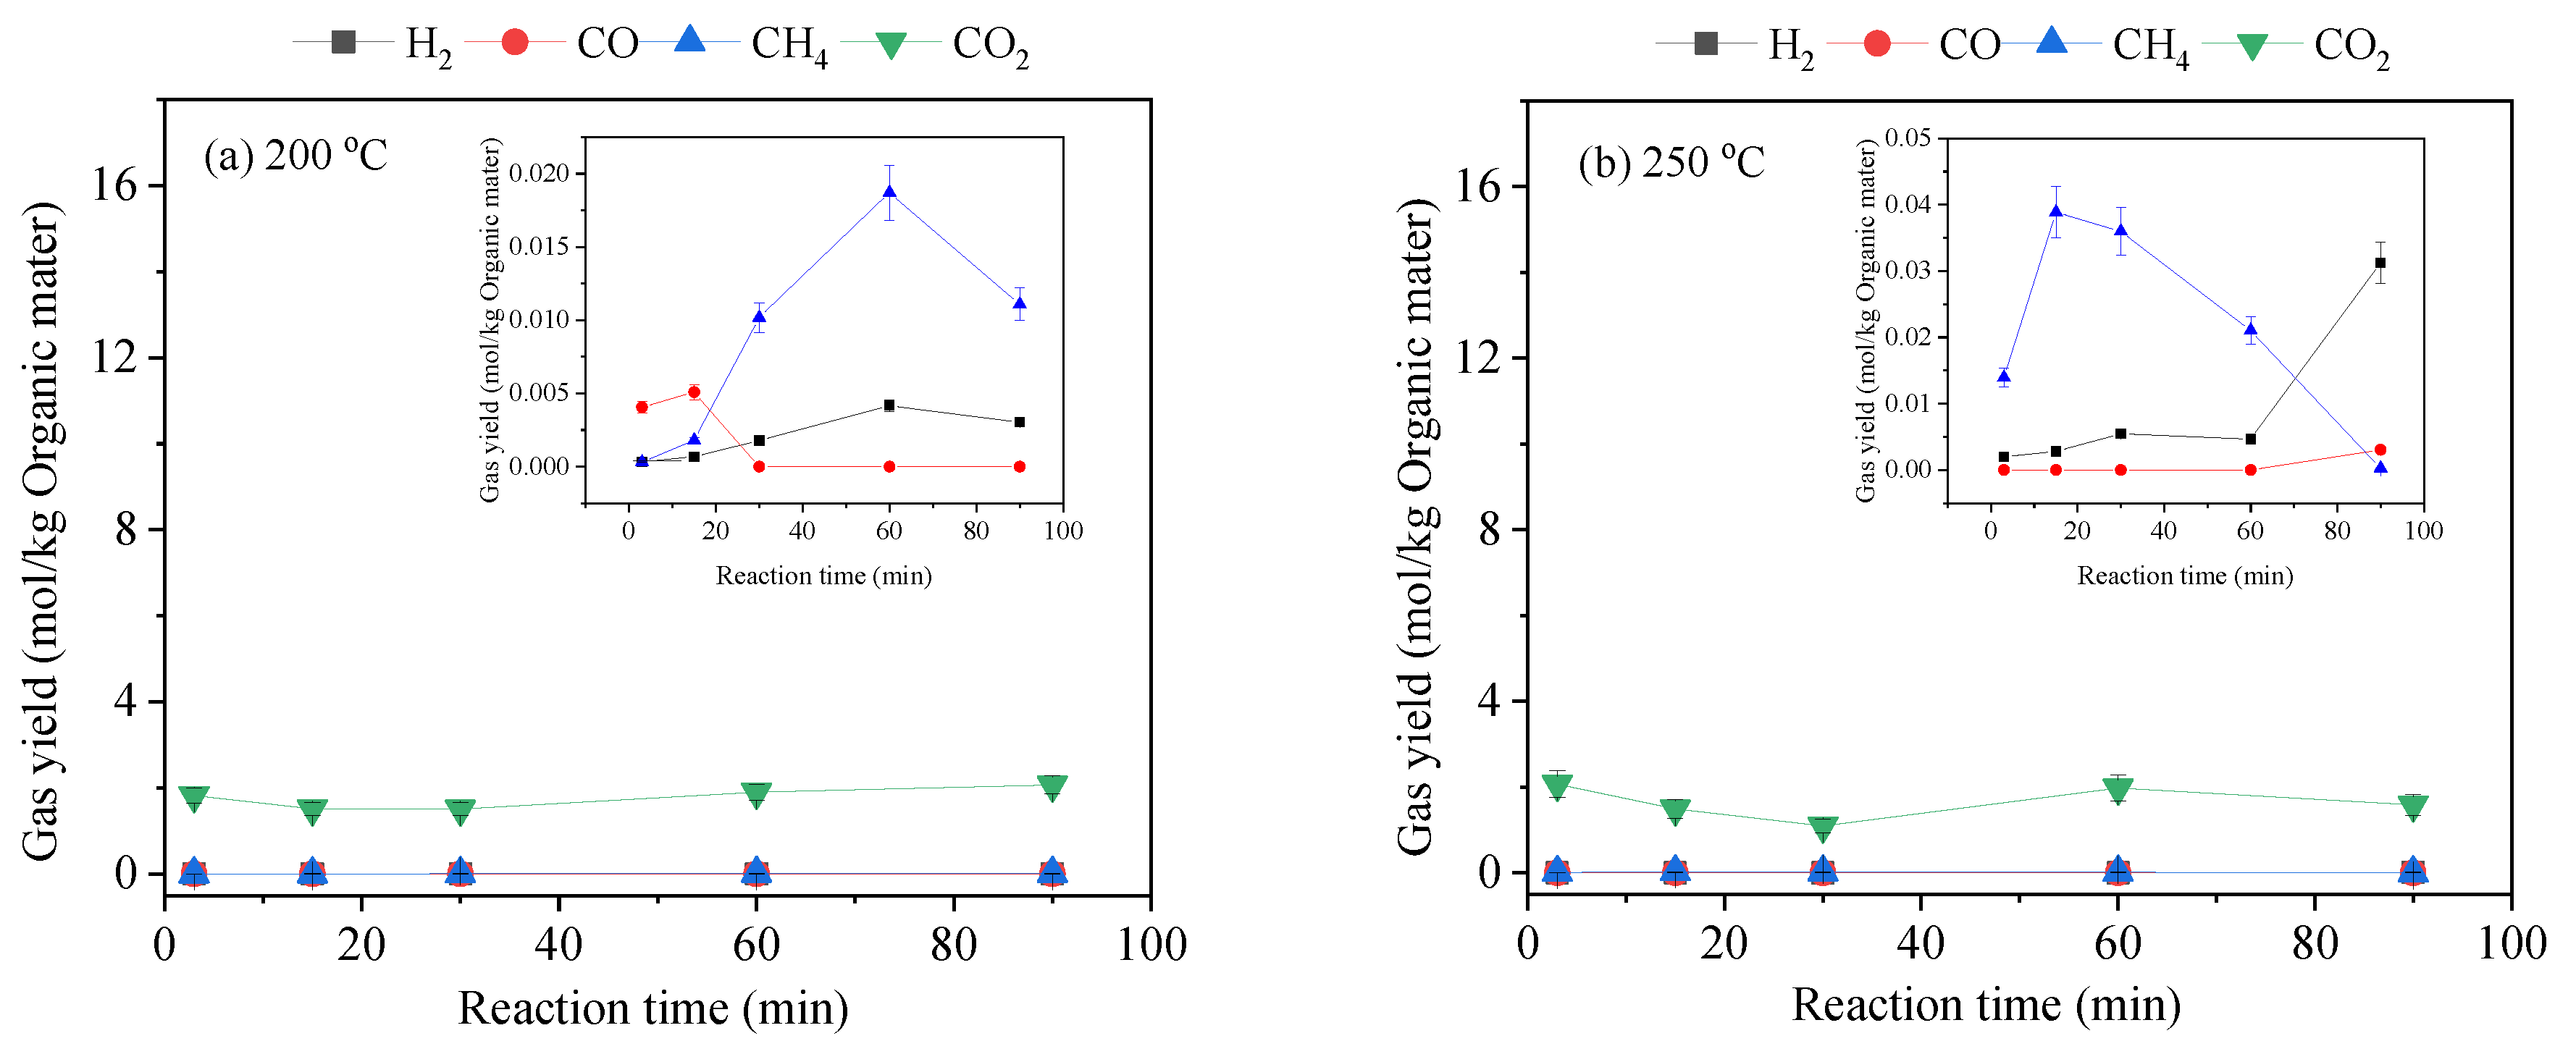
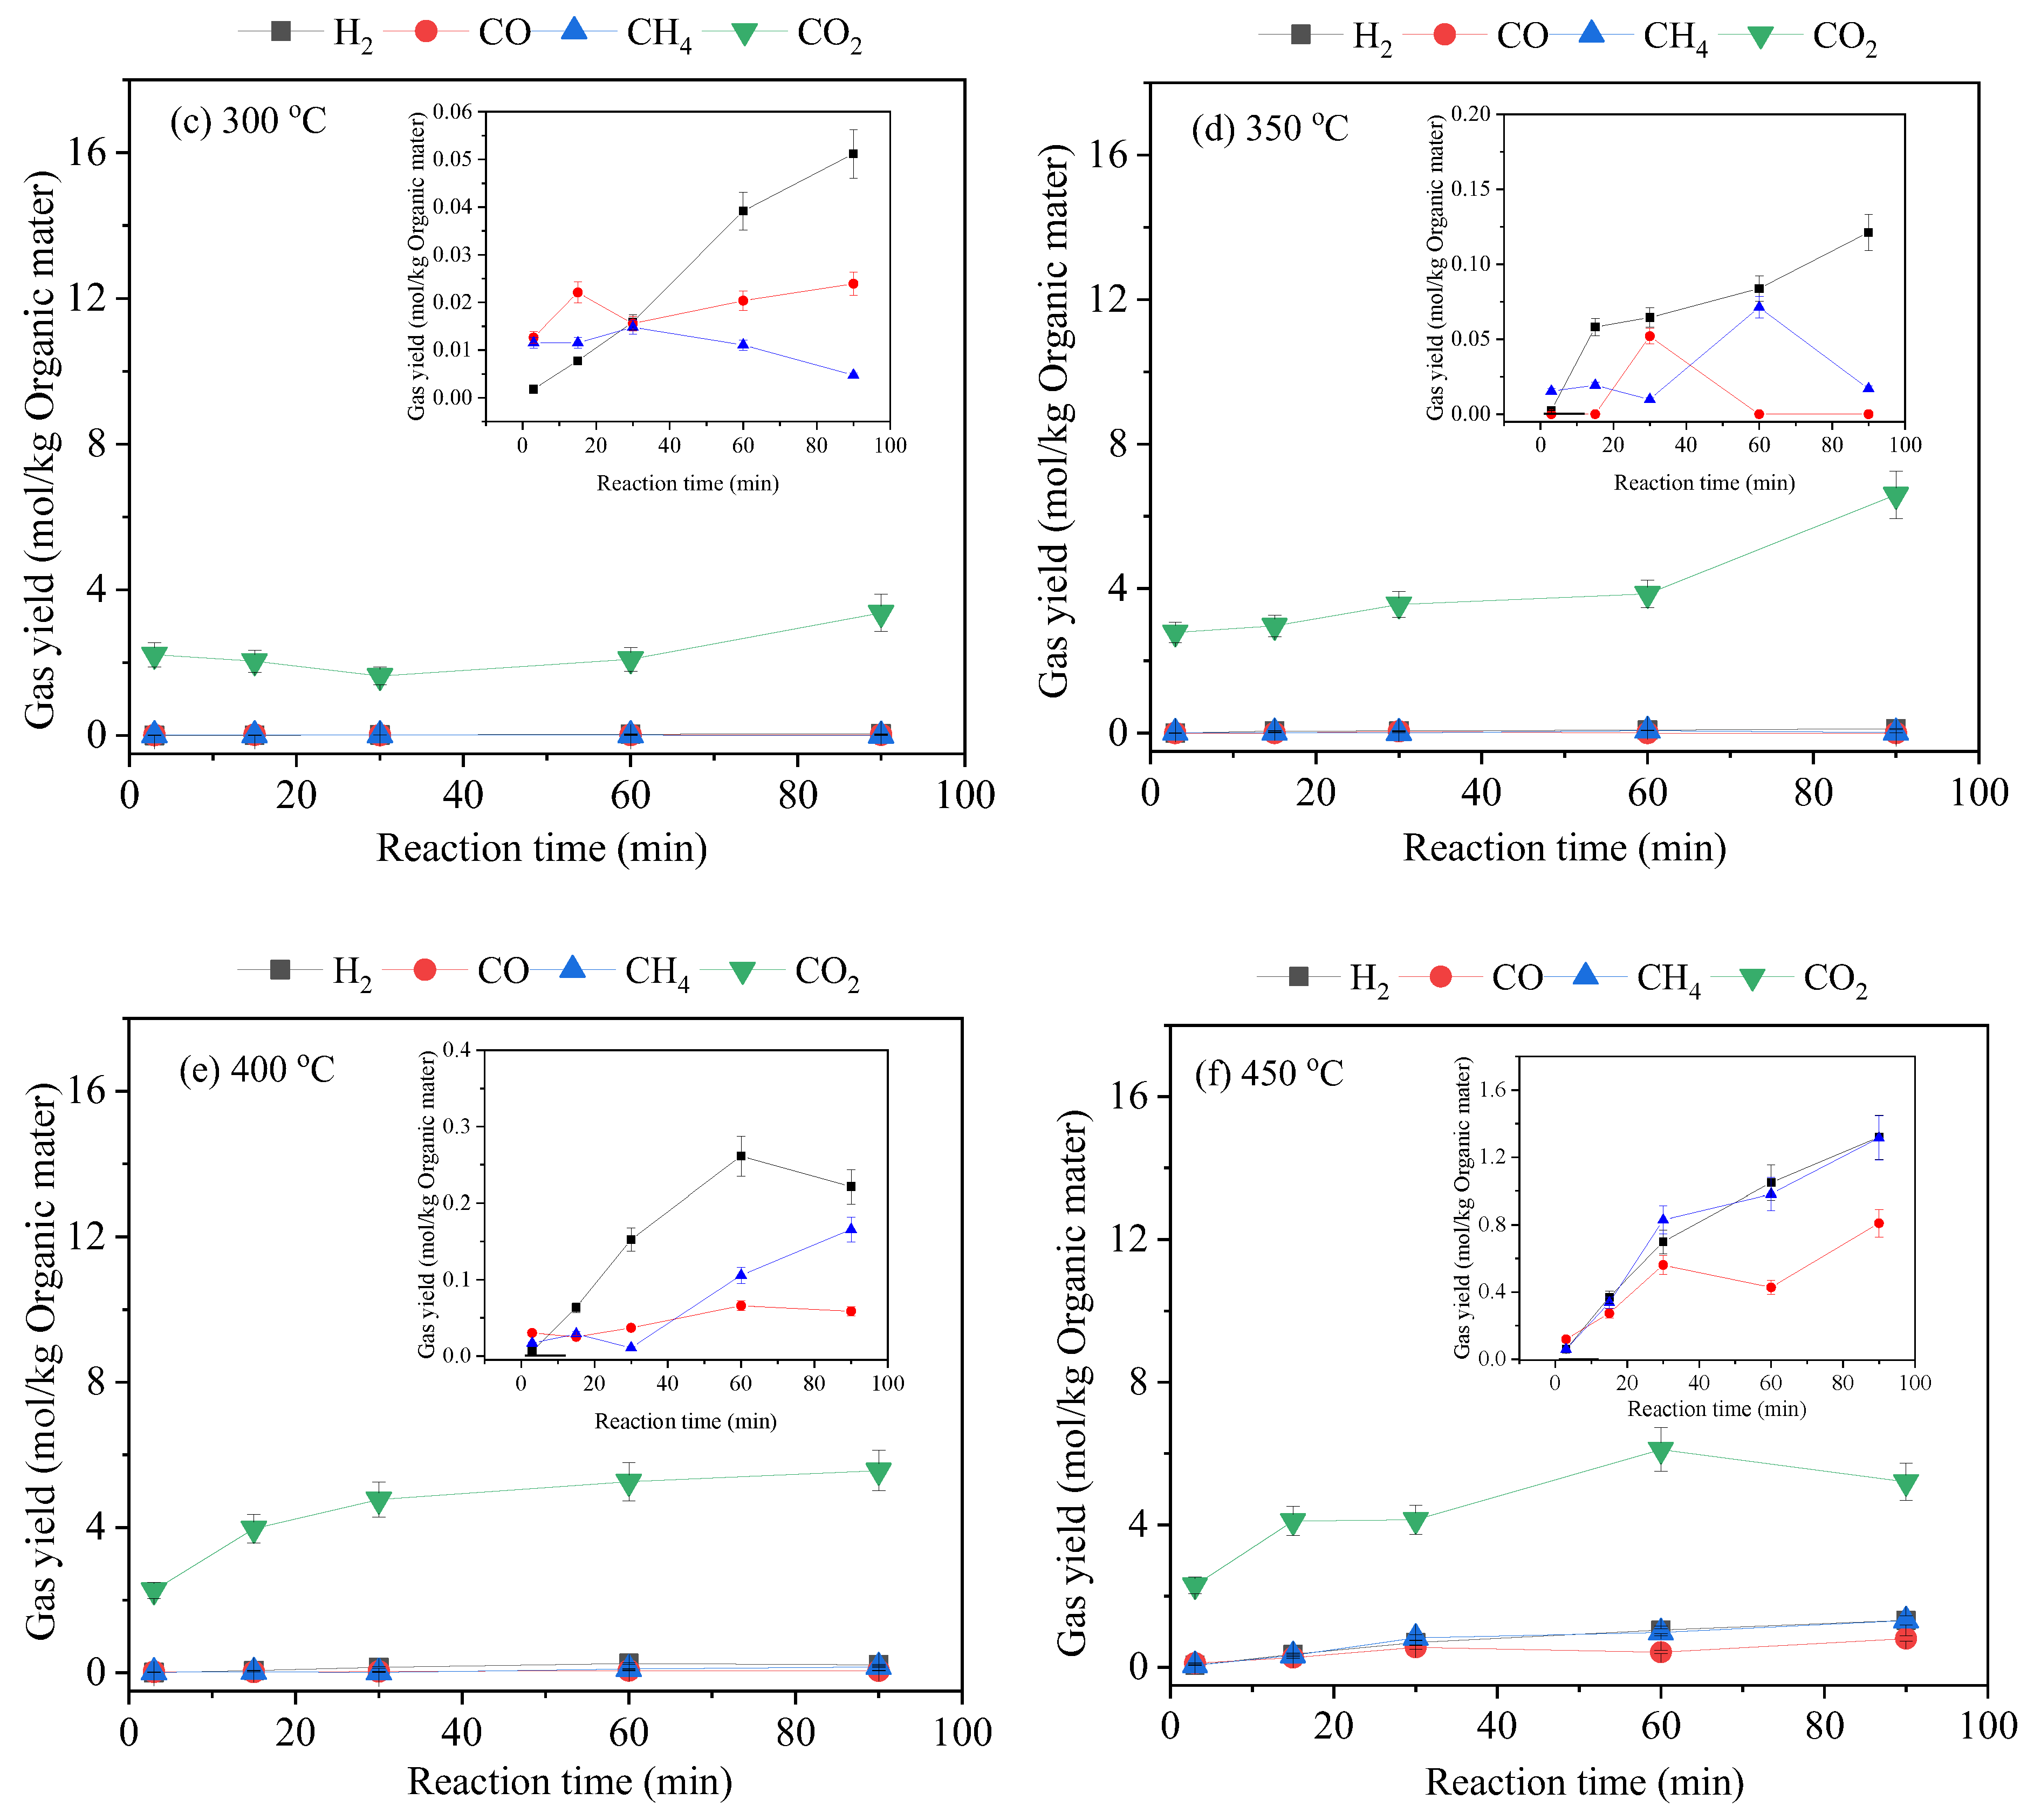
3.2. Gas-Phase Products
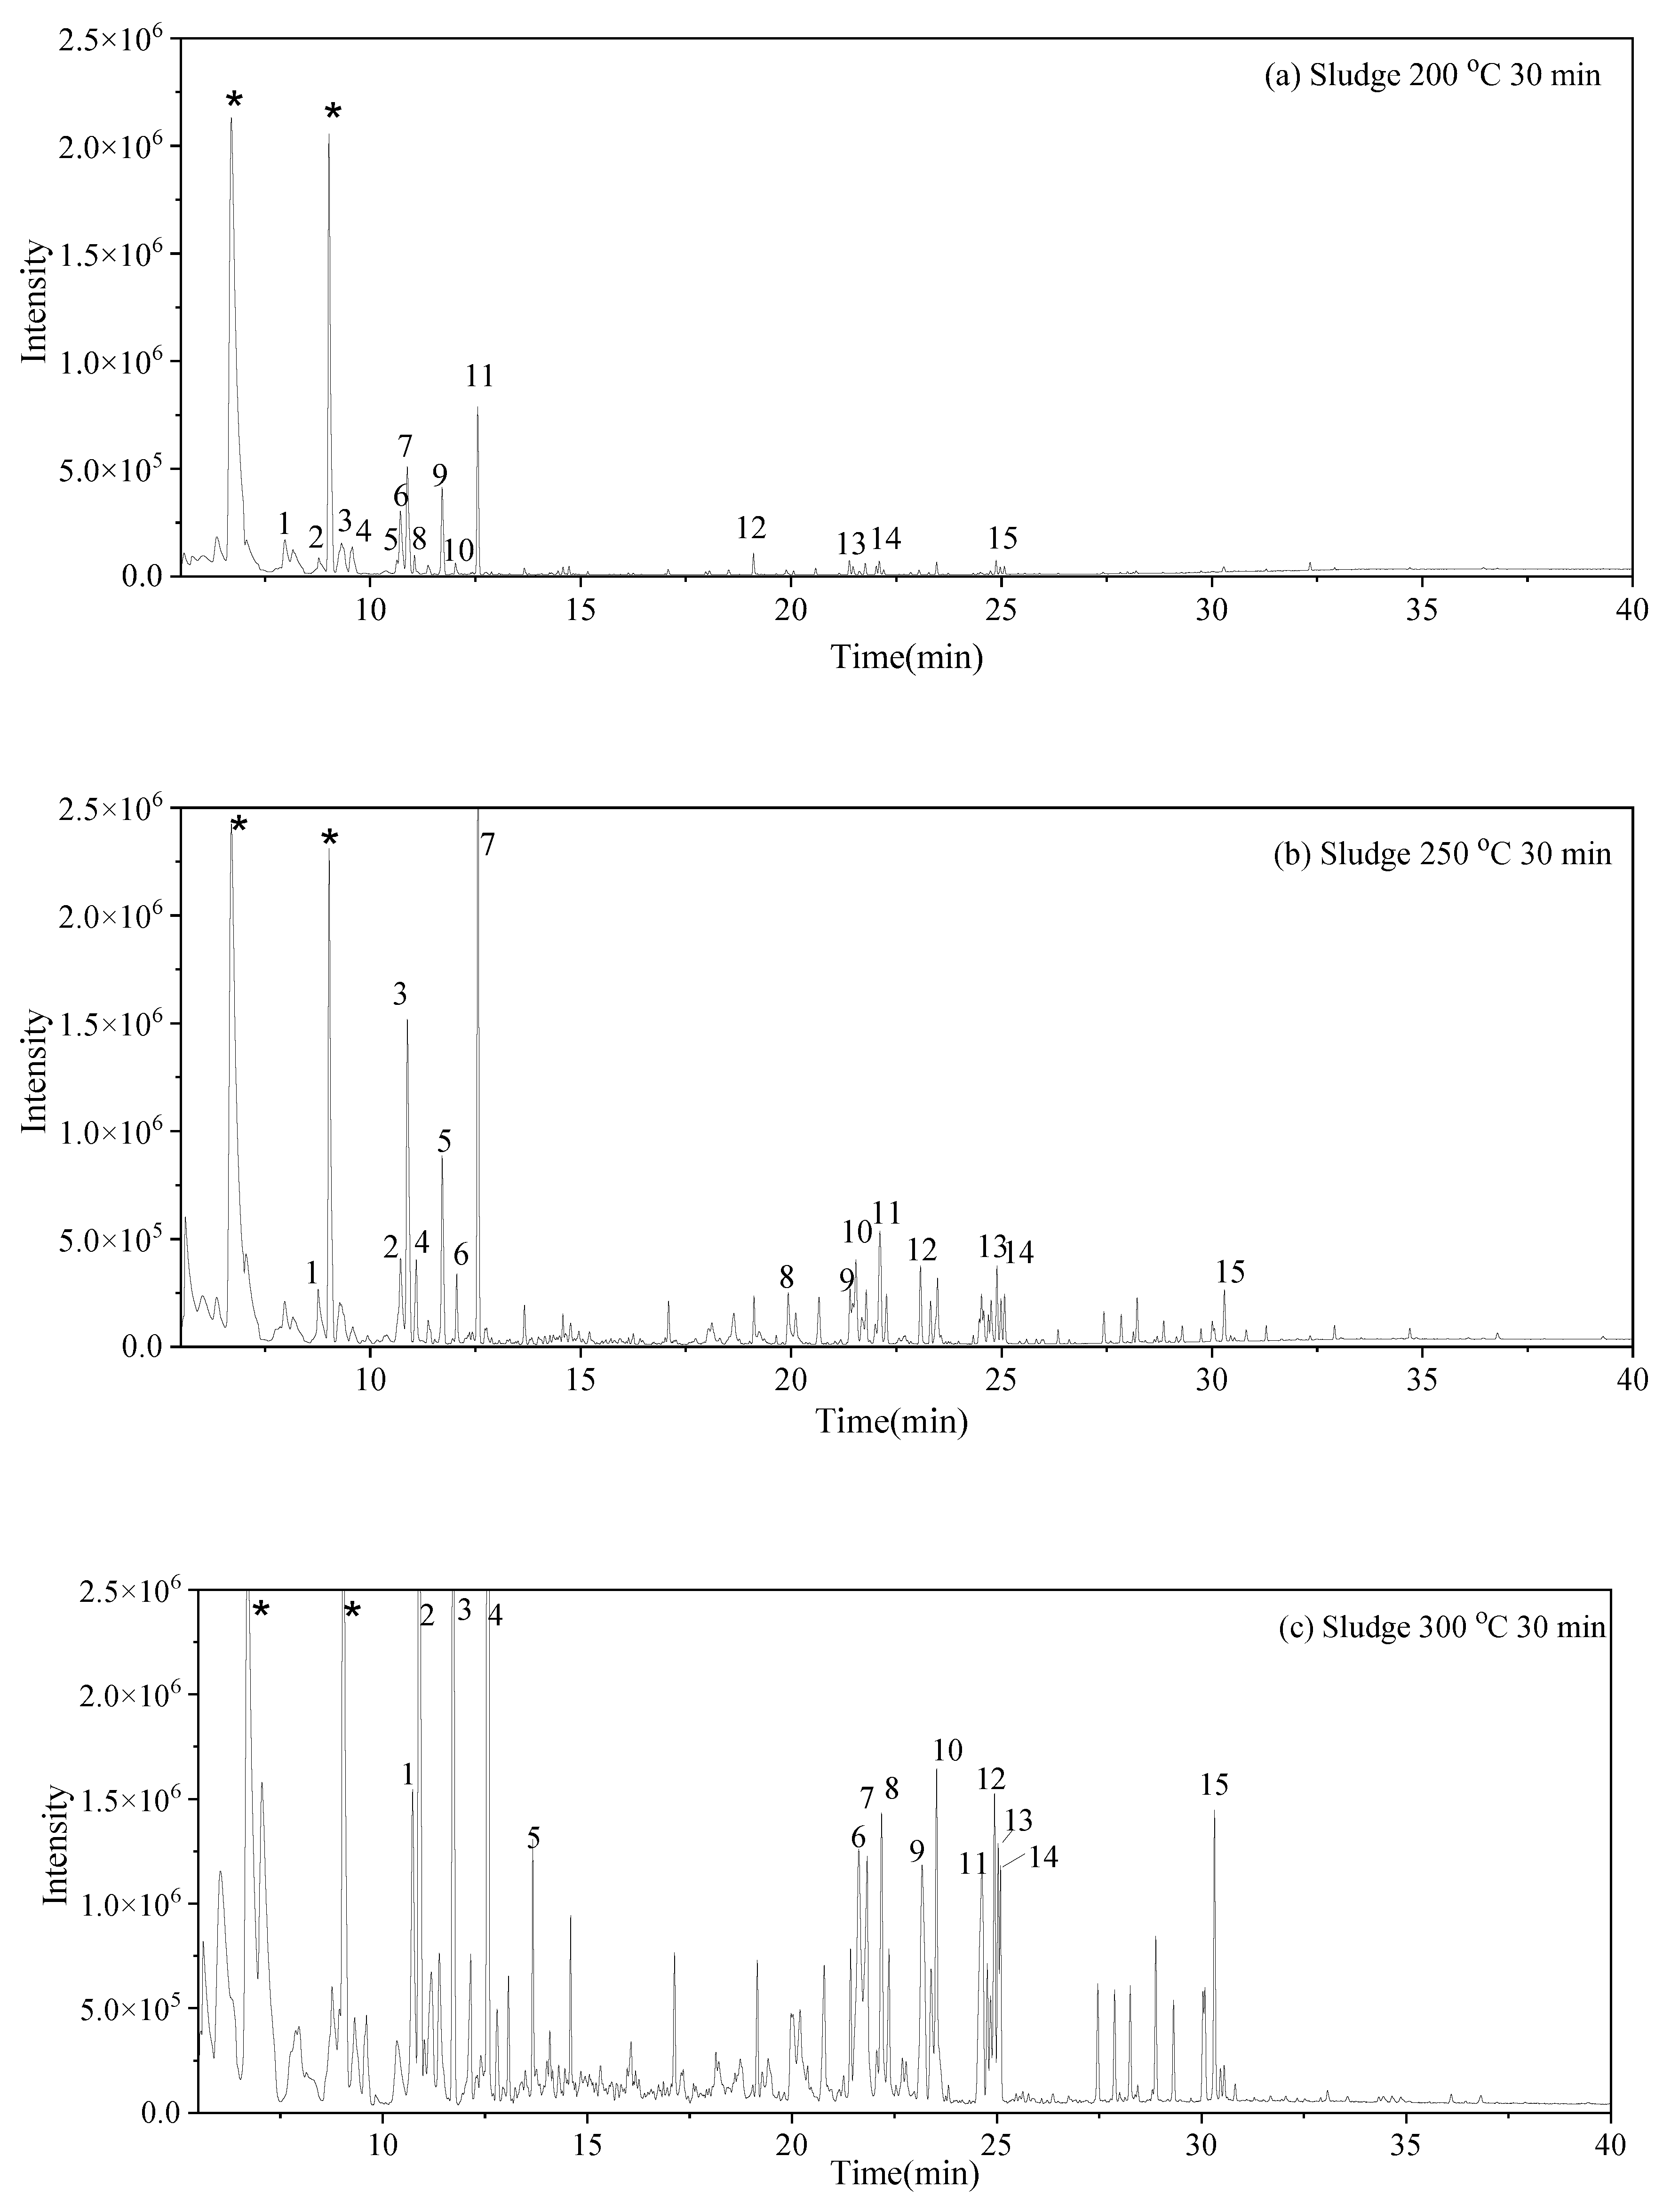
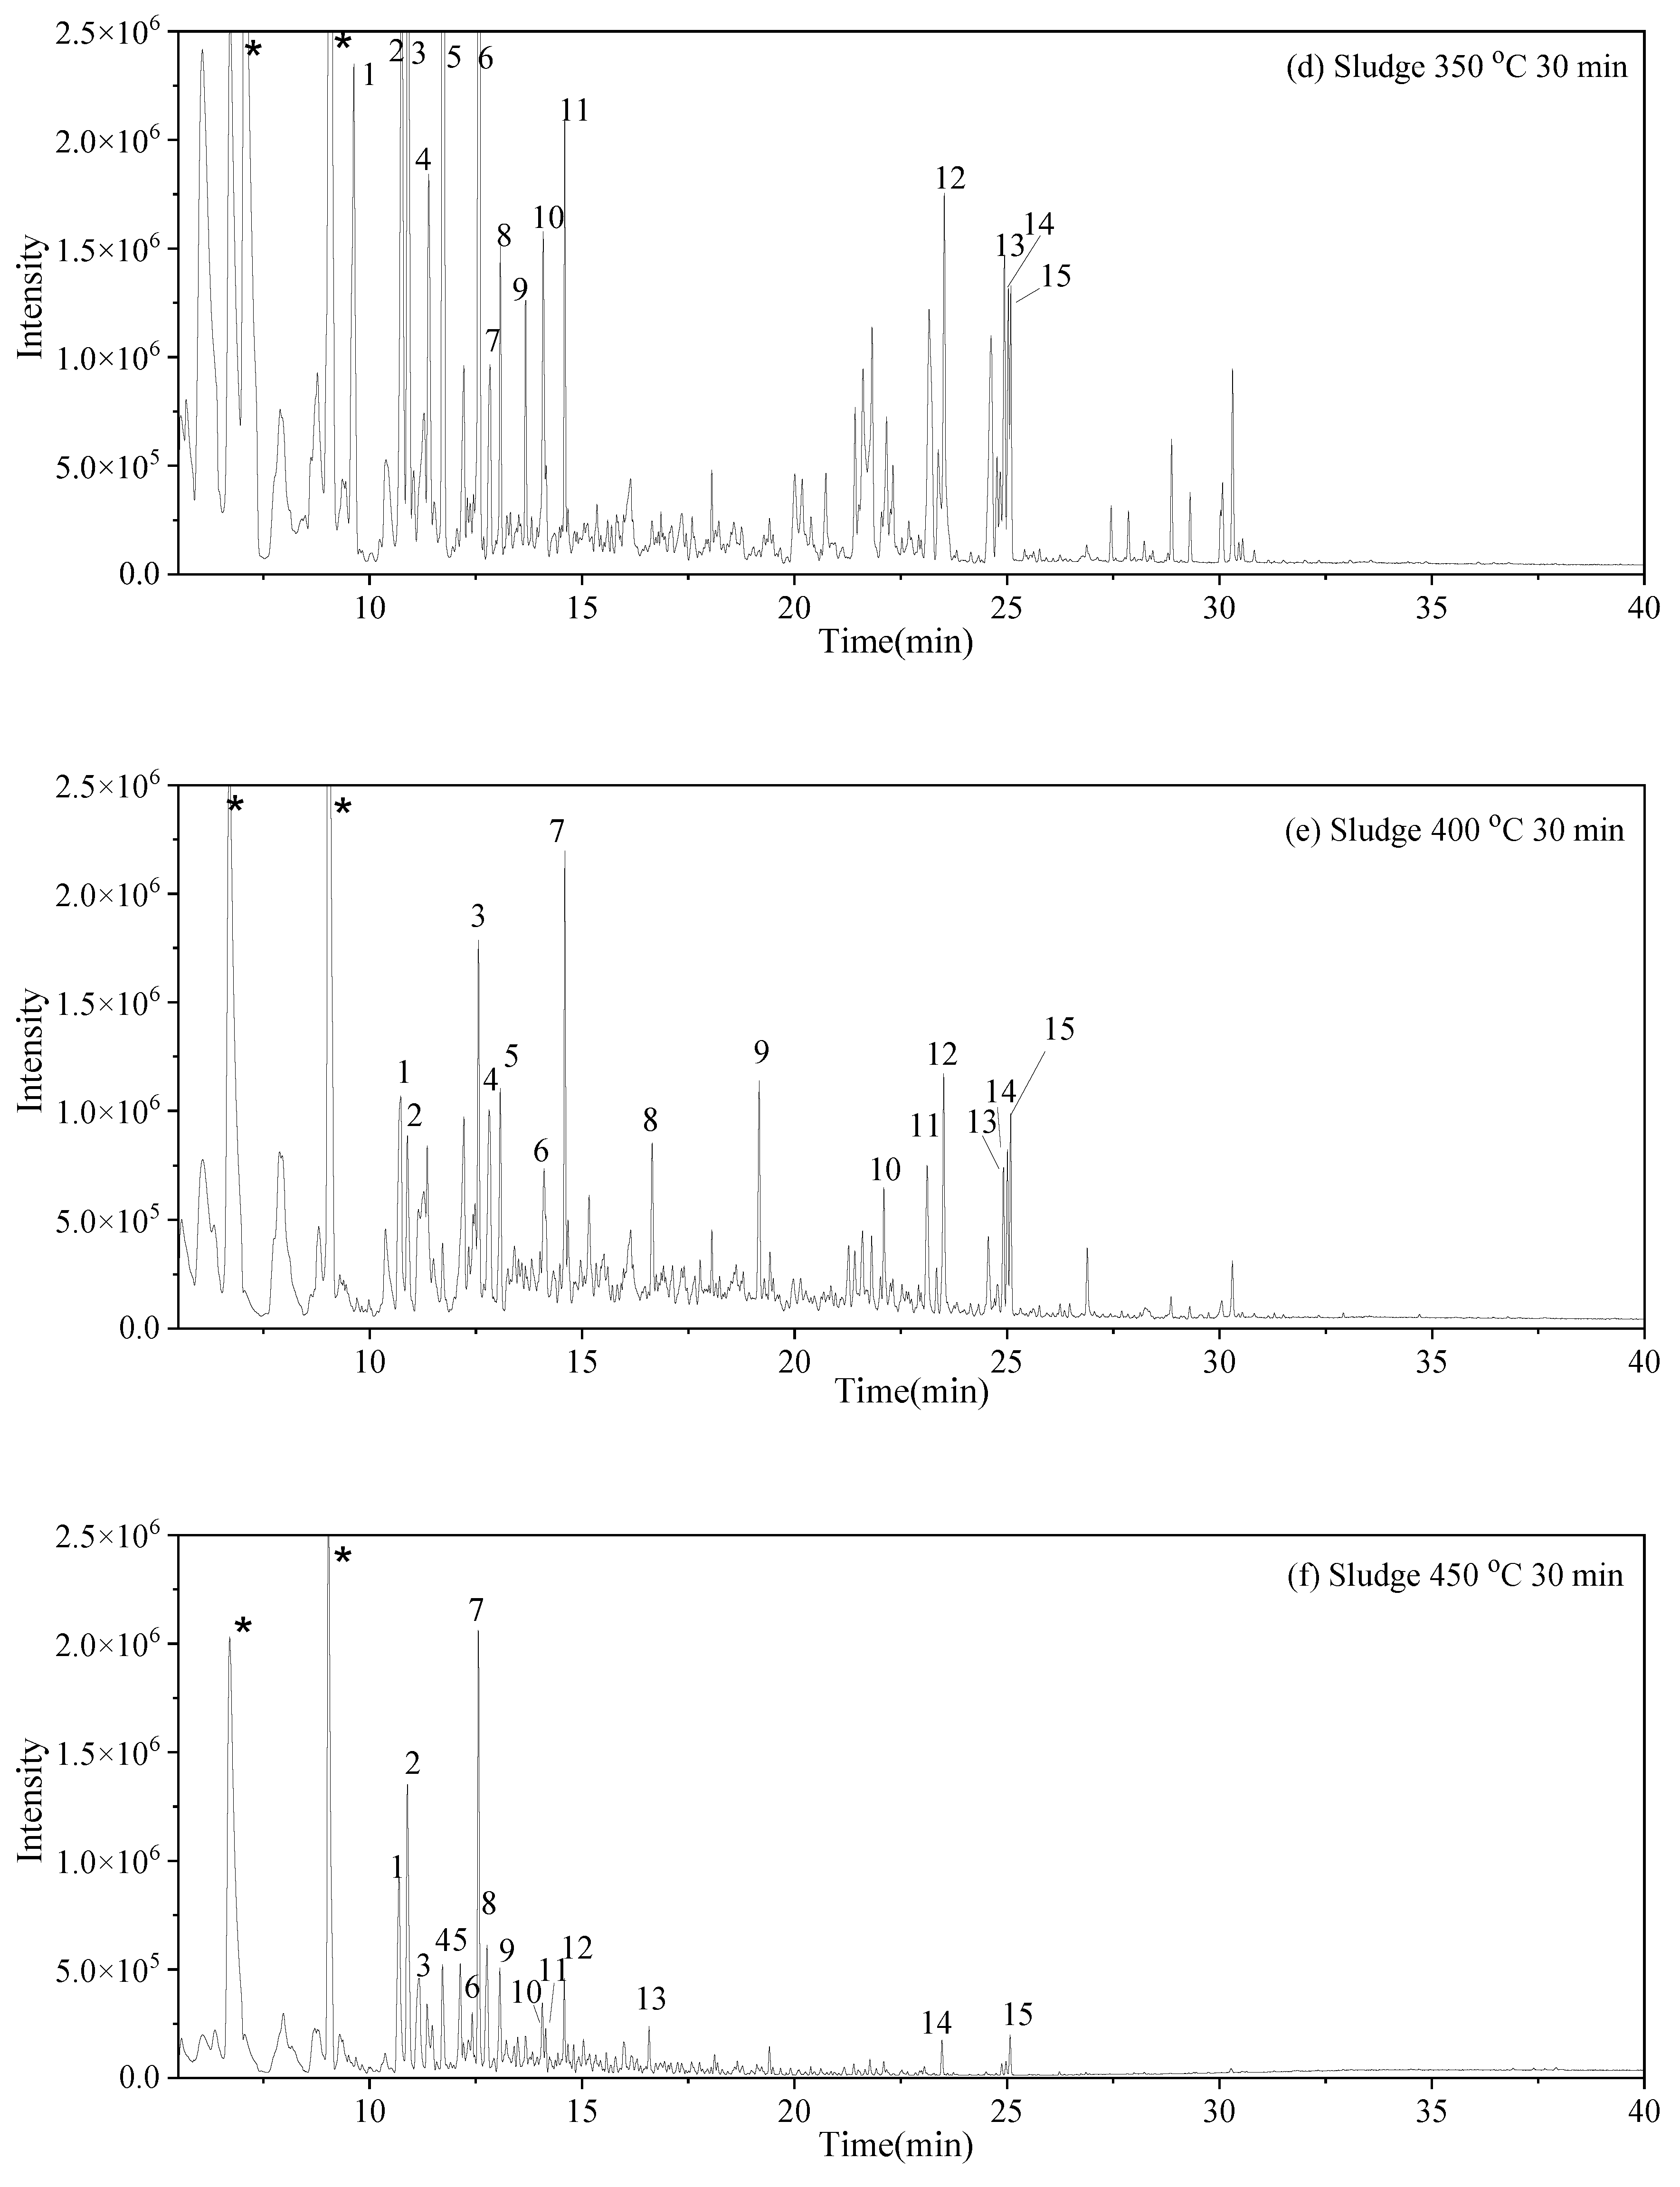
3.3. Water-Soluble Products
 and S-W-300(10)
  may result from the intermolecular dehydration of amino acids [22].
 may have been produced through intramolecular dehydration of amino acids [24]. Additionally, an unsaturated nitrogen-aromatic heterocyclic compound, S-W-350(8), appeared; however, its content was relatively low, with a peak area ratio of 2.58%.
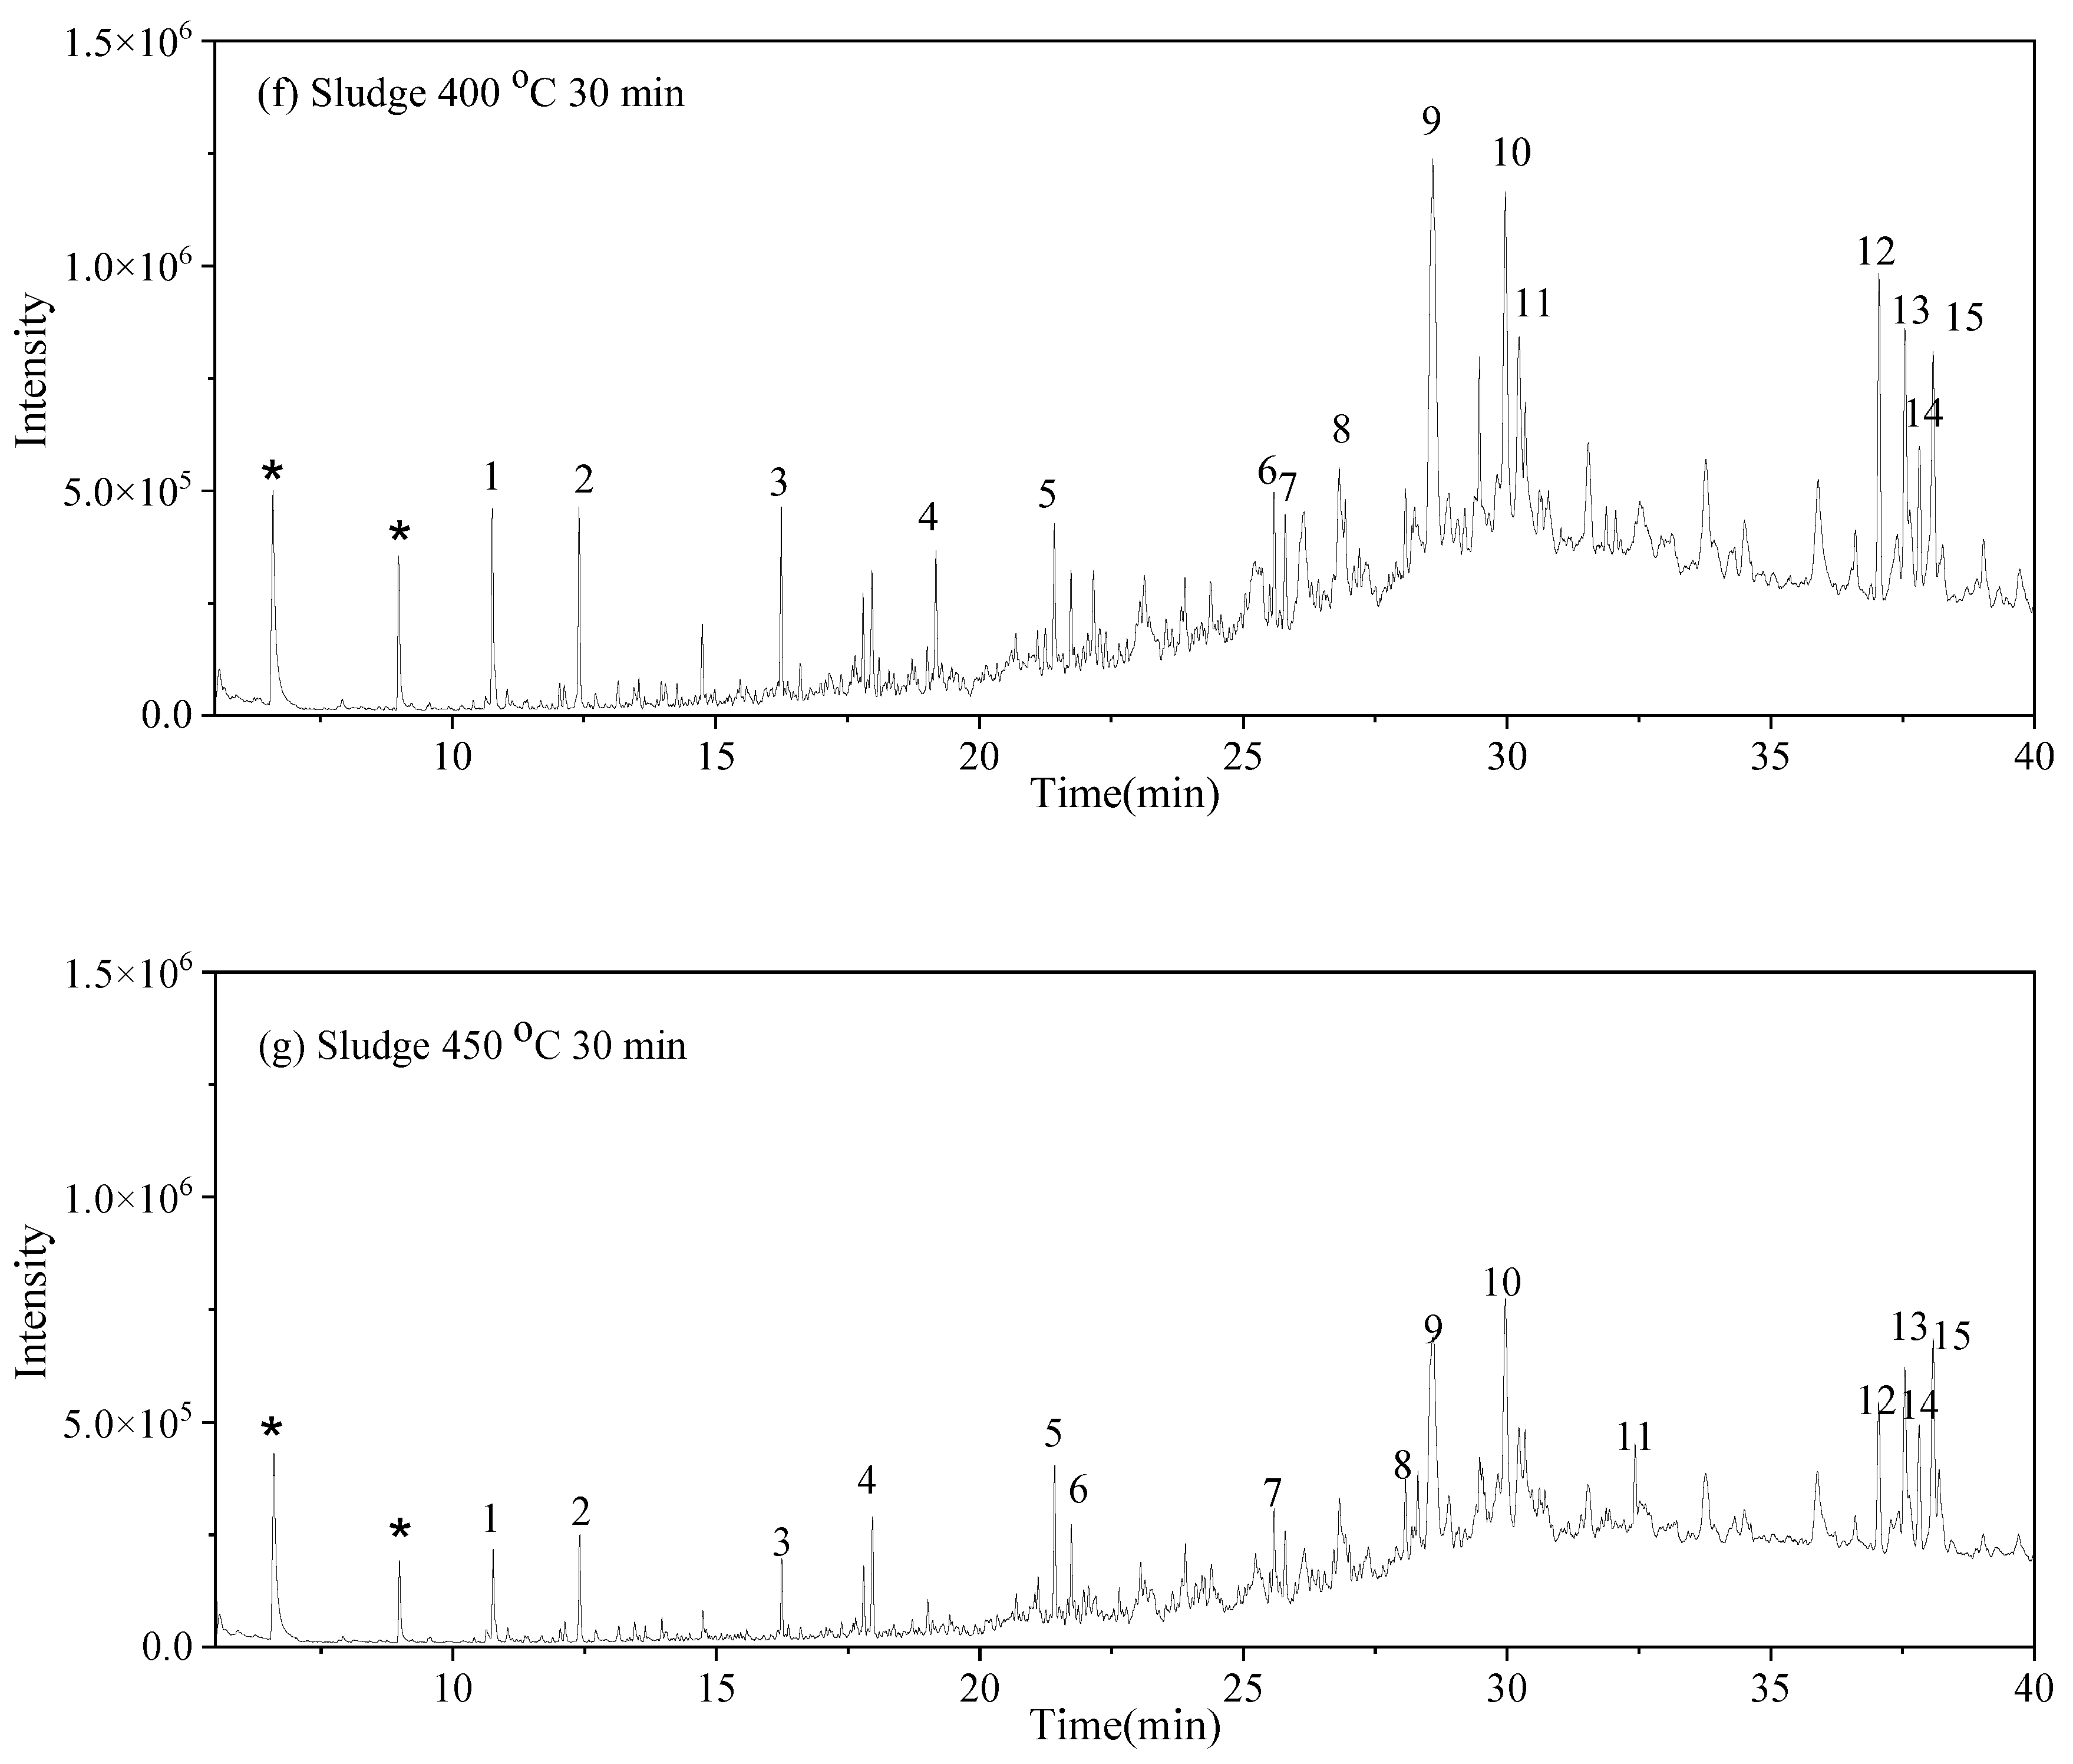
3.4. Oil-Phase Products
3.5. Solid-Phase Products
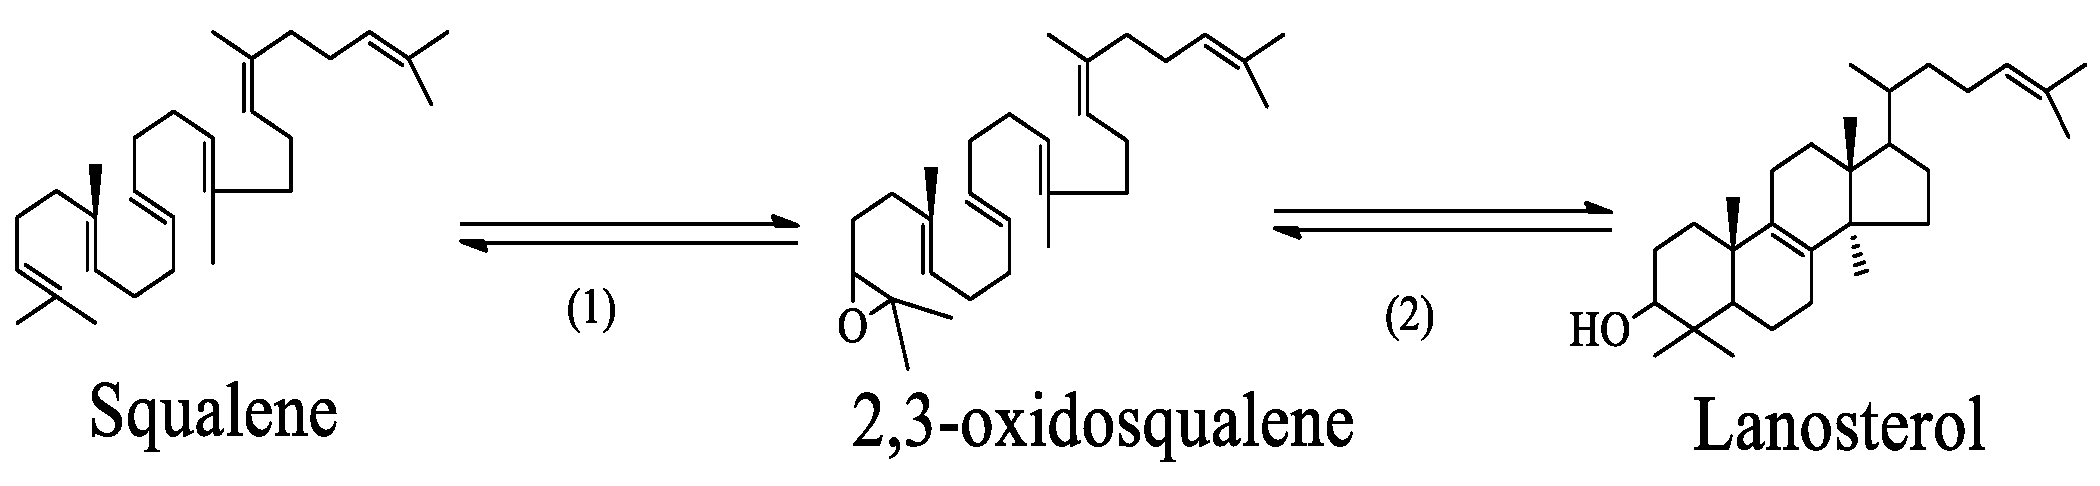
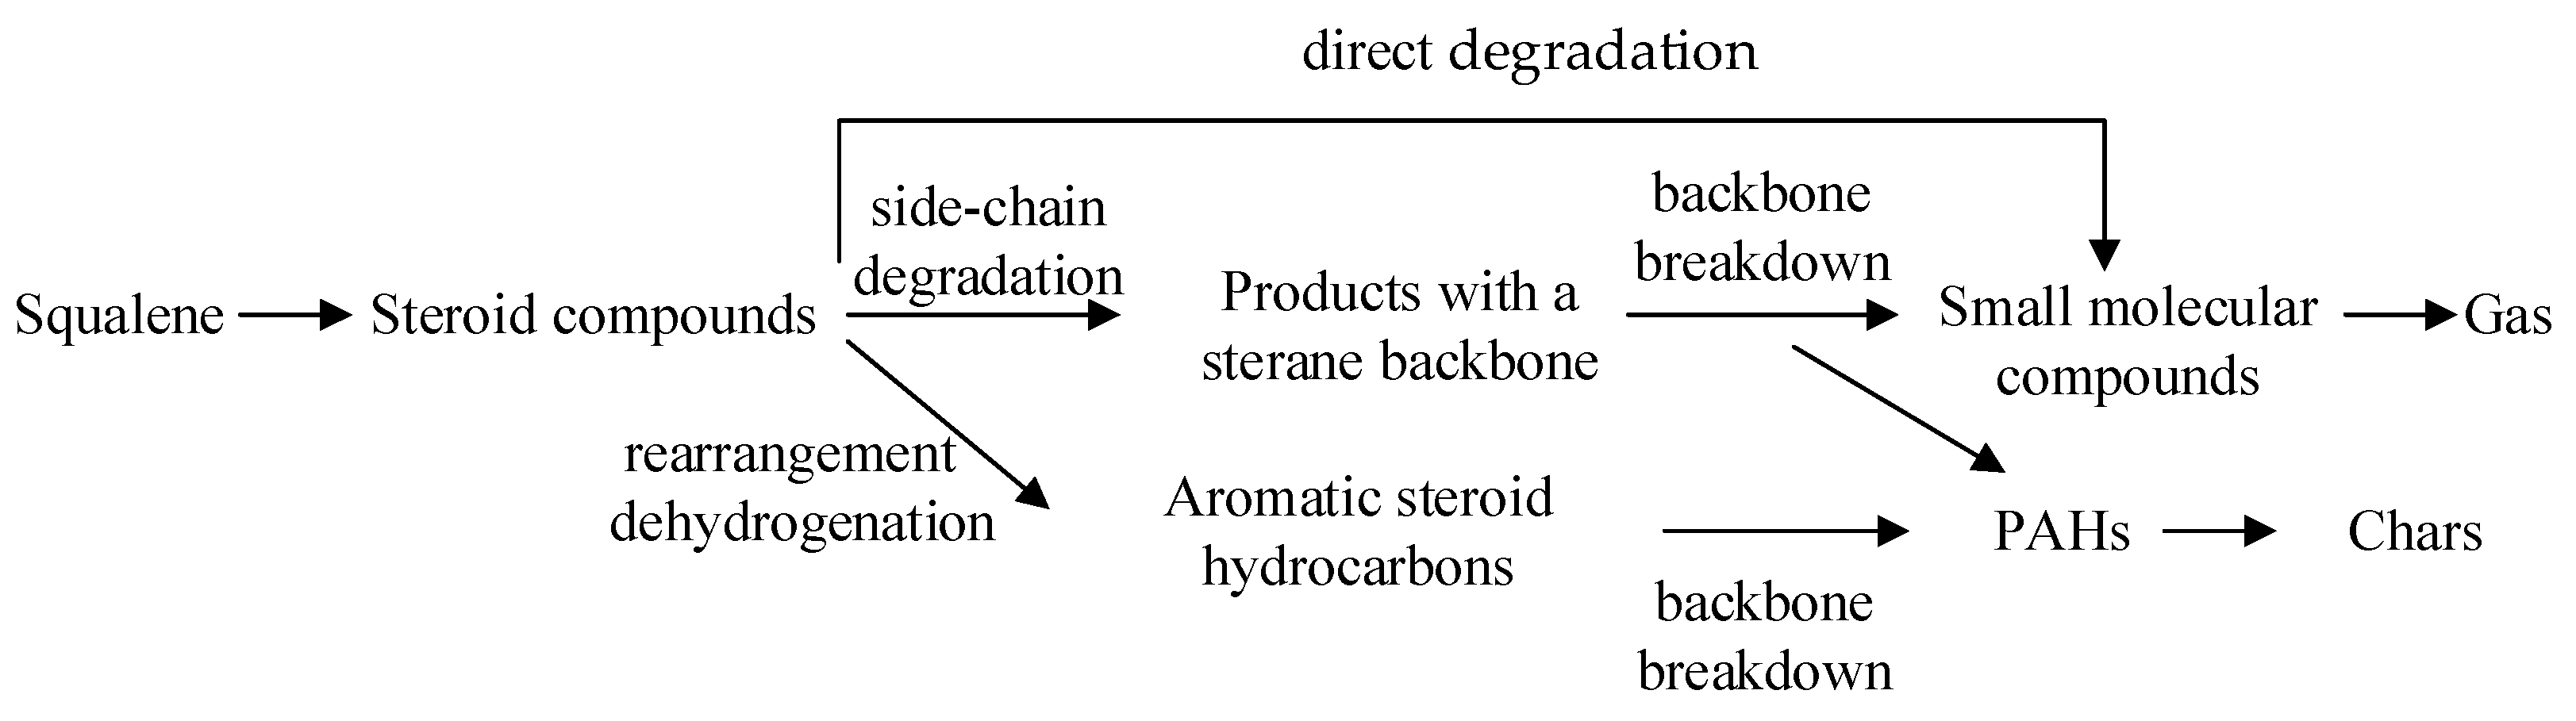
3.6. Formation and Conversion of Steroids
4. Conclusions and Prospects
Supplementary Materials
Author Contributions
Funding
Data Availability Statement
Acknowledgments
Conflicts of Interest
References
- Wei, Y.; Xu, D.; Xu, M.; Zheng, P.; Fan, L.; Leng, L.; Kapusta, K. Hydrothermal liquefaction of municipal sludge and its products applications. Sci. Total Environ. 2024, 908, 168177. [Google Scholar] [CrossRef] [PubMed]
- Yang, C.; Wang, S.Z.; Yang, J.Q.; Xu, D.H.; Li, Y.H.; Li, J.N.; Zhang, Y.S. Hydrothermal liquefaction and gasification of biomass and model compounds: A review. Green. Chem. 2020, 22, 8210–8232. [Google Scholar] [CrossRef]
- Zhang, W.J.; Chen, Q.Y.; Chen, J.F.; Xu, D.H.; Zhan, H.; Peng, H.Y.; Pan, J.; Vlaskin, M.; Leng, L.J.; Li, H.L. Machine learning for hydrothermal treatment of biomass: A review. Bioresour. Technol. 2023, 370, 128547. [Google Scholar] [CrossRef]
- Fan, Y.J.; Hornung, U.; Dahmen, N. Hydrothermal liquefaction of sewage sludge for biofuel application: A review on fundamentals, current challenges and strategies. Biomass Bioenergy 2022, 165, 106570. [Google Scholar] [CrossRef]
- Venkatachalam, C.D.; Ravichandran, S.R.; Sengottian, M. Lignocellulosic and algal biomass for bio-crude production using hydrothermal liquefaction: Conversion techniques, mechanism and process conditions: A review. Environ. Eng. Res. 2022, 27, 200555. [Google Scholar] [CrossRef]
- Xu, Z.X.; Ma, X.Q.; Zhou, J.; Duan, P.G.; Zhou, W.Y.; Ahmad, A.; Luque, R. The influence of key reactions during hydrothermal carbonization of sewage sludge on aqueous phase properties: A review. J. Anal. Appl. Pyrolysis 2022, 167, 105678. [Google Scholar] [CrossRef]
- Qiu, Y.; Aierzhati, A.; Cheng, J.; Guo, H.; Yang, W.J.; Zhang, Y.H. Biocrude Oil Production through the Maillard Reaction between Leucine and Glucose during Hydrothermal Liquefaction. Energy. Fuels. 2019, 33, 8758–8765. [Google Scholar] [CrossRef]
- Lee, S.; Kim, Y.M.; Siddiqui, M.Z.; Park, Y.K. Different pyrolysis kinetics and product distribution of municipal and livestock manure sewage sludge. Environ. Pollut. 2021, 285, 117197. [Google Scholar] [CrossRef]
- Atienza-Martínez, M.; Mastral, J.F.; Ábrego, J.; Ceamanos, J.; Gea, G. Sewage Sludge Torrefaction in an Auger Reactor. Energy Fuels 2015, 29, 160–170. [Google Scholar] [CrossRef]
- Feng, C.; Xie, W.R.; Zhang, D.Y.; Gao, X.P.; Qiao, Y.; Xu, M.H. Pyrolysis of sewage sludge under conditions relevant to applied smouldering combustion. Proc. Combust. Inst. 2023, 39, 3447–3456. [Google Scholar] [CrossRef]
- Demirbas, A. Relationships derived from physical properties of vegetable oil and biodiesel fuels. Fuel 2008, 87, 1743–1748. [Google Scholar] [CrossRef]
- Hietala, D.C.; Savage, P.E. Reaction pathways and kinetics of cholesterol in high-temperature water. Chem. Eng. J. 2015, 265, 129–137. [Google Scholar] [CrossRef]
- Rushdi, A.I.; Ritter, G.; Grimalt, J.O.; Simoneit, B.R.T. Hydrous pyrolysis of cholesterol under various conditions. Organic Geochem. 2003, 34, 799–812. [Google Scholar] [CrossRef]
- Jocz, J.N.; Savage, P.E. Behavior of Cholesterol and Catalysts in Supercritical Water. Energy Fuels. 2016, 30, 7937–7946. [Google Scholar] [CrossRef]
- Gong, M.; Zhu, W.; Xu, Z.R.; Zhang, H.W.; Yang, H.P. Influence of sludge properties on the direct gasification of dewatered sewage sludge in supercritical water. Renew. Energy 2014, 66, 605–611. [Google Scholar] [CrossRef]
- Su, Y.; Liu, D.B.; Gong, M.; Zhu, W.; Yu, Y.Q.; Gu, H.Y. Investigation on the decomposition of chemical compositions during hydrothermal conversion of dewatered sewage sludge. Int. J. Hydrog. Energy 2019, 44, 26933–26942. [Google Scholar] [CrossRef]
- CJ/T 221-2023; Standard Examination Methods for Municipal Sludge. Beijing China Planning Publishing House: Beijing, China, 2023.
- GB/T 212-2008; Proximate Analysis of Coal. Standards Press of China: Beijing, China, 2008.
- Su, Y.; Zhu, W.; Gong, M.; Zhou, H.; Fan, Y.; Amuzu-Sefordzi, B. Interaction between sewage sludge components lignin (phenol) and proteins (alanine) in supercritical water gasification. Int. J. Hydrogen Energy 2015, 40, 9125–9136. [Google Scholar] [CrossRef]
- Kruse, A.; Krupka, A.; Schwarzkopf, V.; Gamard, C.; Henningsen, T. Influence of Proteins on the Hydrothermal Gasification and Liquefaction of Biomass. 1. Comparison of Different Feedstocks. Ind. Eng. Chem. Res. 2005, 44, 3013–3020. [Google Scholar] [CrossRef]
- Fan, Y.W.; Qin, X.L.; Zhai, Y.B.; Huang, Z.L.; Wu, Z.J.; Tan, M.J.; Deng, J.Q.; Zhu, Y.; Li, H. Decarboxylation of lauric acids to long-chain alkenes via novel biochar-based photocatalysis under ambient conditions. Biomass Bioenergy 2022, 167, 106649. [Google Scholar] [CrossRef]
- Chiavari, G.; Galletti, G.C. Pyrolysis-gas chromatography/mass spectrometry of amino acids. J. Anal. Appl. Pyrolysis 1992, 24, 123–137. [Google Scholar] [CrossRef]
- Cao, J.P.; Zhao, X.Y.; Morishita, K.; Li, L.Y.; Xiao, X.B.; Obara, R.; Wei, X.Y.; Takarada, T. Triacetonamine formation in a bio-oil from fast pyrolysis of sewage sludge using acetone as the absorption solvent. Bioresour. Technol. 2010, 101, 4242–4245. [Google Scholar] [CrossRef] [PubMed]
- Fan, Y.J.; Hornung, U.; Dahmen, N.; Kruse, A. Hydrothermal liquefaction of protein-containing biomass: Study of model compounds for Maillard reactions. Biomass Convers. Biorefin. 2018, 8, 909–923. [Google Scholar] [CrossRef]
- Wang, C.; Zhu, W.; Zhang, H.; Chen, C.; Fan, X.; Su, Y. Char and tar formation during hydrothermal gasification of dewatered sewage sludge in subcritical and supercritical water: Influence of reaction parameters and lumped reaction kinetics. Waste Manag. 2019, 100, 57–65. [Google Scholar] [CrossRef] [PubMed]
- Xu, Z.X.; Song, H.; Li, P.J.; He, Z.X.; Wang, Q.; Wang, K.; Duan, P.G. Hydrothermal carbonization of sewage sludge: Effect of aqueous phase recycling. Chem. Eng. J. 2020, 387, 123410. [Google Scholar] [CrossRef]
- Wang, W.J.; Yu, Q.; Meng, H.; Han, W.; Li, J.; Zhang, J.L. Catalytic liquefaction of municipal sewage sludge over transition metal catalysts in ethanol-water co-solvent. Bioresour. Technol. 2018, 249, 361–367. [Google Scholar] [CrossRef]
- Chen, Y.; Zhou, Y.; Zhang, R.; Hu, C. Conversion of saccharides in Enteromorpha prolifera to furfurals in the presence of FeCl3. Mol. Catal. 2020, 484, 110729. [Google Scholar] [CrossRef]
- Su, Y.; Guo, B.; Hornung, U.; Dahmen, N. FeCl3-supported solvothermal liquefaction of Miscanthus in methanol. Energy 2022, 258, 124971. [Google Scholar] [CrossRef]
- Fu, J.; Lu, X.; Savage, P.E. Hydrothermal Decarboxylation and Hydrogenation of Fatty Acids over Pt/C. Chemsuschem 2011, 4, 481–486. [Google Scholar] [CrossRef]
- Chua, N.K.; Coates, H.W.; Brown, A.J. Squalene monooxygenase: A journey to the heart of cholesterol synthesis. Prog. Lipid Res. 2020, 79, 101033. [Google Scholar] [CrossRef]
- Lodeiro, S.; Wilson, W.K.; Shan, H.; Matsuda, S.P.T. A putative precursor of isomalabaricane triterpenoids from lanosterol synthase mutants. Org. Lett. 2006, 8, 439–442. [Google Scholar] [CrossRef]
- Chen, C.; Pang, Y.; Chen, Q.; Li, C.; Lu, B. Oxidosqualene cyclases in triterpenoids biosynthesis: A review. Shengwu Gongcheng Xuebao (Chin. J. Biotechnol.) 2022, 38, 443–459. [Google Scholar] [CrossRef]
- Lin, Y.L.; Song, X.; Fu, J.; Lin, J.Q.; Qu, Y.B. Microbial transformation of androst-4-ene-3,17-dione by Bordetella sp B4 CGMCC 2229. J. Chem. Technol. Biotechnol. 2009, 84, 789–793. [Google Scholar] [CrossRef]
- Yang, F.; Min, Y.; Liu, X.Y.; Rao, B.; Wang, K.M.; Yang, Z.W. Advances in microbial transformation and catabolic mechanism of steroid compounds. Weishengwuxue Tongbao (Microbiol. China) 2019, 46, 2743–2762. [Google Scholar]
- Derewiaka, D.; Zareba, D.; Obiedzinski, M.; Matuszewska-Janica, A. Volatile markers of cholesterol thermal changes. Eur. J. Lipid Sci. Technol. 2017, 119, 1600486. [Google Scholar] [CrossRef]
- Basar, I.A.; Liu, H.; Carrere, H.; Trably, E.; Eskicioglu, C. A review on key design and operational parameters to optimize and develop hydrothermal liquefaction of biomass for biorefinery applications. Green Chem. 2021, 23, 1404–1446. [Google Scholar] [CrossRef]
- Christy, A.A.; Lian, M.I.; Francis, G.W. Pyrolytic formation of polyaromatic hydrocarbons from steroid hormones. Food Chem. 2011, 124, 1466–1472. [Google Scholar] [CrossRef]
- Chen, Z.; Zheng, Z.J.; He, C.L.; Liu, J.M.; Zhang, R.; Chen, Q. Oily sludge treatment in subcritical and supercritical water: A review. J. Hazard. Mater. 2022, 433, 128761. [Google Scholar] [CrossRef]

| Moisture Content (wt%) | pH | Proximate Analysis (wt%) a | Ultimate Analysis (wt%) a | HHV (MJ/kg) c | ||||||
|---|---|---|---|---|---|---|---|---|---|---|
| VM d | FC d | Ash | C | N | S | H | O b | |||
| 89.2 | 7.8 | 56.91 | 1.34 | 41.75 | 25.56 | 4.57 | 0.15 | 4.42 | 22.10 | 11.06 |
| Biochemical (wt %) a | Crude protein | Lignin | Lipids | Hemicellulose | Cellulose | |||||
| 22.27 | 18.03 | 12.22 | 4.07 | 0.32 | ||||||
| Temperature | Molecular Structures of the Main WSPs | |||||
|---|---|---|---|---|---|---|
| Molecular Structures of the Top Five Peaks | Molecular Structures of Other Main WSPs | |||||
| 1 | 2 | 3 | 4 | 5 | ||
| 200 °C |  S-W-200(11) Peak area:19.74 |  S-W-200(7) 18.70 |  S-W-200(9) 11.99 |  S-W-200(6) 11.74 |  S-W-200(3) 11.35 | 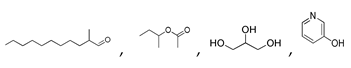 S-W-200(4), S-W-200(1), S-W-200(2), S-W-200(8) |
| 250 °C |  S-W-250(7) 28.57 |  S-W-250(3) 20.76 |  S-W-250(5) 9.68 |  S-W-250(11) 6.55 |  S-W-250(9) 4.76 | 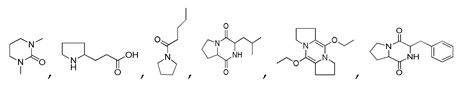 S-W-250(8), S-W-250(9), S-W-250(12), S-W-250(13), S-W-250(14), S-W-250(15) |
| 300 °C |  S-W-300(4) 26.94 |  S-W-300(2) 13.49 |  S-W-300(3) 12.33 |  S-W-300(6) 6.73 |  S-W-300(11) 5.53 | 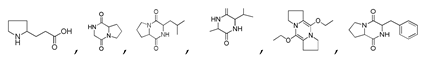 S-W-300(7), S-W-300(8), S-W-300(10)(12)(13), S-W-300(9), S-W-300(14), S-W-300(15) |
| 350 °C |  S-W-350(5) 22.44 |  S-W-350(6) 22.30 |  S-W-350(3) 10.45 |  S-W-350(2) 9.35 |  S-W-350(1) 8.52 | 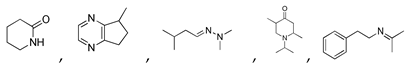 S-W-350(7), S-W-350(8), S-W-350(9), S-W-350(10), S-W-350(11) |
| 400 °C |  S-W-400(12)(13)(14) 6.20 + 3.80 + 4.39 |  S-W-400(1) 13.55 |  S-W-400(7) 10.83 |  S-W-400(3) 9.14 |  S-W-400(4) 8.74 | 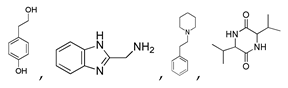 S-W-400(8), S-W-400(9), S-W-400(10), S-W-400(11) |
| 450 °C |  S-W-450(7) 19.71 |  S-W-450(2) 19.19 |  S-W-450(1) 16.72 |  S-W-450(3) 9.35 |  S-W-450(8) 7.69 | 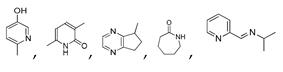 S-W-450(5), S-W-450(6), S-W-450(9), S-W-450(10), S-W-450(11) |
| Temperature | Molecular Structures of the Main OPs | |||||
|---|---|---|---|---|---|---|
| Molecular Structures of the Top Five Peaks | Molecular Structures of Other Main OPs | |||||
| 1 | 2 | 3 | 4 | 5 | ||
| Raw sludge |  S-O-(2) Peak area:42.46 |  S-O-(10) 12.55 |  S-O-(13) 7.98 |  S-O-(14) 5.92 |  S-O-(6) 4.64 | 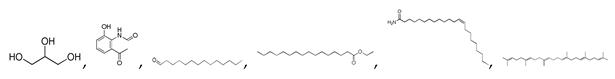 S-O-(1), S-O-(3), S-O-(4), S-O-(7), S-O-(11), S-O-(14) |
| 200 °C |  S-O-200(13) 34.12 |  S-O-200(14) 9.50 |  S-O-200(7) 8.77 |  S-O-200(8) 6.14 |  S-O-200(10) 5.97 |  S-O-200(2), S-O-200(3), S-O-200(11), S-O-200(12) |
| 250 °C |  S-O-250(4) 37.20 |  S-O-250(6) 12.74 | 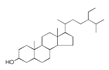 S-O-250(12) 12.24 |  S-O-250(7) 8.80 |  S-O-250(5) 6.34 | 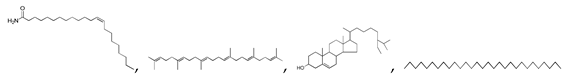 S-O-250(8), S-O-250(13), S-O-250(14), S-O-250(15) |
| 300 °C |  S-O-300(6) 34.93 |  S-O-300(13) 10.90 |  S-O-300(9) 9.99 |  S-O-300(10) 9.53 |  S-O-300(8) 6.47 | 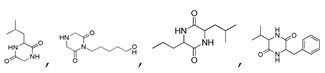 S-O-300(3), S-O-300(4), S-O-300(5), S-O-300(7) |
| 350 °C |  S-O-350(5) 32.92 |  S-O-350(12) (13) (14) 8.34 + 6.17 + 6.13 |  S-O-350(11) 9.05 |  S-O-350(15) 6.97 |  S-O-350(10) 6.60 | 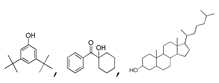 S-O-350(1), S-O-350(2), S-O-400(9) |
| 400 °C |  S-O-400(9) 27.78 |  S-O-400(12)(13)(14) 9.97 + 6.88 + 4.33 |  S-O-400(10) 12.23 |  S-O-400(15) 6.56 |  S-O-400(11) 6.46 | 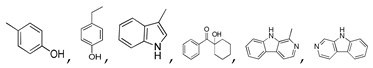 S-O-400(1), S-O-400(2), S-O-400(3), S-O-400(5), S-O-400(6), S-O-400(7) |
| 450 °C |  S-O-450(9) 26.25 |  S-O-450(12)(13)(14) 6.56 + 7.41 + 5.99 |  S-O-450(10) 14.12 |  S-O-450(15) 10.19 |  S-O-450(5) 5.50 | 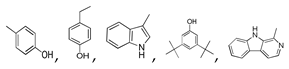 S-O-450(1), S-O-450(2), S-O-450(3), S-O-450(4), S-O-450(7) |
Disclaimer/Publisher’s Note: The statements, opinions and data contained in all publications are solely those of the individual author(s) and contributor(s) and not of MDPI and/or the editor(s). MDPI and/or the editor(s) disclaim responsibility for any injury to people or property resulting from any ideas, methods, instructions or products referred to in the content. |
© 2025 by the authors. Licensee MDPI, Basel, Switzerland. This article is an open access article distributed under the terms and conditions of the Creative Commons Attribution (CC BY) license (https://creativecommons.org/licenses/by/4.0/).
Share and Cite
Su, Y.; Liao, Q.; Xia, S.; Shen, X.; Zhu, J.; Liao, Y.; Wang, W.; Fang, Z.; Liu, D. Sustainable Utilization of Dewatered Sewage Sludge via Hydrothermal Conversion: Focus on Steroid Transformation. Sustainability 2025, 17, 2815. https://doi.org/10.3390/su17072815
Su Y, Liao Q, Xia S, Shen X, Zhu J, Liao Y, Wang W, Fang Z, Liu D. Sustainable Utilization of Dewatered Sewage Sludge via Hydrothermal Conversion: Focus on Steroid Transformation. Sustainability. 2025; 17(7):2815. https://doi.org/10.3390/su17072815
Chicago/Turabian StyleSu, Ying, Qianyi Liao, Shuhan Xia, Xu Shen, Jiang Zhu, Yubing Liao, Wenhao Wang, Zhou Fang, and Debin Liu. 2025. "Sustainable Utilization of Dewatered Sewage Sludge via Hydrothermal Conversion: Focus on Steroid Transformation" Sustainability 17, no. 7: 2815. https://doi.org/10.3390/su17072815
APA StyleSu, Y., Liao, Q., Xia, S., Shen, X., Zhu, J., Liao, Y., Wang, W., Fang, Z., & Liu, D. (2025). Sustainable Utilization of Dewatered Sewage Sludge via Hydrothermal Conversion: Focus on Steroid Transformation. Sustainability, 17(7), 2815. https://doi.org/10.3390/su17072815