Abstract
This study establishes a comprehensive framework for evaluating sustainability by integrating radar chart analysis with fuzzy linguistic methods, helping enterprises select suppliers that align with sustainable development principles. Testing within the textile industry confirmed the framework’s reliability, effectively identifying strengths and areas for improvement across key sustainability dimensions: environmental, social, economic, and governance. The analysis highlighted strong supplier performance in governance and social responsibility, particularly in human rights protection, while emphasizing the need for improvements in environmental aspects such as water resource management and product recycling. Economic factors, including product quality and delivery capability, demonstrated significant potential, though cost efficiency remained a challenge. Recommendations focus on enhancing board diversity, employee satisfaction, and circular economy initiatives. The framework demonstrates strong applicability within the textile industry and has the potential for adaptation in other sectors. Future research should conduct industry-specific validations to refine weight allocation for dynamic markets.
1. Introduction
With the rapid advancement of global science and technology, Industry 4.0 has emerged as a key driver for enterprises transitioning toward modernized operations. This era is characterized by the deep integration of digitalization, intelligence, automation, and networking, which has fundamentally transformed business and manufacturing models. Technologies such as the Internet of Things (IoT), artificial intelligence (AI), big data analytics, and cloud computing are reshaping industrial ecosystems by enhancing efficiency, reducing operational costs, and fostering data-driven decision-making [1].
Amidst these technological transformations, the concept of sustainable management has gained increasing importance. Modern enterprises must not only pursue economic benefits but also actively address environmental sustainability and social responsibility [2,3]. Sustainability, in this context, refers to the responsible utilization of resources and long-term business resilience, ensuring that present needs are met without compromising the well-being of future generations. This study adopts the widely recognized triple bottom line (TBL) framework, which considers sustainability as the balanced integration of economic viability, environmental stewardship, and social equity. By adopting this approach, we emphasize the importance of integrating supply chain sustainability as a strategic initiative, enabling enterprises to achieve long-term competitive advantages while fulfilling their environmental and social obligations [4]. However, selecting suppliers that align with sustainability objectives presents significant challenges.
One major challenge is the trade-off between cost and sustainability. While sustainable suppliers often adopt eco-friendly practices and ethical labor policies, their products and services may come at a higher cost, posing financial pressures, especially for small- and medium-sized enterprises (SMEs). Additionally, evaluating suppliers based on sustainability criteria requires substantial time and resources, as companies must screen, monitor, and audit suppliers to ensure compliance with international sustainability standards, such as ISO 14001 for environmental management and SA 8000 for social responsibility [5]. The complexity of global supply chains further complicates this process, as variations in regulatory frameworks and operational practices make standardized evaluation difficult.
From a methodological perspective, supplier evaluation involves both quantitative and qualitative factors, making it a multi-criteria decision-making (MCDM) problem. While quantitative criteria such as carbon footprint and production costs can be objectively measured, qualitative aspects like corporate social responsibility (CSR) initiatives, labor practices, and risk management strategies often rely on subjective assessments and linguistic evaluations [6,7]. Traditional numerical-based evaluation methods struggle to capture the inherent vagueness and uncertainty associated with these qualitative criteria.
To ensure alignment with current sustainability frameworks, this study integrates the traditional triple bottom line (TBL) dimensions—environment, society, and economy—while incorporating governance to reflect the growing relevance of ESG (environmental, social, and governance) practices in modern sustainable supply chain management [8]. The addition of the governance dimension addresses critical aspects such as supplier compliance, ethical management, and risk control, which have become increasingly important in ensuring long-term sustainability and accountability within global supply chains. By integrating these four dimensions, the proposed evaluation framework captures both the classical sustainability principles and the evolving needs of contemporary corporate sustainability practices.
To address these challenges, this study aims to develop an objective, systematic, and practical sustainable supplier evaluation framework that combines linguistic fuzzy logic with radar chart visualization [7,9]. By adopting fuzzy linguistic variables, the proposed model effectively manages the uncertainty and subjectivity inherent in supplier evaluation, reduces information loss, and improves decision-making consistency. Simultaneously, radar chart visualization is employed to present the weights of evaluation indicators and the final assessment results in an intuitive graphical format. This allows decision-makers to easily compare supplier performance across the four key sustainability dimensions of environmental, social, economic, and governance factors.
Based on the TBL framework while extending it with governance considerations, this comprehensive evaluation approach not only strengthens the transparency and interpretability of the decision-making process but also supports enterprises in balancing sustainability priorities. Ultimately, it assists organizations in making strategic and informed supplier selections that align with sustainable development goals and enhance long-term competitive advantage.
The structure of this paper is as follows. Section 2 describes the measurement dimensions of sustainability supplier evaluation and the effectiveness of radar charts. In Section 3, we introduce the two-tuple fuzzy language expression and operation method and the application steps of the radar chart, respectively. Section 4 applies the proposed sustainable supplier performance evaluation method to a textile manufacturer in central Taiwan as a case study to verify the applicability of the model. Section 5 discusses the results of practical applications. Finally, a conclusion is drawn for this study.
2. Literature Review
Sustainability and sustainable development are closely related but distinct concepts. Sustainability refers to the long-term maintenance of environmental, social, and economic systems in a balanced and resilient state, ensuring that these systems do not become depleted or collapse. It focuses on preserving resources, ecological integrity, and social well-being indefinitely. In contrast, sustainable development is the dynamic process of implementing strategic actions, policies, and innovations to achieve sustainability, integrating economic growth, social equity, and environmental protection to meet present needs without compromising the ability of future generations to meet theirs [1]. The widely cited Brundtland Report (1987) defines sustainable development as development that “meets the needs of the present without compromising the ability of future generations to meet their own needs.” Thus, sustainable development is the pathway, while sustainability is the goal.
In recent years, sustainability has been explored through various frameworks, including environmental, social, and governance (ESG), the triple bottom line (TBL), and corporate social responsibility (CSR). These frameworks emphasize multidimensional sustainability assessment and have become essential tools in both academia and industry. ESG focuses on environmental stewardship, social responsibility, and governance practices; TBL measures performance in terms of people, planet, and profit; CSR addresses ethical responsibilities toward society and the environment.
In this study, sustainability is evaluated across four dimensions: environmental, social, economic, and governance. The inclusion of the innovation dimension responds to the increasing recognition that technological advancement and continuous improvement are vital to long-term sustainability, particularly in competitive supply chain contexts. These four dimensions comprehensively reflect the criteria required to assess suppliers’ sustainable performance and align with global trends in sustainability evaluation [8,10,11].
The supplier selection problem dates back to the 1960s, and its complexity has grown with the evolution of sustainability concepts. Modern supplier selection demands that companies partner with suppliers aligned with sustainable principles. Suppliers must implement clear environmental policies, such as reducing carbon emissions, improving energy efficiency, and minimizing pollutant discharges, to meet environmental goals. Additionally, suppliers are expected to uphold social responsibilities, including fair trade, employee rights, appropriate wages, safe labor conditions, and production safety [11,12]. Economic responsibilities involve maintaining financial stability and innovation capacity to ensure consistent delivery of high-quality products and services.
Moreover, supply chain transparency has become critical. Companies are leveraging technologies like blockchain and the Internet of Things to trace products, material sources, and environmental indicators (e.g., carbon footprints) in real time, ensuring compliance with sustainability standards [11]. Certifications such as ISO 14001 (environmental management) and SA8000 (social responsibility) are increasingly required to bolster supply chain credibility and traceability.
Collaborative partnerships between enterprises and suppliers foster mutual growth, including joint development of green products and production processes that reduce resource consumption and environmental impact [12,13]. Strengthening suppliers’ sustainable capabilities through education and training further enhances the overall supply chain’s sustainability performance.
To monitor and improve supplier sustainability, companies establish key performance indicators (KPIs) across the environmental, social, economic, and innovation dimensions. This approach aligns with global frameworks like ESG and TBL, ensuring continuous improvement through regular evaluations and feedback mechanisms [13,14].
Sustainable supplier evaluation has become a critical topic in both academic research and industrial practice due to growing environmental regulations and societal expectations. Many studies have applied multi-criteria decision-making (MCDM) methods to address the complexity of sustainability evaluation, incorporating both qualitative and quantitative indicators to capture the multidimensional nature of sustainability. Common approaches include the Analytic Hierarchy Process (AHP), Technique for Order Preference by Similarity to Ideal Solution (TOPSIS), and fuzzy logic models, which are effective in handling uncertain and subjective data [7,15]. These methods support decision-makers in evaluating suppliers across key sustainability dimensions such as environmental management, social responsibility, and economic performance.
In parallel, visualization tools have been increasingly adopted to enhance the interpretability of complex evaluation results. Among these, radar charts serve as an intuitive method for displaying multi-dimensional performance, enabling a clear and rapid comparison across several criteria [9,16]. Although radar charts themselves are not analytical methods and cannot replace rigorous evaluation techniques, they function as valuable supplements in the decision-making process by graphically representing the relative strengths and weaknesses of suppliers after the evaluation has been conducted. Specifically, once reliable and high-quality data are processed through robust evaluation models such as fuzzy logic or MCDM techniques, radar charts assist stakeholders in understanding results from a holistic perspective and in facilitating communication among decision participants. Existing research has highlighted the benefits of radar charts in supplier performance reporting, sustainability benchmarking, and strategic decision support [16], particularly when used alongside systematic evaluation frameworks.
To this end, this study adopts radar chart visualization not as an evaluation method itself but as a post-evaluation tool to present the final outcomes derived from a linguistic fuzzy-based sustainability assessment. By achieving this, it enhances the transparency and usability of the results for managers, who must compare suppliers across four critical sustainability dimensions—environment, society, economy, and governance—while ensuring decisions remain aligned with the enterprise’s sustainable development objectives.
Choosing sustainable suppliers requires balancing environmental protection, social responsibility, economic feasibility, and innovation capacity. Since these criteria are often challenging to quantify, the process becomes a complex multi-criteria decision-making problem. Evaluation integrates diverse information types, including quantitative data, expert experience, and subjective judgment, with representations in numerical, interval, and linguistic forms [17,18]. Handling this heterogeneous information presents a significant challenge.
To address this, the present study employs fuzzy linguistic methodologies to develop an objective and systematic sustainable supplier evaluation mechanism. This approach leverages the flexibility of linguistic variables, preserving uncertainty while reducing translation errors and information loss, ultimately delivering robust evaluation outcomes [7,15]. Finally, radar charts are introduced strictly as a visualization tool to enhance the transparency and interpretability of the evaluation results. They present the weighted scores of each sustainability criterion, allowing for straightforward comparison among suppliers without affecting the evaluation process itself. Such visualizations provide management with an accessible overview of performance, supporting informed decision-making for sustainable supply chain development.
3. Evaluation Model
As corporate environmental awareness increases and global climate change issues intensify, sustainable supply chain management has become an indispensable part of corporate operations. Sustainable development is not limited to the company’s internal processes but also needs to cover all levels of the supply chain, especially the selection of suppliers. The sustainability performance of suppliers will directly affect the company’s environmental responsibility and social image. Therefore, how to evaluate and select sustainable suppliers has become an important issue of concern to both academic and practical circles.
When we measure the sustainability of suppliers today, we start by evaluating the three main aspects of environment, society, and economy (also known as the “triple bottom line”). In addition, some companies also consider the status of the supplier’s governance structure. There are corresponding evaluation criteria under each aspect to ensure that suppliers can meet the direction and requirements of sustainable development in all aspects; in order to further improve the comprehensiveness and accuracy of the evaluation, fuzzy linguistic pairs are introduced in the evaluation process in a timely manner. Language expression and calculation methods are used to process complex and uncertain information to ensure the scientificity and rationality of decision-making. The following are the detailed steps and method structure for sustainable supplier assessment:
| Step 1. | Definition of evaluation criteria (determine evaluation criteria and indicators): Enterprises need to first define the core criteria for sustainable supplier evaluation, which cover environmental, social, economic, or governance aspects. |
| Step 2. | Data collection and preprocessing: Relevant quantitative and qualitative data must be obtained from suppliers before evaluation. These data may be obtained, for example, through reports submitted by suppliers, results of evaluator audits or questionnaires. For different indicators, there may be different data formats, so unified processing is needed to facilitate subsequent conversion of crisp/fuzzy semantics. |
| Step 3. | Crisp/fuzzification focus: The evaluator can convert specific evaluation data into fuzzy verbal expressions and vice versa. For example, a supplier’s carbon emissions can be described using words such as “very high”, “normal”, and “very low” and assigned a corresponding membership degree (between 0 and 1), or, “delivery times are very accurate” can be converted into a clear value. This process allows for the evaluation of both qualitative and quantitative performance of suppliers. |
| Step 4. | Conversion/operation mechanism: Various fuzzy/clear input values of suppliers are converted into values or ratings in the same range for final decision-making. That is, the fuzzy evaluation and weight value of each sub-criteria are calculated using the two-tuple fuzzy language aggregation method. For each criterion under each indicator, the fuzzy language (or explicit value) evaluations of N experts are integrated, and their fuzzy integration scores are calculated, respectively. For example, defuzzifying “excellent” into a specific score allows decision-makers to gain insight into the performance of individual suppliers. For example, if the supplier’s environmental performance fuzzy evaluation is “medium” and its social responsibility evaluation is “high”, the comprehensive result derived from the inference may be “high”, which will be converted into a specific score after defuzzification, such as 85 points. |
| Step 5. | A radar chart is drawn: The data of each indicator are converted into a point on the radar chart. Its values are usually normalized to a specific range (such as [0, 1] or [0, 100]). By connecting the points of each indicator to form a graph, managers can intuitively compare the performance of different suppliers on various environmental indicators. |
| Step 6. | Decision-making and selection (result analysis and decision-making): Based on the concrete results presented in the radar chart and through area comparison, dimensional comparison, or difference analysis, companies can comprehensively consider all evaluation criteria and ultimately select the supplier that best meets the goals of sustainable development. |
| Step 7. | System feedback and optimization: Due to changes in the market environment and corporate needs, the proposed evaluation system requires continuous optimization. Based on the results of actual applications, enterprises can adjust the criteria corresponding to the evaluation indicators and their respective weights to ensure that the system can dynamically adapt to new decision-making needs. |
Depending on the specific problem domain, an appropriate set of linguistic terms is chosen to describe vague or imprecise knowledge. The number of terms in the set determines the level of granularity in addressing uncertainty. When experts have differing perceptions of the degree of uncertainty in a phenomenon, multiple linguistic term sets with varying granularities of uncertainty may be required [17,18].
A linguistic representation using a pair of values is known as a 2-tuple, consisting of a linguistic term and a numerical value. The primary advantage of this representation lies in its continuity within its domain. This enables it to express any degree of information within the defined universe of discourse. The symbol L = (s, α) is used to denote this 2-tuple, where s represents the linguistic label, and α is a numerical value signifying the symbolic translation. Specifically, a 2-tuple linguistic variable is expressed as (si, αi), where si is the central value of the ith linguistic term, and αi represents the deviation from this central value.
For instance, consider a set of five linguistic terms S, which could be defined as follows:
S = {s0:VL, s1:L, s2:A, s3:H, s4:VH}
This indicates that the linguistic term set S consists of five terms: “Very Low”, “Low”, “Average”, “High”, and “Very High”, represented as s0, s1, s2, s3, and s4, respectively. Each term is associated with a triangular fuzzy number, with membership functions illustrated in Figure 1b. A 2-tuple linguistic variable set can include three, five, seven, or more terms. However, as the number of terms increases, the complexity for experts to implement the set also grows. In practical applications, a five-term set is most commonly utilized due to its balance between simplicity and expressiveness.
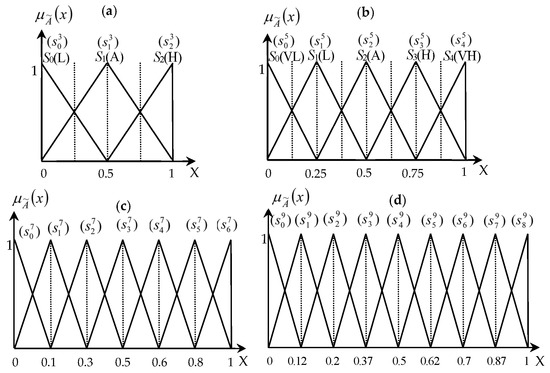
Figure 1.
Linguistic term set of different labels with its semantics. (a) Three semantic variables, (b) Five semantic variables, (c) Seven semantic variables, (d) Nine semantic variables, respectively.
For conversion between numbers and tuples, when evaluation results are aggregated using the linguistic variable set S, a numeric value δ within the interval [0, 1] is obtained. To represent δ as a 2-tuple linguistic variable, a symbolic conversion process is applied. This process is defined by a generalized conversion function Δ, which can be expressed as:
where δ ∈ [0, 1]. The value δ is translated into the closest linguistic term si in the set S, along with a value α through symbolic translation. The 2-tuple fuzzy linguistic approach uses this symbolic translation to represent linguistic variables as 2-tuples (si, α), where si ∈ S. The range of α is determined by the number of linguistic terms in S. For instance, if S contains five linguistic terms (g = 5), then α ∈ [−0.1, 0.1).
Conversely, the 2-tuple can be converted to an equivalent numeric value δ (δ∈[0, 1]) using the following formula:
The functions ∆ and ∆−1 enable seamless conversion between numeric values and 2-tuples without any loss of information. As a result, numerical aggregation operators can be readily adapted to work with linguistic 2-tuples.
Symbolic translation functions, ∆ and ∆−1, are used during the information aggregation process to ensure that the aggregation of 2-tuple linguistic variables remains a 2-tuple, with no loss of information. Given a 2-tuple linguistic variable set R = {(s1, α1), …, (sn, αn)}, their arithmetic mean can be calculated as:
R = {(s1, α1), …, (sn, αn)} represents a 2-tuple linguistic variable set, and W = {w1, …, wn} denotes the corresponding weight set for the linguistic terms. Hence, the 2-tuple linguistic weighted average can be computed as:
Furthermore, let W = {(w1, αw1), …, (wn, αwn} be the linguistic weight set of linguistic terms. Such a linguistic weighted average operator is extended from the weighted average operator and can be computed as:
4. Case Verification
The textile industry was once a pillar industry of Taiwan’s economy, especially in the mid-20th century, creating significant foreign exchange earnings and employment opportunities, laying the foundation for economic growth. According to Wong [19], Taiwan leveraged its abundant labor force to export high-quality and low-cost textiles globally, contributing to its economic take-off. As the global industrial chain shifted, Taiwan’s textile industry transitioned to high-value-added functional textiles such as moisture-wicking, waterproof, breathable, and antibacterial materials, securing a foothold in the sports and outdoor apparel market.
Today, the textile industry faces the challenges of digital transformation and sustainable development. Artificial-intelligence-related technologies can help optimize supply chains, improve design efficiency and reduce material waste. For example, AI helps in market trend analysis, innovative design generation, and minimizing resource consumption. In addition, data analysis can enhance quality control, increase product yield, and reduce carbon footprint [20]. Looking ahead, combining AI with ESG (environmental, social, and governance) strategies can promote circular economy practices, such as developing recyclable or biodegradable materials and improving production energy efficiency [21,22].
Among Taiwan’s industries, the textile industry is one of the key areas for ESG enhancement. This study takes a textile manufacturer in central Taiwan as an example. Since its establishment in the early 1970s, it has specialized in elastic knitted fabrics and professional functional clothing. It has accumulated decades of experience and used the advantages of vertical integration to provide customers with a complete range of products, from fabrics to garment-making services. As a leading functional textile company in Taiwan, this case company continues to invest in environmentally friendly processes to reduce wastewater discharge and energy consumption. They develop recycled polyester fibers to achieve efficient utilization of waste plastics while actively pursuing carbon neutrality goals. By combining AI technology and sustainable concepts, this case company has not only improved its market competitiveness but has also set a good example for Taiwan’s textile industry. Looking ahead, the textile industry needs to move towards “green manufacturing” and continue to improve on ESG indicators in order to maintain its leading position in the global market while contributing to environmental protection and social development. The proposed method algorithm shown in Figure 2 outlines the sustainable supplier performance evaluation process and is summarized as follows.
| Step 1. | Through on-site visits and interviews with middle- and high-level managers of manufacturers, we confirmed the future vision and goals of industrial development, as well as the requirements that sustainable suppliers must meet, in addition to the corresponding selection criteria, and we transformed them into positive and negative criteria. The criteria and indicators required to further define the evaluation model are as follows:
|
| Step 2. | Through reports submitted by suppliers and data collected from assessors’ audits or questionnaires, professional and objective assessments of suppliers in terms of environmental and social responsibility, economic benefits, and governance indicators are conducted. Different indicators may have different data formats, which are further unified for subsequent conversion of clear/fuzzy semantics. Referring to Table 1, except for the third person who used five language variables for evaluation, the other two used seven language variables for evaluation. |
| Step 3. | The evaluator can convert specific evaluation data into fuzzy words for expression and can also convert fuzzy words back into specific data. This process enables a comprehensive assessment of the supplier’s qualitative and quantitative performance. The evaluation results are shown in Table 2, Table 3, Table 4 and Table 5 and Figure 3, Figure 4, Figure 5 and Figure 6. |
| Step 4. | For each criterion, the fuzzy linguistic evaluations provided by N raters are aggregated, and their fuzzy aggregate score is calculated. The fuzzy evaluation and weight value of each sub-criterion are calculated using the bigram fuzzy linguistic aggregation method. For example, if the first expert gives a fuzzy evaluation of “should be good” (, −0.05) to the sub-criterion EN5 (waste disposal) under the “environmental indicators” criterion, it is converted into a crisp value, that is, β = 5/6 − 0.05 = 0.783. The average rating: (0.783 + 0.667 + 0.75)/3 = 0.733 The average weights are as follows: (1 + 0.783 + 1)/3 = 0.928 The weighted average rating is as follows: (0.783 × 1 + 0.667 × 0.783 + 0.75 × 1)/0.928 = 0.73. |
| Step 5. | A radar chart is drawn: The data of each indicator are converted into points on the radar chart, and they are normalized to a specific range (such as [0, 1] or [0, 100]), and these points are connected to form a graph, which is convenient for the area of the radar chart. Comparison, dimension comparison, or difference analysis can be used to intuitively compare the overall performance of each supplier on various indicators. For example, the radar chart area under the “environmental indicator” criterion is calculated as follows: Area = 0.5 × (0.829 × 0.679 × sin(2π/5) + … + 0.739 × 0.829 × sin(2π/5)) = 1.2527. This accounts for (1.2527/2.3778) = 52.68% of the total area of the radar chart. |
| Step 6. | Decision-making and selection (result analysis and decision-making) are carried out as follows: Based on the concrete results presented in the radar chart, and through area comparison, dimensional comparison, or difference analysis, companies can comprehensively consider all evaluation criteria and ultimately select the supplier that best meets the goals of sustainable development. From the radar chart, it is evident that the area representing governance occupies the largest proportion (56.85%), while the weakest performance is in the environmental aspect (52.68%). This appears to contradict the spirit of sustainability, indicating that this supplier needs to put extra effort into improving its performance in various environmental sub-goals. The linguistic evaluation results also show that the overall performance in governance is 0.7611 (quite excellent), making it the strongest among all aspects. In contrast, performance in environmental indicators can only be described as “fair”, representing the weakest area. Furthermore, the two evaluation methods presented in this report yield quite consistent results. |
| Step 7. | System feedback and optimization are as follows: To meet the ever-changing market and business needs, the evaluation system must be continuously optimized through the adjustment of standards and weights. Starting with the weakest environmental aspect, the supplier achieves more than 80% performance levels in carbon emissions (0.829) and energy consumption (0.828). However, its actions regarding water resource management (0.679) and product recycling rate (0.573) are considerably low, making them the two areas most in need of improvement. Next, on the social front, the supplier excels in safeguarding human rights, achieving a performance of nearly 89%. Occupational safety and health is also a priority for the company. However, employees’ satisfaction with their jobs fails to reflect the efforts made in these areas, as only 61% of employees express approval. Third, in terms of economic performance, the supplier demonstrates very high standards in product quality and delivery capabilities, with scores of 0.842 and 0.833, respectively. Nevertheless, its understanding of total cost-effectiveness is notably weak and requires significant improvement. Finally, in corporate governance, the completeness of the company’s governance structure is outstanding. Additionally, its mechanisms for accountability and performance evaluation are well recognized. However, the diversity of board representation seems to fall short and should be addressed to strengthen this aspect. In summary, there are five key areas where this supplier must focus on improvement and actively reinforce from the perspective of sustainable operations: board diversity, total cost-effectiveness, product recycling rate, employee job satisfaction, and water resource management. |
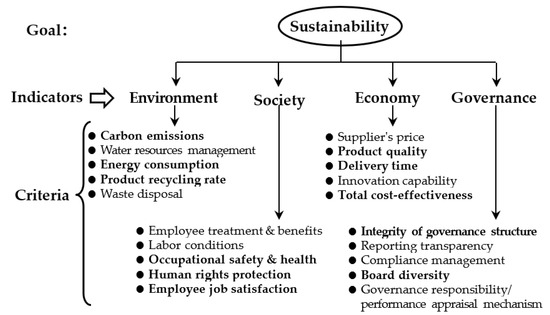
Figure 2.
Hierarchical structure of sustainability evaluation for the case company.

Table 1.
Designated category of linguistic variable terms for experts.
Table 2.
Summary of environmental indicators assessment results.
Table 3.
Summary of society indicators assessment results.
Table 4.
Summary of economy indicators assessment results.
Table 5.
Summary of governance indicators assessment results.
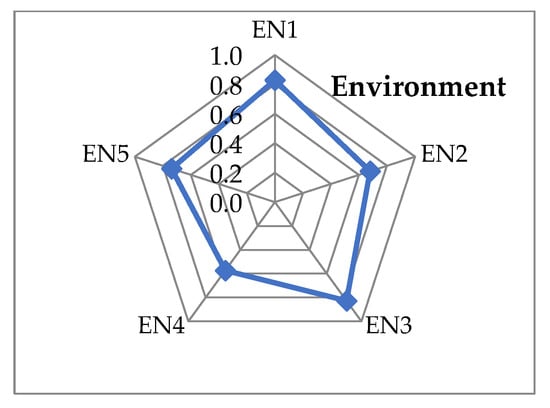
Figure 3.
Radar chart of environmental indicator evaluation results.
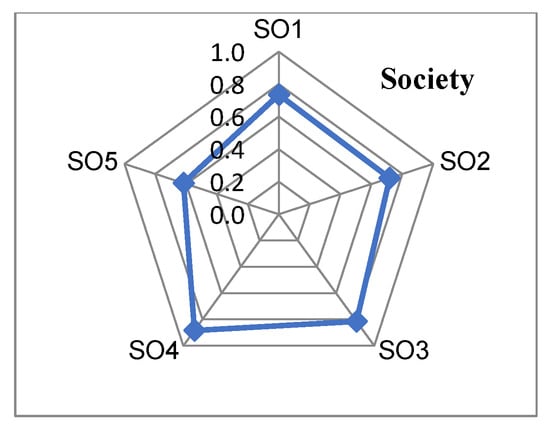
Figure 4.
Radar chart of society indicator evaluation results.
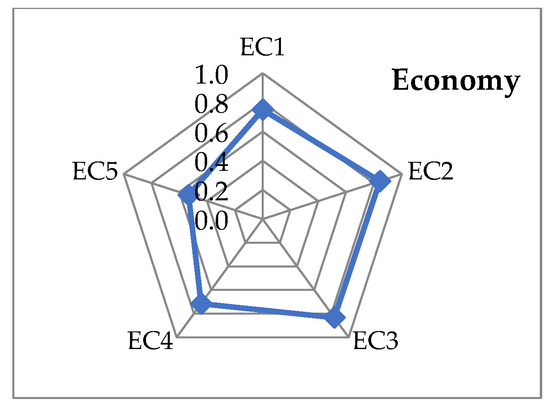
Figure 5.
Radar chart of economy indicator evaluation results.
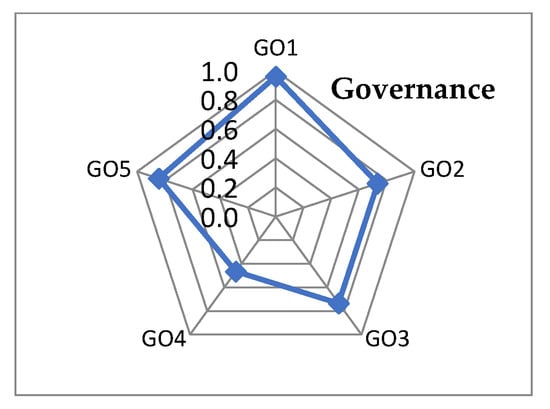
Figure 6.
Radar chart of governance indicator evaluation results.
5. Results and Discussion
According to the summary of the empirical research results shown in Table 6, the comparative analysis is discussed as follows.
Table 6.
Summary of empirical research results.
- Overall evaluation indicators and performance analysis
The radar chart analysis shows that among the four main sustainability dimensions, the “governance dimension (GO)” accounts for the highest proportion (56.85%), slightly higher than the social dimension (SO) at 56.70% and significantly better than the economic dimension (EC) at 54.27% and the environment dimension (EN) at 52.68%. This result indicates that the supplier has a relatively strong infrastructure and management framework in terms of governance mechanisms but performs poorly in environmental aspects.
The linguistic semantic evaluation further provides specific performance values, among which governance performance (0.7619) ranks first again, slightly higher than society (0.7591), while the economic and environmental performances are 0.7363 and 0.7197, respectively. The environmental dimension performance is the weakest, which is consistent with the radar chart findings.
- 2.
- Economy (EC) and environment (EN)
Although the performance of the economic dimension (54.27%; 0.7363) is better than that of the environment (52.68%; 0.7197), both are at moderate levels and notably lag behind governance and society. This indicates that there is room for improvement in the supplier’s overall cost-effectiveness and resource utilization efficiency. In particular, further strengthening of comprehensive benefit management is required.
The relatively low score for the environment is a clear weakness. The low radar proportion (52.68%) and low linguistic performance (0.7197) indicate that the supplier needs significant improvement in carbon emissions, water resource management, and product recycling.
These findings are consistent with previous research emphasizing the environmental challenges faced by the textile industry, particularly regarding water usage and waste management [19,20]. Moreover, Carter and Rogers [18] argue that economic and environmental performance are closely interrelated, where better resource management often leads to cost savings, highlighting a synergy the supplier should actively pursue.
- 3.
- Specific improvement recommendations
Based on the analysis, governance and social responsibility are the supplier’s strengths, while economy and environment are key areas for improvement. To address these issues, the following recommendations are proposed:
Governance and Society: Following Elkington’s (1997) triple bottom line framework [8], enhance board diversity and inclusiveness, promote systematic governance structures, and improve transparency management to strengthen social trust and organizational resilience.
Economy: Optimize resource allocation and supply chain efficiency to strengthen cost-effectiveness management. Practical measures may include adopting advanced manufacturing technologies [13] and implementing supplier collaboration programs to reduce procurement costs over time.
Environment: Focus on water resource management and circular economy practices. Actions may involve investing in water recycling systems, increasing the proportion of recycled raw materials, and improving product recyclability [21,22]. Furthermore, long-term strategies could include adopting carbon neutrality targets and engaging in cross-sector green innovation alliances to accelerate environmental improvements.
By integrating the radar chart with linguistic semantic assessment results, enterprises can identify priority areas for improvement more comprehensively and systematically support the enhancement of sustainability indicators. In comparison to traditional sustainable supplier evaluation methods, such as Analytic Hierarchy Process (AHP), Technique for Order of Preference by Similarity to Ideal Solution (TOPSIS), and Data Envelopment Analysis (DEA), the proposed fuzzy linguistic evaluation framework demonstrates several notable advantages. Unlike AHP and TOPSIS, which require precise numerical inputs and may struggle to handle ambiguous or subjective information, the fuzzy linguistic method effectively captures the uncertainty and vagueness inherent in expert judgments through linguistic variables [17]. Moreover, while DEA focuses on efficiency measurement and requires large datasets, our framework is adaptable to both limited and diverse data sources, making it highly applicable in real-world industry settings where data granularity varies.
However, the proposed method also has limitations. Compared to machine-learning-based predictive models, such as those using artificial neural networks (ANNs), our framework relies heavily on expert input, which may introduce bias. Additionally, the fuzzification and defuzzification processes can increase computational complexity, especially when handling large-scale supplier datasets [2,11]. Future enhancements could explore hybrid models combining fuzzy logic with machine learning to optimize accuracy and reduce dependency on subjective judgments.
6. Conclusions
Based on radar chart analysis and fuzzy language expression and operation methods, this study constructs a complete sustainability assessment framework to help companies systematically select suppliers that meet the concept of sustainable development. Through a case study of the textile industry, the accuracy and consistency of the evaluation mechanism integrating subjective and objective indicators were verified. The analysis results can effectively identify the robust or weak links in the four dimensions of environment, society, economy, and governance and provide direction for sustainable improvement.
This study found that although the supplier in this case performed well in terms of governance structure (governance index score of 56.85%) and social responsibility (human rights protection score of 0.89), there was obvious room for improvement in environmental performance (environmental index score of 52.68%), especially in water resource management (score of 0.679) and product recycling rate (score of 0.573), which needed to be greatly strengthened. In addition, although the supplier’s overall cost-effectiveness concept was weak, the economic-related high-efficiency indicators shown in the radar chart (such as product quality and delivery capability, with scores of 0.842 and 0.833, respectively) show that it has potential advantages that can be further explored and integrated.
In terms of practical implications, this study provides companies with a flexible and practical tool that can be directly applied to data already collected from supplier audits, internal records, or ESG reports, allowing for seamless integration into existing decision-making processes. In addition, companies may choose to “de-fuzzy” the data by designing standardized questionnaires with closed questions using a common scale (such as Likert 1–5 or 1–7), which would facilitate the quantification of subjective evaluations and improves cross-evaluator consistency [11].
Secondly, in terms of academic significance, this research contributes to the field of sustainable supply chain management by demonstrating the effectiveness of combining fuzzy language models with visualization tools (such as radar charts), bridging the gap between qualitative expert judgment and quantitative performance analysis and enriching multi-criteria decision making (MCDM) methods in complex real-world environments.
Furthermore, the application cases or objects of the framework proposed in this study are beyond the textile industry, including high-complexity industries such as electronics, automotive, and food manufacturing, where sustainable supplier selection involves diverse and often vague criteria. Through flexible language variables, the model can be adapted to industries with different data precision and expertise levels, ensuring practical versatility.
Finally, in terms of limitations and future research directions, although the proposed model effectively balances subjective and objective evaluations, it relies on expert opinions, which may introduce bias or inconsistency. Future research could explore integrating machine learning algorithms to automatically calibrate weights based on historical performance data. Furthermore, expanding the framework to incorporate dynamic weights in response to changing market or environmental priorities would enhance its adaptability. Further empirical research across multiple industries and regions will also help validate the generalizability of the model and improve its robustness.
Based on the findings of this study, we recommend that companies focus on improving the diversity of supplier boards, employee job satisfaction, and optimizing water use and circular economy practices in their future sustainability strategies. At the same time, the application of this research methodology proves that the combination of visualization tools and fuzzy evaluation technology can significantly improve the efficiency and reliability of decision-making.
Author Contributions
Conceptualization, W.-P.W.; visualization, W.-P.W. and Y.-H.H.; methodology, W.-P.W.; validation, W.-P.W. and Y.-H.H.; formal analysis, W.-P.W. and Y.-H.H.; investigation, W.-P.W. and Y.-H.H.; writing—original draft preparation, W.-P.W.; writing—review and editing, W.-P.W., and Y.-H.H.; supervision, W.-P.W.; software, W.-P.W. and Y.-H.H.; data curation, Y.-H.H.; resources, W.-P.W. and Y.-H.H. All authors have read and agreed to the published version of the manuscript.
Funding
This research received no external funding.
Institutional Review Board Statement
Not applicable.
Informed Consent Statement
Not applicable.
Data Availability Statement
Data are contained within the article.
Conflicts of Interest
The authors declare no conflicts of interest.
References
- Sheehy, B.; Farneti, F. Corporate Social Responsibility, Sustainability, Sustainable Development and Corporate Sustainability: What is the Difference, and does it Matter? Sustainability 2021, 13, 5965. [Google Scholar] [CrossRef]
- Osmundsen, T.C.; Amundsen, V.S.; Alexander, K.A.; Asche, F.; Bailey, J.; Finstad, B.; Olsen, M.S.; Hernández, H.; Salgado, H. The Operationalisation of Sustainability: Sustainable Aquaculture Production as Defined by Certification Schemes. Glob. Environ. Change 2020, 60, 102025. [Google Scholar] [CrossRef]
- Montabon, F.; Pagell, M.; Wu, Z. Making Sustainability Sustainable. J. Supply Chain Manag. 2016, 52, 11–27. [Google Scholar] [CrossRef]
- Ruggerio, C.A. Sustainability and Sustainable Development: A Review of Principles and Definitions. Sci. Total Environ. 2021, 786, 147481. [Google Scholar] [CrossRef] [PubMed]
- Kuhlman, T.; Farrington, J. What is sustainability? Sustainability 2010, 2, 3436–3448. [Google Scholar] [CrossRef]
- Karsak, E.E.; Tolga, E. Fuzzy Multi-Criteria Decision-Making Procedure for Evaluating Advanced Manufacturing System Investments. Int. J. Prod. Econ. 2001, 69, 49–64. [Google Scholar] [CrossRef]
- Wang, W.P. A Fuzzy Linguistic Computing Approach to Supplier Evaluation. Appl. Math. Model. 2010, 34, 3130–3141. [Google Scholar] [CrossRef]
- Elkington, J. Cannibals with Forks: The Triple Bottom Line of 21st Century Business; Capstone: Mankato, MN, USA, 1997; pp. 69–93. [Google Scholar]
- Zhang, H.; Hou, Y.; Zhang, J.; Qi, X.; Wang, F. A New Method for Nondestructive Quality Evaluation of the Resistance Spot Welding Based on the Radar Chart Method and the Decision Tree Classifier. Int. J. Adv. Manuf. Technol. 2015, 78, 841–851. [Google Scholar] [CrossRef]
- Carter, C.R.; Rogers, D.S. A Framework of Sustainable Supply Chain Management: Moving Toward New Theory. Int. J. Phys. Distrib. Logist. Manag. 2008, 38, 360–387. [Google Scholar] [CrossRef]
- Lafuente-Lechuga, M.; Cifuentes-Faura, J.; Faura-Martínez, U. Sustainability, Big Data and Mathematical Techniques: A Bibliometric Review. Mathematics 2021, 9, 2557. [Google Scholar] [CrossRef]
- Moore, J.E.; Mascarenhas, A.; Bain, J.; Straus, S.E. Developing a Comprehensive Definition of Sustainability. Implement. Sci. 2017, 12, 110. [Google Scholar] [CrossRef] [PubMed]
- Tsai, S.B.; Xue, Y.Z.; Chen, Q.; Zhou, J. Discussing and Evaluating the Green Environmental Performance of Manufacturers. In Research Advances in Industrial Engineering; Springer: Berlin/Heidelberg, Germany, 2015; pp. 59–75. [Google Scholar] [CrossRef]
- Kocmanová, A.; Pavláková Dočekalová, M.; Škapa, S.; Širáňová, L. Measuring Corporate Sustainability and Environmental, Social, and Corporate Governance Value Added. Sustainability 2016, 8, 945. [Google Scholar] [CrossRef]
- Wang, W.P. Toward Developing Agility Evaluation of Mass Customization Systems Using 2-Tuple Linguistic Computing. Expert Syst. Appl. 2009, 36, 3439–3447. [Google Scholar] [CrossRef]
- Chen, K.S.; Yu, C.M.; Lin, J.S.; Huang, T.H.; Zhong, Y.S. Fuzzy Radar Evaluation Chart for Improving Machining Quality of Components. Mathematics 2024, 12, 732. [Google Scholar] [CrossRef]
- Herrera, F.; Martinez, L. A 2-Tuple Fuzzy Linguistic Representation Model for Computing with Words. IEEE Trans. Fuzzy Syst. 2000, 8, 746–752. [Google Scholar] [CrossRef]
- Herrera-Viedma, E.; Cordon, O.; Luque, M.; Lopez, A.G.; Munoz, A.M. A Model of Fuzzy Linguistic IRS Based on Multi-Granular Linguistic Information. Int. J. Approx. Reason. 2003, 34, 221–239. [Google Scholar] [CrossRef]
- Wong, W.H. The Trajectory of Taiwan Textile Industry Business Model: A Case Study of Chia Her Industrial Co., Ltd. Master’s Thesis, National Taiwan University, Taipei, Taiwan, 2019; pp. 1–55. [Google Scholar]
- Zhang, Z.; Huang, J.; Yao, Y.; Peters, G.; Macdonald, B.; La Rosa, A.D.; Wang, Z.; Scherer, L. Environmental Impacts of Cotton and Opportunities for Improvement. Nat. Rev. Earth Environ. 2023, 4, 703–715. [Google Scholar] [CrossRef]
- Xujayev, I. Development Trends of the Global Textile Industry: A Comprehensive Analysis. Sci. J. Actuar. Financ. Account. 2024, 4, 165–170. Available online: https://finance.tsue.uz/index.php/afa/article/view/351 (accessed on 15 May 2023).
- Chen, S.M.; Chen, Y.T.; Shen, Y.-H.H. Model Establishment and Research of Green Supply Chain Management System-Case Study of Clothes Industry in Taiwan. J. Tainan Univ. Technol. Hum. Soc. Manag. 2008, 27, 281–292. [Google Scholar] [CrossRef]
Disclaimer/Publisher’s Note: The statements, opinions and data contained in all publications are solely those of the individual author(s) and contributor(s) and not of MDPI and/or the editor(s). MDPI and/or the editor(s) disclaim responsibility for any injury to people or property resulting from any ideas, methods, instructions or products referred to in the content. |
© 2025 by the authors. Licensee MDPI, Basel, Switzerland. This article is an open access article distributed under the terms and conditions of the Creative Commons Attribution (CC BY) license (https://creativecommons.org/licenses/by/4.0/).