Article

Effect of Plant Part and Age on the Proximate, Chemical, and Elemental Characteristics of Elephant Grass Cultivar BRS Capiaçu for Combustion-Based Sustainable Bioenergy

by
Roberto C. Beber
1,
Camila d. S. Turini
2,
Vinicius C. Beber
3,*,
Roberta M. Nogueira
2 and
Evaldo M. Pires
1
1
Programa de Pós-Graduação em Biotecnologia e Biodiversidade—Rede Pró Centro-Oeste, Universidade Federal do Mato Grosso, Campus Sinop, Av. Alexandre Ferronato, 1200, Sinop 78550-728, MT, Brazil
2
Campus Sinop, Universidade Federal do Mato Grosso, Av. Alexandre Ferronato, 1200, Sinop 78550-728, MT, Brazil
3
Fraunhofer-Institute for Manufacturing Technology and Advanced Materials (IFAM), Wiener Straße 12, D-28359 Bremen, Germany
*
Author to whom correspondence should be addressed.
Sustainability 2025, 17(6), 2741; https://doi.org/10.3390/su17062741
Submission received: 18 January 2025 / Revised: 26 February 2025 / Accepted: 17 March 2025 / Published: 19 March 2025

Abstract

:
Elephant grass is an outstanding crop biomass for sustainable energy generation. Here, the effect of plant parts (stem, leaf, and whole plant) at four ages (90, 120, 150, and 180 days) on the proximate, chemical, and elemental characteristics of elephant grass cultivar BRS Capiaçu is investigated. From proximate analysis, the heating value is dependent on the water content regardless of plant part and age. A linear model allowing the prediction of heating value solely based on water content is derived from measurements. Density is modelled as a quadratic function of water content across ages and plant parts. Such a model can be used to predict the moisture-dependent weight of the biomass and its parts. Cellulose content is at the upper bound of benchmark values found in the literature. The highest lignin content, which tends to increase with age, is found in the stem. From elemental analysis, a much higher mineral content increasing with age is produced by the leaf. Contrarily, significantly lower mineral content is generated by the stem, bottoming out at 180 days. This is reflected in five predictive indices for slagging and fouling, which suggest that the stem at 180 days is the optimal part and age for energy purposes.

1. Introduction

Biomass-based energy generation has emerged as a sustainable alternative to fossil fuels, offering a renewable source of energy that can help mitigate climate change-related effects [1,2,3]. Among biomasses, the ones derived from dedicated energy crops present an attractive solution due to their potential to increase energetic autonomy, whilst simultaneously contributing to carbon sequestration [4,5]. Unlike fossil-based fuels, crop (or agricultural) biomasses absorb carbon dioxide from the atmosphere during cultivation, offsetting partially or totally the emissions produced during their combustion, making them a more carbon-neutral energy source [6].
Elephant grass (Pennisetum purpureum, syn. Cenchrus purpureus) has been steadily investigated for its energy potential [7], including its use in ethanol [8] and bio-oil production [9,10], as well as through processes like pyrolysis [11] and combustion [12,13]. As a perennial grass, elephant grass is known for its high biomass yield per land area, rapid growth, and adaptability to a wide range of climatic conditions, especially in tropical regions [14]. In this regard, Johannes et al. [15] presented a thorough review of elephant grass as a bioenergy resource including lignocellulosic content (combined presence of cellulose, hemicellulose, and lignin), proximate and ultimate analysis, as well as energetic conversion pathways.
Nonetheless, the selection of the proper pathway for energy generation is dependent on the specific characterisation of each region. In Brazil, more specifically in the State of Mato Grosso, the use of bioenergy systems based on biomass combustion has become the most prominent approach to energy generation [16,17]. Another relevant factor is related to the selection of the proper variety or cultivar of elephant grass since they are also bred to be adapted to certain regions or to obtain specific morphological traits [18]. For energetical purposes, several studies have demonstrated that the energy generated by elephant grass is dependent on the variety/cultivar [13,14,15]. In this regard, the cultivar BRS Capiaçu [19] has been widely spread in Brazil for animal feeding purposes. However, a previous study by Beber et al. [20] has demonstrated the viability of BRS Capiaçu as a sustainable alternative biomass in both agricultural and energetical terms for energy generation in the Amazon, specifically in the State of Mato Grosso.
For the operation of bioenergy systems based on biomass combustion, the efficiency and performance of such systems are highly dependent on the combustion parameters [21,22], as well as characteristics of the biomass itself [23]. These characteristics include the proximate composition (e.g., water and ash content,), elemental composition (e.g., carbon, hydrogen, oxides), and chemical composition (lignocellulosic content) [9,24]. Furthermore, the specific plant part used—leaves, stems, or roots—along with the plant’s age [14], can significantly affect these compositions. Moreover, the ash behaviour [25] of the biomass has a direct impact on the lifetime of the energy system due to issues with wear [26], corrosion [27], along with slagging and fouling [28]. In this regard, predictive models play a crucial role in the optimisation of energy systems based on biomass by providing a tool to forecast performance and improve decision-making [29]. Such models can be used to predict energy output [29,30,31,32], operational issues [33], and even chemical composition [34]. However, none of these models were specifically made for or addressed the use of elephant grass BRS Capiaçu as the biomass under investigation.
The current investigation aims to assess the effects of plant part and age on the proximate, structural, and elemental characteristics of elephant grass cultivar BRS Capiaçu. The focus is related to its use in combustion-based biomass energy production considering operational-relevant aspects. In terms of plant part, the usage of the stem, the leaves, or the whole plant under plant ages of 90, 120, 150, and 180 days will be taken into consideration. Proximate analysis will focus on water content effects on density and heating values, whereas chemical analysis will focus on the determination of age- and part-related lignocellulosic content. Finally, elemental analysis will be employed to assess the mineral contents of dried and ash samples and their impact on potential ash-related operational issues.

2. Materials and Methods

In this study, biomass was produced using the BRS Capiaçu cultivar of elephant grass as shown in Section 2.1. A comprehensive set of analyses was performed to characterise the most relevant properties of the biomass in the context of a combustion-based energy generation system, such as proximate analysis (Section 2.2), chemical analysis (Section 2.3), and elemental analysis (Section 2.4). A schematisation of the biomass production and characterisation is given in Figure 1.

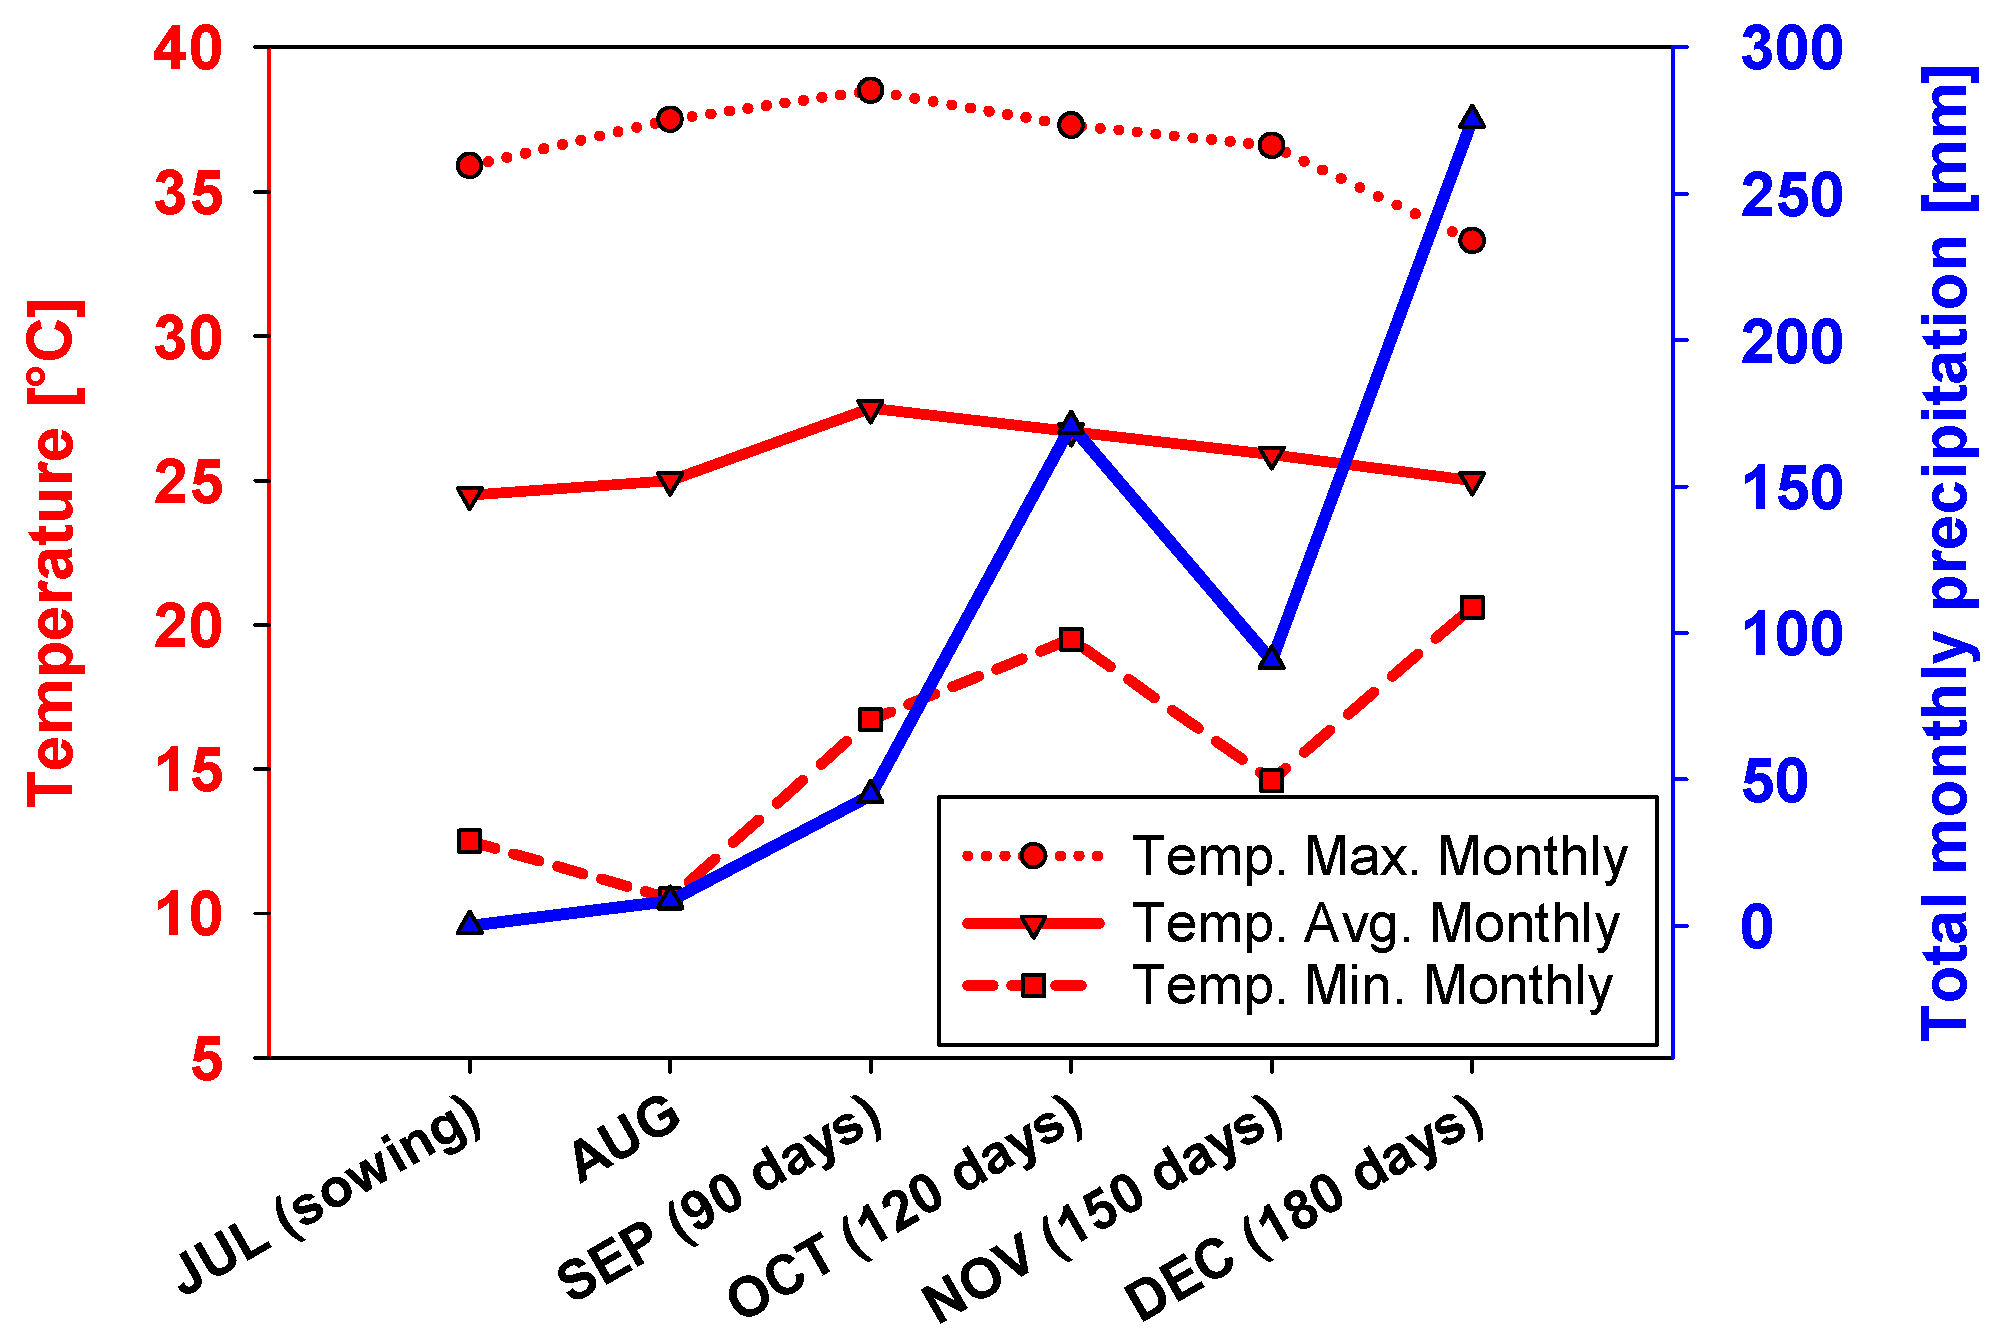
2.1. Biomass Production

Elephant grass (Cenchrus purpureus) in the cultivar BRS Capiaçu was planted in a sandy soil in a one-hectare area (100 × 100 m2) in the city of Tapurah/MT, Brazil (12°19′ S; 56°26′ W, Altitude 356 m). The harvesting field was located within a tropical savannah climate (Aw). Soil preparation was carried out with the aid of a harrow to a depth of 30 cm, followed by an application of four tonnes per hectare of limestone for soil pH correction and 150 kg/ha of Monoammonium Phosphate. Sowing was carried out by placing stems at the bottom of the groove with subsequent coverage with soil. Spacing between sowing lines was 1 m.
Due to low rainfall during the dry season, the crop was drip irrigated with 6.5 mm/ha/day. For reference, the weather data on total monthly precipitation, as well as maximum, average, and minimum monthly temperature are given in Figure 2. During cultivation, weed infestation was manually, mechanically, and chemically controlled using a hoe, a tractor-driven mower, and selective herbicides, respectively. After 30 days of germination, a top dressing was applied with 50 kg/ha of NPK 20-00-20.
The harvesting of the biomass took place at the four different plant ages (or maturity), namely 90, 120, 150, and 180 days after sowing, in order to assess the effect of maturity on proximate, chemical and elemental characteristics of the biomass. The harvesting field was divided into 16 quadrants measuring 25 × 25 m2 each. Each quadrant was labelled by its harvest age and randomly assigned a position by drawing lots, with 4 repetitions per age.
The biomass was harvested manually using a machete, considering at least six hours of sunlight to prevent humidity outside the plant from interfering with moisture content. After harvesting, the biomass underwent a sieve-free uniform granulometry in a Forage Crusher (Supplier: Trapp, Model: TRF 400 Super, Location: Jaraguá do Sul, Brazil).

2.2. Proximate and Density Analysis

For proximate analysis, only the water content was measured as the other properties, e.g., volatile, fixed carbon, and ash content were determined in a previous investigation (see Beber et al. [20]). The biomass and containers were weighed with a scale with a 0.0001 g precision (Supplier: Weblabor, Model: M254 Ai, Location: Monza, Italy). The water content W c was determined considering 5 samples with 7 g each, which were weighed in ceramic containers of known mass. After the initial weighing, the material was taken to a forced circulation oven (Supplier: Solab, Model: SL-102, Location: Piracicaba, SP, Brazil) at 105 °C to remove the moisture contained in the samples. The water content W C was calculated according to:
W c = m 1 m 2 m 1 100
where m 1 was the sample’s initial mass before drying, and m 2 was the final sample mass after drying. The water content was expressed as a percentage on a wet basis (% w.b.). The drying aimed to obtain samples with approximately 80, 60, 40, and 20% water content in order to evaluate this effect on the density and heating value of the biomass. The density was measured by dividing the mass of the biomass samples by a fixed volume of 1.9 cm3.
The determination of the Heating Value (HV) at different water contents was carried out following the standard NBR 8633 [36]. In this regard, a calorimeter (Supplier: IKA, Model: C-200, Location: Staufen, Germany) in isoperibolic mode was employed during measurements. The calorimeter calibration was performed considering benzoic acid tablets (Supplier: IKA, Type: C 723, Location: Staufen, Germany) with an HV of 26,460 kJ/kg.

2.3. Chemical Analysis

The chemical analysis of the biomass was carried out to determine the lignocellulosic contents of the biomass, namely neutral detergent fibre (NDF), acid detergent fibre (ADF), lignin (LIG), cellulose (CEL), and hemicellulose (HCEL). NDF represents the total fibre content, including LIG, CEL, and HCEL obtained through a treatment with a neutral detergent. The ADF includes only LIG and CEL, which were obtained after treatment with an acid detergent. The processes involve drying, grinding, and processing plant material (elephant grass BRS Capiaçu) using chemical solutions and bags made of non-woven fabric. The procedure was based on the Van Soest method [37], with the use of an autoclave to accelerate digestion. Then, the percentage of each lignocellulosic content was calculated based on weight differences before and after the processes.
The determination of NDF was initiated by preparing biomass samples, which were first dried in a forced-air oven (Supplier: Solab, Model: SL-102) at 105 °C for 24 h to remove moisture. The dried material was then ground to a particle size of 1–2 mm. Approximately 0.5 g of the sample was weighed and placed into pre-labelled and pre-weighed non-woven fabric bags, which were sealed to prevent material loss during the procedure. The bags were submerged in a neutral detergent solution and processed in an autoclave at 110–120 °C for 40–60 min to facilitate digestion. After autoclavation, the bags were rinsed thoroughly with hot water to remove detergent residues, and a wash with acetone was performed to eliminate residual lipids. The bags were subsequently dried in an oven at 105 °C for approximately 8 h. Once dried, the bags were weighed, and the NDF percentage was calculated based on the weight differences as follows:
N D F = ( m B A G + N D F m B A G ) m S A M P L E × 100
With m B A G being the weight of the empty bag, m B A G + N D F the combined weight of the bag with the sample after NDF digestion, and m S A M P L E the weight of the sample before the NDF digestion.
For the determination of ADF, the samples need to have passed the NDF procedure beforehand. Then, the bags were submerged in an acid detergent solution and processed in the autoclave under the same conditions (110–120 °C for 40–60 min). After digestion, the bags were thoroughly rinsed with hot water to remove detergent residues. The bags were then dried at 105 °C for approximately 8 h until fully dry. Finally, the bags were weighed, and the ADF percentage was calculated using the weight difference from the initial biomass sample.
A D F = ( m B A G + A D F m B A G ) m S A M P L E N D F × 100
With m B A G being the weight of the empty bag, m B A G + A D F the combined weight of the bag with the sample after NDA digestion, and m S A M P L E N D F the weight of the sample before the ADF digestion (NDF residue).
The determination of lignin involved the digestion of the ADF residue using concentrated sulfuric acid, followed by incineration in a muffle furnace to isolate the insoluble lignin fraction. This method required the use of bags containing the ADF residue from the previous analysis. Initially, the ADF residue, already dried and weighed, was placed in an acid-resistant container and covered with sufficient 72% sulfuric acid to ensure complete penetration. The reaction proceeded for about three hours at room temperature, with occasional agitation to ensure uniform digestion. Afterwards, the acid was diluted with distilled water to reduce its concentration to approximately 1%, and the bags were heated in a water bath at 70–80 °C for one hour to hydrolyse the cellulose completely, leaving only lignin in the residue.
Following the sulfuric acid digestion, the bags were washed thoroughly with hot water until the rinse water achieved a near-neutral pH, ensuring that all acid residues were removed to avoid interference in subsequent steps. The washed bags were then dried in an oven at 105 °C for around 8 h and then weighed. Once dried, the bags with the residue were placed in a preheated muffle furnace at 500–600 °C for three to four hours, where the organic material was incinerated, leaving only the ash. The bags were allowed to cool in a desiccator before the ash was weighed.
The percentage of lignin was calculated from:
L I G = ( m B A G + L I G m B A G m A S H ) m S A M P L E A D F × 100
With m B A G being the weight of the empty bag, m B A G + L I G the combined weight of the bag with the sample after sulfuric acid digestion, and m S A M P L E A D F the weight of the sample before the sulfuric acid digestion (ADF residue).
The average cellulose C E L ¯ content was obtained with the subtraction of average lignin from the average ADF:
C E L ¯ = A D F ¯ L I G ¯
The hemicellulose content was calculated from the difference between the averages of NDF and ADF:
H C E L ¯ = N D F ¯ A D F ¯
As the cellulose and hemicellulose are not measured directly but rather obtained from the difference between the two processes, their standard deviations (STDC) must be calculated as follows (assuming A and B are independent events):
S T D C = S T D A 2 + S T D B 2

2.4. Elemental Analysis

The elemental analysis of the biomass considering inorganic mineral content was carried out using the non-destructive FRX technique (X-Ray Fluorescence Spectroscopy). In this technique, a sample is exposed to high-energy X-rays, causing the elements in the sample to emit secondary X-rays (fluorescence) at characteristic wavelengths. These emitted X-rays are then measured to determine the elemental composition of the sample [38]. The FRX analysis (Supplier: Malvern Panalytical B.V, Model: Epsilon 4, Location: Almelo, Netherlands) was performed in both dried (WC = 0%) and ash samples (after combustion). The parameters considered were a film thickness of 3.6 µm, a density of film of 1.38 g/cm3, and a film correction Mylar of 3.6 µm.

3. Results and Discussion

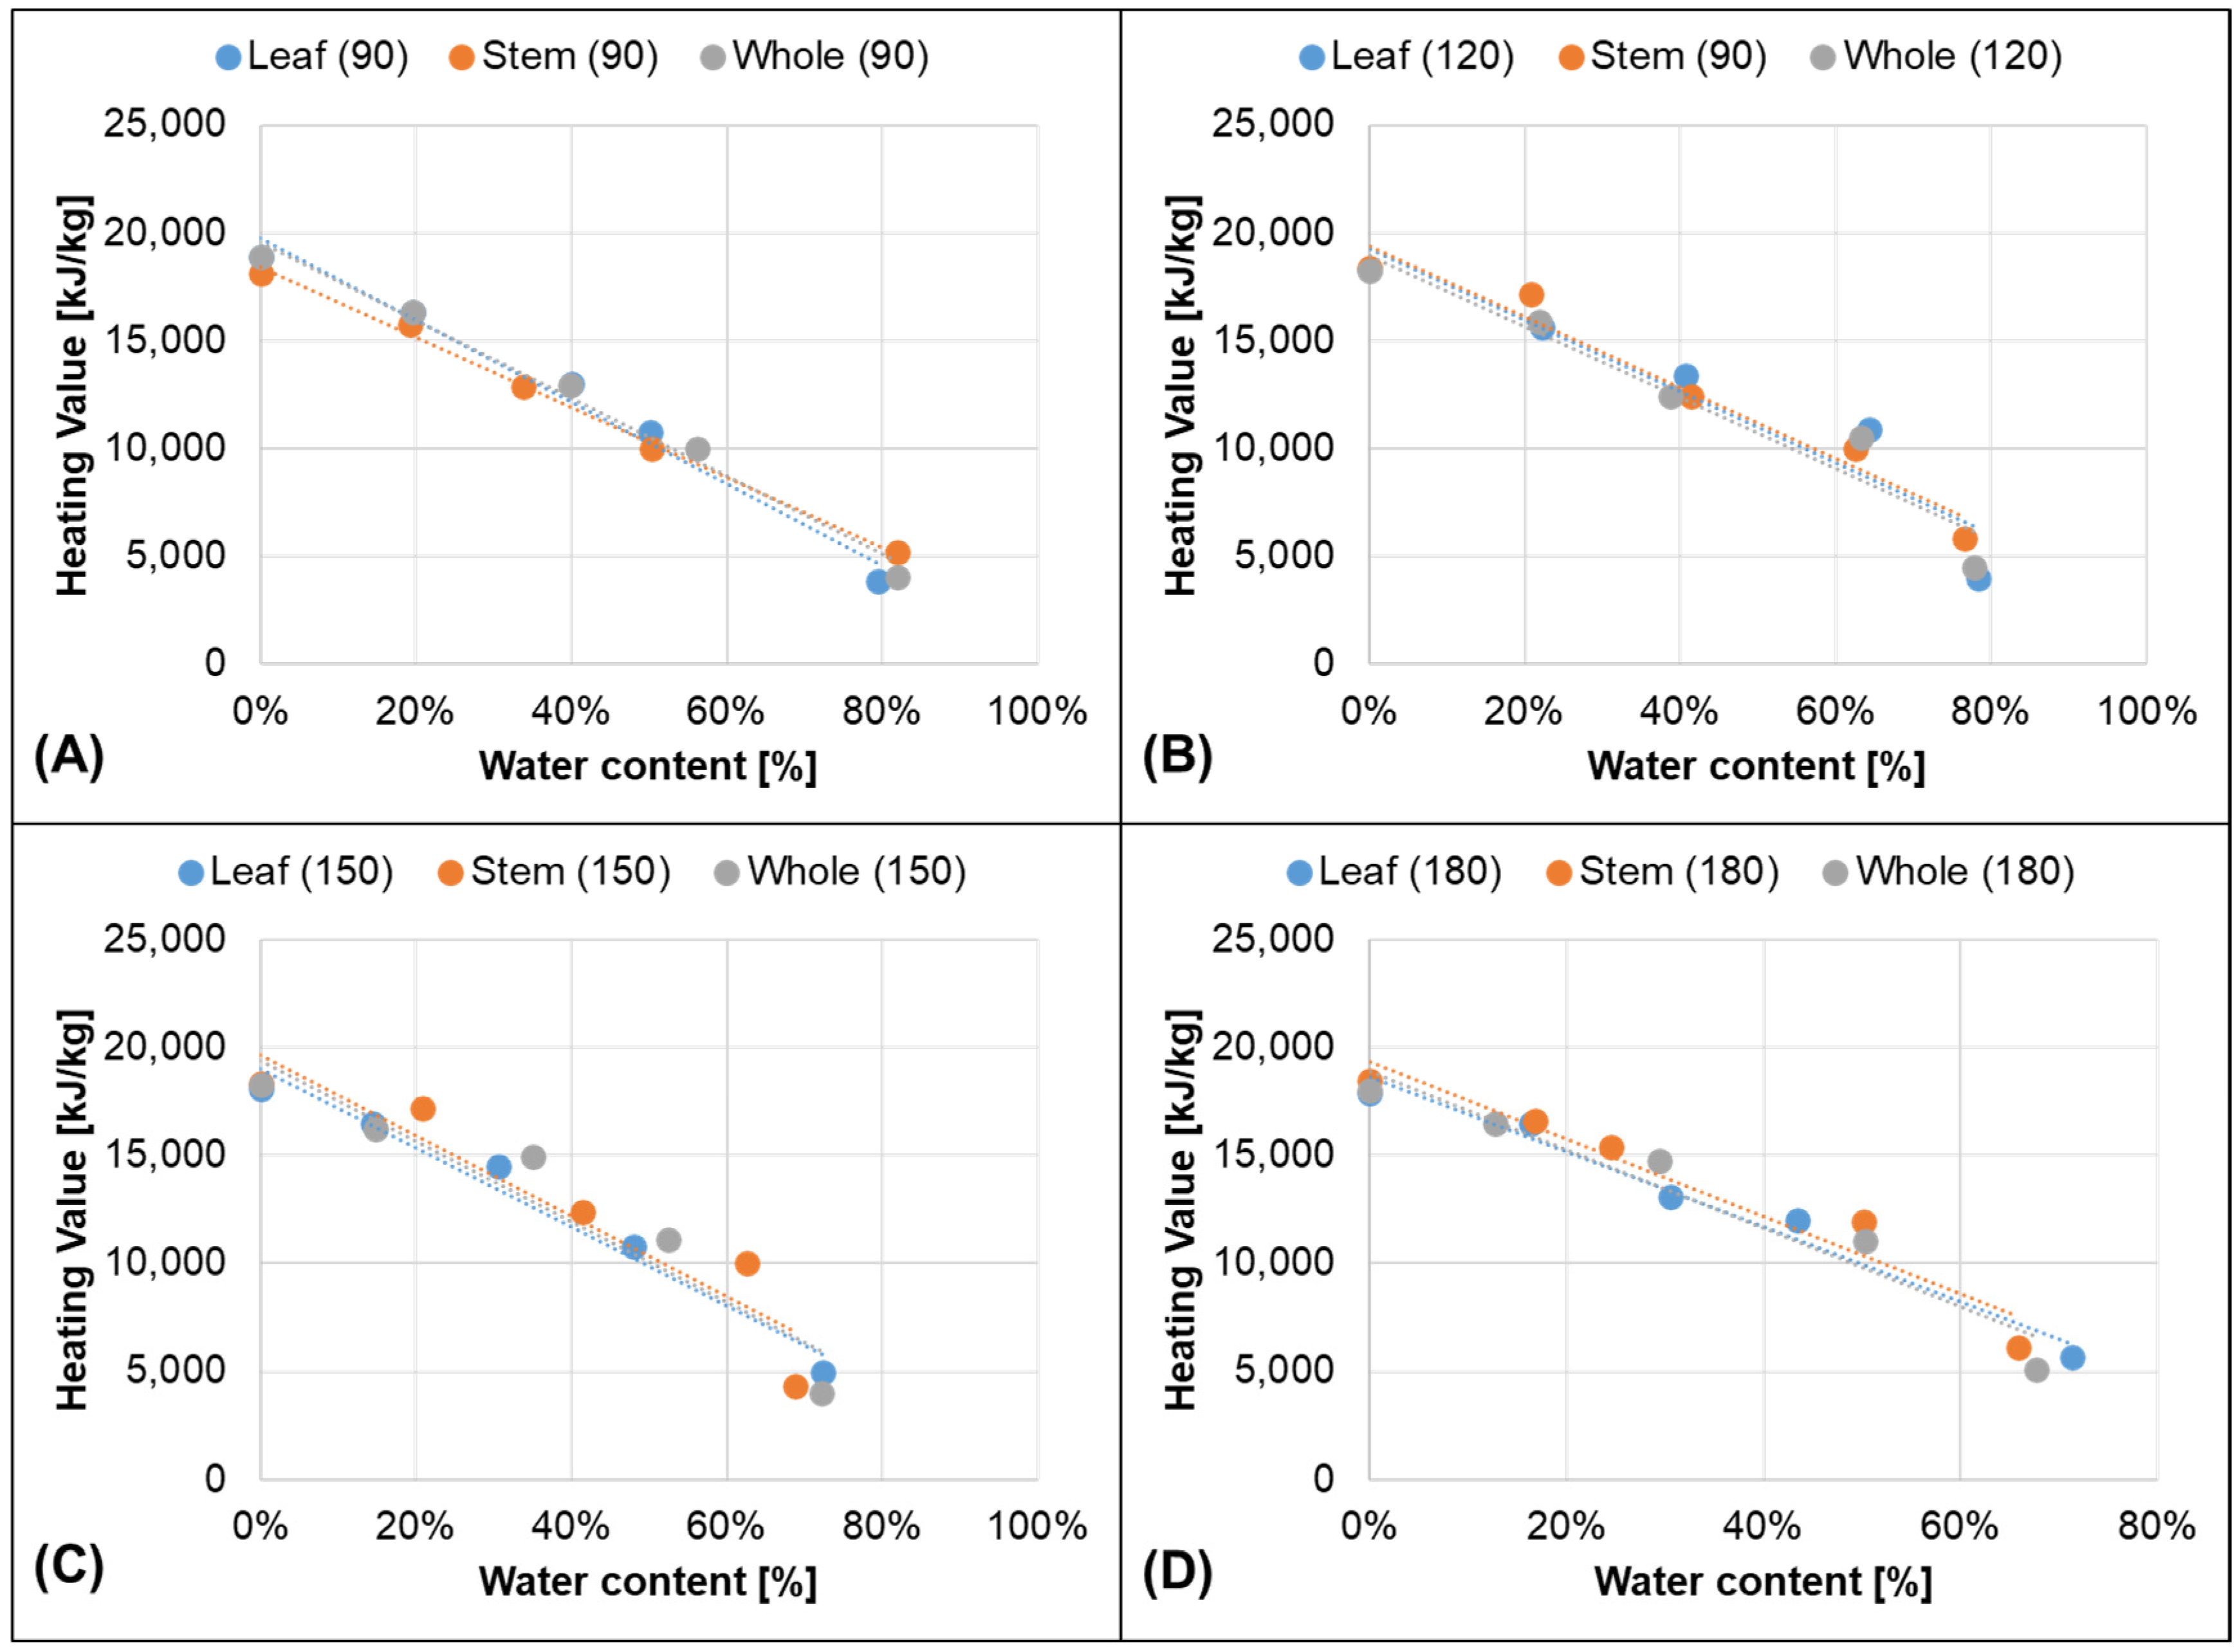
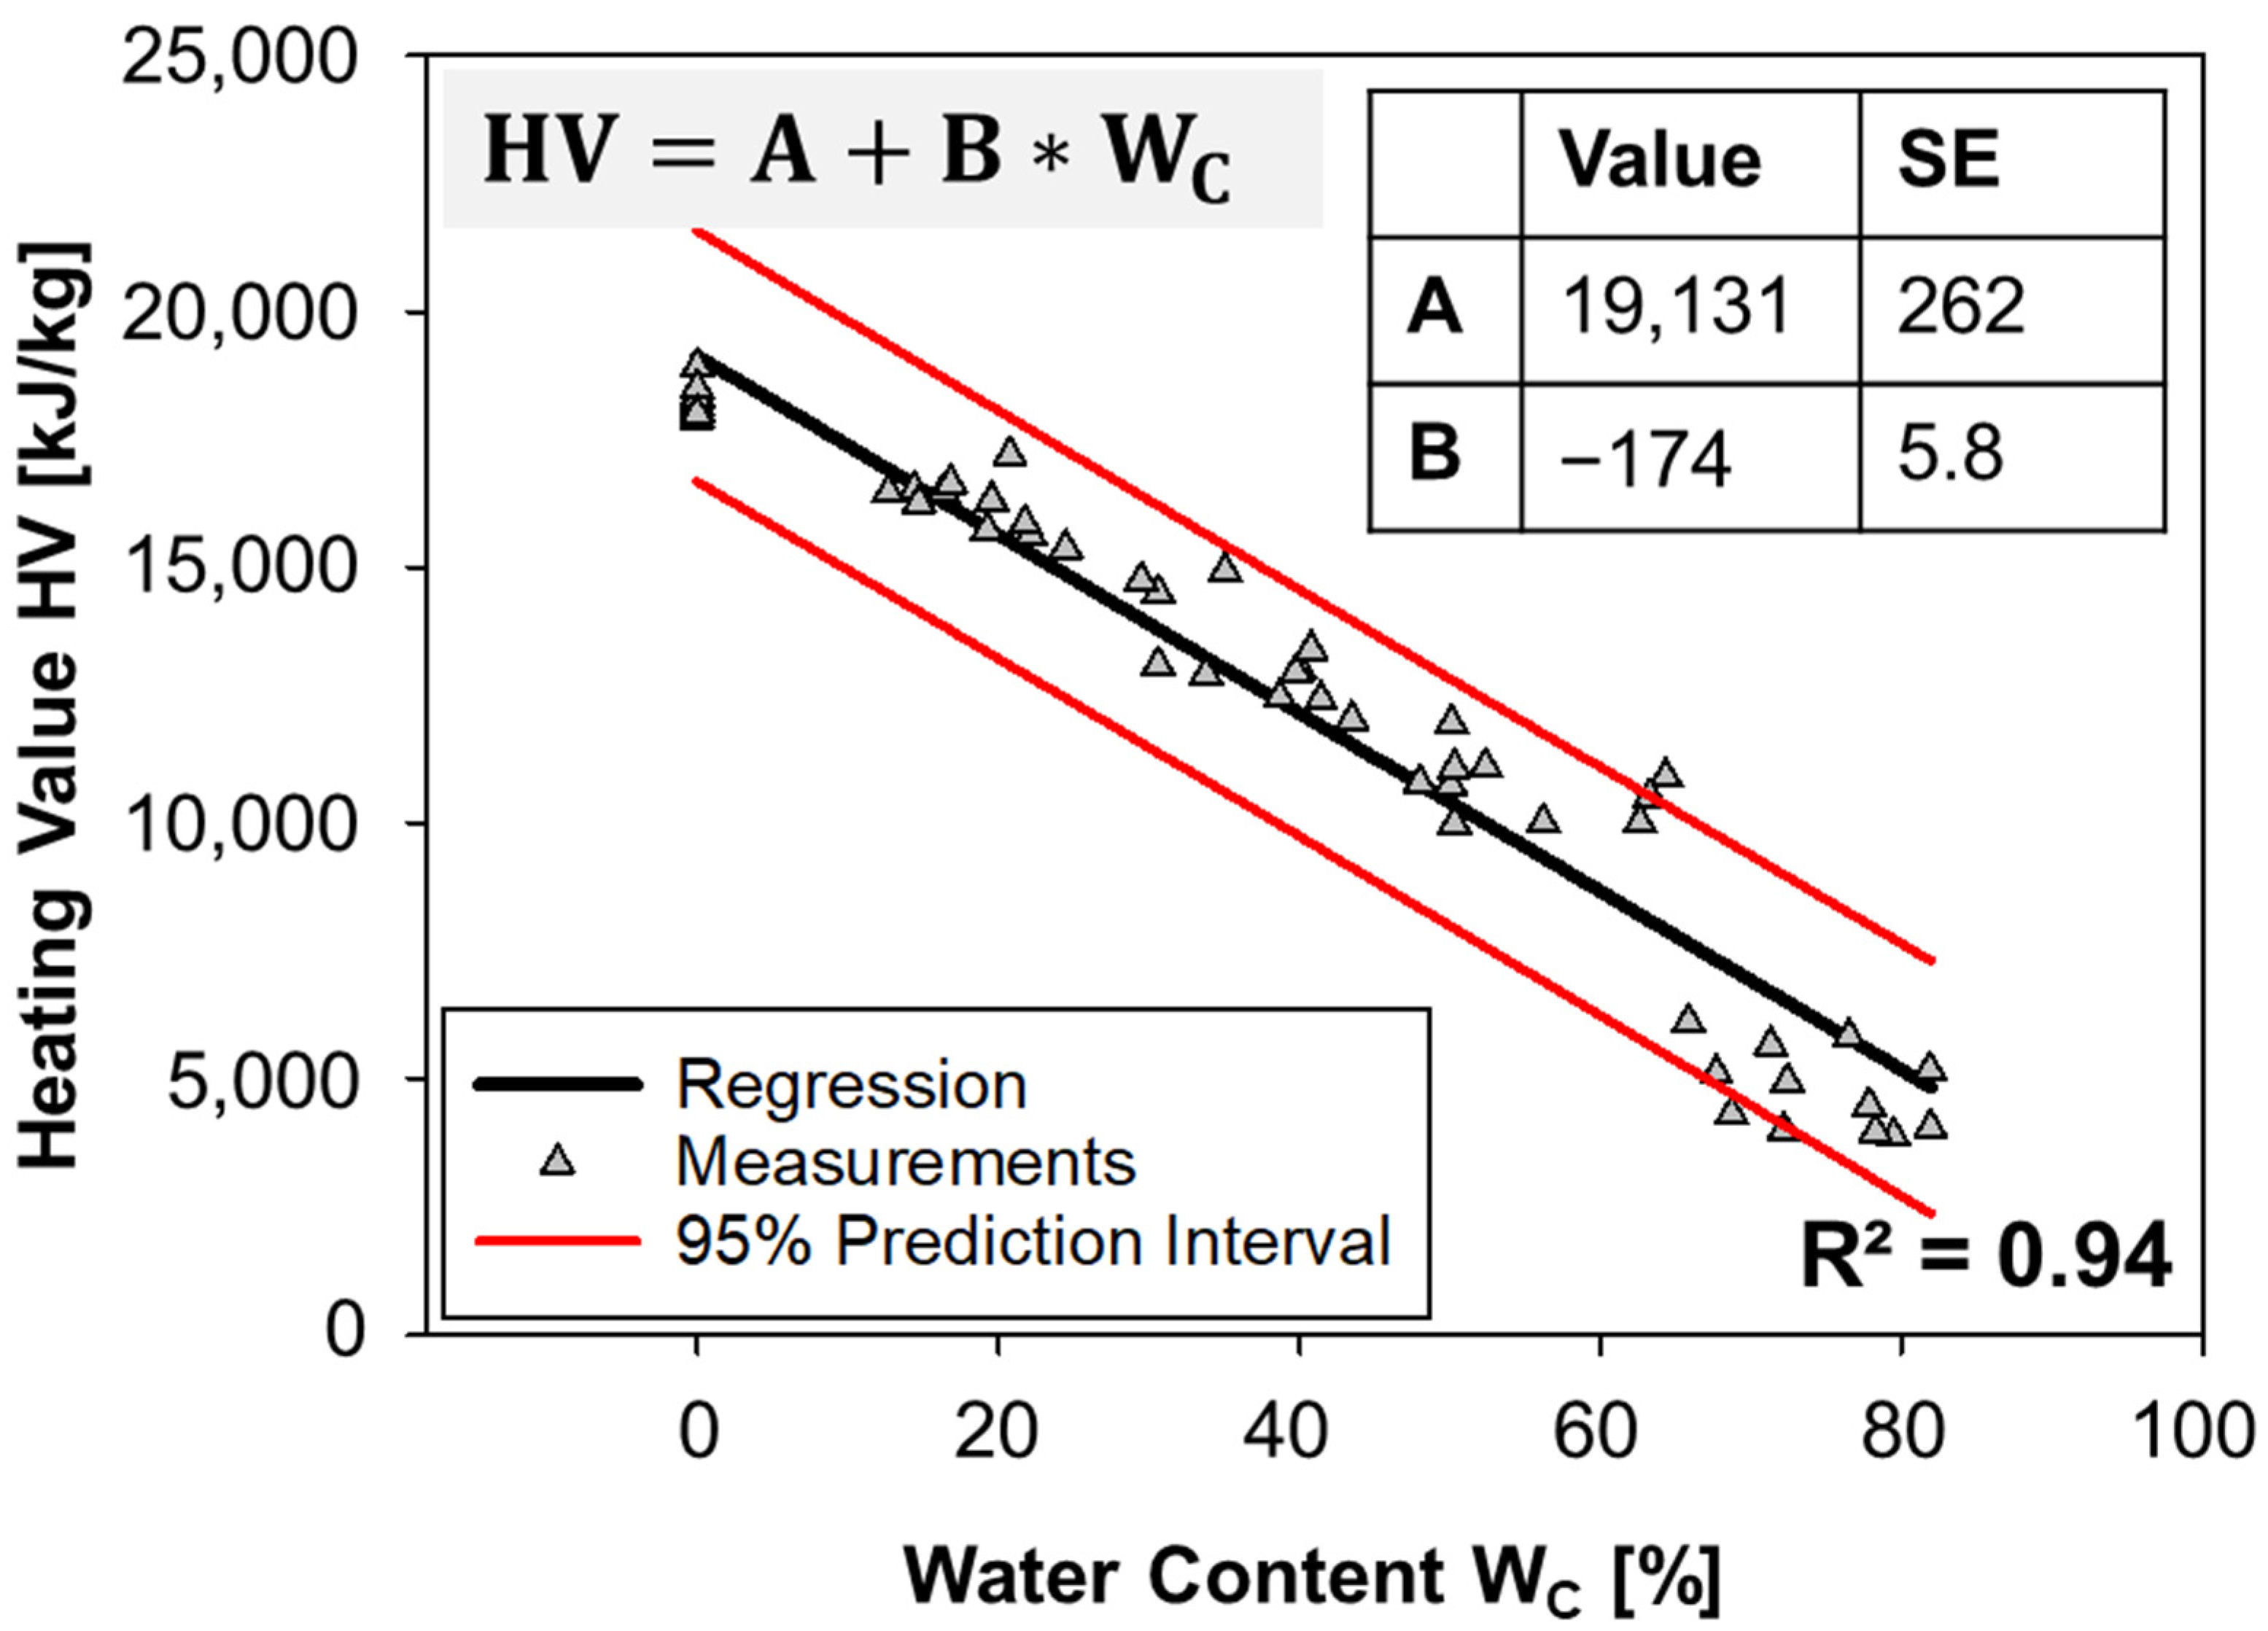
3.1. Proximate and Density Analysis: Effect of Water Content on Density and Heating Value

The first results were related to density as a function of moisture content for different parts of the plant (whole plant, stem, and leaf) and different days of plant maturity (90, 120, 150, and 180 days), as shown in Figure 3. The raw data, including mean values and standard deviation, are given in Table A1 (Appendix A). The stem is the densest part of the plant, while the leaf is the least dense. Logically, the density of the whole plant lies between the density range of the leaf and the stem.
As expected, an increase in water content leads to an increase in density. This increase follows a non-linear growth trend. As seen in Figure 3A, for the stem, both a linear fit (red curve, R2 = 0.8521) and a more suitable quadratic fit (orange curve, R2 = 0.9915) are compared. Since the linear fit was not the most adequate, the other plots (Figure 3B,C) include only the quadratic fit. A non-linear growth trend between bulk density and water content of biomass for energy production was also observed by Kofman and Kent [39]. The respective quadratic functions regarding the relationship between density and water content including the coefficients of determination for different plant parts and ages are given in Table 1.
The impact of the quadratic growth can be demonstrated by taking the variation of density for the stem at 90 days, which varies from 74.21 ± 1.14 g/cm3 for a water content of 0% to 249.89 ± 6.53 g/cm3 for a water content of 81.85 ± 0.60%, corresponding to an increase of 234% in the density (or 3.24 times). A similar behaviour, to a lesser extent, is observed for the leaf at 90 days, which moves from 56.32 ± 2.68 g/cm3 for a water content of 0% to 124.74 ± 7.74 g/cm3 for a water content of 79.46 ± 0.39%, equivalent to an increase of 121% in the density (or 2.21 times).
In this regard, understanding the density of biomass as a function of its water content is critical for logistics and transportation due to its direct impact on costs, efficiency, and infrastructure requirements. Biomass with high water content leads to a low-volume occupation of dry matter that generates energy, which reduces the useful volume stored or transported.
In terms of plant age, considering the dried samples, i.e., water content of 0%, the density of the stem varies from 74.21 ± 1.97 g/cm3 at 90 days to 100.53 ± 3.07 g/cm3 at 180 days, an increase of 35.5%. For the leaf, the density decreases with age, moving from 56.32 ± 2.68 g/cm3 at 90 days to 45.79 ± 2.68 g/cm3 at 180 days, a reduction of 18.7%. As the whole plant is dominated by the stem in weight terms, its density increases with age, going from 58.42 ± 1.97 g/cm3 at 90 days to 72.1 ± 3.00 g/cm3 at 180 days, a growth of 23.4%
The calorific or heating value as a function of water content for different parts of BRS Capiaçu and for different plant ages/maturity are illustrated in Figure 4. The respective linear functions regarding the relationship between heating value and water content, including the coefficients of determination for different plant parts and ages, are given in Table 2. As expected, the heating value decays with increasing water content [40]. This relationship presents a linear behaviour (R2 > 0.88 for all cases). Furthermore, for the same moisture range, the heating values between the different parts of the plant and harvest days appear to be very similar. By considering the calorific values for moisture contents of 0%, it is possible to obtain the high heating value (HVV), as previously determined (see [20]).
The similarity in calorific values across different plant parts and growth stages (age) suggests that water content plays a dominant role in controlling the calorific value. Consequently, a regression model is proposed to predict the heating value as a function of water content. The model provides a significant advantage for future users of BRS Capiaçu, enabling them to estimate thermal energy generation based on a simple moisture measurement.
In Figure 5, the regression model is presented with triangles representing measurements, the black line indicating the regression, and the red lines marking the 95% prediction interval. The model shows strong performance, with 58 out of 60 measurements falling within the 95% prediction interval and an R2 value of 0.94. The standard errors are minimal: 1.36% for the Y-intercept (262 out of 19,131) and 3.3% for the slope (5.8 out of 174). The slope of 174 indicates that each additional percentage point of water content results in a loss of 174 kJ/kg in heating value.

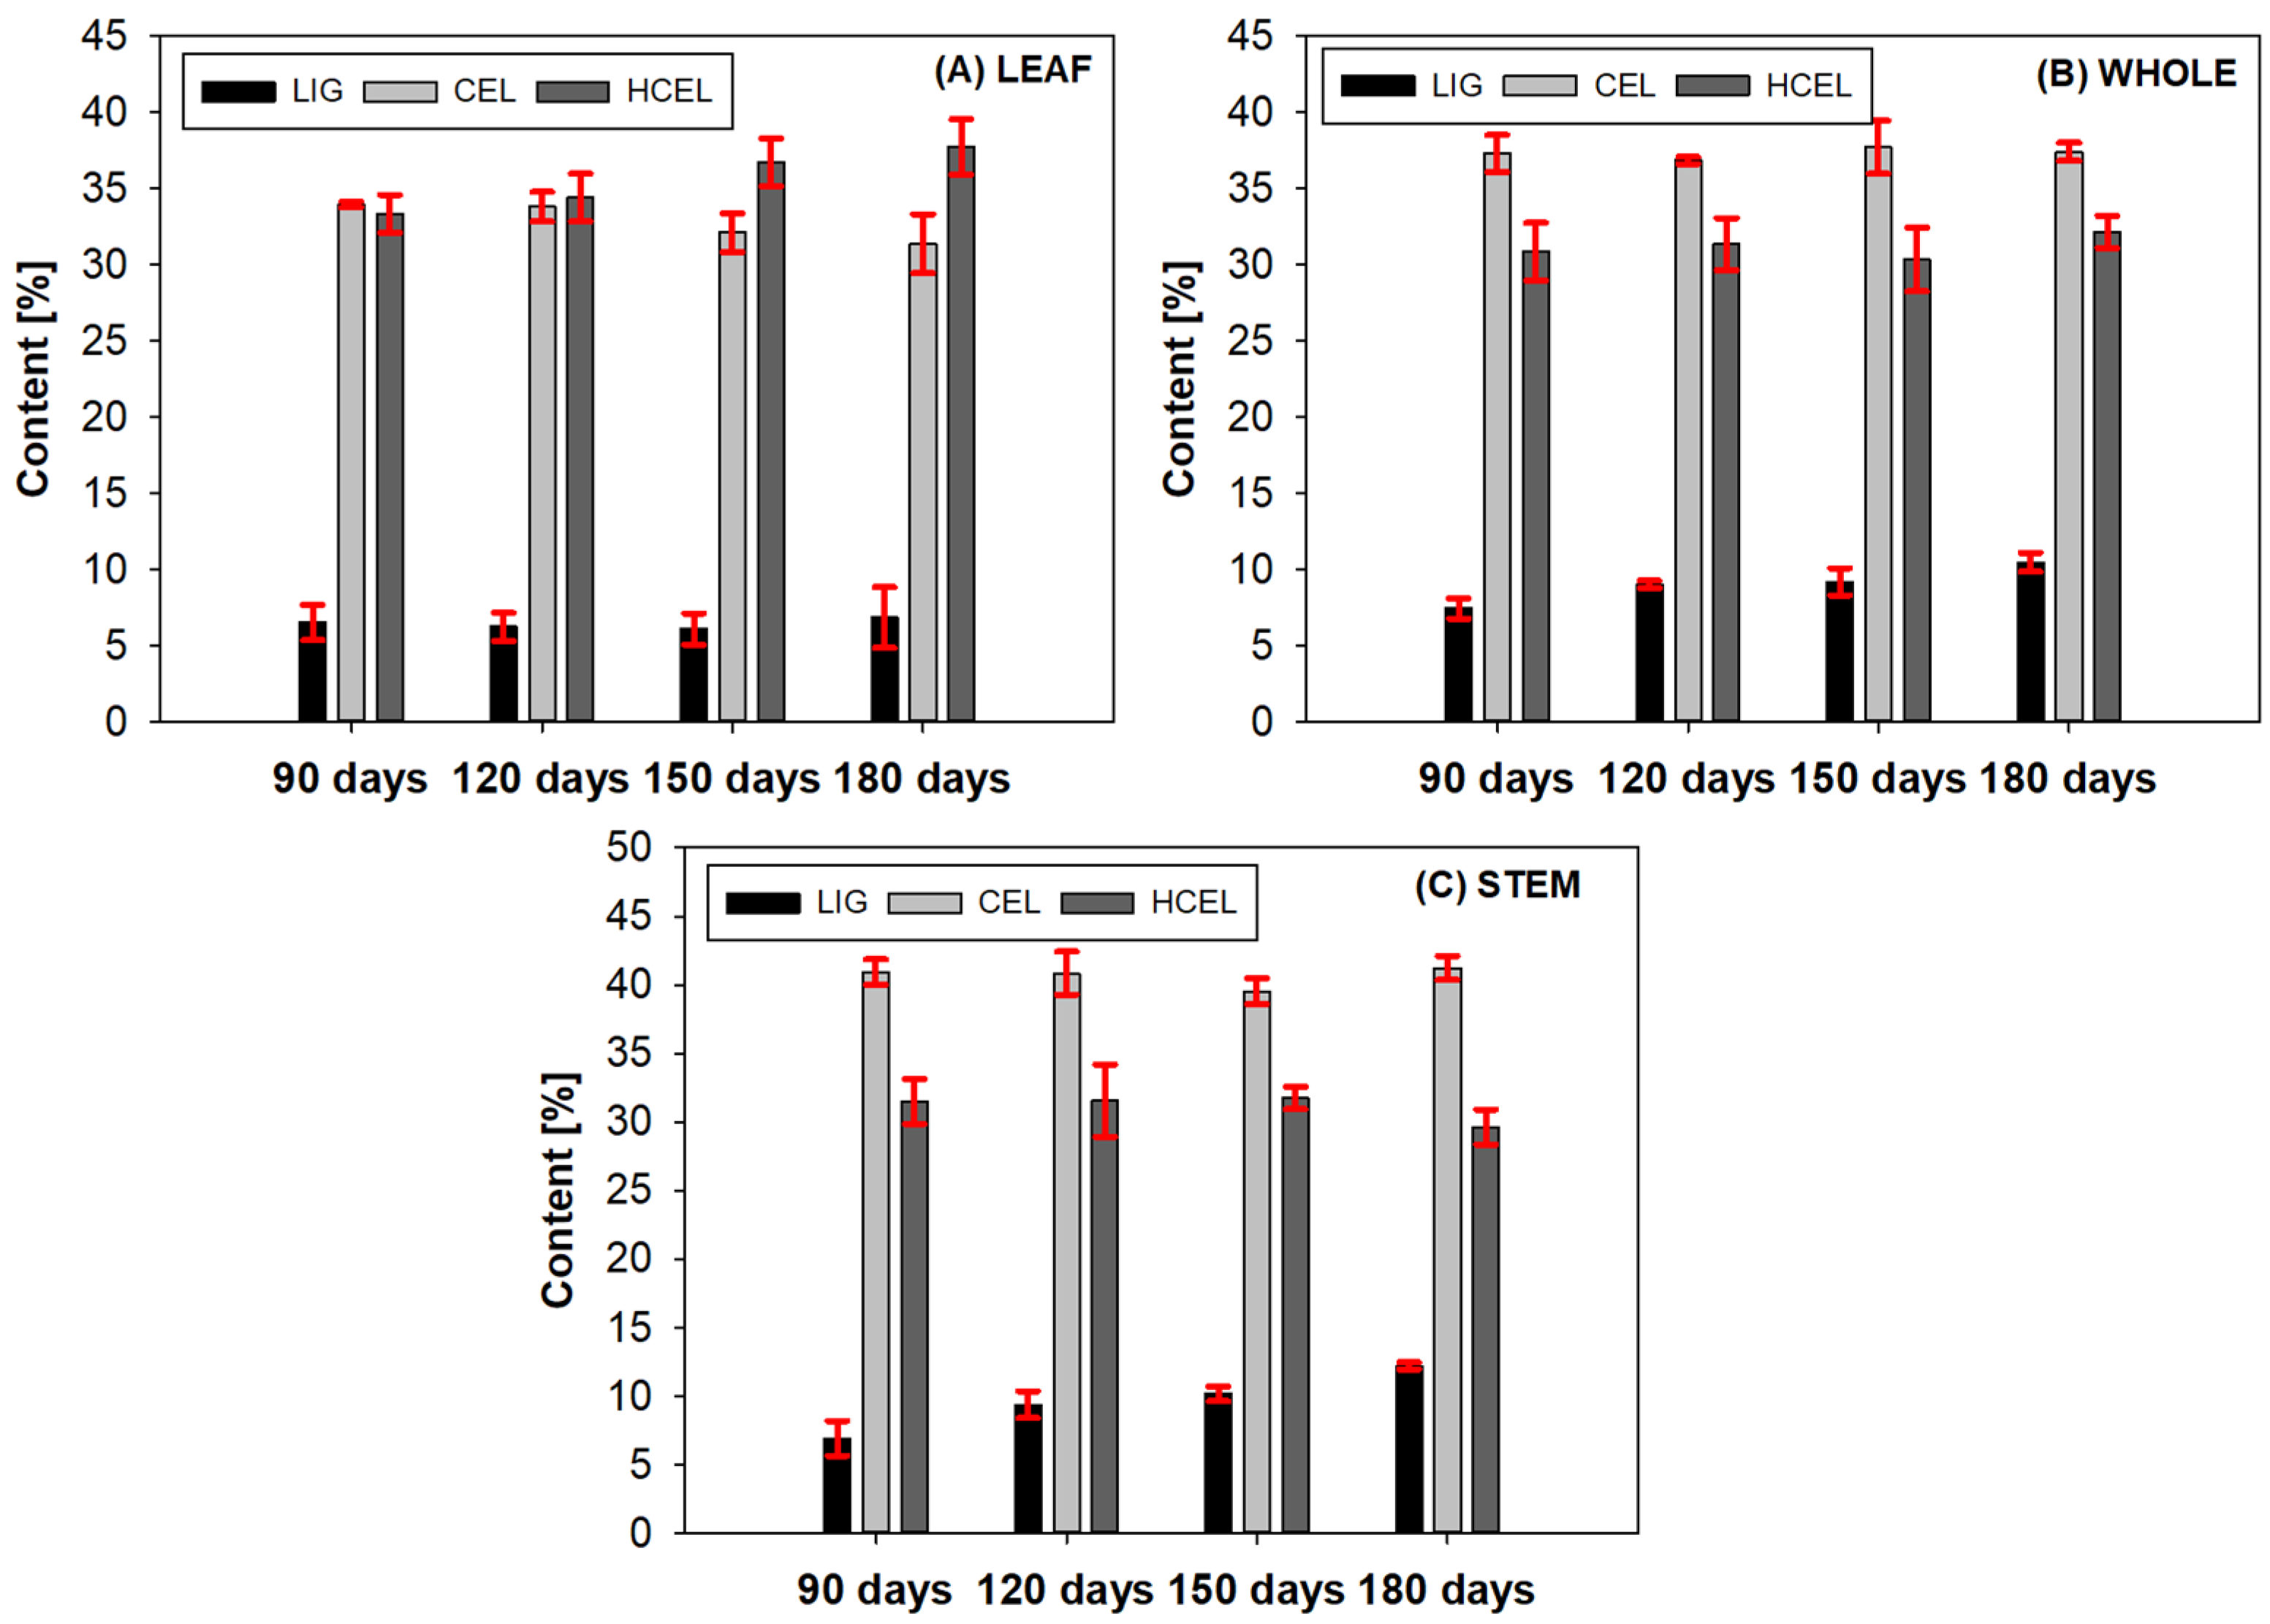
3.2. Chemical Analysis: Effect of Plant Age and Parts on Lignocellulosic Composition

Results from the NDF/ADF technique along with lignin assessment are presented with mean values from five measurements and respective standard deviations are given in Table 3. The data summarise the neutral detergent fibre (NDF), acid detergent fibre (ADF), lignin (LIG), cellulose (CEL), and hemicellulose (HCEL) contents across different plant parts (leaf, stem, and whole plant) and growth stages (90, 120, 150, and 180 days).
NDF and ADF values generally increase with plant maturity, reflecting an accumulation of chemical components as the plant ages [41]. For instance, the NDF of stems increased from 79.30 ± 0.40% at 90 days to 83.05 ± 1.00% at 180 days. Moreover, NDF and ADF values are consistently higher in the stem compared to the leaf and whole plant at all growth stages [42,43], with stems reaching an NDF of 83.05 ± 1.00% and an ADF of 53.42 ± 0.81% at 180 days, respectively, an increase of 3.71 and 5.57% compared to 90 days. This reflects their higher chemical fibre content.
A MANOVA considering a 3 × 4 factorial arrangement was carried out for two different tests, namely Wilks’ lambda and Pillai’s trace, to assess the influence of plant part, plant age, as well as the interaction age*plant part on the ADF, NDF, lignin (LIG) and cellulose (CEL) contents, as shown in Table 4.
Lower values of the Wilks’ lambda indicate a stronger effect of independent variables on the variance of dependent variables. For the plant age, the effect is moderate (0.5674), whilst for the plant part, the effect is much stronger (0.1964). A similar trend is observed for the Pillai’s trace, which is higher for the plant part than for the plant age.
Larger F-values are also an indication of stronger effects, which are higher for the plant part than for the plant age. The interaction part*age term (F = 2.17) is significant, suggesting that age and part have a substantial combined effect. Significant p-values (<0.05) for all predictors and their interaction suggest that all are important in explaining the variance in lignocellulosic composition.
In Figure 6, the main lignocellulosic elements (LIG, CEL, and HCEL) are plotted as a function of plant part and plant age. Lignin content (LIG), a measure of the indigestible component of plant cell walls, is higher in stems compared to leaves at all stages, with a significant increase observed as plants mature, rising from 6.55 ± 1.27% at 90 days to 12.23 ± 0.26% at 180 days. In contrast, cellulose (CEL) content shows smaller variations, such as in stems, where it ranges from 40.85 ± 0.92% at 90 days to 41.19 ± 0.87% at 180 days. Hemicellulose (HCEL) content, which was 33.35 ± 1.26% in leaves at 90 days, exhibits a relatively stable trend with a slight decline in stems at later stages, from 31.49 ± 1.62% at 90 days to 29.63 ± 1.13% at 180 days.
In the current work, for the whole plant at 180 days, the cellulose content measured was 37.41 ± 0.60, which lies among the upper bound values considering the review of Elephant Grass from Johannes et al. [15], where cellulose values varied between 22.60% [44] and 41.80% [45]. Similarly, the lignin content of the whole plant at 180 days was 10.47 ± 0.62%, which lies at a mid-level compared to the literature, where the range varied between 8.80% [46] and 25.00% [45].
Based on the aforementioned benchmark values from the literature, the lignocellulosic content of BRS Capiaçu obtained in this study supports its potential as a biomass feedstock for energy generation through combustion-driven processes, which as an elephant grass has been addressed in the literature (see Marafon et al. [46]). Interestingly, regardless of the plant age and plant part, the measured HVV was very similar (with variation of less than 5%), as seen in Table 3. This means that despite the variations in lignin, cellulose, and hemicellulose, among ages and parts, the energy generated is nearly the same. These results can be supported by the findings of Marafon et al. [46], in which 18 elephant grass varieties showed significant energetic differences when compared to other biomasses, but with little distinction among themselves.

3.3. Elemental Analysis: Ash Behaviour on Potential Challenges During Operation

The FRX measurements reveal significant age-related changes in the mineral composition of elephant grass leaves (see Table 5), as seen in both dried and ash samples. Magnesium oxide (MgO) content increases consistently with age, rising from 0.592% in dried samples at 90 days to 1.039% at 180 days, with an even sharper increase in ash samples, reaching 14.216% at 180 days. Silicon dioxide (SiO2) shows a modest decline in dried samples up to 150 days, followed by a notable rise to 3.207% at 180 days, while in ash samples, SiO2 peaks at 17.994% at 180 days. Potassium oxide (K2O) declines steadily with age, dropping from 5.578% in dried samples and 21.777% in ash samples at 90 days to 1.839% and 8.138% at 180 days, respectively. Calcium oxide (CaO) content increases slightly in dried samples up to 150 days before declining, but consistently rises in ash samples, reaching 17.859% at 180 days. Phosphorus pentoxide (P2O5) shows a general decline in dried samples from 1.168% at 90 days to 0.908% at 180 days, while its trend in ash samples is less consistent. Chloride (Cl) levels decrease steadily with age in both dried and ash samples. Trace elements such as MnO2 and FeO show minor reductions over time in both forms.
Overall, the sum of mineral content in dried samples decreases with age, from 15.336% at 90 days to 12.495% at 180 days, while the ash samples show a significant rise in the sum of mineral content, reaching 67.014% at 180 days. The decrease in the sum of minerals for dried samples with age could be related to the fact that at 90 days, the leaves are younger, more metabolically active, and richer in soluble and mobile minerals (e.g., K). On the other hand, by 180 days, structural growth, and nutrient redistribution reduce the total mineral content in the dried leaves [47,48]. For the ash, however, at 180 days, the accumulation of refractory minerals (e.g., Si, Ca, Mg) and the reduction in ash mass due to complete combustion of organic materials result in a higher concentration of minerals compared to 90 days.
It is important to highlight that the mineral content, although correlated, is not equal to the ash content. For instance, based on the previous results obtained by Beber et al. [20] for BRS Capiaçu, the ash content of the leaf at 180 days was 4.50%, compared to a mineral content of 12.495% of the dried samples for the same age.
The elemental composition of the stem in elephant grass shows notable age-related changes in both dried and ash samples (see Table 6). MgO content in the dried samples decreases with age, from 0.651% at 90 days to 0.366% at 180 days, while the concentration in ash samples fluctuates, peaking at 7.284% at 90 days and declining to 4.966% at 180 days. SiO2 content follows a similar trend, with dried samples showing a steady decline from 1.321% at 90 days to 0.697% at 180 days, while ash samples show a significant decrease from 8.885% to 5.075%. P2O5 also decreases over time in dried samples, from 0.774% at 90 days to 0.493% at 180 days, and in ash samples, from 4.596% to 2.876%. SO4 remains relatively stable in both forms, showing a slight reduction in dried samples and a small increase in ash samples with age.
Chlorine (Cl) content decreases substantially in both dried and ash samples as the plant matures, dropping from 0.506% in dried samples at 90 days to 0.079% at 180 days. K2O decreases with age in both dried and ash samples, with a sharp decline from 1.736% to 0.557% in dried samples and from 9.701% to 4.141% in ash samples. CaO content in dried samples decreases from 1.946% at 90 days to 0.891% at 180 days, while ash samples show a more gradual reduction, from 8.49% to 4.88%. MnO2 and FeO levels exhibit minor fluctuations in both dried and ash samples, with manganese oxide showing a slight increase in ash samples. Trace elements such as titanium (Ti), copper (Cu), and zinc (Zn) exhibit a general decline in dried samples and exhibit more variability in ash samples, with the highest levels observed at 120 days.
The sum of mineral content decreases in dried samples from 8.074% at 90 days to 4.014% at 180 days, while the ash samples show a notable reduction from 42.138% to 24.288%. This trend could be related to nutrient translocation, and dilution from increased lignin content as the plant matures. Stems tend to prioritise structural growth over mineral storage [49]. Unlike leaves, stems tend to not accumulate refractory minerals like silicon, magnesium or calcium, leading to lower mineral concentrations in both dried and ash samples at later stages [48].
As the whole plant is dominated in weight by the stem, there is a decrease in the sum of mineral content from 90 to 180 days, varying from 11.653% to 8.239% for the dried sample, as well as from 56.838% to 44.171% for the ash samples.
In overall terms, the sum of mineral content is higher for the leaf, followed by the whole plant, and by the stem. For instance, at 180 days, the sum of mineral content for the ash was 67.01% for the leaf and 24.28% for the stem. The mineral content of the ash is higher than for the dried sample, as the organic matter is burned during combustion and can be recombined with oxygen to form oxides [50,51]. In this regard, by linking the sum of mineral content of the dried and ash samples using a linear regression, a good correlation (R2 = 0.86) is obtained, as seen in Figure 7.
In operational terms, higher ash contents are undesired [50,51,52], as they can lead to wear of energy-generating components [26], corrosion due to acid formation [53], as well as slagging and fouling [28]. The latter can particularly hinder the efficiency and damage energy systems. In this regard, base-forming oxides are K2O, Na2O, CaO, and MgO, whereas acid-forming oxides are sulphur oxides (SOx), nitrogen oxides (NOx), chlorine (Cl), as well as phosphorous pentoxide (P2O5).
In order to assess ash-related challenges to be faced by energy systems, some predictive indices have been developed [54]. These include the basic-to-acidic compounds ratio B/A, defined as [25]:
B A = F e 2 O 3 + C a O + M g O + N a 2 O + K 2 O S i O 2 + A l 2 O 3 + T i O 2
A higher B/A ratio means a higher slagging tendency of the ash. A low slagging inclination occurs for B/A < 0.5, medium for 0.5 < B/A < 1, high for 1 < B/A < 1.75, and severe for B/A above 1.75.
Bed agglomeration index BAI is obtained from [55]:
B A I = F e 2 O 3 N a 2 O + K 2 O
BAI assesses operational problems during fluidised bed combustion. Bed agglomeration tends to take place for BAI < 0.15.
Fouling index FU is calculated by [33]:
F U = B A ( N a 2 O + K 2 O )
A low fouling tendency is to be expected for FU < 0.6, high for 0.6 < FU < 40, and severed for FU > 40.
Slag viscosity index SR is measured by [25]:
S R = S i O 2 S i O 2 + C a O + M g O + F e 2 O 3 100
Higher SR values lead to high viscosity and low slagging. Low slagging occurs for SR > 72, medium for 65 < SR < 72, and high for SR > 65.
The chlorine index (CI) [54], which is the percentage of chlorine from the biomass, is another relevant factor. The slagging and fouling inclination are low for CI < 0.2, medium for 0.2 < CI < 0.3, high for 0.3 < CI < 0.5, and severe for CI > 0.5.
Considering the FRX measurements from Table 5 (leaf), Table 6 (stem), and Table 7 (whole plant), the aforementioned indices were calculated considering a plant age of 90 (youngest) and 180 days (oldest). The slagging and fouling indices are given in Table 8. For all considerations, the B/A ratio suggests a severe slagging and fouling inclination. For the other indices, the leaf at 90 days presents the worst results, with indices being at a severe level. For 180 days, the indices are improved with the fouling inclination moving from severe to high. The stem presents the best results with the agglomeration and fouling inclination based on BAI and FU being high (severe for the leaf). Specially, at 180 days, the stem presents a low slagging/fouling inclination based on the chlorine index. The whole plant shows better results than the leaf and similar results to the stem. However, at 180 days, the whole plant presents a high slagging/fouling inclination based on the chlorine index (severe for the leaf and low for the stem).
These results can be correlated to the fact that herbaceous biomasses, such as the elephant grass BRS Capiaçu, have significantly higher ash contents than woody biomasses, along with the fact that herbaceous ashes present significantly lower initial melting temperature than ash from woody feedstocks, which lead to higher inclination to slagging and fouling [56].

3.4. Impact of Findings on the Selection of Plant Part and Age

Regarding the use of elephant grass BRS Capiaçu as a feedstock for energy systems based on biomass combustion, the plant is suitable for this application due to its high energetic potential (HVV) and strong agricultural yield, as demonstrated in the previous study [20]. At the same time, the current study provided valuable insights into the decision-making process regarding the selection of plant part and plant age for optimal biomass utilisation.
The proximate analysis demonstrated that the energy generated by the combustion can be considered as dependent only on the water content, regardless of plant part and plant age. To deepen the discussion about the combustion behaviour, the proximate results for BRS Capiaçu from a previous investigation [20] are given in Table 9 considering the stem, the whole plant, and the leaf for the plant ages of 90 and 180 days. From these results, the following observations can be drawn: (i) the lowest water content is observed in the stem at 180 days, measuring 65.84 ± 0.46%; (ii) similarly, the highest volatile content is recorded in the stem at 180 days; and (iii) the ash content of the stem at 180 days is 1.34 ± 0.19%, while that of the whole plant is 2.33 times higher, and that of the leaf is 3.35 times higher. Together, these proximate analysis results support the selection of the stem at 180 days as the optimal part-age pairing for energy production.
Based on the chemical analysis, the lignin content was higher for the stem compared to the other plant parts. The highest lignin content was obtained for the stem at 180 days. Among lignocellulosic components, lignin presents the highest energy generation [57,58].
The elemental analysis of the BRS Capiaçu presented the most defining characteristic regarding the selection of plant part and plant age. The leaf produced a much higher mineral content than the whole plant and the stem, with an increasing value with age. On the other hand, the stem generated a significantly lower mineral content, which decreased with age bottoming out at 180 days. In this regard, a tailored adubation in soil fertilisation can be used in order to reduce the amount of minerals that will lead to lower ash contents [59]. Ash is undesired in energy systems, as it can lead to wear, corrosion, slagging, and fouling. For this reason, some predictive indices for slagging and fouling were calculated for ages of 90 and 180 days, as seen in Table 8. These calculations revealed that the stem at 180 days presents the best indices compared to the leaf and the whole plant. In this regard, utilizing the stem for energy generation enables the use of the leaf as animal feed, which is one of the primary applications of BRS Capiaçu [19].
Another corroborating factor leading to the usage of the stem at 180 days is related to the agricultural productivity of dry mass for the BRS Capiaçu, which peaks at this age (44.10 tonnes/ha) compared to 29.88 tonnes/ha at 90 days [20].
Finally, it is important to highlight that as an herbaceous biomass, which generates more ash content with a low melting temperature [56], energy systems based on BRS Capiaçu should be adapted from traditional oil- and wood-based systems [7,60].

4. Conclusions

In the current work, the effects of plant part (stem, leaf, and whole plant) and age (90, 120, 150, and 180 days) on the proximate, chemical, and elemental characteristics were investigated for the elephant grass cultivar BRS Capiaçu, which was cultivated and harvested in the framework of the investigation.
The results of the proximate analysis revealed a quadratic growth of density as a function of water content across ages and plant parts, which was fit to a model that can be used to predict the weight of the biomass as a function of its water content. This is a relevant parameter for transportation and logistics, with the stem being the densest part, followed by the whole plant and the leaf. In energetical terms, the heating value was shown to be dependent on the water content regardless of plant part and plant age, which was translated to a model that allows the prediction of energetic output solely based on water content.
Chemical analysis showed lignin and cellulose contents at the upper bound to benchmark values found in the literature. The stem presented the highest NDF, ADF, and lignin, which tended to increase with age. Despite varying lignocellulosic contents, the heating values across plant parts and ages showed little variation. Elemental analysis demonstrated that the leaf produced a much higher mineral content, which increased with age, than the other plant parts. Contrarily, the stem generated a significantly lower mineral content, which decreased with age bottoming out at 180 days. This was reflected in the predictive indices for slagging and fouling, which demonstrated that the stem at 180 days was the optimal part and age for energy purposes.

Author Contributions

R.C.B.: Conceptualisation (lead); writing—original draft (equal); methodology (equal); investigation (lead); visualisation (lead); formal analysis (lead); C.d.S.T.: investigation (support); formal analysis (support); V.C.B.: writing—original draft (equal); visualisation (support); formal analysis (support); R.M.N.: supervision (support); writing—original draft (support); methodology (equal); formal analysis (support); E.M.P.: supervision (lead); writing—original draft (support); methodology (equal); formal analysis (support). All authors have read and agreed to the published version of the manuscript.

Funding

V.C. Beber acknowledges the funding from CAPES (Coordenação de Aperfeiçoamento de Pessoal de Nível Superior) through the Science without Borders program under grant BEX 13458/13-2.

Institutional Review Board Statement

Not applicable.

Informed Consent Statement

Not applicable.

Data Availability Statement

Data are available on request from the authors.

Conflicts of Interest

The authors declare no conflicts of interest.

Appendix A

Table A1. Raw data from the measurements of density as a function of water content.
AgeLeafWholeStem
Water ContentDensityWater ContentDensityWater ContentDensity
90 days79.46 ± 0.39124.74 ± 7.7481.91 ± 0.58177.79 ± 4.3881.85 ± 0.60247.89 ± 6.53
90 days50.04 ± 1.5370.53 ± 3.0756.20 ± 1.60100.00 ± 1.6650.30 ± 1.13123.68 ± 2.35
90 days40.03 ± 1.5165.79 ± 1.6639.76 ± 3.3071.05 ± 1.6633.79 ± 1.95104.21 ± 2.68
90 days19.56 ± 0.6460.32 ± 1.7219.54 ± 1.2364.74 ± 1.2919.28 ± 0.4488.42 ± 1.29
90 days0.00 ± 0.0056.32 ± 2.680.00 ± 0.0058.42 ± 1.970.00 ± 0.0074.21 ± 1.97
120 days78.26 ± 0.55128.95 ± 3.7277.84 ± 0.95184.53 ± 1.7876.49 ± 1.14263.16 ± 1.45
120 days64.32 ± 1.8381.37 ± 1.7263.29 ± 1.45116.84 ± 2.8662.60 ± 1.79180.84 ± 2.57
120 days40.77 ± 0.5756.84 ± 1.6338.67 ± 1.5882.32 ± 1.4041.40 ± 1.73106.84 ± 1.45
120 days22.13 ± 2.1453.68 ± 1.0021.76 ± 0.5368.95 ± 1.7920.76 ± 0.26100.00 ± 1.94
120 days0.00 ± 0.0049.47 ± 1.970.00 ± 0.0058.95 ± 2.680.00 ± 0.0087.37 ± 1.97
150 days72.42 ± 2.66111.58 ± 4.2872.14 ± 1.65151.05 ± 6.3668.70 ± 0.78217.37 ± 7.55
150 days48.01 ± 1.1182.11 ± 1.9752.37 ± 0.34113.47 ± 1.7862.60 ± 1.79163.89 ± 1.18
150 days30.61 ± 1.7164.21 ± 2.1135.05 ± 4.69100.00 ± 1.6641.40 ± 1.73127.89 ± 2.11
150 days14.41 ± 0.2957.89 ± 1.6614.73 ± 1.7683.68 ± 1.9720.76 ± 0.26112.95 ± 1.72
150 days0.00 ± 0.0051.05 ± 2.680.00 ± 0.0051.05 ± 2.680.00 ± 0.0096.84 ± 3.07
180 days71.31 ± 1.13120.00 ± 2.1167.70 ± 0.96151.89 ± 3.5265.85 ± 1.02216.84 ± 4.88
180 days43.49 ± 0.3985.79 ± 2.1150.30 ± 0.71108.53 ± 2.1850.11 ± 0.33156.32 ± 2.68
180 days30.60 ± 0.2662.11 ± 1.2929.49 ± 0.3188.95 ± 2.2024.49 ± 0.30128.42 ± 1.97
180 days16.32 ± 0.3851.05 ± 1.2912.71 ± 0.1166.84 ± 3.0016.83 ± 0.34115.26 ± 1.97
180 days0.00 ± 0.0045.79 ± 2.680.00 ± 0.0072.11 ± 3.000.00 ± 0.00100.53 ± 3.07

References

  1. Mignogna, D.; Szabó, M.; Ceci, P.; Avino, P. Biomass Energy and Biofuels: Perspective, Potentials, and Challenges in the Energy Transition. Sustainability 2024, 16, 7036. [Google Scholar] [CrossRef]
  2. Owusu, P.A.; Asumadu-Sarkodie, S. A review of renewable energy sources, sustainability issues and climate change mitigation. Cogent Eng. 2016, 3, 1167990. [Google Scholar] [CrossRef]
  3. Paletto, A.; Bernardi, S.; Pieratti, E.; Teston, F.; Romagnoli, M. Assessment of environmental impact of biomass power plants to increase the social acceptance of renewable energy technologies. Heliyon 2019, 5, e02070. [Google Scholar] [CrossRef]
  4. Janiszewska, D.; Ossowska, L. The Role of Agricultural Biomass as a Renewable Energy Source in European Union Countries. Energies 2022, 15, 6756. [Google Scholar] [CrossRef]
  5. Mitchell, R.B.; Schmer, M.R.; Anderson, W.F.; Jin, V.; Balkcom, K.S.; Kiniry, J.; Coffin, A.; White, P. Dedicated Energy Crops and Crop Residues for Bioenergy Feedstocks in the Central and Eastern USA. Bioenerg. Res. 2016, 9, 384–398. [Google Scholar] [CrossRef]
  6. Lewandrowski, J.; Rosenfeld, J.; Pape, D.; Hendrickson, T.; Jaglo, K.; Moffroid, K. The greenhouse gas benefits of corn ethanol—Assessing recent evidence. Biofuels 2020, 11, 361–375. [Google Scholar] [CrossRef]
  7. Alves, F.G.d.S.; Silva, S.F.; Santos, F.N.d.S.; Carneiro, M.S.d.S. Elephant grass: A bioenergetic resource. Nucleus Animal. 2018, 10, 117–130. [Google Scholar] [CrossRef]
  8. Campos, B.B.; Diniz, R.H.S.; Silveira, F.A.d.; Ribeiro Júnior, J.I.; Fietto, L.G.; Machado, J.C.; Silveira, W.B.d. Elephant grass (Pennisetum purpureum Schumach) is a promising feedstock for ethanol production by the thermotolerant yeast Kluyveromyces marxianus CCT 7735. Braz. J. Chem. Eng. 2019, 36, 43–49. [Google Scholar] [CrossRef]
  9. Efetobor, U.J.; Ikpeseni, S.C.; Sada, S.O. Determination of proximate, ultimate and structural properties of elephant grass as biomass material for bio-oil production. J. Appl. Sci. Environ. Manag. 2022, 26, 1903–1907. [Google Scholar] [CrossRef]
  10. Strezov, V.; Evans, T.J.; Hayman, C. Thermal conversion of elephant grass (Pennisetum purpureum Schum) to bio-gas, bio-oil and charcoal. Bioresour. Technol. 2008, 99, 8394–8399. [Google Scholar] [CrossRef]
  11. de Conto, D.; Silvestre, W.P.; Baldasso, C.; Godinho, M. Performance of rotary kiln reactor for the elephant grass pyrolysis. Bioresour. Technol. 2016, 218, 153–160. [Google Scholar] [CrossRef]
  12. Morais, R.F.; Morais, C.S.B.; de Morais, L.F.; Almeida, J.C.C. Energy balance of elephant grass biomass for power generation by direct biomass combustion. Afr. J. Biotechnol. 2018, 17, 405–410. [Google Scholar] [CrossRef]
  13. Rocha, J.R.d.A.S.d.C.; Machado, J.C.; Carneiro, P.C.S.; Da Carneiro, J.C.; Resende, M.D.V.; Pereira, A.V.; Carneiro, J.E.d.S. Elephant grass ecotypes for bioenergy production via direct combustion of biomass. Ind. Crops Prod. 2017, 95, 27–32. [Google Scholar] [CrossRef]
  14. Ana, K.F.V.; Da Tatiane, C.B.; Rogerio, F.D.; Janeo, E.A.F.; Roberta, S.N.d.L.; Rafael, S.F.; Drieli, A.R.; Da Erik, S.O.; Da Bruna, R.S.M.; Geovana, C.E.; et al. Production potential and chemical composition of elephant grass (Pennisetum purpureum Schum.) at different ages for energy purposes. Afr. J. Biotechnol. 2017, 16, 1428–1433. [Google Scholar] [CrossRef]
  15. Johannes, L.P.; Minh, T.T.N.; Xuan, T.D. Elephant Grass (Pennisetum purpureum): A Bioenergy Resource Overview. Biomass 2024, 4, 625–646. [Google Scholar] [CrossRef]
  16. Alonso Pippo, W.; Alves, A. Corn Ethanol in Brazil: Analyzing the Prospect of Becoming a Widespread Practice in South America. Sugar Tech 2022, 24, 857–869. [Google Scholar] [CrossRef]
  17. Silva, A.L.d.; Castañeda-Ayarza, J.A. Macro-environment analysis of the corn ethanol fuel development in Brazil. Renew. Sustain. Energy Rev. 2021, 135, 110387. [Google Scholar] [CrossRef]
  18. Freitas, R.S.; Da Barbé, T.C.; Daher, R.F.; Vidal, A.K.F.; Stida, W.F.; Da Silva, V.B.; Da Menezes, B.R.S.; Pereira, A.V. Chemical Composition and Energy Yield of Elephant-Grass Biomass as Function of Five Different Production Ages. JAS 2017, 10, 343. [Google Scholar] [CrossRef]
  19. Pereira, A.V.; Lédo, F.J.d.S.; Machado, J.C. BRS Kurumi and BRS Capiaçu-New elephant grass cultivars for grazing and cut-and-carry system. Crop Breed. Appl. Biotechnol. 2017, 17, 59–62. [Google Scholar] [CrossRef]
  20. Beber, R.C.; Da Turini, C.S.; Beber, V.C.; Nogueira, R.M.; Pires, E.M. Elephant Grass Cultivar BRS Capiaçu as Sustainable Biomass for Energy Generation in the Amazon Biome of the Mato Grosso State. Energies 2024, 17, 5409. [Google Scholar] [CrossRef]
  21. Huang, S.; Liu, J.; Chen, S.; Wang, J.; Chen, Z.; Evrendilek, F.; Chen, T.; Huang, W.; Xie, W.; Sun, S. Converting and valorizing heavy metal-laden post-harvest hyperaccumulator (Pteris vittate L.) into biofuel via acid-pretreated pyrolysis and gasification. Chem. Eng. J. 2023, 468, 143490. [Google Scholar] [CrossRef]
  22. Wu, X.; Wei, Z.; Liu, J.; Chen, Z.; Evrendilek, F.; Huang, W. Oxy-fuel and air combustion performances and gas-to-ash products of aboveground and belowground biomass of Sedum alfredii Hance. Chem. Eng. J. 2021, 422, 130312. [Google Scholar] [CrossRef]
  23. Clauser, N.M.; Felissia, F.E.; Area, M.C.; Vallejos, M.E. A framework for the design and analysis of integrated multi-product biorefineries from agricultural and forestry wastes. Renew. Sustain. Energy Rev. 2021, 139, 110687. [Google Scholar] [CrossRef]
  24. Singh, Y.D.; Mahanta, P.; Bora, U. Comprehensive characterization of lignocellulosic biomass through proximate, ultimate and compositional analysis for bioenergy production. Renew. Energy 2017, 103, 490–500. [Google Scholar] [CrossRef]
  25. Rizvi, T.; Xing, P.; Pourkashanian, M.; Darvell, L.I.; Jones, J.M.; Nimmo, W. Prediction of biomass ash fusion behaviour by the use of detailed characterisation methods coupled with thermodynamic analysis. Fuel 2015, 141, 275–284. [Google Scholar] [CrossRef]
  26. Lacey, J.A.; Aston, J.E.; Thompson, V.S. Wear Properties of Ash Minerals in Biomass. Front. Energy Res. 2018, 6, 119. [Google Scholar] [CrossRef]
  27. Antunes, R.A.; de Oliveira, M.C.L. Corrosion in biomass combustion: A materials selection analysis and its interaction with corrosion mechanisms and mitigation strategies. Corros. Sci. 2013, 76, 6–26. [Google Scholar] [CrossRef]
  28. Lachman, J.; Baláš, M.; Lisý, M.; Lisá, H.; Milčák, P.; Elbl, P. An overview of slagging and fouling indicators and their applicability to biomass fuels. Fuel Process. Technol. 2021, 217, 106804. [Google Scholar] [CrossRef]
  29. Ardila, Y.C.; Figueroa, J.E.J.; Maciel, M.R.W. Mathematical models for predicting the higher heating value and ultimate analysis of biomass. Ind. Crops Prod. 2024, 208, 117777. [Google Scholar] [CrossRef]
  30. Kujawska, J.; Kulisz, M.; Oleszczuk, P.; Cel, W. Improved Prediction of the Higher Heating Value of Biomass Using an Artificial Neural Network Model Based on the Selection of Input Parameters. Energies 2023, 16, 4162. [Google Scholar] [CrossRef]
  31. Vargas-Moreno, J.M.; Callejón-Ferre, A.J.; Pérez-Alonso, J.; Velázquez-Martí, B. A review of the mathematical models for predicting the heating value of biomass materials. Renew. Sustain. Energy Rev. 2012, 16, 3065–3083. [Google Scholar] [CrossRef]
  32. Park, S.; Kim, S.Y.; Kim, H.E.; Oh, K.C.; Kim, S.J.; La Cho, H.; Jeon, Y.K.; Kim, D. Calorific Value Prediction Model Using Structure Composition of Heat-Treated Lignocellulosic Biomass. Energies 2023, 16, 7896. [Google Scholar] [CrossRef]
  33. Garcia-Maraver, A.; Mata-Sanchez, J.; Carpio, M.; Perez-Jimenez, J.A. Critical review of predictive coefficients for biomass ash deposition tendency. J. Energy Inst. 2017, 90, 214–228. [Google Scholar] [CrossRef]
  34. Nhuchhen, D.R. Prediction of carbon, hydrogen, and oxygen compositions of raw and torrefied biomass using proximate analysis. Fuel 2016, 180, 348–356. [Google Scholar] [CrossRef]
  35. National Institute of Metereology. Metereological Historical Data for 2022-City: Sao José do Rio Claro, State of Mato Grosso. Available online: https://portal.inmet.gov.br/dadoshistoricos (accessed on 12 August 2024).
  36. ABNT. NBR 8633: Carvão Vegetal-Determinação do Poder Calorífico (Charcoal-Determination of Calorific Value); Associação Brasileira de Normas Técnicas: São Paulo, SP, Brazil, 1983. [Google Scholar]
  37. van Soest, P.J.; Robertson, J.B.; Lewis, B.A. Methods for dietary fiber, neutral detergent fiber, and nonstarch polysaccharides in relation to animal nutrition. J. Dairy Sci. 1991, 74, 3583–3597. [Google Scholar] [CrossRef]
  38. Xing, P.; Mason, P.E.; Chilton, S.; Lloyd, S.; Jones, J.M.; Williams, A.; Nimmo, W.; Pourkashanian, M. A comparative assessment of biomass ash preparation methods using X-ray fluorescence and wet chemical analysis. Fuel 2016, 182, 161–165. [Google Scholar] [CrossRef]
  39. Kofman, P.; Kent, T. Harvesting and Processing Forest Biomass for Energy Production in Ireland: The ForestEnergy Programme; COFORT: Dublin, Ireland, 2007. [Google Scholar]
  40. Ungureanu, N.; Vladut, V.; Voicu, G.; Dinca, M.-N.; Zabava, B.-S. Influence of biomass moisture content on pellet properties-review. In Proceedings of the 17th International Scientific Conference Engineering for Rural Development, Jelgava, Latvia, 23–25 May 2018; Latvia University of Agriculture: Jelgava, Latvia, 2018. [Google Scholar]
  41. Ismail, A.B.O.; Sulaiman, Y.R.; Ahmed, F.A.; Ali, H.A.M. Effect of Stages of Maturity on Nutritive Value of Some Range Herbage Species in Low-Rainfall Woodland Savanna Southern Darfur, Sudan. Open J. Anim. Sci. 2015, 5, 1–8. [Google Scholar] [CrossRef]
  42. Mganga, K.Z.; Ndathi, A.J.N.; Wambua, S.M.; Bosma, L.; Kaindi, E.M.; Kioko, T.; Kadenyi, N.; Musyoki, G.K.; van Steenbergen, F.; Musimba, N.K.R. Forage value of vegetative leaf and stem biomass fractions of selected grasses indigenous to African rangelands. Anim. Prod. Sci. 2021, 61, 1476–1483. [Google Scholar] [CrossRef]
  43. Okumus, O.; Ciftci, B.; Uzun, S.; Kaplan, M. Determination of feed quality parameters of leaves and stems of different alfalfa genotypes. Curr. Trends Nat. Sci. 2021, 10, 118–121. [Google Scholar] [CrossRef]
  44. Egwu, U. Improvement of biomethane potential of Elephant grass (Napier grass, Pennisetum purpureum Schum) by addition of biomass ash and ash-extracts as supplements. Bioresour. Technol. Rep. 2021, 15, 100760. [Google Scholar] [CrossRef]
  45. Tsai, M.-H.; Lee, W.-C.; Kuan, W.-C.; Sirisansaneeyakul, S.; Savarajara, A. Evaluation of different pretreatments of Napier grass for enzymatic saccharification and ethanol production. Energy Sci. Eng. 2018, 6, 683–692. [Google Scholar] [CrossRef]
  46. Marafon, A.C.; Amaral, A.F.C.; Machado, J.C.; Da Carneiro, J.C.; Bierhals, A.N.; Guimarães, V.d.S. Chemical composition and calorific value of elephant grass varieties and other feedstocks intended for direct combustion. Grassl. Sci. 2021, 67, 241–249. [Google Scholar] [CrossRef]
  47. Flyman, M.V.; Afolayan, A.J. Effect of plant maturity on the mineral content of the leaves of Momordica balsamina L. and Vigna unguiculata subsp. Sesquipedalis (L.). Verdc. J. Food Qual. 2008, 31, 661–671. [Google Scholar] [CrossRef]
  48. Maillard, A.; Diquélou, S.; Billard, V.; Laîné, P.; Garnica, M.; Prudent, M.; Garcia-Mina, J.-M.; Yvin, J.-C.; Ourry, A. Leaf mineral nutrient remobilization during leaf senescence and modulation by nutrient deficiency. Front. Plant Sci. 2015, 6, 317. [Google Scholar] [CrossRef] [PubMed]
  49. Marschner, P. Marschner’s Mineral Nutrition of Higher Plants; Elsevier: Amsterdam, The Netherlands, 2012; ISBN 9780123849052. [Google Scholar]
  50. Shao, Y.; Wang, J.; Preto, F.; Zhu, J.; Xu, C. Ash Deposition in Biomass Combustion or Co-Firing for Power/Heat Generation. Energies 2012, 5, 5171–5189. [Google Scholar] [CrossRef]
  51. Vassilev, S.V.; Vassileva, C.G.; Song, Y.-C.; Li, W.-Y.; Feng, J. Ash contents and ash-forming elements of biomass and their significance for solid biofuel combustion. Fuel 2017, 208, 377–409. [Google Scholar] [CrossRef]
  52. Li, F.; Yu, B.; Zhao, W.; Wang, J.; Xu, M.; Fan, H.; Huang, J.; Fang, Y. Investigation on formation mechanisms of ash and deposit from cotton stalk vibrating grate boiler combustion based on their characteristics. Fuel 2022, 323, 124446. [Google Scholar] [CrossRef]
  53. Vlček, J.; Ovčačíková, H.; Velička, M.; Topinková, M.; Burda, J.; Matějková, P. The Corrosion Effect of Fly Ash from Biomass Combustion on Andalusite Refractory Materials. Minerals 2023, 13, 357. [Google Scholar] [CrossRef]
  54. Horák, J.; Kuboňová, L.; Dej, M.; Laciok, V.; Tomšejová, Š.; Hopan, F.; Krpec, K.; Koloničný, J. Effects of the type of biomass and ashing temperature on the properties of solid fuel ashes. Pol. J. Chem. Technol. 2019, 21, 43–51. [Google Scholar] [CrossRef]
  55. Vamvuka, D.; Zografos, D. Predicting the behaviour of ash from agricultural wastes during combustion. Fuel 2004, 83, 2051–2057. [Google Scholar] [CrossRef]
  56. Zhai, J.; Burke, I.T.; Mayes, W.M.; Stewart, D.I. New insights into biomass combustion ash categorisation: A phylogenetic analysis. Fuel 2021, 287, 119469. [Google Scholar] [CrossRef]
  57. Cao, W.; Li, J.; Martí-Rosselló, T.; Zhang, X. Experimental study on the ignition characteristics of cellulose, hemicellulose, lignin and their mixtures. J. Energy Inst. 2019, 92, 1303–1312. [Google Scholar] [CrossRef]
  58. Jung, S.-J.; Kim, S.-H.; Chung, I.-M. Comparison of lignin, cellulose, and hemicellulose contents for biofuels utilization among 4 types of lignocellulosic crops. Biomass Bioenergy 2015, 83, 322–327. [Google Scholar] [CrossRef]
  59. Bhat, M.A.; Mishra, A.K.; Shah, S.N.; Bhat, M.A.; Jan, S.; Rahman, S.; Baek, K.-H.; Jan, A.T. Soil and Mineral Nutrients in Plant Health: A Prospective Study of Iron and Phosphorus in the Growth and Development of Plants. Curr. Issues Mol. Biol. 2024, 46, 5194–5222. [Google Scholar] [CrossRef] [PubMed]
  60. Fontoura, C.F.; Brandão, L.E.; Gomes, L.L. Elephant grass biorefineries: Towards a cleaner Brazilian energy matrix? J. Clean. Prod. 2015, 96, 85–93. [Google Scholar] [CrossRef]
Figure 1. Scheme for the production and characterisation of biomass of elephant grass including proximate, chemical, and elemental analyses.
Sustainability 17 02741 g001
Figure 2. Total monthly precipitation (blue curve with triangle markers) and maximum, average, and minimum monthly temperature for the months from sowing to 180 days after sowing. Data from the National Institute of Meteorology [35].
Sustainability 17 02741 g002
Figure 3. Density as function of water content: (A) plant age = 90 days, (B) plant age = 120 days, (C) plant age = 150 days, and (D) plant age = 180 days.
Sustainability 17 02741 g003
Figure 4. Heating value as function of water content: (A) plant age = 90 days, (B) plant age = 120 days, (C) plant age = 150 days, and (D) plant age = 180 days.
Sustainability 17 02741 g004
Figure 5. Regression model to correlate the heating value with the water content regardless of plant part and plant age. HV: Heating Value, SE: Standard Error, WC: Water content.
Sustainability 17 02741 g005
Figure 6. Lignin (LIG), cellulose (CEL), and hemicellulose (HCEL) contents obtained from chemical analysis for plant ages 90, 120, 150, and 180 days for (A) leaf, (B) whole plant, and (C) stem.
Sustainability 17 02741 g006
Figure 7. Sum of compounds on ash samples as a function of compound on dried sample for different plant parts (stem, whole, leaf).
Sustainability 17 02741 g007
Table 1. Quadratic functions and respective coefficient of determination R2 of the density as function of the water content for different plant parts and ages.
Part Ages
[Days]
Density = f (WC)R2
Leaf90D = 148.75 ∗ Wc2 − 31.896 ∗ Wc + 54.5140.9762
Whole90D = 258.6 ∗ Wc2 − 71.948 ∗ Wc + 61.620.9915
Stem90D = 296.21 ∗ Wc2 − 38.448 ∗ Wc + 78.280.9899
Leaf120D = 215.7 ∗ Wc2 − 80.665 ∗ Wc + 53.8690.9548
Whole120D = 273.02 ∗ Wc2 − 68.567 ∗ Wc + 64.660.9691
Stem120D = 499.78 ∗ Wc2 − 178.24 ∗ Wc + 102.190.9851
Leaf150D = 95.24 ∗ Wc2 + 11.82 ∗ Wc + 53.3160.9978
Whole150D = 95.359 ∗ Wc2 + 35.858 ∗ Wc + 73.5450.988
Stem150D = 180.8 ∗ Wc2 + 48.847 ∗ Wc + 81.7930.9232
Leaf180D = 112.2 ∗ Wc2 + 23.003 ∗ Wc + 48.10.9778
Whole180D = 130.79 ∗ Wc2 + 44.35 ∗ Wc + 59.4140.9871
Stem180D = 287.87 ∗ Wc2 − 39.587 ∗ Wc + 113.530.9771
Table 2. Linear functions and respective coefficient of determination R2 of the heating value as function of the water content for different plant parts and ages.
Part Ages
[Days]
Heating Value = f (WC)R2
Leaf90HV = −18,947 ∗ Wc + 19,7350.9823
Whole90HV = −18,085 ∗ Wc + 19,5850.9872
Stem90HV = −16,228 ∗ Wc + 18,3970.9967
Leaf120HV = −16,475 ∗ Wc + 19,2150.8972
Whole120HV = −16,440 ∗ Wc + 18,9410.935
Stem120HV = −16,387 ∗ Wc + 19,3520.959
Leaf150HV = −18,240 ∗ Wc + 18,9980.9723
Whole150HV = −18,673 ∗ Wc + 19,4250.9088
Stem150HV = −18,687 ∗ Wc + 19,6840.8889
Leaf180HV = −17,368 ∗ Wc + 18,6510.9753
Whole180HV = −18,204 ∗ Wc + 18,9130.941
Stem180HV = −17,959 ∗ Wc + 19,3610.9413
Table 3. Results of chemical analysis along with the high heating value (HVV) from the BRS Capiaçu for the leaf, whole, and stem for plant ages of 90, 120, 150, and 180 days: neutral detergent fibre (NDF), acid detergent fibre (ADF), lignin (LIG), cellulose (CEL), and hemicellulose (HCEL).
Part Ages
[Days]
NDF
[%]
ADF
[%]
LIG
[%]
CEL
[%]
HCEL
[%]
HVV
[kJ/kg]
Leaf9073.73 ± 0.5140.48 ± 1.146.52 ± 1.8633.97 ± 1.1533.35 ± 1.2618,917
Whole9075.63 ± 0.9344.76 ± 1.637.30 ± 0.6636.92 ± 1.2030.87 ± 2.1718,151
Stem9079.30 ± 0.4047.85 ± 1.566.55 ± 1.2740.85 ± 0.9231.49 ± 1.9018,917
Leaf12074.48 ± 0.5740.06 ± 1.466.24 ± 0.9233.41 ± 0.9234.42 ± 2.0018,337
Whole12077.26 ± 1.6845.89 ± 0.359.04 ± 0.2336.86 ± 0.2331.37 ± 1.9418,352
Stem12081.78 ± 0.7650.22 ± 2.539.70 ± 0.9941.44 ± 1.5731.56 ± 2.0018,282
Leaf15074.97 ± 0.4138.24 ± 1.526.16 ± 1.0232.00 ± 1.0236.74 ± 1.1318,074
Whole15077.29 ± 0.4546.30 ± 2.239.25 ± 0.8937.48 ± 1.7430.99 ± 2.1418,352
Stem15081.45 ± 0.4149.70 ± 0.719.96 ± 0.5539.63 ± 0.9631.75 ± 0.7818,300
Leaf18075.98 ± 1.0038.24 ± 1.527.42 ± 2.0030.74 ± 2.0037.75 ± 1.7717,922
Whole18080.03 ± 0.7947.87 ± 0.7110.56 ± 0.6237.53 ± 0.6032.15 ± 0.2318,500
Stem18083.05 ± 1.0053.42 ± 0.8112.23 ± 0.2641.19 ± 0.8729.63 ± 1.1318,001
Table 4. MANOVA considering Wilks’ lambda and Pillai’s trace to assess the influence of plant age, plant part and interaction age*plant part on the ADF, NDF, lignin and cellulose contents.
Plant Age
TestTest-valueNum DFDen DFF-valuep-value
Wilks’ lambda0.567412111.41312.21770.0153
Pillai’s trace0.4536121321.95970.0328
Plant part
TestTest-valueNum DFDen DFF-valuep-value
Wilks’ lambda0.196488413.1948~0
Pillai’s trace0.86688868.2233~0
Interaction Age*Plant part
TestTest-valueNum DFDen DFF-valuep-value
Wilks’ lambda0.348224147.73052.1734~0
Pillai’s trace0.8361241801.9820~0
Table 5. FRX results for the characterisation of the leaf at 90, 120, 150, and 180 days.
Leaf90 Days120 Days150 Days180 Days
CompoundUnityDriedAshDriedAshDriedAshDriedAsh
MgO%0.593.080.716.270.827.081.0414.22
SiO2%2.3311.892.1810.642.0813.373.2117.99
P2O5%1.175.960.986.190.824.180.915.90
SO4%1.001.040.871.250.690.890.791.44
Cl%0.762.310.741.960.661.590.550.53
K2O%5.5821.783.9416.382.6611.981.848.14
CaO%3.4510.114.0913.794.3115.713.8617.86
MnO2%0.230.650.220.670.210.670.160.59
FeO%0.230.700.170.540.150.460.140.35
TiO2ppm227.8687.2148.1464.7167.2458.6136.1364.6
CuOppm33.7162.330.9102.526.594.324.2109.5
ZnOppm112349.5110.4306.987.2311.181.4290.6
Brppm50.9103.75679.953.195.632.817.9
Rb2Oppm136649.782.8303.353.3200.932.4125.7
SrOppm33205.737.4161.140.9162.840.3198.5
Sum%15.33657.51513.88357.66412.39755.93912.49567.014
Table 6. FRX results for the characterisation of the stem at 90, 120, 150, and 180 days.
Stem90 Days120 Days150 Days180 Days
CompoundUnityDriedAshDriedAshDriedAshDriedAsh
MgO%0.657.280.566.460.496.770.374.97
SiO2%1.328.891.135.641.026.730.705.08
P2O5%0.774.600.643.580.573.280.492.88
SO4%0.801.210.801.670.761.610.751.30
Cl%0.510.650.380.290.240.120.080.04
K2O%1.749.701.187.060.714.990.564.14
CaO%1.958.491.457.171.357.240.894.88
MnO2%0.180.750.120.550.150.750.100.54
FeO%0.150.570.170.500.180.630.080.47
TiO2ppm155.5611.3183.6484.9147693.375.5395.3
CuOppm15.554.115.453.712.749.812.263.7
ZnOppm95.4357.368.2159.525.860.817.776
Brppm39.236.423.910.411.491.72.910
Rb2Oppm39.9155.624.481.815.363.312.354.6
SrOppm17.56813.742.112.944.68.835.2
Sum%8.07442.1386.42132.9065.47832.1214.0137624.2883
Table 7. FRX results for the characterisation of the whole plant at 90, 120, 150, and 180 days.
Whole90 Days120 Days150 Days180 Days
CompoundUnityDriedAshDriedAshDriedAshDriedAsh
MgO%0.696.660.696.050.617.360.648.03
SiO2%2.2212.492.0110.221.8911.231.6610.29
P2O5%0.966.380.824.420.673.590.684.18
SO4%0.881.230.811.370.691.420.751.45
Cl%0.581.420.561.030.400.450.320.28
K2O%3.2216.812.5012.171.457.701.337.50
CaO%2.6910.372.9510.252.4510.222.4911.23
MnO2%0.210.740.180.610.170.620.150.58
FeO%0.210.740.300.780.200.690.220.64
TiO2ppm214.9740.7205557.4180.6620.5171.6561.9
CuOppm23.280.32274.118.363.915.368
ZnOppm67.728791256.939.7149.847.6142.8
Brppm43.278.636.243.428.826.1178.2
Rb2Oppm85.1372.648.8186.829.1114.721.783.4
SrOppm26.5121.925.193.823.179.424.383.3
Sum%11.65356.83810.83346.898.53843.2828.23944.171
Table 8. Slagging and fouling indices for the BRS Capiaçu considering the leaf, the whole plant, and the stem at 90 and 180 days. Severe or positive inclinations are indicated by italic fonts.
Leaf
90 Days
Leaf
180 Days
Whole
90 Days
Whole
180 Days
Stem
90 Days
Stem
180 Days
Basic-to-acidic ratio (B/A)2.982.252.752.652.912.83
Slagging/fouling inclinationSevereSevereSevereSevereSevereSevere
Bed agglomeration index (BAI)0.030.040.040.090.060.11
Agglomeration inclinationYesYesYesYesYesYes
Fouling index (FU)64.9518.3146.2719.8428.2411.70
Fouling inclinationSevereHighSevereHighHighHigh
Slag viscosity index (SR)46.1235.6941.2934.0935.2232.98
Molten ash inclinationSevereHighSevereHighHighHigh
Chlorine index2.3070.5321.4210.2760.6490.0383
Slagging/fouling inclinationSevereSevereSevereHighSevereLow
Table 9. Proximate analysis results of BRS Capiaçu for water, volatile, fixed carbon and ash contents considering the stem, the whole plant, and the leaf for plant ages of 90 and 180 days. Measurements from Beber et al. [20].
Stem
90 Days
Whole
90 Days
Leaf
90 Days
Stem
180 Days
Whole
180 Days
Leaf
90 Days
Water content81.85 ± 0.3081.91 ± 0.2979.45 ± 0.20 65.84 ± 0.46 67.70 ± 0.48 71.31 ± 0.57
Volatile content78.60 ± 0.9176.54 ± 0.59 76.11 ± 0.92 83.60 ± 0.94 80.56 ± 0.85 77.80 ± 0.52
Fixed Carbon Content19.89 ± 0.8120.01 ± 0.59 19.62 ± 0.98 15.06 ± 0.98 16.30 ± 0.82 17.70 ± 0.52
Ash content1.51 ± 0.133.45 ± 0.35 4.27 ± 0.11 1.34 ± 0.19 3.13 ± 0.19 4.50 ± 0.11
Disclaimer/Publisher’s Note: The statements, opinions and data contained in all publications are solely those of the individual author(s) and contributor(s) and not of MDPI and/or the editor(s). MDPI and/or the editor(s) disclaim responsibility for any injury to people or property resulting from any ideas, methods, instructions or products referred to in the content.

