Article

Hydration Products and Properties of Nanocellulose Fibre-Reinforced Mortar †

Centre for Infrastructure Management, Materials and Engineering Research Institute, Sheffield Hallam University, Sheffield S1 1WB, UK
*
Author to whom correspondence should be addressed.
This publication is the expanded version of the conference paper “Physical, Mechanical and Chemical Properties of Nanocellulose Fibre Reinforced Mortar”, by Agunbiade, T.; Mangat, P.S., which appeared in Sixth International Conference on Sustainable Construction Materials and Technologies, Lyon, France, 9–14 June 2024.
Sustainability 2025, 17(6), 2719; https://doi.org/10.3390/su17062719
Submission received: 28 January 2025 / Revised: 7 March 2025 / Accepted: 12 March 2025 / Published: 19 March 2025
(This article belongs to the Special Issue Sustainable Approaches for Developing Concrete and Mortar)

Abstract

:
This study investigates the influence of nanocellulose fibre (CF) derived from wood pulp on the hydration, mechanical, shrinkage, and pore properties of ordinary Portland cement (OPC) mortar. The CF was incorporated into mortar mixes at varying dosages (0.15–1.5% by weight of mortar) to evaluate its effect on physical, mechanical, and microstructure properties. X-ray diffraction (XRD), thermogravimetric analysis (TGA/DTG), and mercury intrusion porosimetry (MIP) were employed to assess the hydration phases and microstructural changes induced by the CF addition. Experimental results indicate that CF alters the hydration kinetics of cement mortar by influencing the formation of hydration products such as calcium silicate hydrate (C-S-H), portlandite (CH), and carbonate phases. The introduction of CF enhances crack resistance and shrinkage control, particularly at an optimal dosage of 0.45%, which exhibited reduced drying shrinkage and improved phase stability. While CF incorporation had minimal impact on compressive and flexural strength at lower dosages (≤0.45%), higher CF contents (>0.99%) caused pore structure modifications, leading to an increase in total porosity and a reduction in strength. The XRD analysis revealed that CF does not introduce new hydration phases but modifies the crystallinity of existing phases. The hydration behaviour, as indicated by TGA/DTG, showed an increase in bound water content at moderate CF dosages, suggesting enhanced internal curing and prolonged hydration. Overall, the findings demonstrate that CF is a viable sustainable additive for cementitious materials, offering advantages in shrinkage control, hydration enhancement, and durability improvement. The results suggest that an optimal CF dosage of 0.45% provides a balance between workability, mechanical properties, and durability, making it an effective additive for enhancing the performance of OPC mortars in sustainable construction applications.

1. Introduction

The incorporation of waste materials, particularly agricultural by-products, as fillers and additives in cementitious composites has gained significant attention in recent years. These applications are drawing interest from both the scientific community and the construction industry due to their sustainability benefits, cost-effectiveness, and environmentally friendly nature. Utilizing such materials in cement systems reduces environmental impact while simultaneously enhancing material properties and performance [1]. Historically, the use of cellulosic vegetable fibres in inorganic matrices dates back to ancient civilizations such as those of China and Egypt where fibres were employed to improve the mechanical strength and workability of building materials [2]. Modern advancements in cement composite technology have built on this concept, leveraging the ability of fibres to form adhesive bonds with the cement matrix, enhance resistance to microcracking, facilitate internal self-curing, and reduce shrinkage at optimal dosages, such as 0.5% cellulose fibre (CF) [3]. These properties highlight the potential of fibre-reinforced cementitious composites to enhance durability and mechanical behaviour, making them an ideal solution for sustainable construction.
Some of the commonly used fibres, such as steel fibres, organic synthetic fibres, carbon fibres, and glass fibres, for reinforcements in cementitious composites exhibit advantages such as long application time, relatively mature technology, and interesting physical and mechanical properties. However, compared to CF, these commonly used fibres have their limitations [4]. Steel fibres, for example, have high susceptibility to corrosion and a relatively large density and, as such, may not be a choice for reinforcing lightweight cementitious composites. Also, steel fibres lack the ability to induce growth of the hydrate gel in the cement matrix interface transition zone [5]. Organic synthetic fibres are not biodegradable and exhibit poor compatibility and dispersion in cement matrix, thereby resulting in compressive strength reduction, as reported by Luna et al. [6]. On the other hand, glass fibres are not susceptible to corrosion and are a good choice for reinforcing the manufacturing lightweight cementitious composites. However, their poor wear resistance and vulnerability in a long-term alkaline environment [6] make them less desired reinforcement materials for specific applications in an alkaline environment. Carbon fibre easily agglomerates in the cement matrix, possesses long-term durability properties, and has good resistance to corrosion. Its major setback is the relatively high cost [5,6]. Due to increasing demand for inexpensive environmentally friendly materials and the net zero goal of reducing the emission of greenhouse gases (GHGs), researchers are discovering the benefit of incorporating agricultural wastes in the form of processed fibres into cement mortars and concretes. Plant fibres are agricultural waste composed of cellulose, hemicellulose, lignin, and other substances used for application as reinforcement materials in cement and concrete.
Research by Arbelaiz et al. [1] investigated the effects of incorporating cellulose microfibres and nanocellulose into cement mortar composites. The study revealed that the addition of microfibres led to a decrease in mortar strength compared to plain mortar, with greater reductions observed at higher fibre contents. Conversely, the inclusion of nanocellulose fibres resulted in minimal changes in density relative to unreinforced mortar. These findings suggest that while microfibres may adversely affect the mechanical properties of cement mortars, nanocellulose fibres can be incorporated without significantly altering the material’s density, potentially offering a more favourable reinforcement option.
Mejdoub et al. [7] investigated the use of nano-fibrillated oxidised cellulose (NFCox) as a partial replacement in cement paste with dosages ranging from 0% to 1.5% by weight of cement. The results demonstrated that an optimal NFCox content of 0.7 wt.% significantly reduced the thermal conductivity of the nanocomposite by 58% compared to the control sample. Furthermore, increasing the NFCox content enhanced cement hydration, as evidenced by the increased production of Ca(OH)2 and C-S-H gel, which was supported by results from XRD and FTIR spectroscopy. Similarly, D’Erme et al. [8] studied the incorporation of fibrillated cellulose (FC) at dosages of 0%, 0.1%, 0.2%, and 0.3 wt.% by weight of binder into lime pastes and lime-based mortars, which led to notable improvements in mechanical properties. The results showed that the inclusion of FC enhanced the flexural strength by 57% and the compressive strength by 44%, highlighting the potential of cellulose-based additives to reinforce lime-based materials.
In recent years, there has been growing interest in sustainable materials, particularly nanocellulose fibres derived from agricultural and forestry waste, due to their eco-friendly and cost-effective nature. These fibres not only contribute to the reduction of greenhouse gas emissions but also provide a promising alternative to traditional fibres such as steel and carbon, which have higher production costs and environmental impacts. Nanocellulose fibres, specifically, have been shown to enhance the internal curing of cementitious composites by promoting better water retention and reducing autogenous shrinkage, which is particularly crucial in high-performance concrete prone to early-age cracking [9]. Their ability to absorb and release water can mitigate drying shrinkage and reduce the risk of cracking in mortar and concrete, providing both reinforcement and self-curing capabilities. Furthermore, nanocellulose fibres are biodegradable, making them a more sustainable option compared to synthetic fibres [9]. As a result, incorporating nanocellulose fibres into cement-based materials not only aligns with the growing emphasis on sustainable construction practices but also offers performance advantages, such as reduced shrinkage and improved durability.
This current study aims to investigate the use of fibrillated cellulose fibre derived from wood pulp as a multifunctional additive in ordinary Portland cement mortars and how it affects the physical, mechanical, chemical, hydration, and pore properties of the cement mortar matrices.

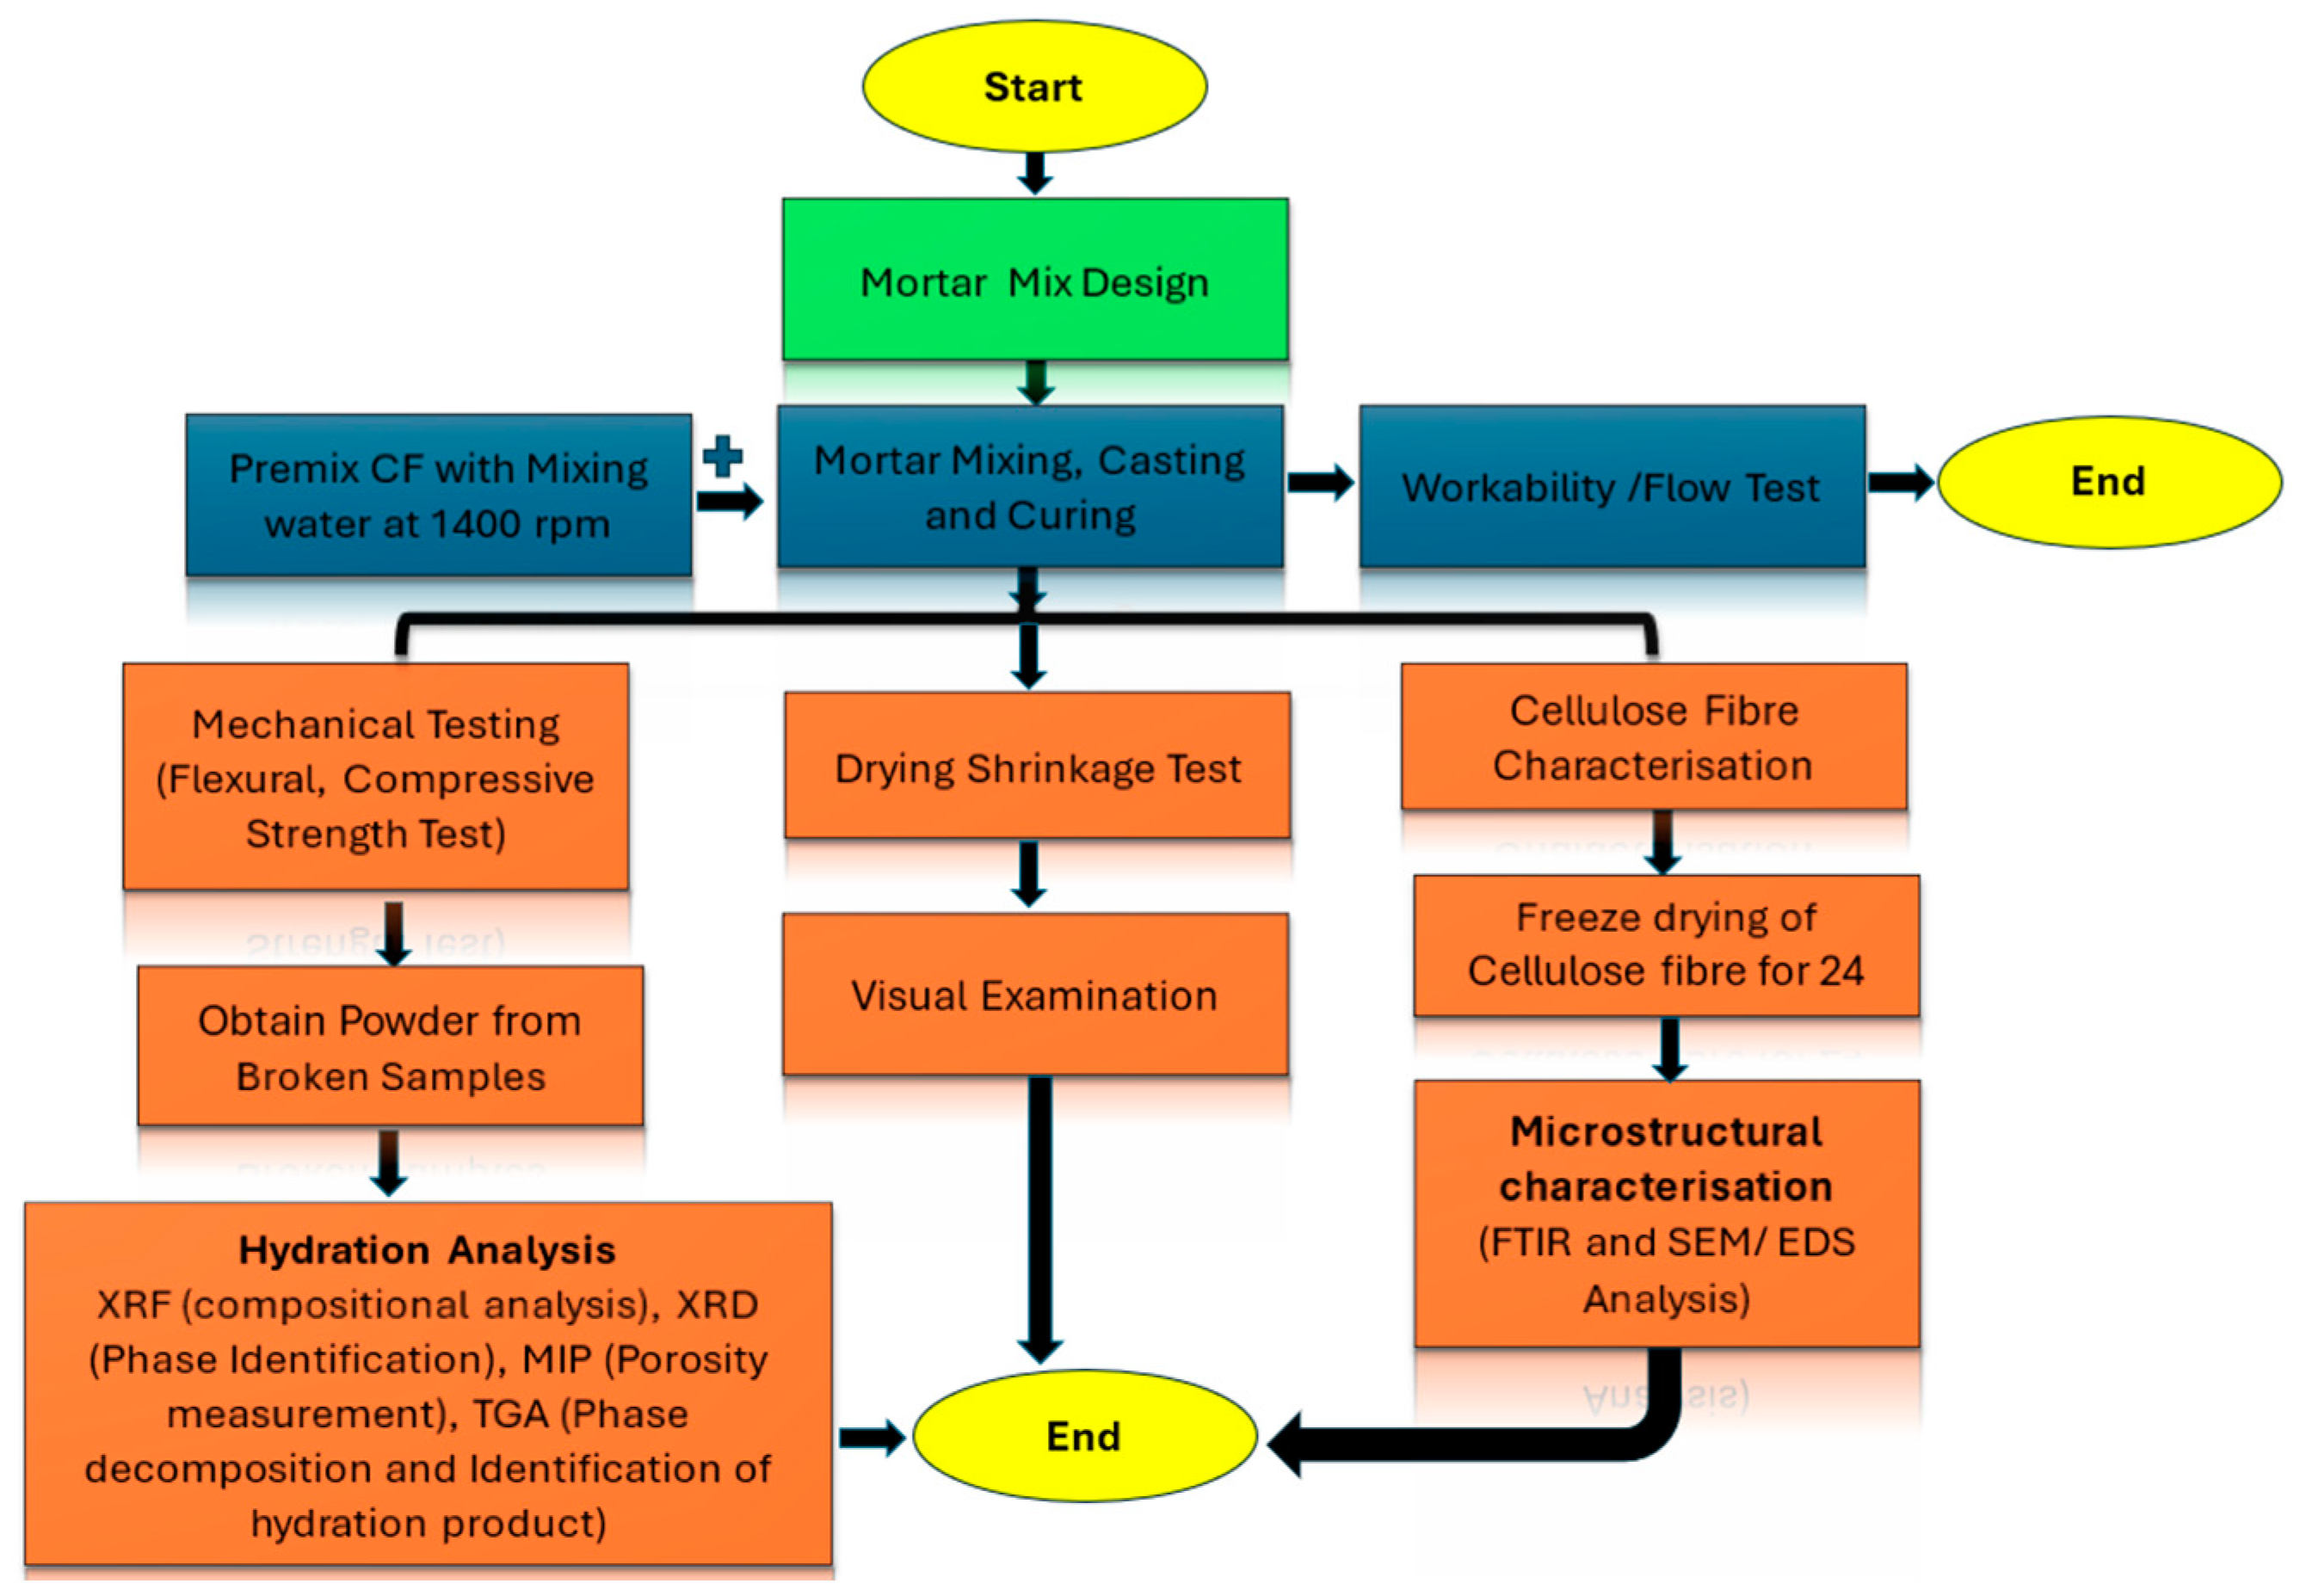
2. Materials and Methods

2.1. Materials and Mixes

OPC conforming to CEM type 1 with a strength class of 32.5 R was used. The sharp sand has a specific gravity of 2.53 g/cm3, conforming to the specification in BS ISO 15901-1 [10], and lies within the fine gradation zone (F Zone). The oxide analysis of the OPC and sand are given in Table 1. The water used for the mixes conforms to the specification in BS EN 1008 [11]. The CF, derived from wood pulp, has been sourced from sustainably managed forests and is supplied by Sappi Netherlands Services BV, Maastricht, The Netherlands [12]. The fibre is provided in the paste form, with a white colour and a solid content ranging between 9.0% and 11.0%, as determined by ESTM 9302. The viscosity of a 1.0% suspension at 100 s−1 and 1.200 °C is ≥600 mPas, measured according to ESTM 5302. The pH of a 1% suspension falls within the range of 7.0 to 9.0, measured using a pH meter, while the total fines content is ≥600%, determined following ESTM 9003. Additionally, the cellulose fibre contains preservatives to maintain its stability and performance. The cellulose fibre was premixed with a part of the mixing water at a fibre content of 0.15%, 0.31%, 0.45%, 0.51%, 0.99%, and 1.5% by weight of mortar. The mixture was homogenised by vigorously stirring at 1400 rpm at room temperature before adding the mixture gradually to the mortar while mixing at a constant speed for a set duration.
Seven mixes of mortar (M0–M6) were investigated, M0 being the control mix comprising the ordinary Portland cement and fine aggregates (sharp sand). The cement and fine aggregate content of all mixes was 19.6 wt.% and 68.6 wt.%, respectively. The water-to-cement ratio was 0.59. The CF content of the mixes is given in Table 2. The mortar mixes were based on a trial mix design for 40 MPa.

2.2. Specimen Preparation

2.2.1. Flexural, Compression, and Drying Shrinkage Test Specimens

A flow chart showing the testing procedures is given in Figure 1. A total of forty-two test prisms of dimension 160 × 40 × 40 mm3 were produced [14]. Twenty-one of the test prisms were used as flexural and compression test specimens. The other twenty-one test prisms were used for drying shrinkage measurements. All prisms were prepared and cured in accordance with BS EN 1015-3 [15]. Shrinkage test specimens of same dimensions were cast and cured in the moulds at 65 ± 5% relative humidity (RH) and 20 ± 2 °C for 24 h. After 24 h, the specimens were demoulded and DEMEC discs were attached using epoxy along two longitudinal parallel (not the trowelled face) faces of each prism specimen at a gauge length of 100 mm. The samples were left for another 24 h in the curing room before datum strain measurements were taken. Specimens were placed on a rack in the curing room with a clearance of at least 25 mm on all sides. A controlled temperature of 20 ± 2 °C and 65 ± 5% RH was maintained in the curing room. Strain measurements were taken on the specimens at regular intervals with a DEMEC extensometer.

2.2.2. Mercury Intrusion Porosimetry (MIP)

Selected mixes (M1, M2 and M3) were investigated based on the best compressive strength results obtained among the mixes. MIP test samples between 2 mm and 5 mm were taken from the core of mortar specimens used for compression tests at 28 days age. The samples were selected to avoid edges and skin effects due to the mould. They were kept in acetone for 24 h, then dried for 1 h at 40 °C to remove the solvent. All samples were kept in a polypropylene container prior to testing.

2.2.3. XRD, XRF (X-Ray Fluorescence) and FT-IR (Fourier-Transform Infrared Spectroscopy)

Pieces of mortars were obtained from broken compression test samples, ground into powder using a pulveriser and preserved in airtight polypropylene bags for XRD and XRF analysis. FT-IR analysis was conducted on CF to confirm the presence of typical functional groups associated with CF.

2.3. Test Procedures

2.3.1. FT-IR

CF were initially prepared by freeze-drying for one day. This technique was employed to remove moisture from the fibres while preserving their structure and chemical composition. After drying, the fibres were analysed using FT-IR to examine their functional groups. FT-IR spectra were collected using a Nicolet FTIR spectrometer through the attenuated total reflection (ATR) method (Thermo Fisher Scientific, Waltham, MA, USA). Spectra were recorded in the range of 500–4000 cm−1 with a 4 cm−1 resolution and 32 co-added scans.

2.3.2. Scanning Electron Microscopy/Energy-Dispersive X-Ray Spectroscopy (SEM/EDS)

The SEM samples for CF were prepared as described in Section 2.3.1. The samples were then mounted onto an SEM stud using silver paint, after which the samples were carbon coated because CF are nonconductive. The morphology and elemental composition of the cellulose fibres were analysed using a QUANTA 650 Field Emission Scanning Electron Microscope (FE-SEM) equipped with EDS (Thermo Fisher Scientific, Waltham, MA, USA). SEM was employed to examine the surface topography and fibre structure at high magnification, while EDS provided qualitative and semi-quantitative information about the elemental composition of the fibres. This combination of techniques allowed for detailed investigation of both the physical and chemical properties of the cellulose fibres. The images were collected in backscattered electron (BSE) mode utilizing a solid-state backscattered electron detector. An electron beam energy of 20 kV and spot size between 3 and 4 were used to maximise resolution and image quality, while minimizing electron beam damage to the specimens. All images were acquired at 1000× and 10,000× magnification.

2.3.3. Workability and Flexural and Compressive Strength

A flow test was performed in accordance with BS EN 1015-3 [15] to determine the workability of fresh mixes. The flexural strength of hardened mortar was tested by three-point loading of specimens to failure. Flexural tests were performed on an Instron testing machine conforming to BS EN 12390-4 [16] at a constant loading rate of 30 N/s. The compressive strength of the mortar was determined on two broken halves from the flexural strength test by a compression testing machine conforming to BS EN 12390-4 [16], at a loading rate of 0.3 MPa/s.

2.3.4. Drying Shrinkage and MIP Test

Drying shrinkage was measured using a mechanical strain gauge (DEMEC) that conforms to BS 1881-206 [17], with a gauge length of 100 mm. The DEMEC system directly measures the strain of the sample relative to an invar reference bar, with a resolution of 8 µε. The device measures the change in distance over time between two points on each side of the sample. The MIP test was conducted in accordance with BS 812-103 [18].

2.3.5. TGA and XRD

A Mettler Toledo thermogravimetric analyser was used to carry out the thermogravimetric measurements (Mettler-Toledo International Inc., Columbus, OH, USA). Approximately, 50 mg of powdered sample with the particle size less than 74 µm was taken in an open 70 µL aluminium crucible and dried in the TG chamber at 25 °C under a constant stream of nitrogen (N2) gas for 15 min or until the constant mass was achieved. Later the temperature was increased to 35 °C and held constant for 5 min. Then, the sample was heated from 35 °C to 1000 °C, at a rate of 10 °C/min. For evaluating data, Mettler-Toledo STARe Software Version 10.00 was used. This software evaluates weight changes for a sample thermogravimetric curve, which was then used to obtain the DTG curve by taking the first derivative of the TG curve, calculated by an in-built function in the software. The powder samples of control mortar and CFRM were tested using a computer programmed Philips X-Pert X-ray diffractometer operating with a Cu Kα radiation source 40 kV and 40 mA and wavelength λ = 0.15406 nm (Philips, Almelo, The Netherlands). XRD analysis of powder samples was performed by scanning from 5° to 100° at an angle of 2θ; the scan step size was 0.016711, with a counting time step of 0.1 s. Phase identification of the cement mortar samples was performed using X’Pert High Score software (version 5.1, PANalytical, Almelo, The Netherlands) [19]. The diffraction patterns were analysed using the Search/Match algorithm to match the experimental diffraction peaks with reference patterns from the ICDD (International Centre for Diffraction Data) database. The software automatically identified the crystalline phases present in the samples by comparing peak positions, intensities, and lattice parameters to those in the database. This technique allowed for the qualitative identification of phases, confirming the presence of key hydrated phases and minerals in the cement mortar matrix.

3. Results and Discussion

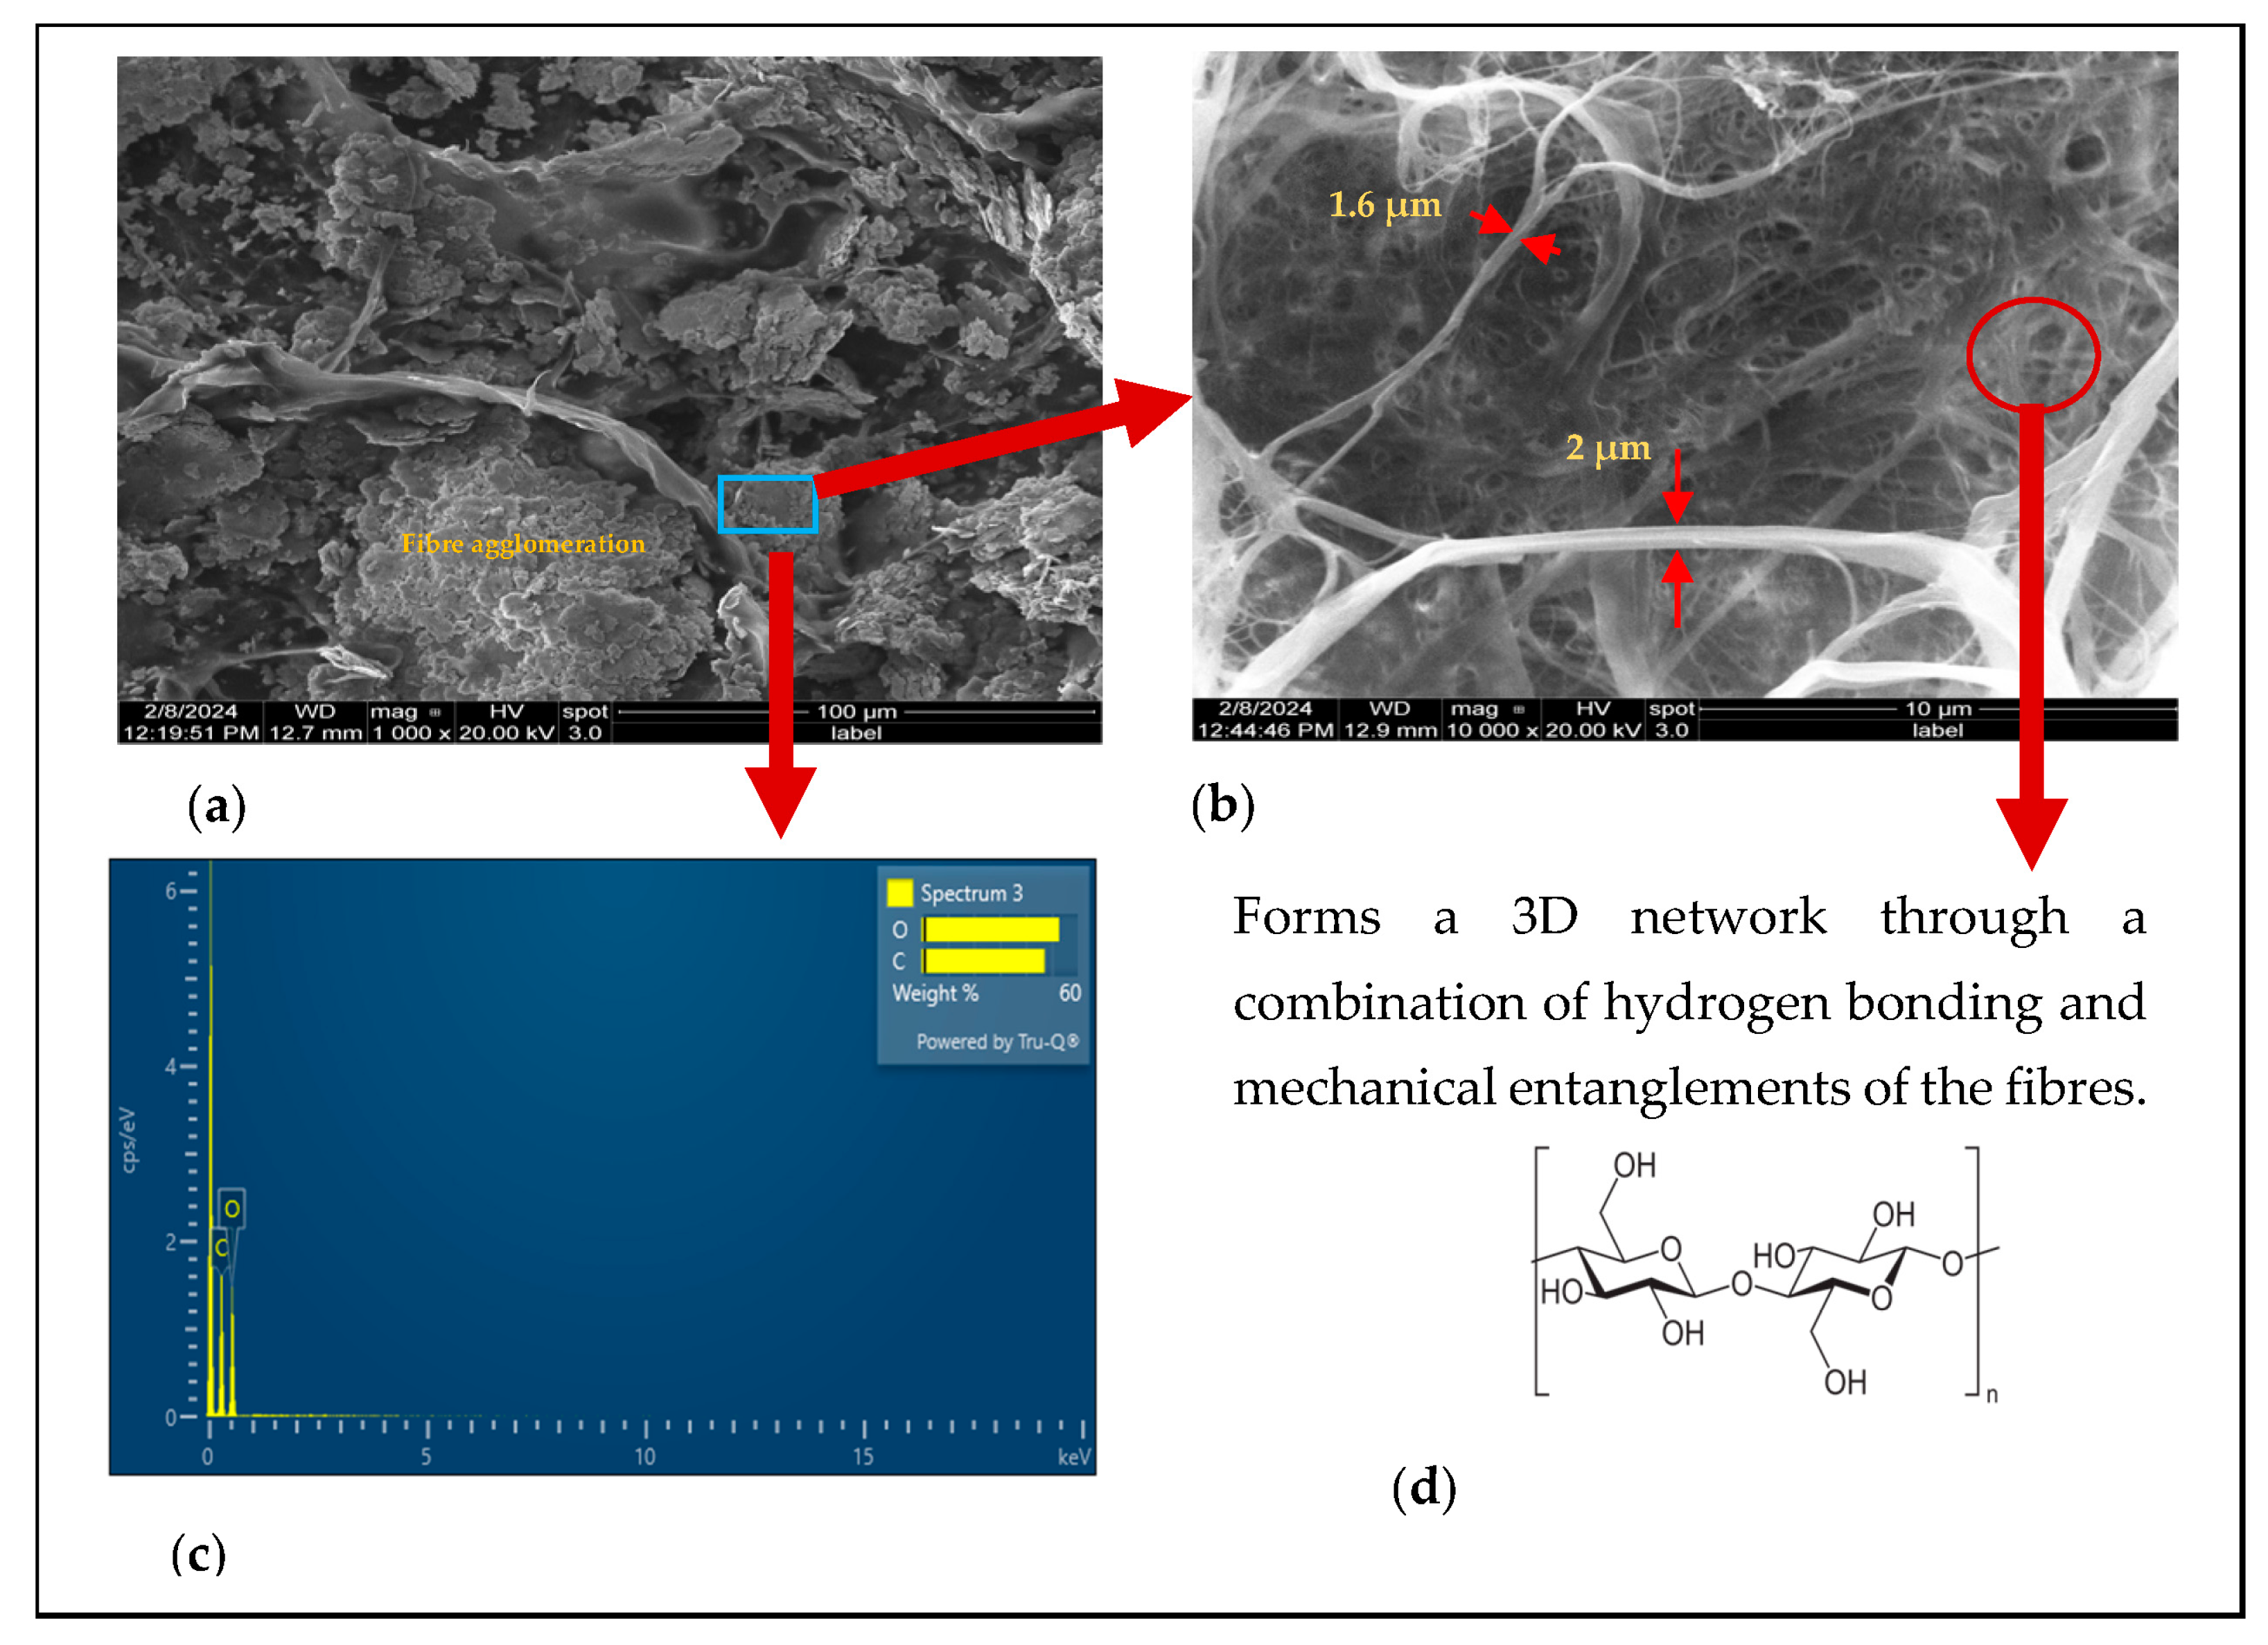
3.1. FT-IR and SEM-EDS Analysis
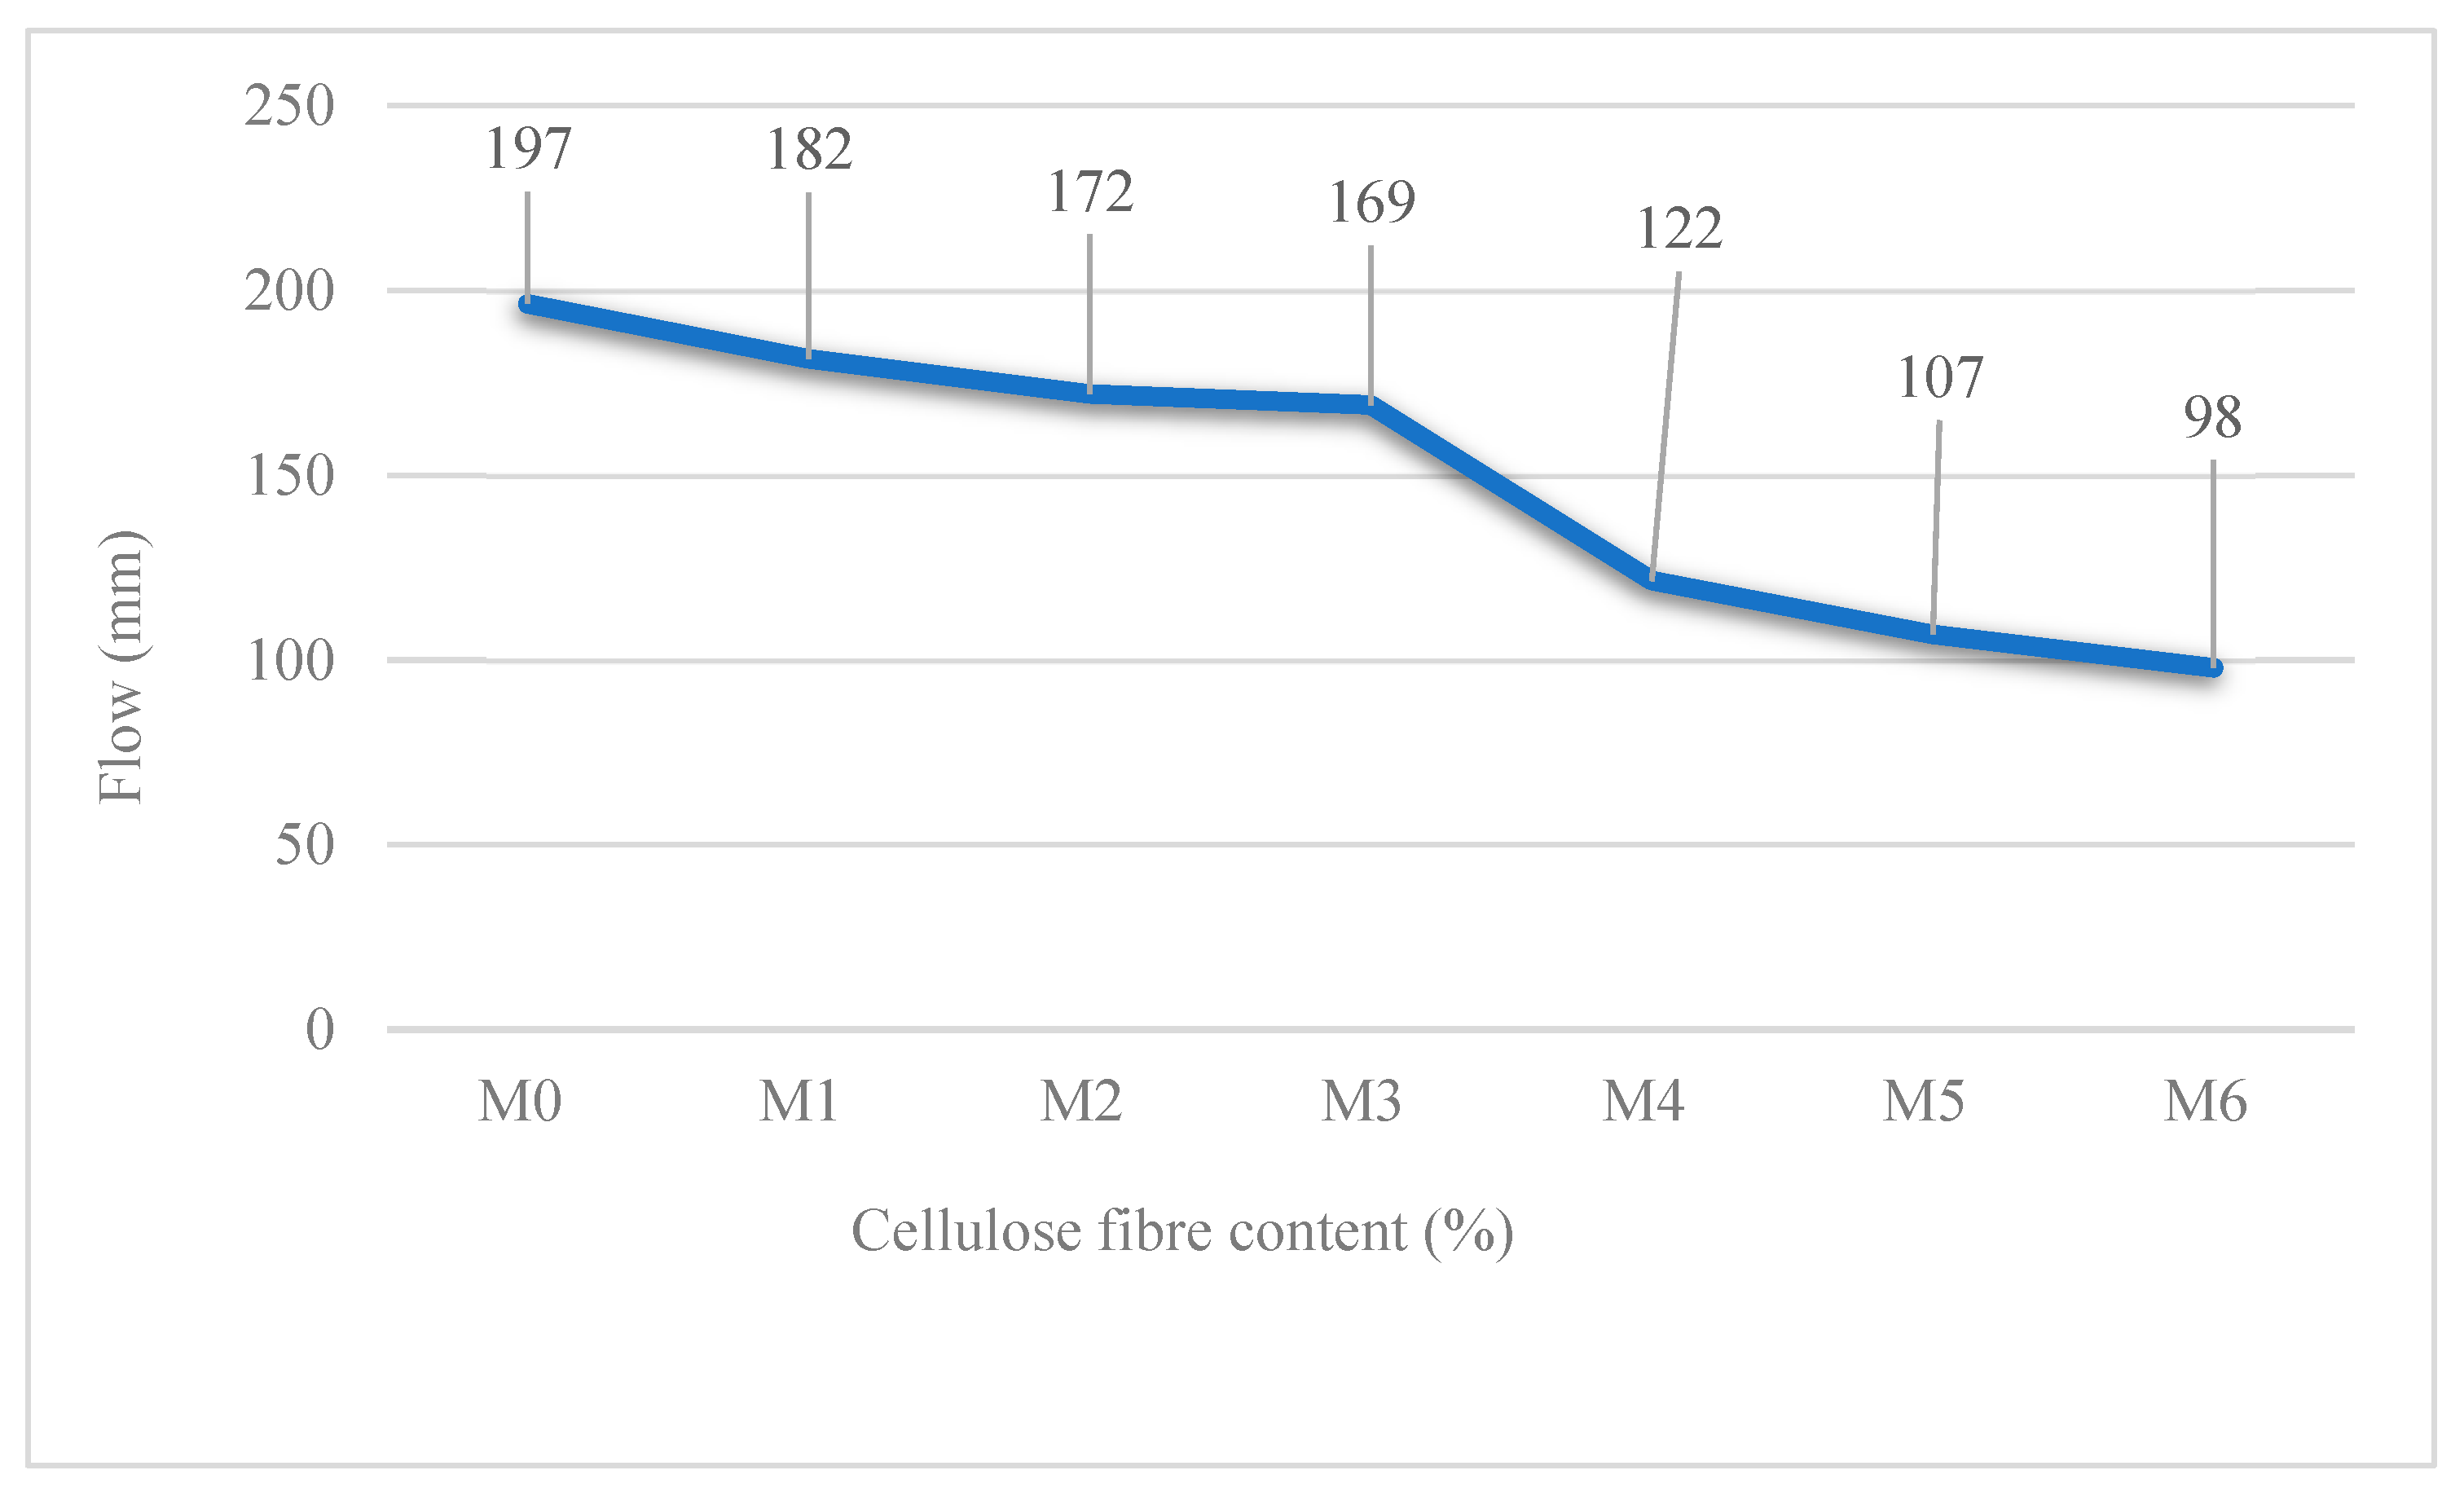
The FTIR spectrum of the CF sample in Figure 2 confirms that it is a cellulose fibre. The strong broad absorption at 3339.39 cm−1 corresponds to the O-H stretching of hydroxyl groups, indicating significant hydrogen bonding, a characteristic feature of cellulose, which can cause water retention and prolonged hydration of cement mortar [20,21,22]. The peak at 2900.01 cm−1 represents C-H stretching, while the 1646.44 cm−1 band is associated with H-O-H bending, likely due to absorbed moisture, reflecting the material’s hydrophilic nature. Peaks at 1428.86 cm−1 and 1370.62 cm−1 correspond to CH2 bending vibrations in the cellulose backbone, and the bands at 1160.87 cm−1, 1110.31 cm−1, and 1059.31 cm−1 confirm C-O-C stretching in glycosidic linkages, characteristic of β-1,4-glycosidic bonds in cellulose. The absorption at 898.50 cm−1 further supports the presence of β-glycosidic bonds, solidifying the identification of the sample as cellulose. Given its intended application as an additive in cement mortars, these cellulose fibres contribute to enhanced water retention, improved workability (when used at optimum dosage), and improve crack resistance and surface crazing, reinforcing the mortar’s durability [23,24].
Figure 3 shows the microstructure of cellulose fibres at different magnifications revealing the morphology and networking connections between the fibre strands. The fibrous network suggests strong hydrogen bonding interactions, which improve water retention and slow down moisture evaporation, which can facilitate better hydration in cement mortar matrices. The EDS analysis confirms the presence of carbon and oxygen, consistent with the composition of cellulose reported by Sankar et al. [25]. The estimated diameter of the cellulose fibre shown in the high magnification SEM image at 10,000× magnification is approximately between 1.6 and 2 µm. As shown in Figure 3a, localised fibre agglomeration was observed. This has been reported to be due to drying at room temperature under vacuum [26].

3.2. Workability

Figure 4 shows the flow curve of the control mortar and cellulose fibre-reinforced mortar (CFRM). The temperature of all the mixes lies between 23 °C and 25 °C, except for mix 3, which is 18 °C. It was observed that as the cellulose fibre content increases in the mixes and the workability (flow) decreases, resulting in stiff CFRM mixes M5 and M6. Mixes M0, M1, M2, and M3 showed good flow and were workable, spreadable, and easily trowelled. M4 was moderately workable compared to M5 and M6. It was further observed that the cellulose fibres in the mortar mixes absorbed large amounts of the mixing water, which led to a significant reduction in the consistency of the mixes. This phenomenon was also reported by Sawsen et al. in 2015 [27] and Buch et al. in 1999 [28].

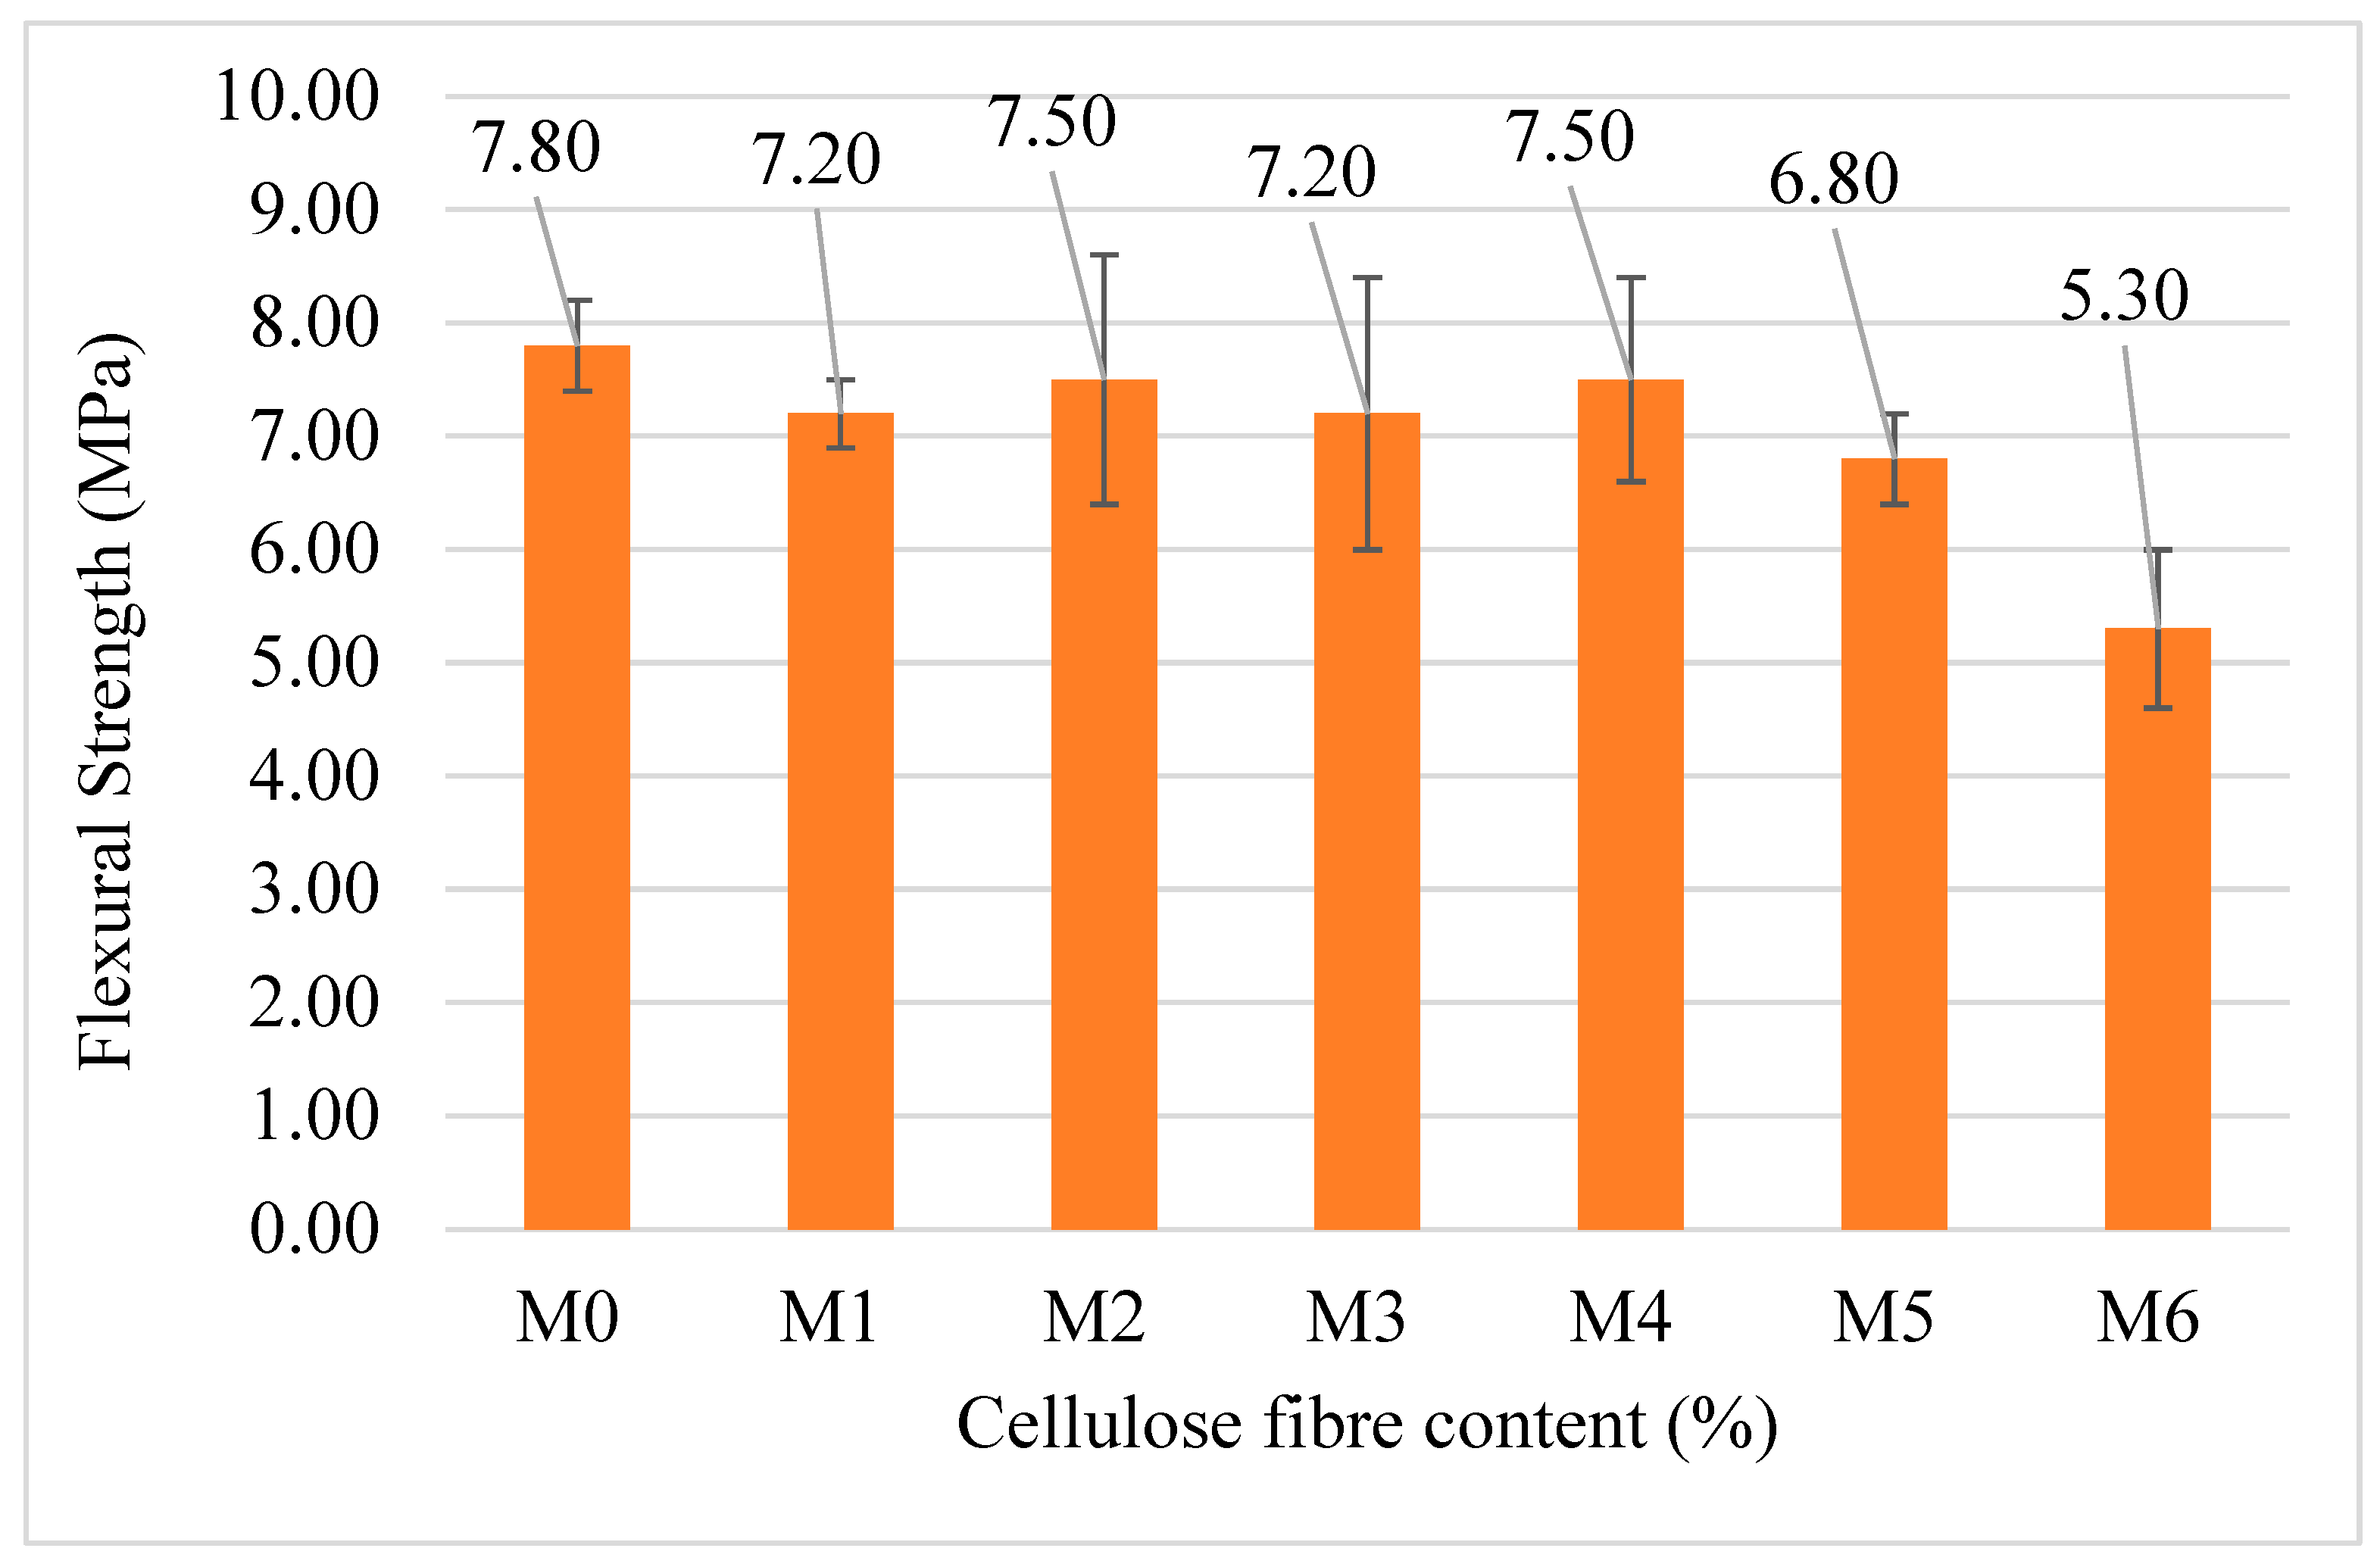
3.3. Flexural and Compressive Strength

Figure 5 and Figure 6 illustrate the effect of cellulose fibres on the mortar flexural and compressive strength after 28 days of curing in water. To account for variability, reliability, and measurement uncertainty of these test results, three prisms were tested for flexural strength for each mix (M0–M6). The control mortar without CF exhibited higher flexural strength of 7.8 ± 0.4 MPa at 28 days, while mixes with CF content by weight of 0.15%, 0.31%, 0.45%, 0.51%, 0.99%, and 1.5% gave 7.2 ± 0.3 MPa, 7.5 ± 1.1 MPa, 7.2 ± 1.2 MPa, 7.5 ± 0.9 MPa, 6.8 ± 0.4 MPa, and 5.3 ± 0.7 MPa, respectively. The addition of CF (M1–M4, 0.15–0.51%) resulted in slightly lower but comparable flexural strengths, with overlapping uncertainty ranges suggesting these differences in flexural strength may not be statistically significant. However, higher CF contents (M5–M6, 0.99–1.5%) showed a clear decreasing trend in flexural strength, with M6 demonstrating significantly lower strength at 5.3 ± 0.3 MPa. The results indicate that excessive CF likely disrupts the matrix, reducing the ability to bear flexural loads. The incorporation of fibres such as steel, glass, polypropylene (PP), and basalt have been reported to improve bending strength in cement-based composites by bridging microcracks and delaying crack propagation [2,7,29]. The improvement in performance is also dependent on the dispersion, geometry, stiffness (elastic modulus), and volume fraction of these fibres. However, as observed in Figure 5, cellulose fibres do not increase flexural strength in a similar manner to the other fibres due to the difference in their physical and mechanical properties. Similar results have been reported by several studies [29] relating the decrease in bending strength to CF agglomeration, increased porosity, and poor fibre–matrix interaction [2,7]. High CF volume may disrupt the cementitious matrix, creating voids and weak interfacial bond, ultimately reducing strength [30]. Additionally, cellulose fibres are highly hydrophilic, which can hinder hydration reactions, further weakening the mortar matrices [31]. These findings suggest that while moderate fibre content (0.15–0.51%) maintains or slightly enhances flexural strength, excessive CF addition reduces performance due to poor dispersion and microstructural disruptions.
A similar trend was observed for the compressive strength of the mortar mixes, as shown in Figure 6. Compressive strength remains relatively stable for fibre contents up to 0.51% (M4), ranging from 31.1 ± 3.2 MPa to 34.2 ± 1.9 MPa. A notable peak in strength occurs at M3 (0.45% CF content). However, higher fibre contents lead to significant strength reductions, with M6 (1.5% CF) showing a 27.8% decrease compared to the control. The mixes M1 (32.5 ± 2.0 MPa) and M4 (32.6 ± 1.1 MPa) have a minimal improvement in compressive strengths compared to the control mortar. Mix M3 (34.2 ± 1.9 MPa) gives the optimum compressive strength (7% increase) compared to the control mortar M0 (32 ± 0.8 MPa). Mix M2 shows a slight decrease in compressive strength. Moderate amounts of CF (up to 0.45%) can improve compressive strength. However, CF contents above 0.51% significantly weaken the compressive strength due to poor fibre–matrix bonding or fibre agglomeration. This phenomenon has been reported in works of the literature [1,30,32]. The fibre effect on the mechanical properties may also be connected to the pore property changes caused by the fibres. This will be discussed in detail later in Section 3.5.

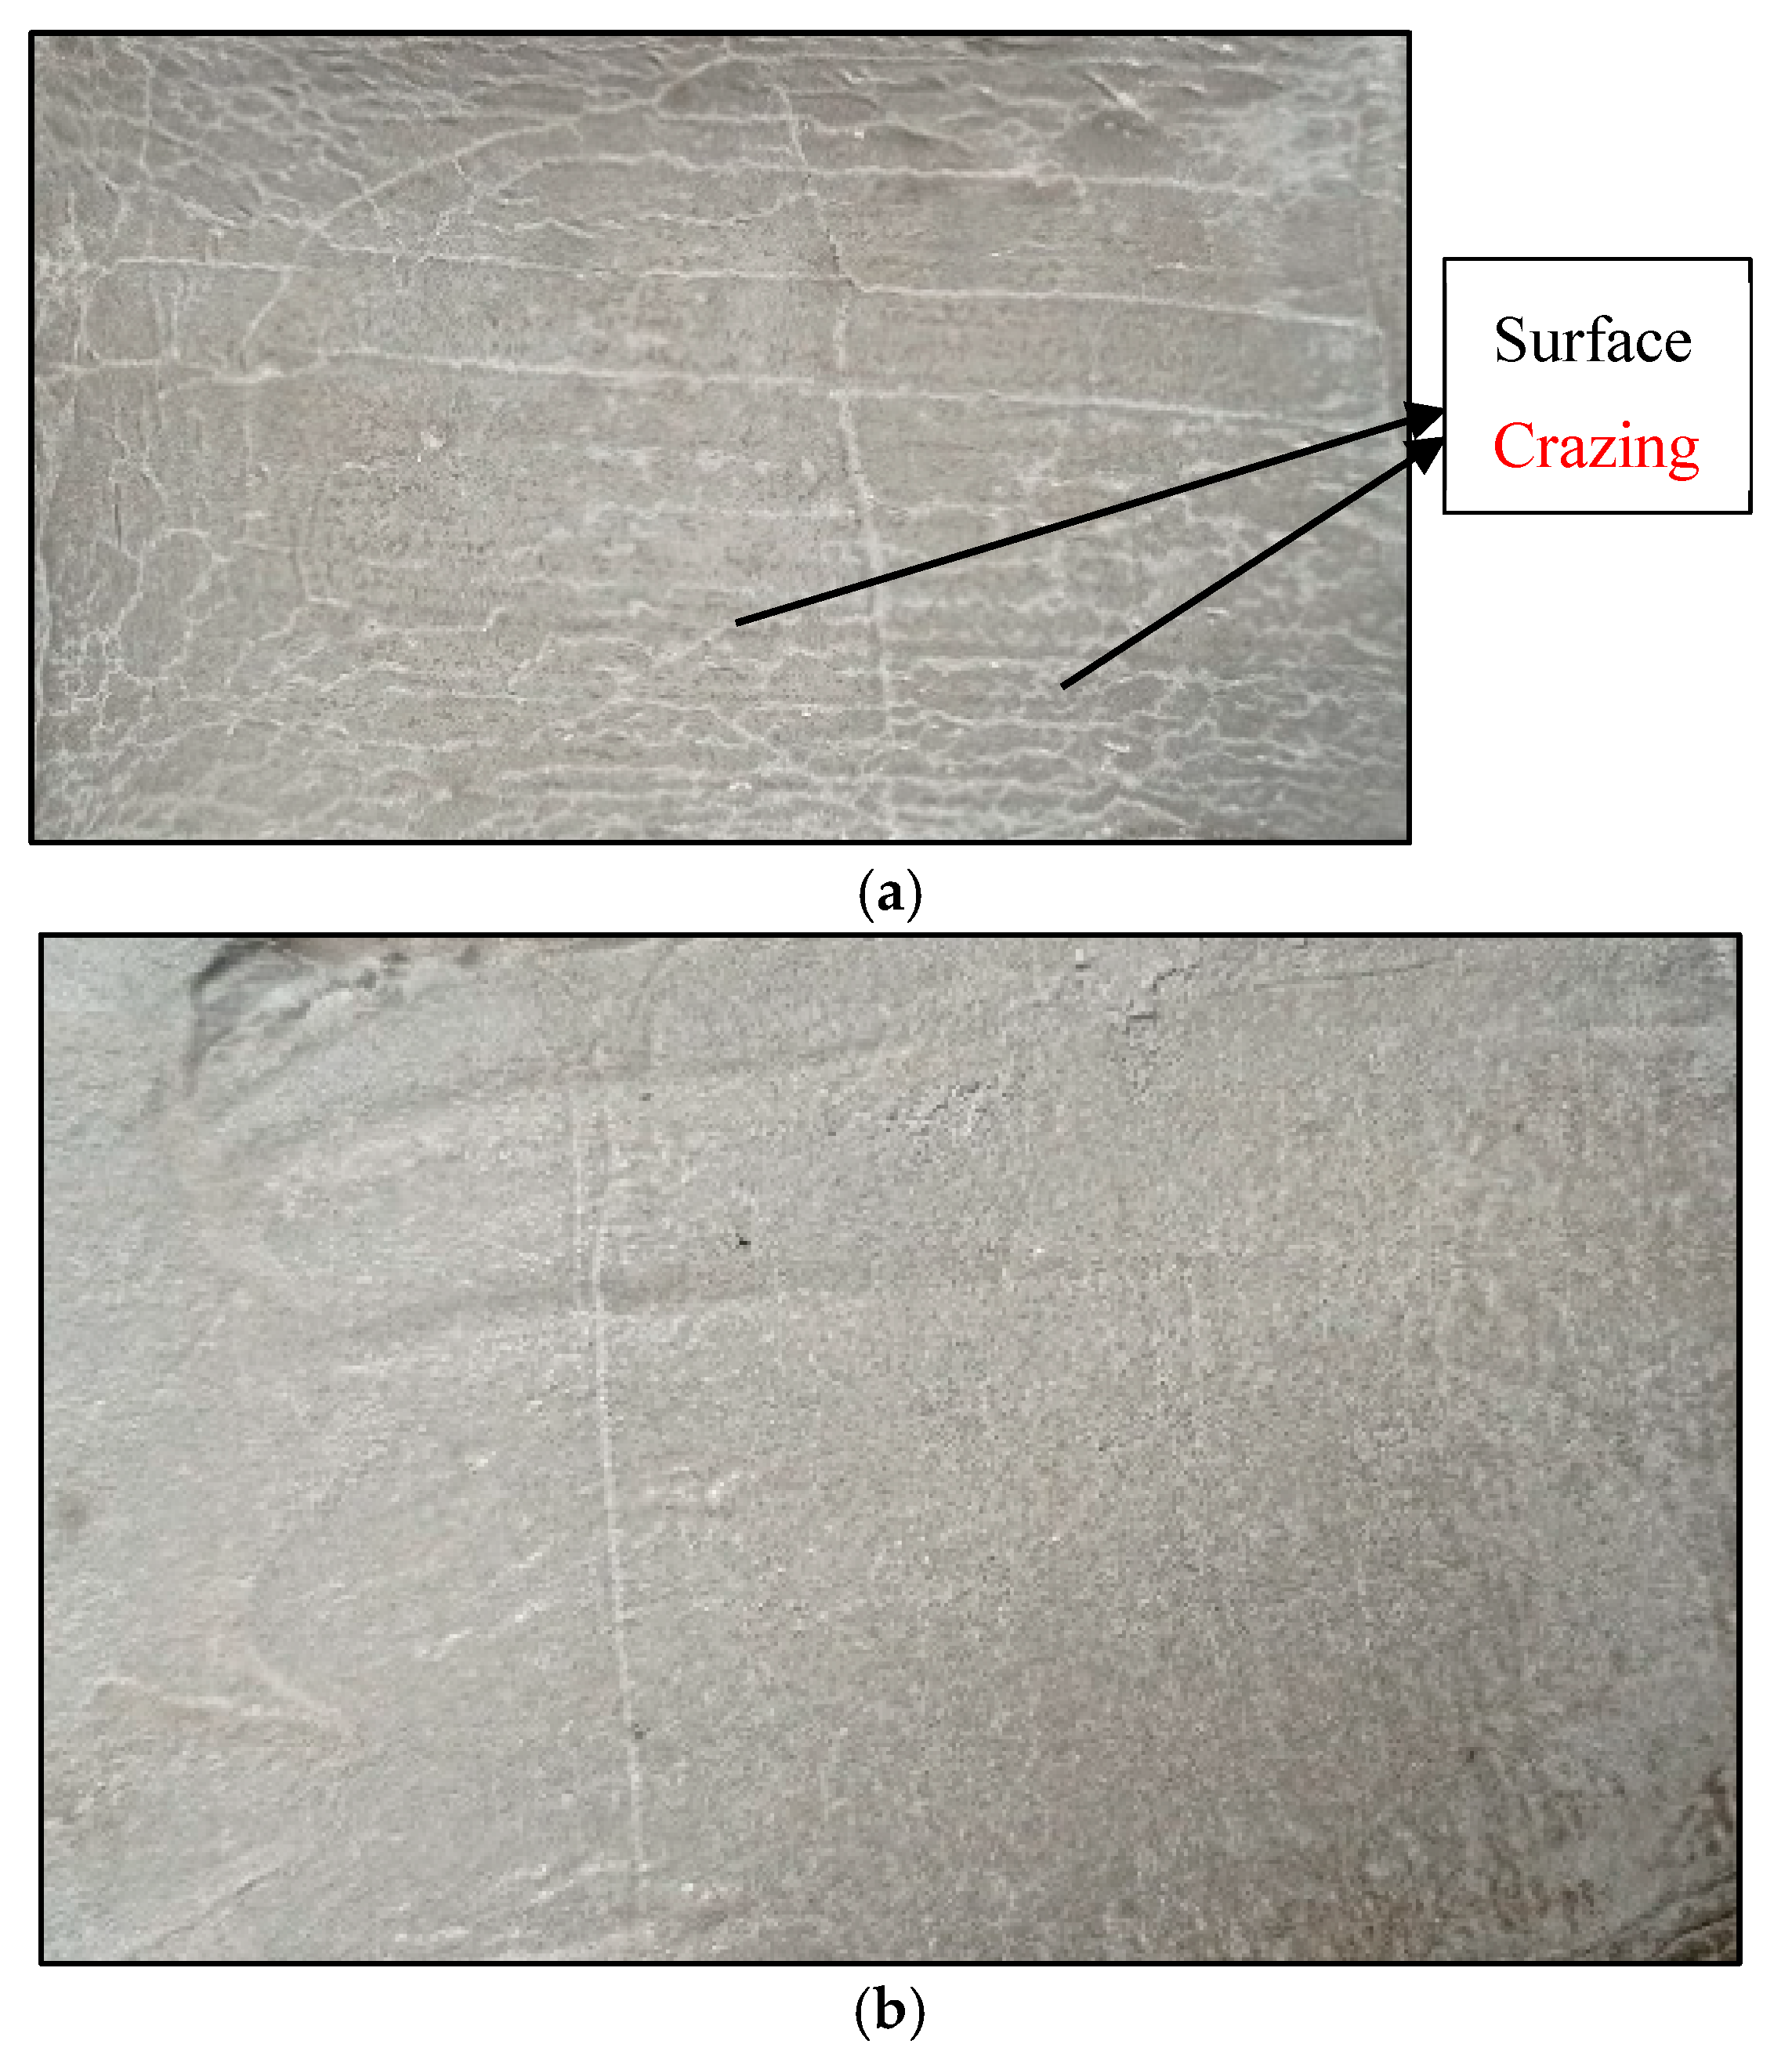
3.4. Drying Shrinkage Test and Visual Examination

Drying shrinkage was monitored for 30 days to observe the effect of CF on the mortar mixes. The results are shown in Figure 7. The control mortar mix M0 without cellulose fibre showed a drying shrinkage strain value of 780 µε strain. Mix M1 results in a reduction of drying shrinkage by 5% at 742 µε strain compared to the control mortar mix. M2 increased drying shrinkage by 5% at 816 µε strain; M3 (0.45% CF) resulted in 7% reduction in drying shrinkage at a strain of 726 µε strain; and M4, M5, and M6 all showed an increase in drying shrinkage by 6%, 16%, and 19%, with the corresponding shrinkage values of 825 µε strain, 906 µε strain, and 925 µε strain, respectively. After long curing, the control mortar without CF and M3 with 0.45% CF were visually examined to evaluate the effect of CF on restraining surface crazing caused by drying shrinkage. Results shown in Figure 8a,b indicate that 0.45% CF prevents surface crazing compared to the control mortar, which has significant surface crazing but no drying shrinkage cracks. The drying shrinkage result of M0–M6 shows variability in the shrinkage behaviour with the addition of CF (M1–M6), as compared to the control mix M0. Contrary to expectations from some studies where CF primarily controls cracking without significantly altering shrinkage [9,33], the current result indicates that different fibre dosages affect shrinkage to varying degrees. This variation could be attributed to fibre dispersion and the interaction between the CF and the mortar matrix. Furthermore, Kawashima and Shah [9] and Ban et al. [34] highlight that fibre agglomeration or clumping can lead to inconsistent results with poorly dispersed fibres as observed in mix M5 and M6 where higher fibre content may have led to less effective dispersion, resulting in increased shrinkage. High shrinkage observed in some of the mixes with CF aligns with findings by Toledo Filho et al. [35], who reported increased shrinkage in cement matrices reinforced with natural fibres. As with sisal and coconut fibres, CF increases matrix porosity, which leads to higher shrinkage. In contrast, M1 and M3 appear to provide moderate control of shrinkage. Thus, while the drying shrinkage results for M1–M6 are not uniform, the fibre’s ability to control shrinkage-induced cracking and surface crazing is evident.

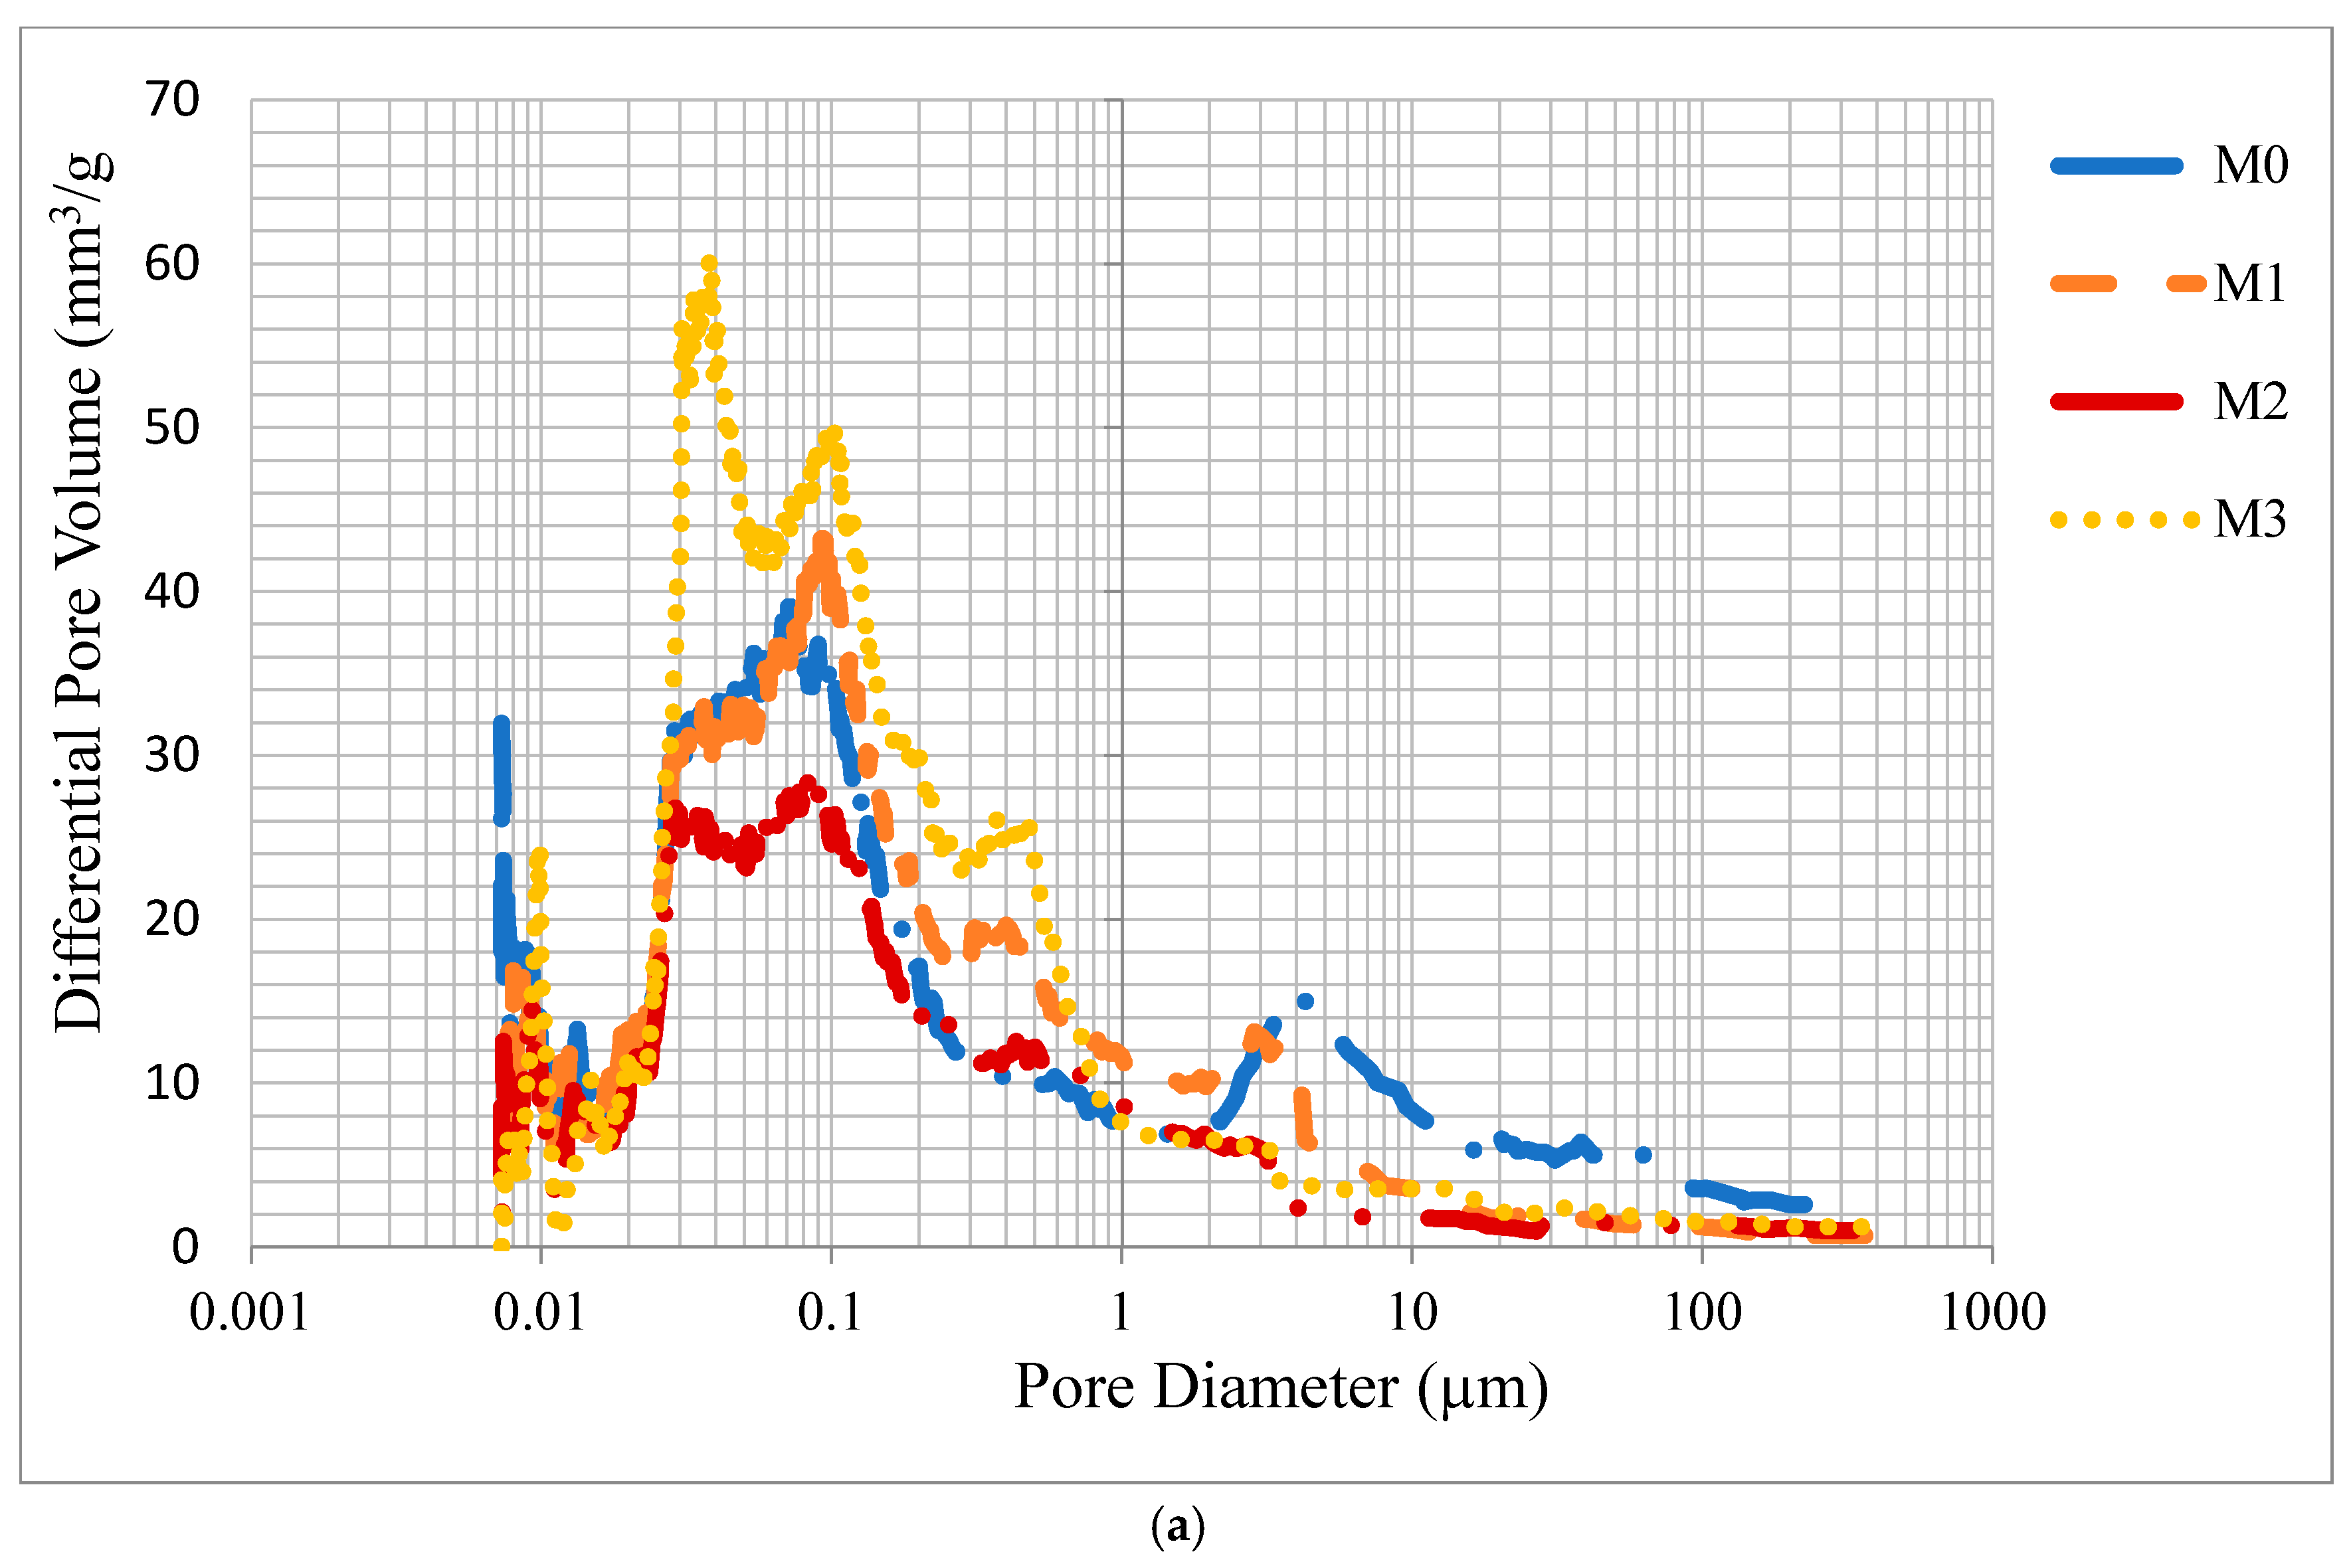
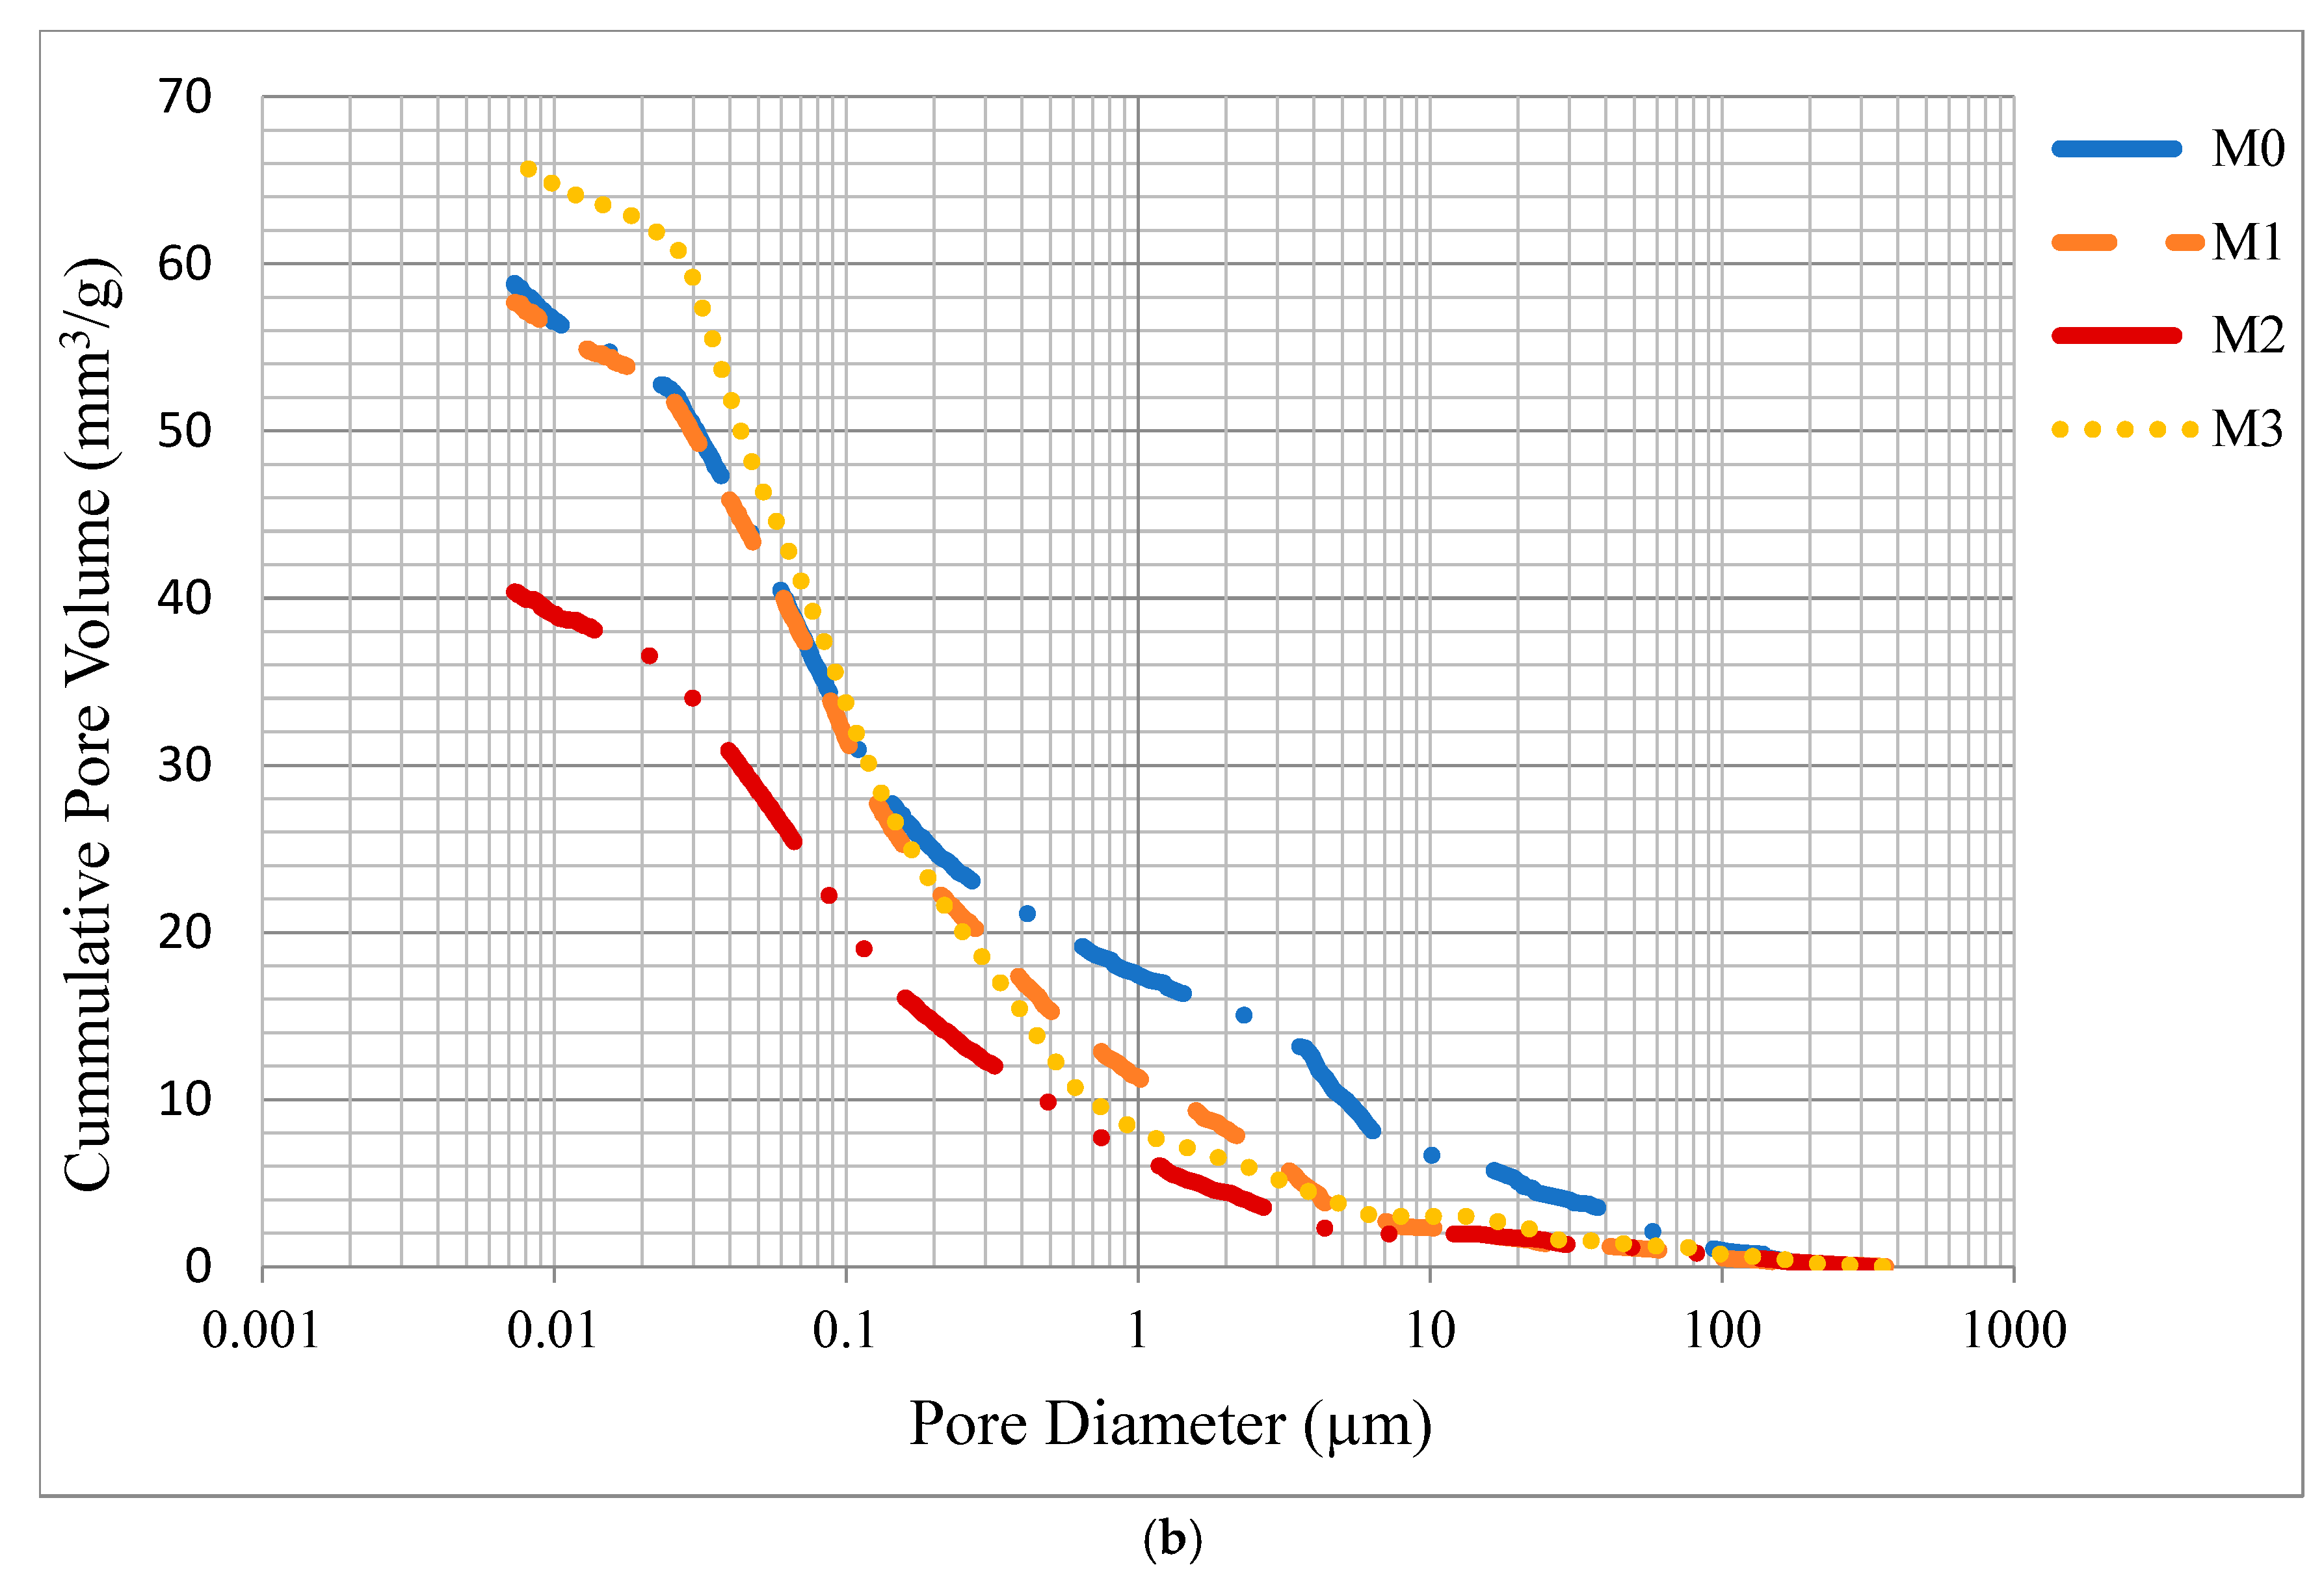
3.5. Mercury Intrusion Porosimetry (MIP)

The mercury intrusion porosimetry technique was used to investigate the total porosity of mortar mixes. The control mortar and three selected mixes (M1, M2, M3) were investigated. The values of the total porosity (cumulative pore volume) of mixes can be deduced from the results shown in Figure 9a,b. The differential pore volume distribution in Figure 8a reveals a significant modification of the pore structure with CF addition. M1, M2, and M3 exhibit increased pore volume in the capillary pore range (0.01–1 μm) compared to the control mortar M0. This effect is more pronounced for M3 (0.45% CF). This observation aligns with findings by Toledo Filho et al. [35] who reported that when vegetable fibres are present in higher volume in cement matrices, it can lead to increased drying shrinkage, which is related to the volume of capillary pores in hydrated cement paste [36,37]. The cumulative pore volume graph (Figure 9b) indicates that CF addition generally increases the total porosity of the mortar. M1 (58 mm3/g) and M3 show higher cumulative pore volume compared to the control mortar M0 (57 mm3/g), with M3 (66 mm3/g) exhibiting the highest porosity. Interestingly, M2 (40 mm3/g) shows a lower total porosity than the control, which warrants further investigation of this study. The increase in total porosity with fibre addition is consistent with observations by Onuaguluchi and Banthia [38] in their review of plant-based natural fibre reinforcements in cementitious composites.

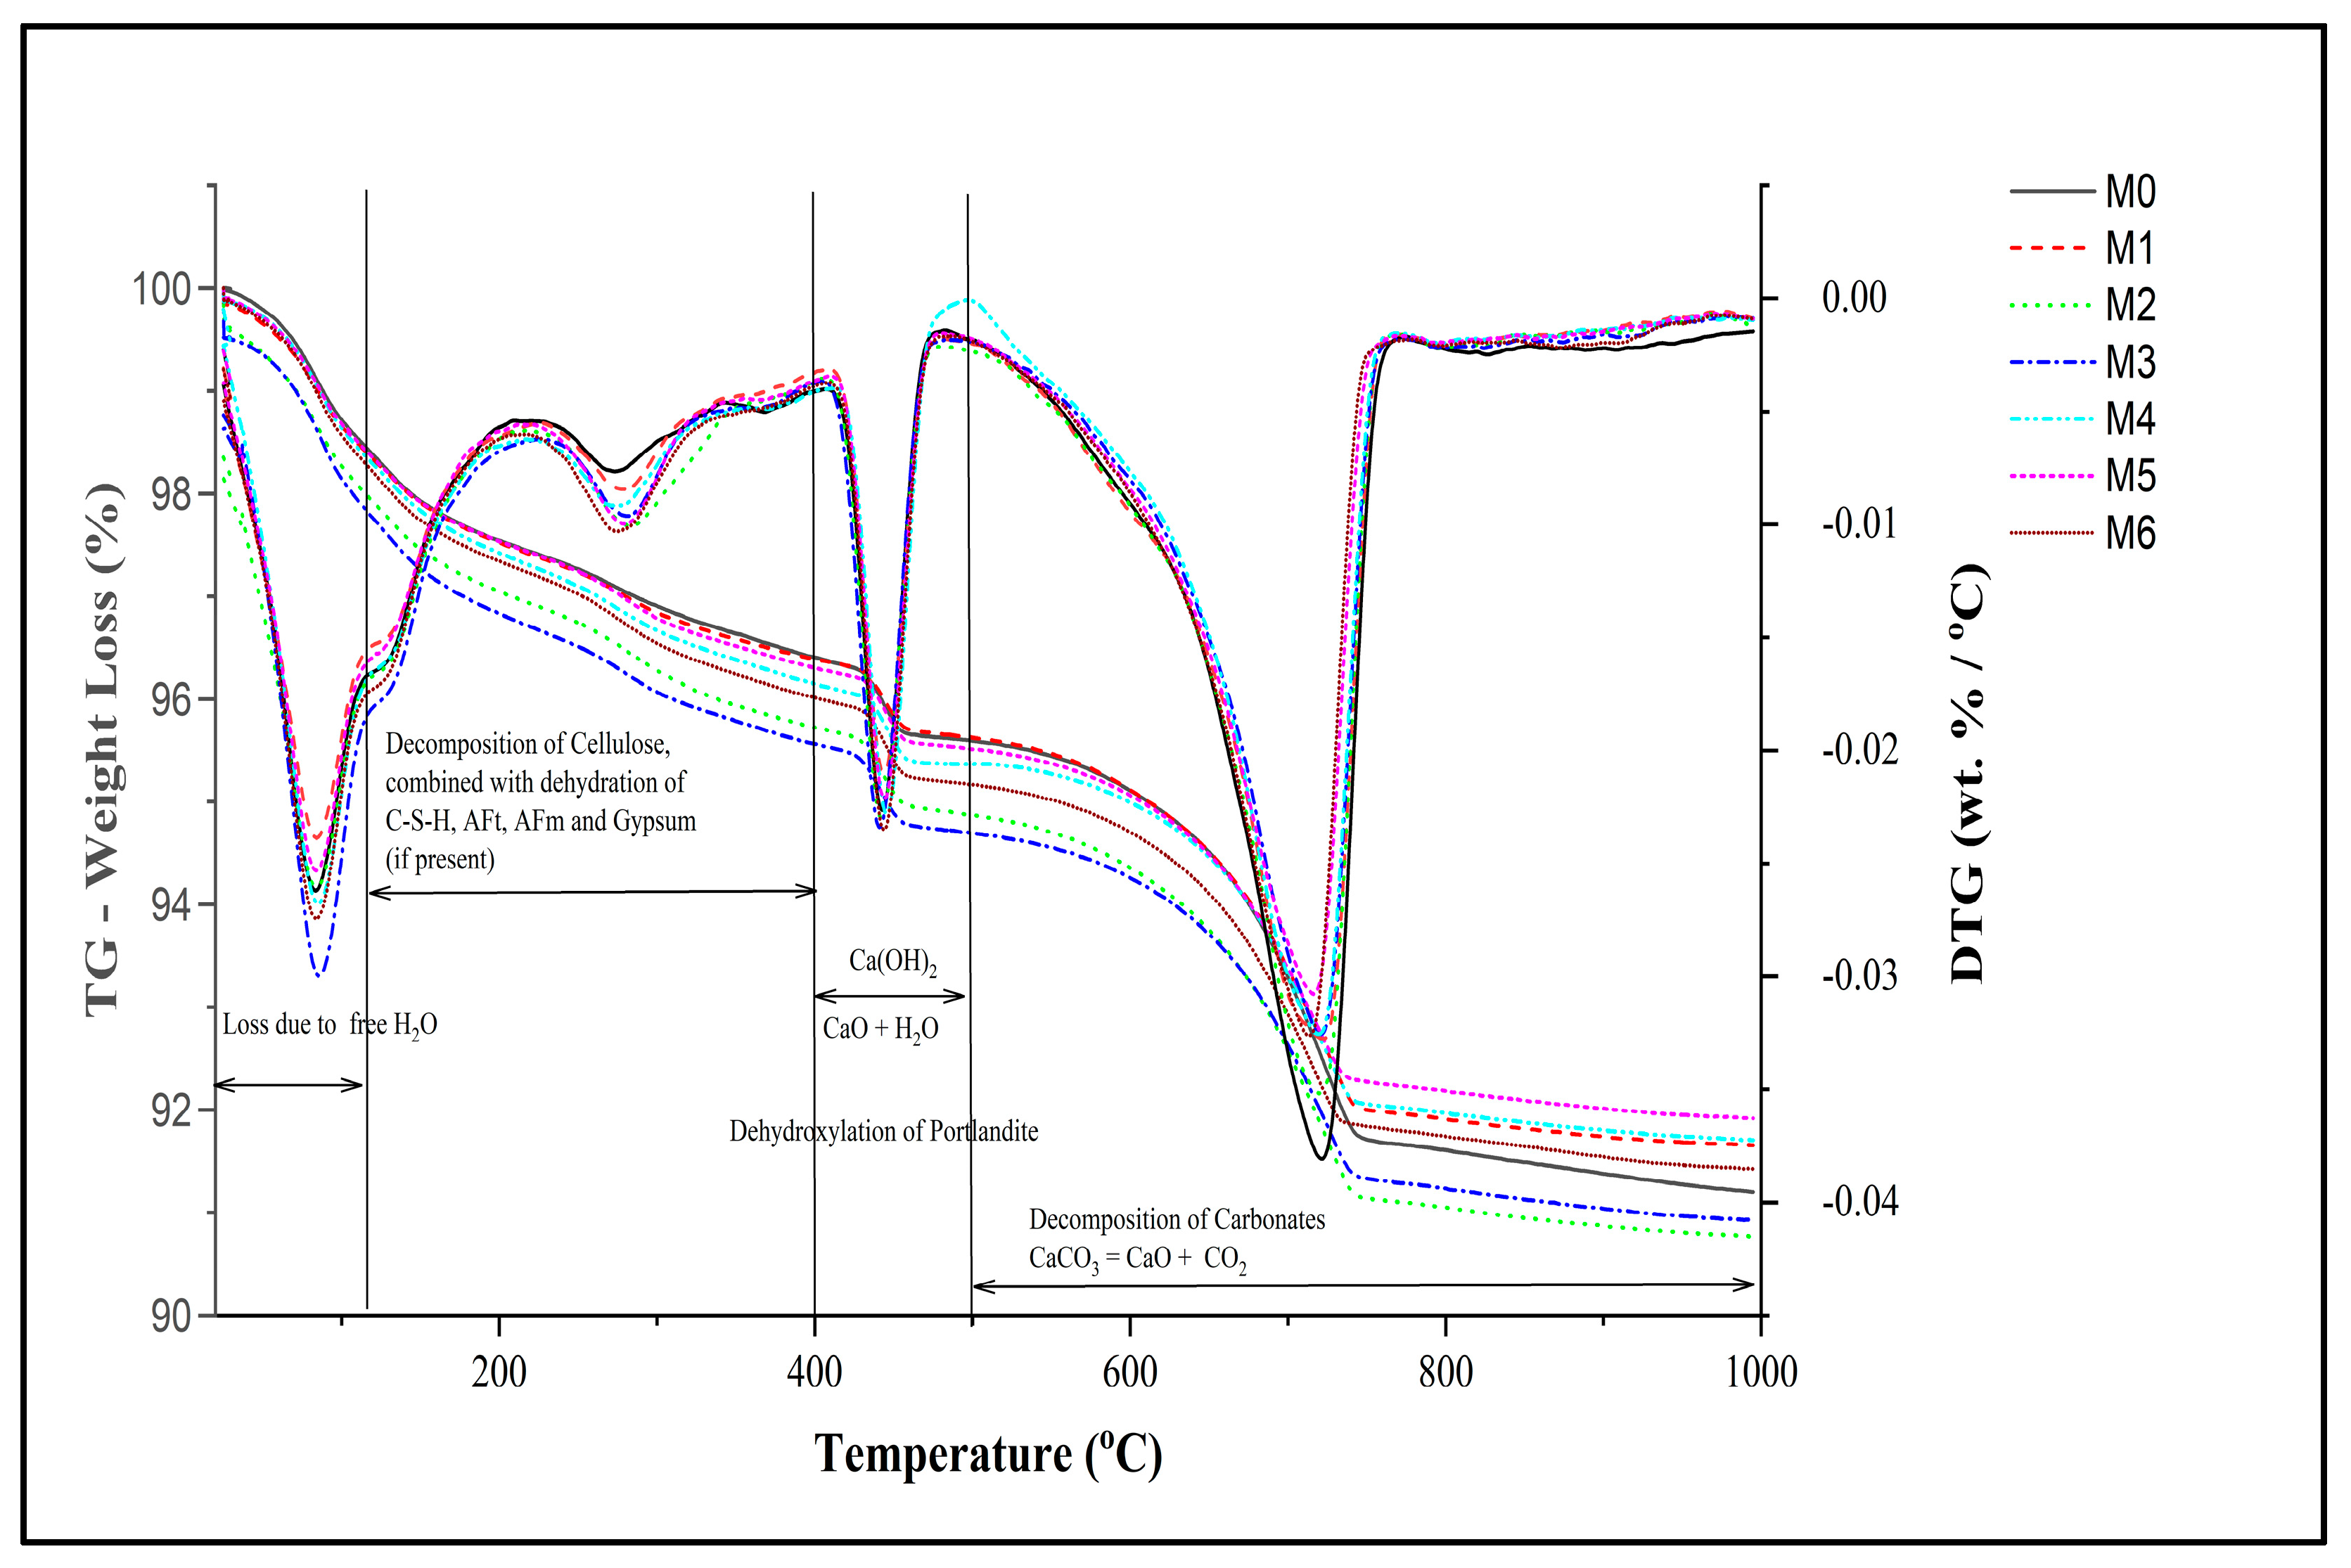
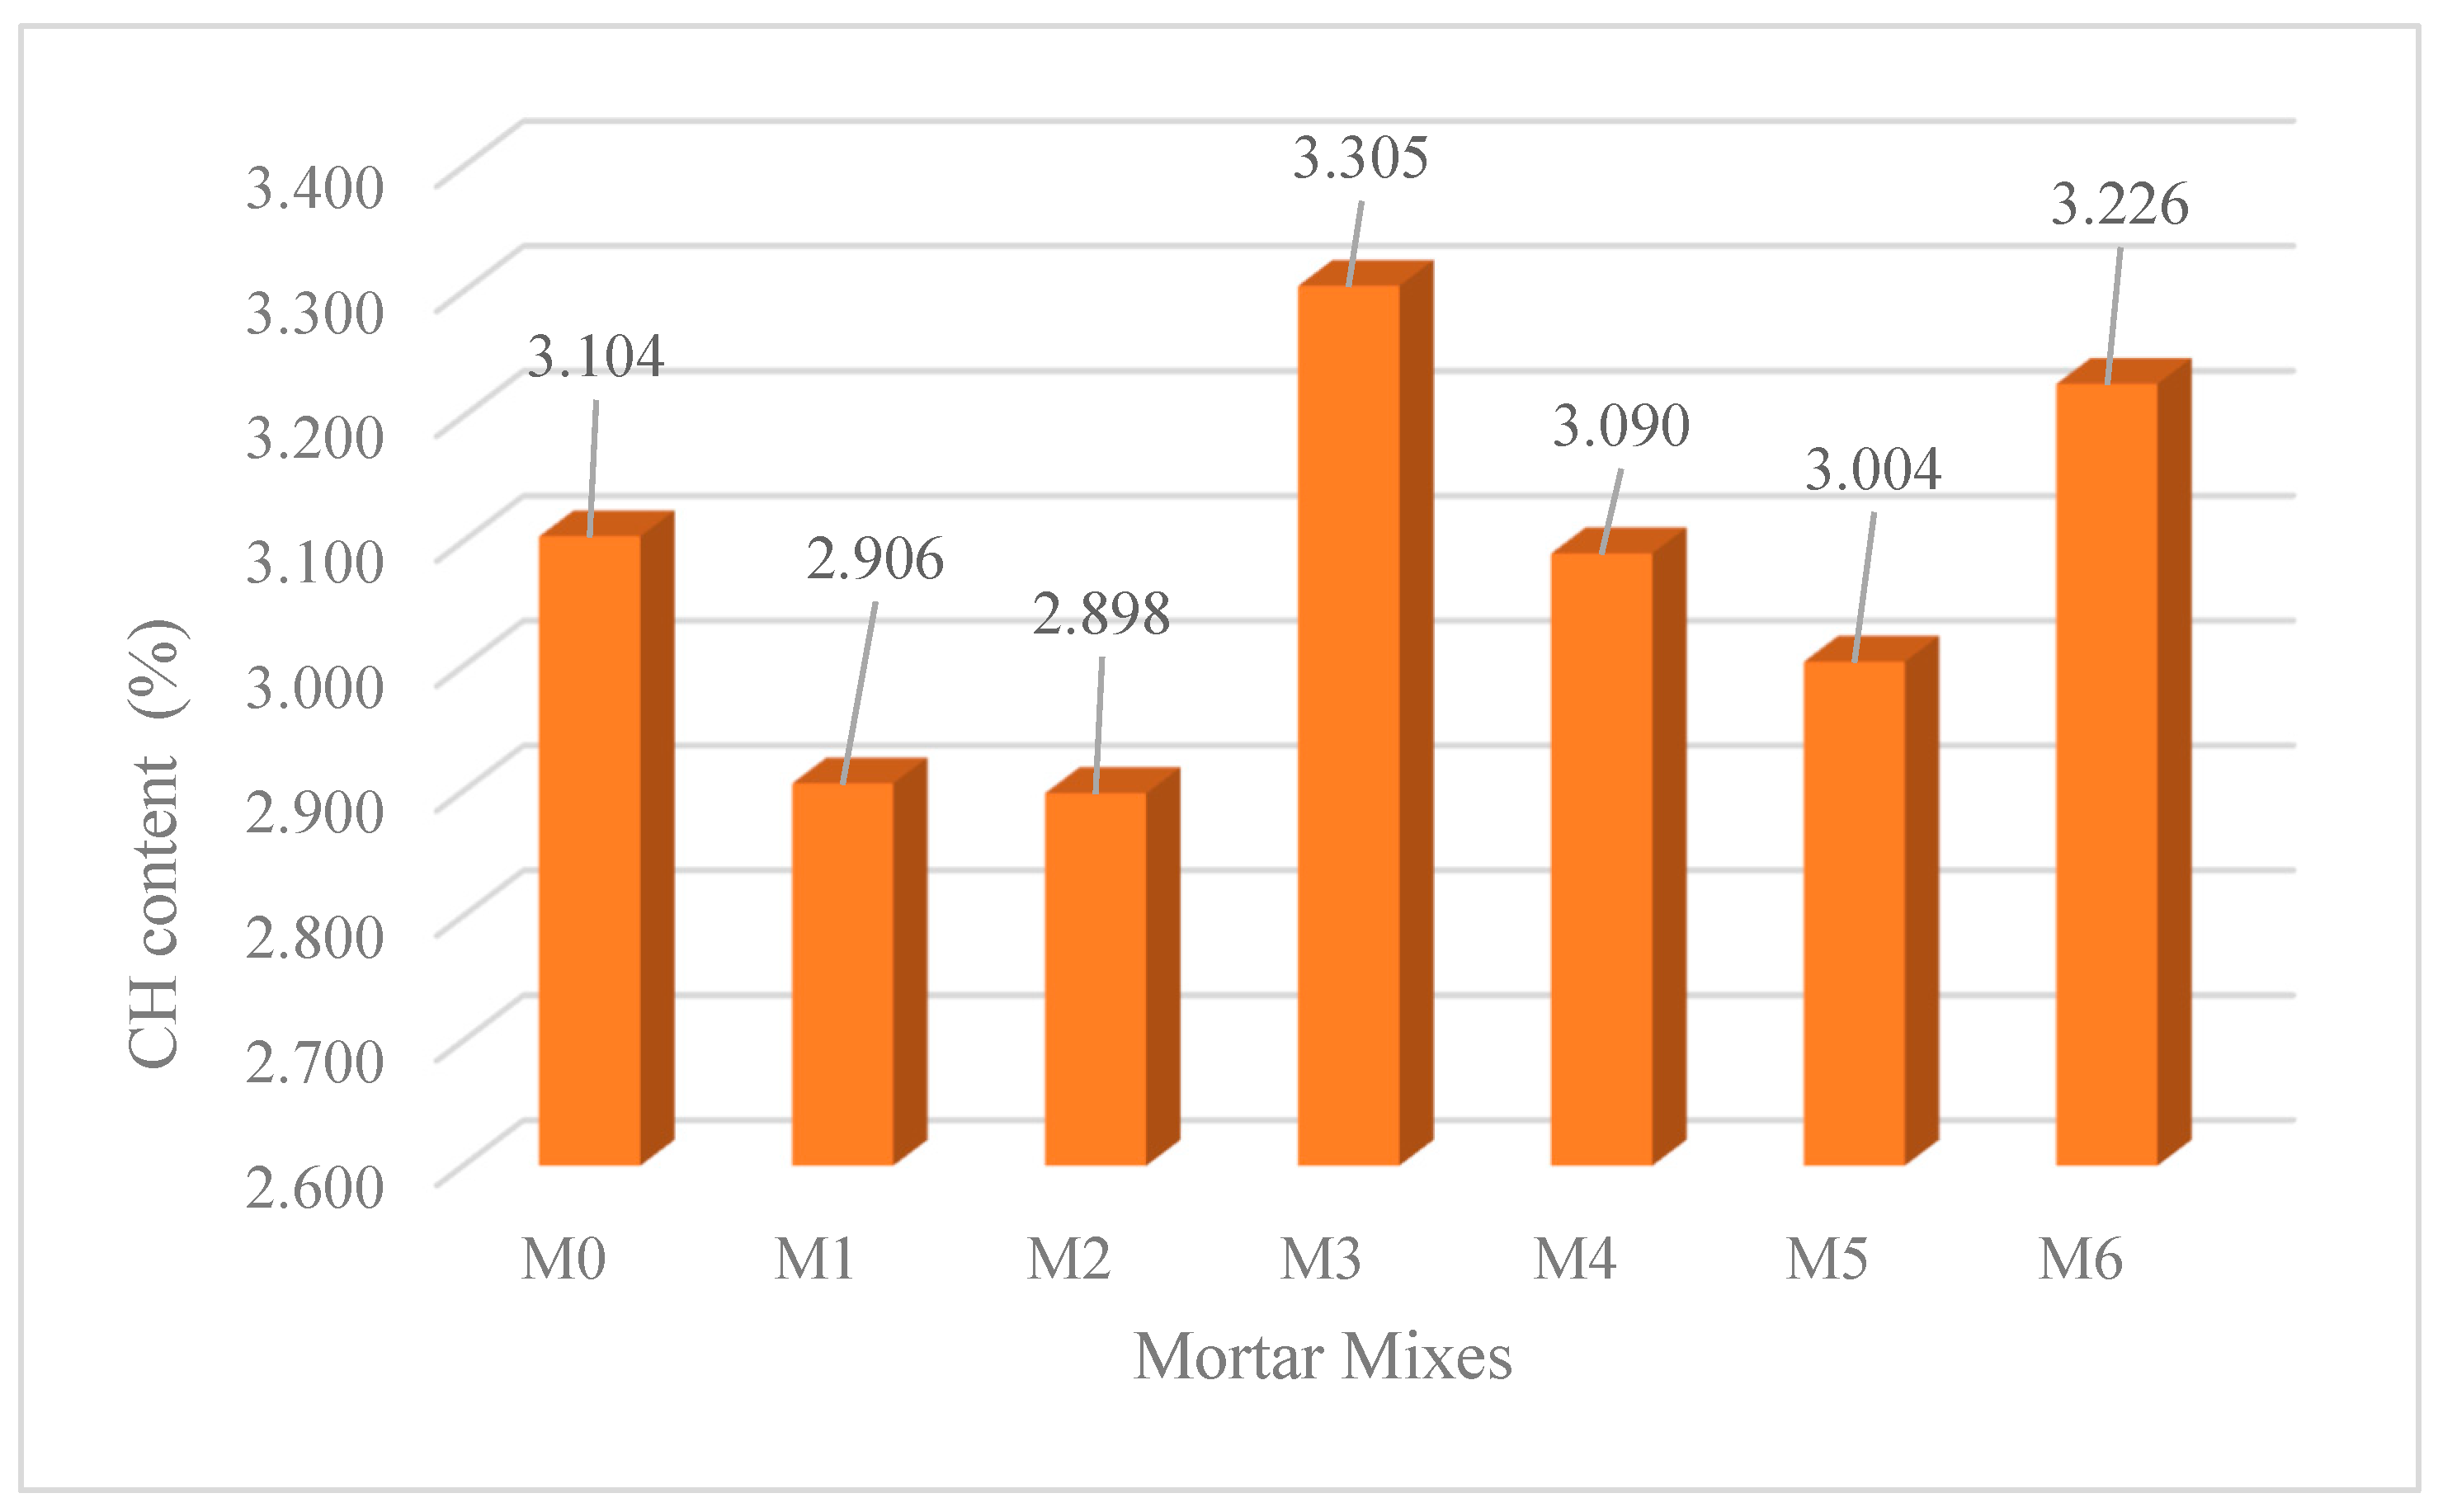
3.6. Thermogravimetric Analysis
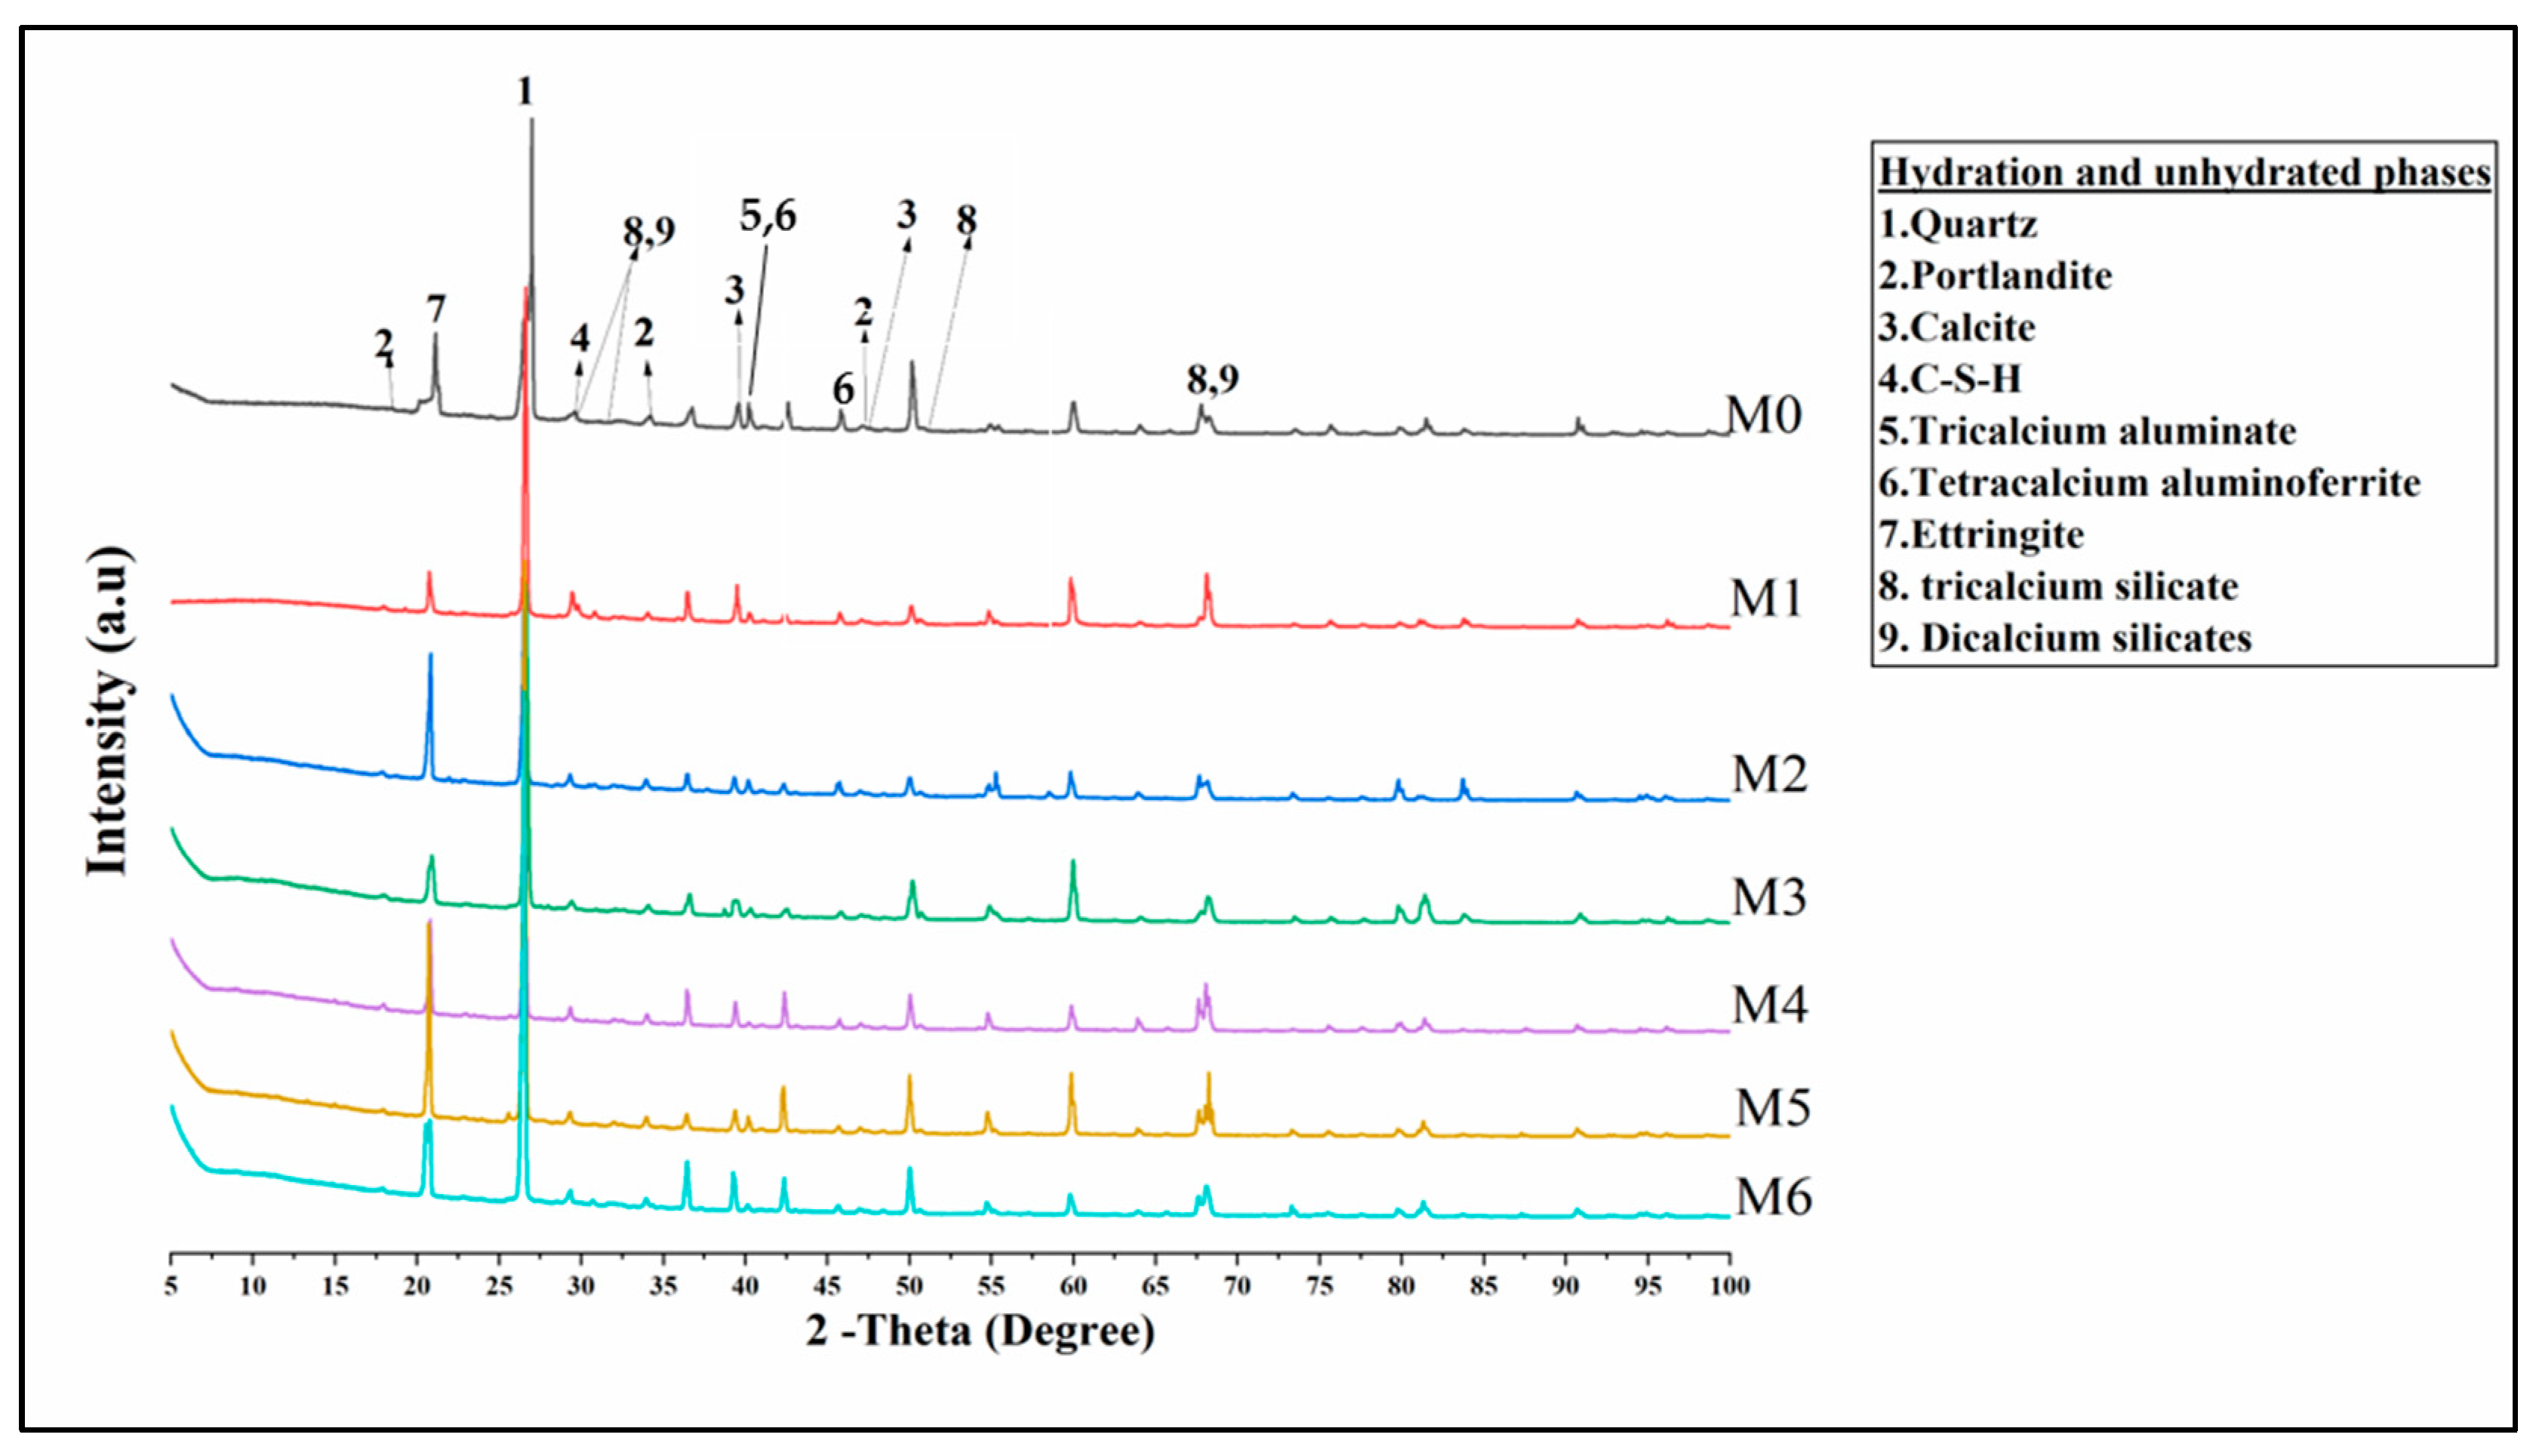
Figure 10 and Table 3 show different decomposition phases at different temperature ranges of the hydration products for the mortar mixes. The WLF (weight loss due to free water) across the different mixes at temperatures up to 105 °C agrees with results obtained from the literature [39,40]. Weight losses between 210 and 410 °C are usually associated with the decomposition of cellulose combined with dehydration of calcium silicate hydrate (C-S-H) and aluminate ferrite tetra calcium aluminate hydrate (Aft) phases. These observations have been reported in the literature [41,42].
The addition of cellulose fibres slightly varies the calcium hydroxide (CH) content across different mixes, as shown in Table 4. The highest CH content is in M3 (0.45% CF), while the lowest is in M1 (0.15% CF). This suggests that cellulose fibre affects the hydration of cement mortar, possibly by influencing the water distribution and retention within the matrix [27]. Since the mixes were cured in the air, the presence of calcite (CC) is likely due to natural carbonation from CO2 in the atmosphere. The trend, as observed from the data, shows reduced calcite content with higher cellulose fibre content, which suggests that cellulose fibres reduce the extent of carbonation. This could be due to the fibres affecting the pore structure, making it less permeable to CO2 access. Reduced carbonation might be beneficial for long-term durability as excessive carbonation can lead to shrinkage and cracking in mortars and concretes.
Table 4 and Figure 11 provide more detailed analysis obtained using Equations (1)–(5). The notations in the equations are defined as: WLCH (loss due to CH decomposition), WLCALCITE (loss due to calcite decomposition), WLF (loss due to free water), WLB (loss due to bound water from 105 to 410 °C), and WLT (total weight loss in the sample from 35 to 1000 °C). The degree of hydration (%) indicates how much of the cement has reacted during the hydration process, and it is calculated as W L B 0.23 [4,22,40,42]. M1 and M2 show relatively stable degree of hydration between 11.92 and 11.95%, which suggests minimal influence on the hydration compared to the control mortar. This aligns with findings from studies by Kulisch et al. [4] that report minimal impact on hydration at low fibre contents due to the lack of fibre agglomeration in the mortar matrix. Further observations, as shown in Table 4, indicate an increase in the degree of hydration at moderate CF contents for M3 (0.45% CF) and M4 (0.51% CF), which might be due to good fibre dispersion, leading to fibre matrix interaction and potential improvement in hydration. Higher CF percentages tend to show variability as observed in M5 and M6. The drop at 0.99% CF in M5 suggests that excessive CF may hinder the hydration process, possibly due to poor fibre–matrix bonding or agglomeration issues, though this effect is somewhat mitigated at 1.5% CF content. This indicates that higher cellulose fibre content potentially interferes with the full hydration of the cement, possibly by either reducing the availability of water for hydration or by altering the internal curing conditions within the mortar. Similar conclusions have been drawn by Sangkeaw et al. [30]. M3 (0.45% CF) appears to strike a balance between maintaining hydration and incorporation of cellulose fibres. This suggests that there may be an optimal range of cellulose fibre content that maximizes the benefits of the fibres without significantly compromising hydration [4,22,31,32,33,34,42].
WLT = WLB + WLF
WLT = WLT − WLCH − WLCalcite − WLCellulose
Ca ( OH ) 2 ,   measured = WL CH × m C H m H 2 O = W L CH × 74 18
CaCO 3 ,   measured = WL Calcite × M c a l c i t e m C O 2 = W L Calcite × 100 44
Degree   of   hydration = W L B 0.23
where WLB is chemically bound water (CBW). Also, 1 g of anhydrous cement produces 0.23 g of CBW [40,43,44].

3.7. XRD Analysis

XRD analysis of mortar with different CF contents and the corresponding diffraction patterns after 28 days of curing are shown in Figure 12. The XRD diffraction patterns of all mortar mixes with CF show similar hydration products of portlandite or CH at around 18.1°, 34.1°, 47.1° (2θ), poorly crystallised C-S-H around 29–32° (2θ), ettringite at 21.9°, very stable quartz peaks at 26.6° indicating it is not affected by the CF content; the presence of calcite (CaCO3) is observed at 39.5°, 47.5° and unhydrated silicates such as C3S (with peaks around 29.3°, 32.2°, 51°), and C2S (32.6°), which may be due to incomplete hydration. M0 without CF shows prominent peaks for portlandite and ettringite. As the CF increases, the intensity of some peaks like the portlandite seems to decrease slightly. These hydration products and unhydrated minerals are not different from the control mortar. The inclusion of CF does not seem to have a significant effect on the phases formed but may slightly result in peak intensity reduction, mostly associated with portlandite and other crystalline phases, which suggests minimal effect on the crystallinity of the mixes as the CF content increases. Similar hydration products have been reported in the literature [7,8]. Thus, no new hydration product was formed by addition of CF.

4. Conclusions

The study promotes the use of recycled cellulose fibres in mortars, which helps reduce the reliance on non-renewable resources. By carefully managing CF content, it is possible to achieve an acceptable balance between workability, mechanical strength, and durability. The following conclusions can be drawn from the study on the effect of cellulose fibre on OPC mortars:
The incorporation of cellulose fibre into the mortar matrix decreases the workability and flexural strength as the amount of CF increases in the mix. CF contents up to 0.51% (M1–M4) maintain flexural strength within 10% of the control sample. Higher CF contents (>0.99%) result in a statistically significant strength reduction, which is greater than 10% of the control mortar flexural strength. The optimal CF content appears to be in the 0.15–0.51% range (M1–M4), balancing any benefits of fibre addition with minimal strength impact. The compressive strength of M1, M3, and M4 mortar at 28 days marginally increased by 1.6%, 6.8%, and 1.9%, respectively, but was significantly reduced at CF dosage over 0.99% CF. M0–M4 show overlapping error ranges for compressive strength values, suggesting differences may not be statistically significant. M5 and M6 show clear, statistically significant strength reductions.
Incorporation of CF at 0.15% and 0.45% into the mortar matrix results in lower drying shrinkage than the control mortar, while higher dosages cause a marginal rise in the drying shrinkage than the control mortar. The cellulose fibre content of 0.45% causes a very significant reduction in surface shrinkage cracking in the mortar compared to the control mortar without CF. These findings suggest that an optimal CF content and dispersion are key to achieving both reduced shrinkage and enhanced crack resistance.
The cellulose fibres in the mortar matrix M3 result in larger pore size formation, thereby making the mortar mixes more porous compared to the control mortar without CF. The effects on pore structure appear to be dosage-dependent, with the highest CF content (M3) showing the most significant changes in both total porosity and pore size distribution.
The TGA analysis shows that, in the presence of CF, fewer hydration products with unreacted alites and belites were formed at 28 days of curing. Optimal CF content of 0.45% CF enhances degree of hydration and portlandite content while reducing carbonation, suggesting this as an optimal range for balancing hydration, strength, and durability. Likewise, higher CF contents may disrupt hydration or introduce variability, but they can also benefit long-term durability by reducing carbonation and its negative effects on shrinkage and cracking. Furthermore, the addition of cellulose fibres can provide better control over water retention and internal curing, influencing the overall hydration process. This phenomenon could benefit long-term durability and strength development by the gradual release of the absorbed water in the fibres for continuous hydration of the anhydrite alites and belites.
The addition of cellulose fibres from wood affects both the hydration and carbonation processes within the cement mortar, likely due to changes in water retention and pore structure. At high CF content, the degree of hydration is reduced, which affects the strength development of the mortar. M3 (0.45% CF) seems to be a balanced mix, suggesting an optimal cellulose fibre content for achieving good hydration, which improves mechanical and durability properties. This balance between using sustainable materials (like cellulose fibres) without significantly compromising structural performance aligns with sustainability goals.

Author Contributions

Conceptualization, P.S.M.; Methodology, P.S.M. and T.A.; Formal analysis, T.A.; Investigation, T.A.; Data curation, T.A.; Writing—original draft, T.A.; Writing—review & editing, P.S.M. and T.A.; Supervision, P.S.M. All authors have read and agreed to the published version of the manuscript.

Funding

This research received no external funding.

Institutional Review Board Statement

Not applicable.

Informed Consent Statement

Not applicable.

Data Availability Statement

The data presented in this study are available on request from the corresponding author.

Acknowledgments

The authors acknowledge Sappi Netherlands Services BV, Maastricht, The Netherlands for the supply of cellulose fibre used in this study. Technical support from Olalekan Ojedokun, Tony Bell, Francis Sweeney, and Fin O Flaherty of Materials Engineering Research Institute, Sheffield Hallam University is also acknowledged.

Conflicts of Interest

The authors declare no conflict of interest.

References

  1. Arbelaiz, A.; Ibarbia, J.; Imaz, B.; Soto, L. Natural Fiber–Reinforced Cement Mortar Composite Physico Mechanical Properties: From Cellulose Microfibers to Nanocellulose. J. Mater. Civ. Eng. 2023, 35, 4023094. [Google Scholar] [CrossRef]
  2. Ardanuy, M.; Claramunt, J.; García-Hortal, J.; Bizinotto, M.B. Fiber-Matrix Interactions in Cement Mortar Composites Reinforced with Cellulosic Fibers. Cellulose 2011, 18, 281–289. [Google Scholar] [CrossRef]
  3. Zaki, S.I. Application of ultra cellulose fiber for the enhancement of the durability and shrinkage of cement pastes exposed to normal and aggressive curing conditions. Nanotechnol. Constr. A Sci. Internet-J. 2015, 8, 121–142. [Google Scholar] [CrossRef]
  4. Kulisch, D.; Katz, A.; Zhutovsky, S. Quantification of Residual Unhydrated Cement Content in Cement Pastes as a Potential for Recovery. Sustainability 2023, 15, 263. [Google Scholar] [CrossRef]
  5. Pandey, K.; Pal, T.; Sharma, R.; Kar, K.K. Study of Matrix–Filler Interaction through Correlations between Structural and Viscoelastic Properties of Carbonous-Filler/Polymer-Matrix Composites. J. Appl. Polym. Sci. 2020, 137, 48660. [Google Scholar] [CrossRef]
  6. Luna, F.; Pérez, A.; Alonso, M. The Influence of Curing and Aging on Chloride Transport through Ternary Blended Cement Concrete. Mater. Construcc. 2018, 68, 171. [Google Scholar] [CrossRef]
  7. Mejdoub, R.; Hammi, H.; Suñol, J.J.; Khitouni, M.; M’nif, A.; Boufi, S. Nanofibrillated Cellulose as Nanoreinforcement in Portland Cement: Thermal, Mechanical and Microstructural Properties. J. Compos. Mater. 2017, 51, 2491–2503. [Google Scholar] [CrossRef]
  8. D’Erme, C.; Caseri, W.R.; Santarelli, M.L. Effect of Fibrillated Cellulose on Lime Pastes and Mortars. Materials 2022, 15, 459. [Google Scholar] [CrossRef]
  9. Kawashima, S.; Shah, S.P. Early-Age Autogenous and Drying Shrinkage Behavior of Cellulose Fiber-Reinforced Cementitious Materials. Cem. Concr. Compos. 2011, 33, 201–208. [Google Scholar] [CrossRef]
  10. ISO 15901-1:2016; Evaluation of Pore Size Distribution and Porosity of Solid Materials by Mercury Porosimetry and Gas Adsorption—Mercury Porosimetry. ISO: Geneva, Switzerland, 2016.
  11. EN 1008:2002; Mixing Water for Concrete. Specification for Sampling, Testing and Assessing the Suitability of Water, Including Water Recovered from Processes in the Concrete Industry, as Mixing Water for Concrete. The European Standard: Brussels, Belgium, 2002.
  12. Sappi Maastricht B.V. Valida. Available online: https://www.sappi.com/valida-home (accessed on 20 January 2025).
  13. Ojedokun, O.O.; Mangat, P.S. Chemical composition and physico-mechanical properties of carbonated alkali activated concrete and mortar. J. Build. Eng. 2023, 71, 106480. [Google Scholar] [CrossRef]
  14. Agunbiade, T.; Mangat, P.S. Mechanical and Chemical Properties of Nanocellulose Fibre Reinforced Mortar. In Proceedings of the Sixth International Conference on Sustainable Construction Materials and Technologies, Lyon, France, 9–14 June 2024; pp. 347–360. [Google Scholar] [CrossRef]
  15. BS EN 1015-3:1999; Methods of Test for Mortar for Masonry. Determination of Consistency of Fresh Mortar (by Flow Table). BSI Knowledge: London, UK, 1999.
  16. BS EN 12390-4:2019; Testing Hardened Concrete. Compressive Strength. Specification for Testing Machines. British Standard: London, UK, 2019.
  17. BS EN 1881-206:1986; Testing Concrete. Recommendations for Determination of Strain in Concrete. British Standard: London, UK, 1986.
  18. BS EN 812-103.2:1989; Testing Aggregates. Method for Determination of Particle Size Distribution. Sedimentation Test View Details. British Standard: London, UK, 1989.
  19. Malvern Panalytical. PANalytical. X’Pert HighScore; Version 5.1; Malvern Panalytical B.V.: Almelo, The Netherlands, 2021. [Google Scholar]
  20. Poletto, M.; Pistor, V.; Zeni, M.; Zattera, A.J. Crystalline properties and decomposition kinetics of cellulose fibers in wood pulp obtained by two pulping processes. Polym. Degrad. Stab. 2011, 96, 679–685. [Google Scholar] [CrossRef]
  21. Rosa, M.D.; Medeiros, E.; Malmonge, J.A.; Gregorski, K.S.; Wood, D.F.; Mattoso, L.H.; Glenn, G.; Orts, W.J.; Imam, S.H. Cellulose nanowhiskers from coconut husk fibers: Effect of preparation conditions on their thermal and morphological behavior. Carbohydr. Polym. 2010, 81, 83–92. [Google Scholar] [CrossRef]
  22. Wu, J.; Ding, Q.; Yang, W.; Wang, L.; Wang, H. Influence of Submicron Fibrillated Cellulose Fibers from Cotton on Hydration and Microstructure of Portland Cement Paste. Molecules 2021, 26, 5831. [Google Scholar] [CrossRef]
  23. Goncalves, J.; El-Bakkari, M.; Boluk, Y.; Bindiganavile, V. Cellulose nanofibres (CNF) for sulphate resistance in cement based systems. Cem. Concr. Compos. 2019, 99, 100–111. [Google Scholar] [CrossRef]
  24. Hoyos, C.G.; Zuluaga, R.; Gañán, P.; Pique, T.M.; Vazquez, A. Cellulose nanofibrils extracted from fique fibers as bio-based cement additive. J. Clean. Prod. 2019, 235, 1540–1548. [Google Scholar] [CrossRef]
  25. Panda, S.S.; Bisaria, S.K.; Singh, M.R. The spectroscopic and microscopic evaluation of cellulose used in conservation of archival materials. Microchem. J. 2021, 160, 105707. [Google Scholar] [CrossRef]
  26. Zhao, H.; Kwak, J.; Conradzhang, Z.; Brown, H.; Arey, B.; Holladay, J. Studying cellulose fiber structure by SEM, XRD, NMR and acid hydrolysis. Carbohydr. Polym. 2007, 68, 235–241. [Google Scholar] [CrossRef]
  27. Sawsen, C.; Fouzia, K.; Mohamed, B.; Moussa, G. Effect of flax fibers treatments on the rheological and the mechanical behavior of a cement composite. Constr. Build. Mater. 2015, 79, 229–235. [Google Scholar] [CrossRef]
  28. Buch, N.; Rehman, O. Impact of Processed Cellulose Fibers on Portland Cement Concrete Properties. Transp. Res. Rec. 1999, 1668, 72–80. [Google Scholar] [CrossRef]
  29. Wu, F.; Yu, Q.; Liu, C.; Brouwers, H.J.H.; Wang, L.; Liu, D. Effect of fibre type and content on performance of bio-based concrete containing heat-treated apricot shell. Mater. Struct. 2020, 53, 137. [Google Scholar] [CrossRef]
  30. Sangkeaw, P.; Thongchom, C.; Keawsawasvong, S.; Prasittisopin, L. Mechanical Properties and Microstructure of Cellulose Fiber- and Synthetic Fiber-Reinforced High-Strength Concrete. Arab. J. Sci. Eng. 2025, 50, 2149–2168. [Google Scholar] [CrossRef]
  31. Rocha, D.L.; Júnior, L.T.; Marvila, M.; Pereira, E.; Souza, D.; de Azevedo, A. A Review of the Use of Natural Fibers in Cement Composites: Concepts, Applications and Brazilian History. Polymers 2022, 14, 2043. [Google Scholar] [CrossRef]
  32. MacVicar, R.; Matuana, L.M.; Balatinecz, J.J. Aging mechanisms in cellulose fiber reinforced cement composites. Cem. Concr. Compos. 1999, 21, 189–196. [Google Scholar] [CrossRef]
  33. Lee, H.-J.; Kim, S.-K.; Lee, H.-S.; Kim, W. A Study on the Drying Shrinkage and Mechanical Properties of Fiber Reinforced Cement Composites Using Cellulose Nanocrystals. Int. J. Concr. Struct. Mater. 2019, 13, 39. [Google Scholar] [CrossRef]
  34. Ban, Y.; Zhi, W.; Fei, M.; Liu, W.; Yu, D.; Fu, T.; Qiu, R. Preparation and Performance of Cement Mortar Reinforced by Modified Bamboo Fibers. Polymers 2020, 12, 2650. [Google Scholar] [CrossRef]
  35. Filho, R.D.T.; Ghavami, K.; Sanjuán, M.A.; Free, G.L.E. Restrained and drying shrinkage of cement mortar composites reinforced with vegetable fibres. Cem. Concr. Compos. 2005, 27, 537–546. [Google Scholar] [CrossRef]
  36. Aitcin, P.C.; Neville, A.; Acker, P. Integrated view of shrinkage deformation. Concr. Int. 1997, 19, 35–41. [Google Scholar]
  37. Filho, R.D.T. Natural Fibre Reinforced Mortar Composites: Experimental Characterisation; DEC-PUC: Rio de Janeiro, Brazil, 1997. [Google Scholar]
  38. Onuaguluchi, O.; Banthia, N. Plant-based natural fibre reinforced cement composites: A review. Cem. Concr. Compos. 2016, 68, 96–108. [Google Scholar] [CrossRef]
  39. Collier, N.C. Transition and decomposition temperatures of cement phases—A collection of thermal analysis data. Ceram.-Silik. 2016, 60, 338–343. [Google Scholar] [CrossRef]
  40. Taylor, H.F.W. Cement Chemistry, 2nd ed.; Thomas Telford Publishing: London, UK, 1997. [Google Scholar]
  41. El-Sayed, S.A.; Mostafa, M.E. Kinetic Parameters Determination of Biomass Pyrolysis Fuels Using TGA and DTA Techniques. Waste Biomass Valorization 2015, 6, 401–415. [Google Scholar] [CrossRef]
  42. Scrivener, K.; Snellings, R.; Lothenbach, B. A Practical Guide to Microstructural Analysis of Cementitious Materials; CRC Press: Boca Raton, FL, USA, 2016. [Google Scholar]
  43. Powers, T.C.; Brownyard, T.L. Studies of the Physical Properties of Hardened Portland Cement Paste. ACI J. Proc. 1947, 43, 933–992. [Google Scholar] [CrossRef]
  44. Neville, A.M. Properties of Concrete; Pearson Education Limited: Harlow, UK, 2012. [Google Scholar]
Figure 1. Flow chart of testing procedures.
Sustainability 17 02719 g001
Figure 2. FT-IR spectra of cellulose fibre showing various functional groups.
Sustainability 17 02719 g002
Figure 3. (a) SEM image of CF at 1000× magnification. (b) Cellulose fibre network and morphology at 10,000× magnification. (c) EDS spectrum showing primary composition of CF. (d) Chemical structure of CF, Source [12].
Sustainability 17 02719 g003
Figure 4. Flow curve of mortar mixes.
Sustainability 17 02719 g004
Figure 5. Relationship between flexural strength and CF content.
Sustainability 17 02719 g005
Figure 6. Relationship between compressive strength and CF content.
Sustainability 17 02719 g006
Figure 7. Drying shrinkage (microstrain) of mortar mixes as a function of age (days).
Sustainability 17 02719 g007
Figure 8. (a) Control mortar without CF. (b) Mortar with 0.45 CF.
Sustainability 17 02719 g008
Figure 9. (a) A differential pore volume curve for mortar mixes. (b) A cumulative pore volume curve for mortar mixes.
Sustainability 17 02719 g009aSustainability 17 02719 g009b
Figure 10. Combined TG-DTG curves of mortar mixes after 28 days of curing.
Sustainability 17 02719 g010
Figure 11. CH content of mortar mixes from TGA analysis.
Sustainability 17 02719 g011
Figure 12. XRD patterns of mortar mixes from 5° (2θ) to 100° (2θ).
Sustainability 17 02719 g012
Table 1. Oxide composition of Portland cement and Sharp sand.
wt.%
OxidesSiO2Al2O3Fe2O3CaOMgOK2ONa2OTiO2P2O5MnOSO3LOI
OPC11.108.353.1664.202.091.190.231.882.012.143.600.05
Sharp Sand91.706.101.620.280.03-0.21----0.06
Specific gravity of OPC cement 3.15 g/cm3 [13]. Specific gravity of sand 2.53 g/cm3 [13].
Table 2. CF content for mortar mixes.
wt.% of Mortar
MixesM0M1M2M3M4M5M6
CF content00.150.310.450.510.991.50
Table 3. TGA-DTG decomposition phases at different temperatures in mortar mixes after 28 days of curing in wt.%.
Mortar MixesWLF
35–105 °C
WLB
105–210 °C
WLB
210–350 °C
WLB
350–410 °C
WLCH%
410–480 °C
WLCALCITE%
480–750 °C
WLT%
35–1000 °C
M0—0%CF1.4760.9430.8530.2730.7553.9628.726
M1—0.15%CF1.4040.9100.8960.2280.7073.6978.178
M2—0.31%CF1.4040.9130.8950.2360.7053.6958.140
M3—0.45%CF1.6491.0620.9910.2680.8043.4378.547
M4—0.51%CF1.4530.9870.9890.2840.7523.3478.122
M5—0.99%CF1.4360.9270.9700.2600.7313.3087.927
M6—1.5%CF1.5380.9861.0460.2790.7853.3988.389
Table 4. TGA-DTG quantification of CH and calcite (CC) in mortar mixes.
Mortar MixesCH Measured (%)CC Measured (%)WLF (%)WLB (%)WLT (%)Degree of Hydration (%)
M0—0% CF3.1049.0041.4762.5334.00912.28
M1—0.15% CF2.9068.4021.4042.2213.62411.92
M2—0.31% CF2.8988.3971.4042.0263.43011.95
M3—0.45% CF3.3057.8121.6492.2073.85513.59
M4—0.51% CF3.0907.6061.4532.0603.51313.09
M5—0.99% CF3.0047.5191.4361.4622.89812.55
M6—1.5% CF3.2267.7241.5381.1682.70613.46
Disclaimer/Publisher’s Note: The statements, opinions and data contained in all publications are solely those of the individual author(s) and contributor(s) and not of MDPI and/or the editor(s). MDPI and/or the editor(s) disclaim responsibility for any injury to people or property resulting from any ideas, methods, instructions or products referred to in the content.

