Article

Not Always an Amenity: Green Stormwater Infrastructure Provides Highly Variable Ecosystem Services in Both Regulatory and Voluntary Contexts

by
Joanna P. Solins
1,2,*,
Mary L. Cadenasso
1,
Logan E. G. Brissette
1,3 and
Steward T. A. Pickett
4
1
Department of Plant Sciences, University of California, Davis, 1 Shields Ave., Davis, CA 95616, USA
2
Division of Agriculture and Natural Resources, University of California, Davis, CA 95616, USA
3
Smithsonian Tropical Research Institute, Balboa, Ancon, Panama P.O. Box 0843-03092, Panama
4
Cary Institute of Ecosystem Studies, Box AB, Millbrook, NY 12545, USA
*
Author to whom correspondence should be addressed.
Sustainability 2025, 17(6), 2648; https://doi.org/10.3390/su17062648
Submission received: 10 February 2025 / Revised: 7 March 2025 / Accepted: 10 March 2025 / Published: 17 March 2025
(This article belongs to the Special Issue Sustainable Stormwater Management and Green Infrastructure)

Abstract

:
Green stormwater infrastructure (GSI) is advocated for its potential to provide multiple ecosystem services, including stormwater runoff mitigation, wildlife habitat, and aesthetic value. However, the provision of these ecosystem services depends on both facility design and maintenance, which may vary based on whether GSI was installed to fulfill regulatory construction permit requirements or implemented voluntarily as part of urban greening initiatives. We evaluated 76 GSI facilities distributed across Baltimore, MD, USA, comprising 48 voluntary and 28 regulatory facilities. Each facility was scored on indicators related to the provision of stormwater, habitat, and aesthetic ecosystem services. Ecosystem service scores were highly variable, reflecting a wide range of quality and condition, but we found no significant differences between scores for regulatory and voluntary GSI. However, voluntary GSI scores tended to be higher in areas with greater socioeconomic status, while regulatory facilities showed an inverse relationship. Our findings indicate that GSI facilities can degrade quickly, and that official maintenance requirements for regulatory facilities do not guarantee upkeep. Regulatory requirements did have better outcomes in areas with lower socioeconomic status, though. Degraded GSI facilities may do more harm than good, becoming both unsightly and ineffective at providing intended stormwater or habitat benefits.

1. Introduction

Green stormwater infrastructure (GSI) has become a popular strategy to mitigate rainfall runoff in cities. GSI encompasses a set of practices designed to mimic natural hydrologic processes that are often lacking in cities, typically employing vegetation, soils, and permeable surfaces to infiltrate and treat stormwater locally [1]. Beyond its primary stormwater function, GSI is promoted for the wide-ranging co-benefits it can potentially provide, including aesthetic value, urban heat island mitigation, improved air quality, habitat enhancement, increased property values, community revitalization, recreational opportunities, and environmental education [2,3]. However, the provision of these ecosystem services depends on each GSI installation’s type, design, size, and context [2,4], as well as its construction and condition [4,5]. These factors may in turn depend on the entities responsible for installing and maintaining the GSI facilities, as well as the purpose for their construction. This study investigates the condition and ecosystem services of GSI facilities across Baltimore, MD, USA, comparing those installed to fulfill regulatory requirements to those installed as part of urban greening and community improvement efforts.
In the United States, the national Environmental Protection Agency (US EPA) supports the use of GSI to meet municipal requirements for stormwater pollution reduction through the National Pollutant Discharge Elimination System (NPDES). Cities can employ a suite of GSI interventions that actually fall along a continuum from more “gray” to more “green” [2,6]. Although the term “green infrastructure” and its associated services are still commonly applied to this entire spectrum of practices, some interventions provide limited co-benefits. For instance, permeable pavement, water cisterns, and rain barrels are popular GSI interventions that reduce stormwater runoff, but lack the ecosystem services associated with vegetation. Even GSI interventions that do feature diverse vegetation, such as bioretention basins, are often too small to contribute substantially to ecosystem services like urban heat mitigation, enhanced recreational opportunities, or habitat provision [2]. Furthermore, while regulations establish standards related to hydrology and water quality, additional benefits are often presumed, and regulatory GSI may not incorporate co-benefits into design considerations and siting decisions [7].
Maintenance is another crucial factor determining the long-term benefits of GSI [4,5]. Many types of GSI degrade without proper maintenance [8], potentially transforming them into disamenities. While regular inspections are typically required for GSI facilities to be included in municipal NPDES permitting [9], the lack of empirically validated inspection and maintenance protocols poses a challenge to effective implementation [10], and many projects have been found to be degraded soon after completion [11,12,13]. This problem may be amplified for GSI that is not installed under a regulatory framework. There are many grant-funded opportunities to install GSI features as part of urban greening and community improvement efforts [14,15,16], and these projects often face less stringent design and construction standards than regulatory GSI projects. In addition, grants typically fund only the installation of GSI, leaving non-profit organizations and community groups to figure out strategies for long-term maintenance with uncertain support. While grant-funded GSI projects are commonly designed to prioritize co-benefits as a strategy to create multi-functional community assets, their maintenance status can ultimately determine whether they remain assets or become community burdens [17].
The benefits and burdens of GSI may be unevenly and inequitably distributed. Many studies have found disparities in the overall distribution of environmental amenities and disamenities across cities, with socially disadvantaged communities often bearing greater burdens and receiving fewer benefits. For instance, park and greenspace access has been found to be lower for minorities, immigrants, communities of color, or the less affluent in many places [18,19,20,21,22]. Yet, there are other cases in which historical legacies of development and demographic trends have resulted in relatively high access to green infrastructure for traditionally disadvantaged communities [23,24,25]. In these cases, equitable access does not necessarily indicate equitable benefits—the quality or size of the amenities may still be lower in disadvantaged communities [23,26,27,28,29]. Considering the quality of green infrastructure features that are supposed to be assets can provide a more nuanced understanding of environmental equity and the sustainability of GSI as an urban greening strategy.
We previously investigated the overall distribution of GSI facilities in the city of Baltimore [30], finding contrasting patterns of implementation for GSI associated with regulatory compliance (regulatory GSI) vs. voluntary urban greening projects (voluntary GSI). While regulatory GSI was less likely to be found in areas with predominantly Black populations, voluntary GSI was more common both in low-income areas with predominantly Black populations and in high-income areas with predominantly white populations. In this study, we ask whether the quality and condition of existing GSI facilities might be contributing to inequitable access to ecosystem services in Baltimore, and whether regulatory and voluntary implementation processes lead to different outcomes. We focus on three major benefits ascribed to GSI—stormwater mitigation, habitat provision, and aesthetic value—for GSI facility types that can be designed to provide these ecosystem services, and also consider the presence of signage for environmental education. Following other studies on the quality of green infrastructure [31,32,33,34], we used a visual assessment to assign scores for metrics related to these benefits. Specifically, we ask (1) Do the size and ecosystem services of regulatory and voluntary GSI facilities differ? (2) Are the size and ecosystem services of GSI related to the sociodemographic characteristics of the areas in which they are located? (3) Do ecosystem services decrease as facilities age? These questions allow us to refine our understanding of environmental equity issues related to GSI beyond distribution alone.

2. Materials and Methods

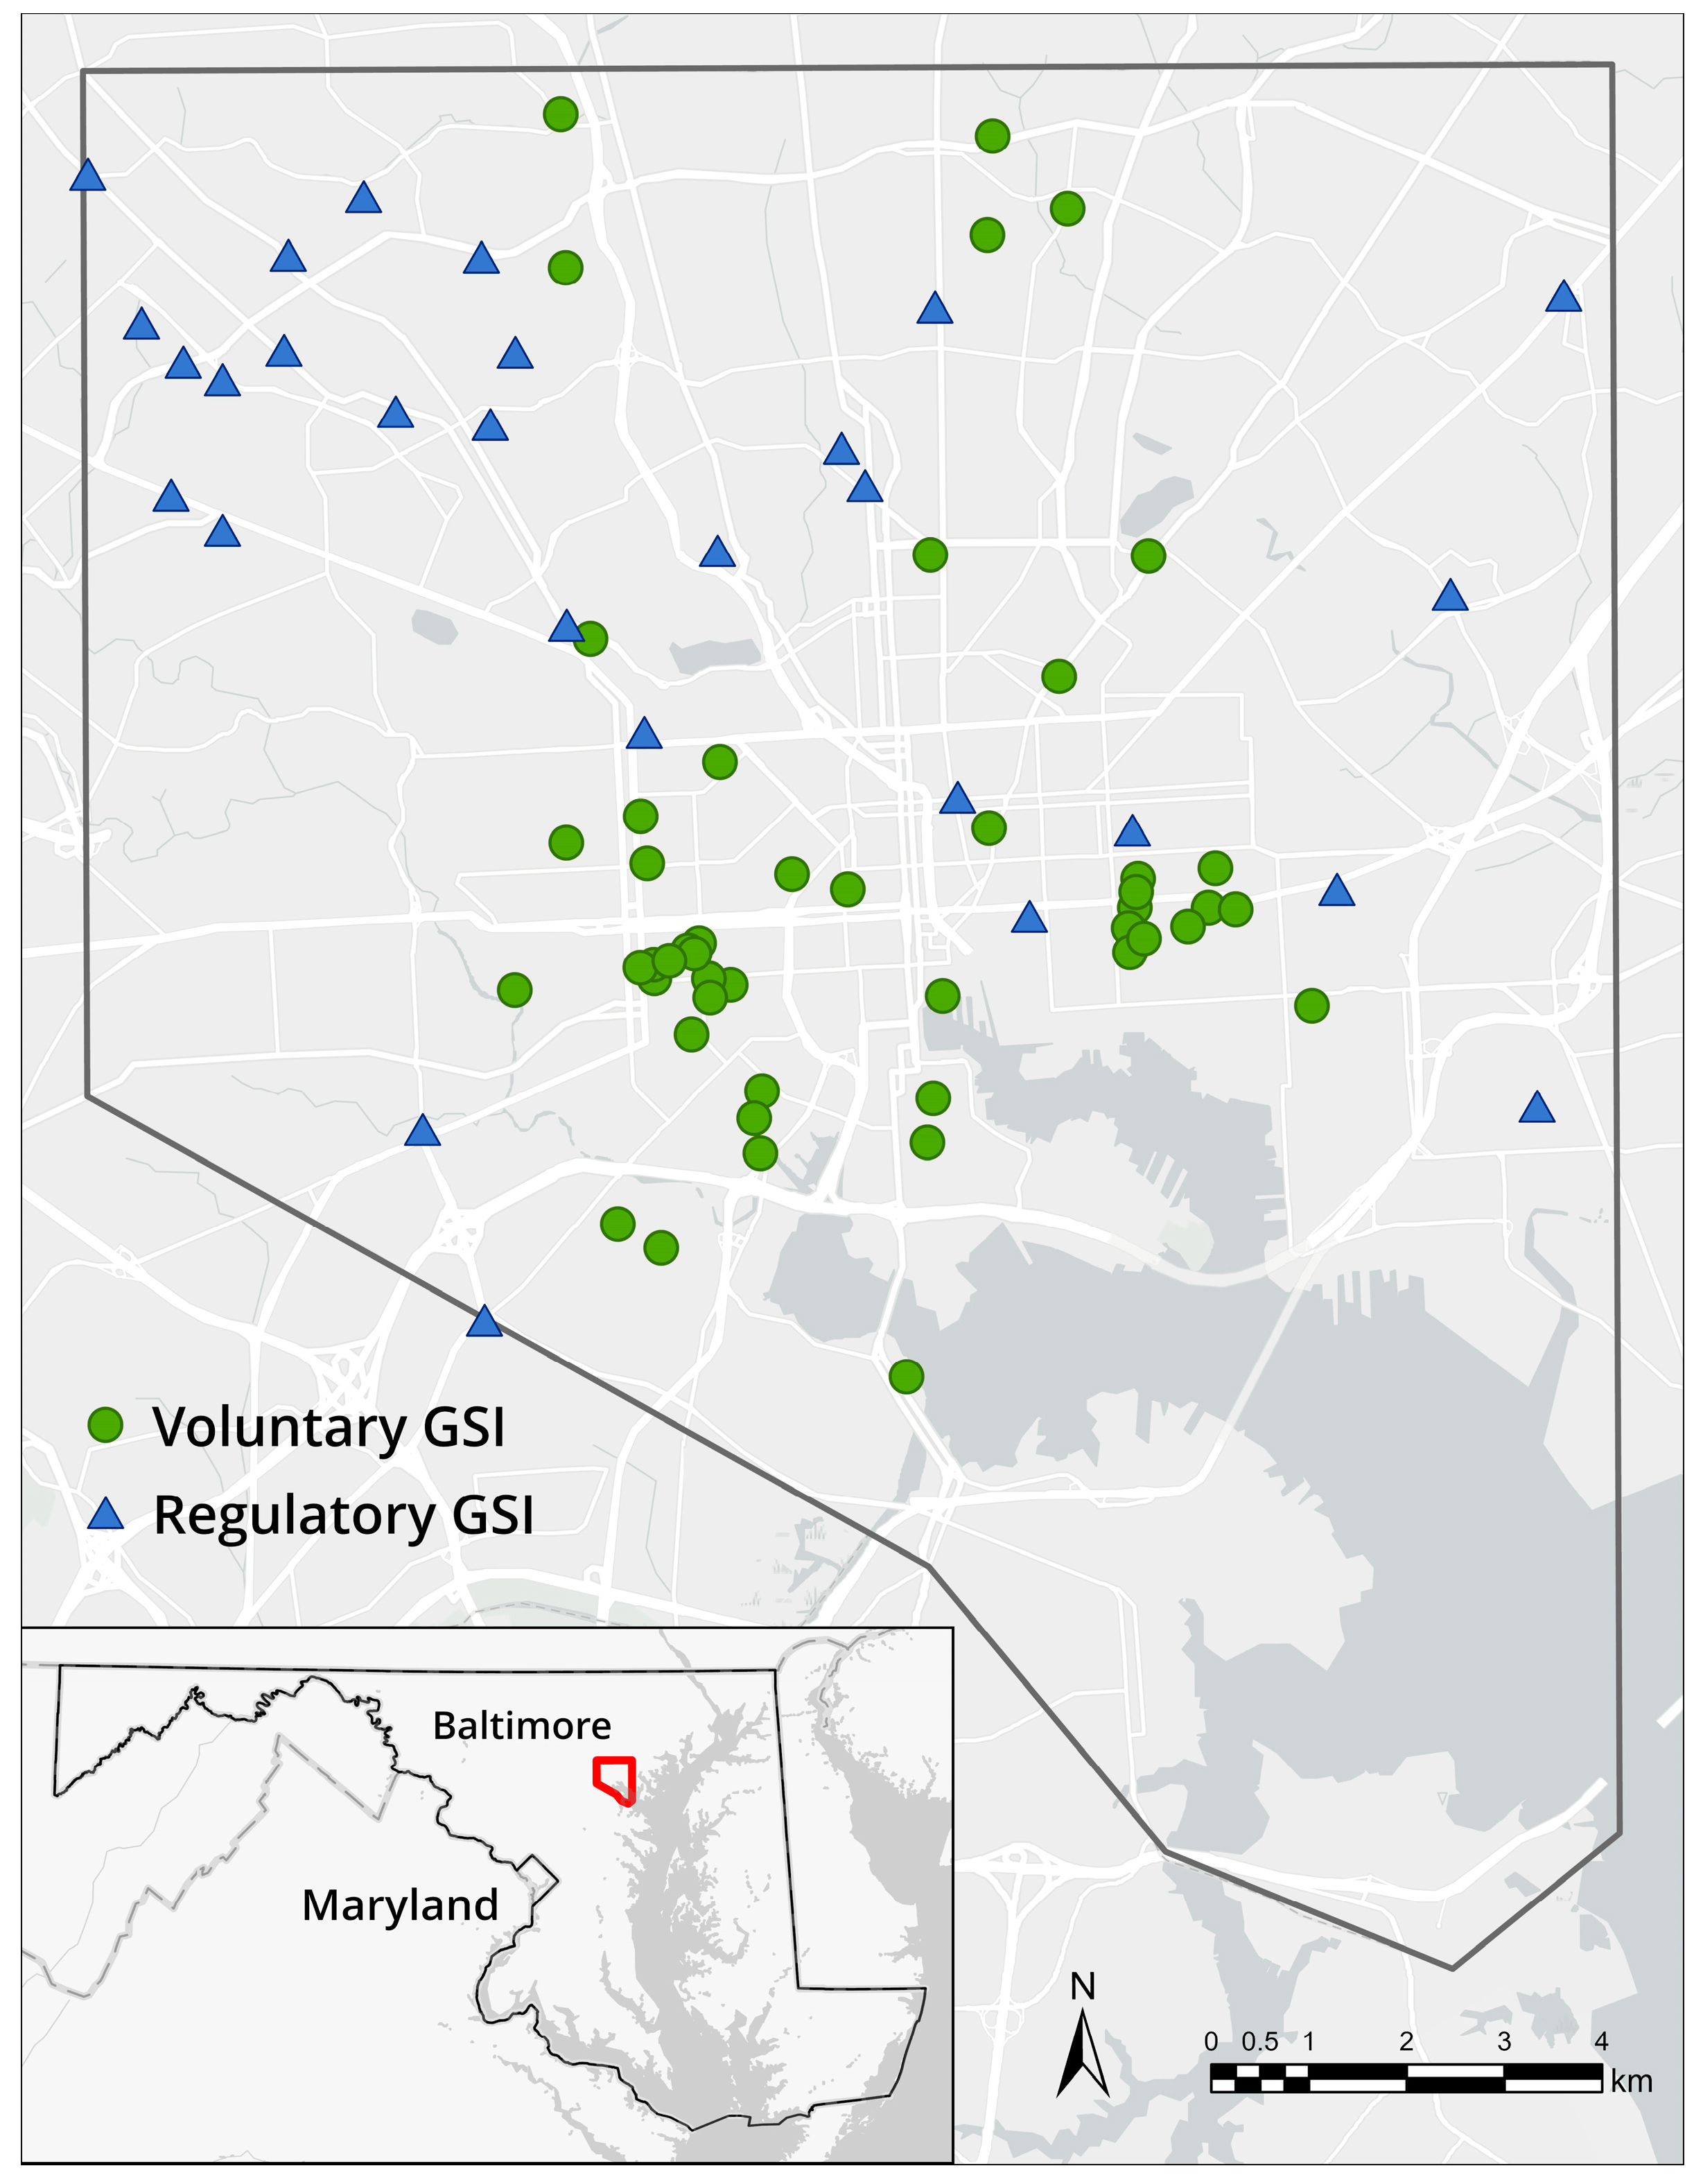
2.1. Study Area and Background

The city of Baltimore, MD, USA, is located on the Chesapeake Bay and has a population of just under 600,000 (585,708 as of the 2020 U.S. Census) in an area of 238 square kilometers. The city’s population has declined substantially since the 1950s, creating large amounts of vacancy in some areas [35], and a history of racial segregation has led to a “hypersegregated” status [36]. The city’s current population is roughly 62% Black and 30% white, and long-term disinvestment in Black neighborhoods has led to persistent disparities in income and education [37]. Tree canopy and green space are also unevenly distributed across the city, and higher socio-economic status has been associated with greater tree canopy cover [38,39] and access to greater park acreage, though fewer total parks [23].
Nutrient and sediment pollution in the Chesapeake Bay have motivated the construction of GSI in Baltimore to reduce the export of these contaminants in urban runoff. In Baltimore, GSI falls into two categories: regulatory GSI, constructed to fulfill legal requirements associated with development or redevelopment projects, and voluntary GSI, constructed with grant funding, often to mitigate runoff from existing infrastructure or landscapes [30]. Maintenance of regulatory GSI facilities is typically the responsibility of the property owner, and facilities are required to be inspected every three years as part of Baltimore City’s NPDES Municipal Separate Storm Sewer System (MS4) permit. In contrast, the voluntary GSI in this study was not subject to legal inspection or maintenance requirements. Due in part to funding restrictions, organizations that install grant-funded GSI in Baltimore often develop agreements with local neighborhood or community groups as a strategy to provide necessary maintenance [17].

2.2. Data

We identified GSI facilities to evaluate from datasets of regulatory and voluntary GSI installed in Baltimore through 2019 [30,40]. These datasets include a variety of different types of GSI, many of which would not be expected to provide benefits beyond stormwater mitigation (e.g., permeable pavement or rainwater catchment), and some of which are not distinct units (e.g., pavement removal). We therefore limited our study to rain gardens, bioswales, and bioretention and micro-bioretention facilities, as these facility types are typically designed to have multiple co-benefits within discrete boundaries and could be compared using the same criteria. We also included similar facilities in the voluntary GSI dataset referred to as stormwater planters and curb bump-outs. There were 101 of these facilities in the regulatory dataset and 185 in the voluntary dataset, some of which were grouped within the same project (e.g., one parking lot might have four micro-bioretention facilities built at the same time). There were 41 regulatory projects and 104 voluntary projects that included the designated facility types. We also limited our study to facilities that could be viewed from public areas, since the aesthetic qualities of these facilities would have community influence. We used aerial imagery and Google StreetView to identify publicly viewable facilities, yielding a set of 28 regulatory projects and 48 voluntary projects with at least one facility that met our criteria (Figure 1).
We visited each of these projects in early autumn of 2019 (8–10 October) to do a visual condition assessment. For projects with multiple GSI facilities that fit our criteria, we scored only the one most visible from our point of access or chose one randomly if they were equivalently visible. We gave each facility scores for multiple variables chosen because of their relationship to stormwater, habitat, and aesthetic values. For stormwater scores, variables and rating criteria were taken or modified from the Chesapeake Stormwater Network’s assessment protocol for bioretention facilities [41], which details visual indicators for facility characteristics shown to impact stormwater treatment performance. We focused on the variables that we could evaluate in one site visit and that we could score consistently in both regulatory and voluntary facilities. For habitat scores, we used broad-scale resource indicators linked to urban biodiversity. These included total vegetation cover, which is also related to vegetation structure in our analysis, as our metric summed different plant types to account for layering; both vegetation cover and structure have been linked to urban bird and insect species richness [42]. We also evaluated floral resources for pollinators [43,44] and calculated vegetation and ground cover type diversity using the Shannon Diversity Index. We included mulch and organic litter in the diversity calculation, as they have been associated with some arthropod [45] and bird [46] communities. For aesthetics, showy flowers have been linked to aesthetic appeal [47], and some GSI projects are associated with public art. Conversely, overgrown vegetation and the presence of trash tend to detract from perceived appeal [31,32].
We scored each facility according to the rubric in Table 1. The four-point scales for all non-cover metrics were based on bioretention inspection visual indicator profiles from the Chesapeake Stormwater Network [41]. For the cover-based metrics, we recorded the percent cover of different vegetation types and groundcovers—tree canopy (from trees both within and adjacent to the facility), shrubs, forbs, graminoids, mulch, organic litter, and plants with showy flowers—as absent (0%) or in cover classes (1–5%, 6–25%, 26–50%, 50–75%, 76–95%, 96–100%). The cover of plants with showy flowers (those with ornamental and/or pollinator appeal) was recorded even if they were not in bloom. The total vegetation cover was calculated by summing the midpoints of each cover class for trees, shrubs, forbs, and graminoids. Scores for vegetation variables were assigned based on cover, as shown in Table 1. We created a score for vegetation and ground cover type diversity using the Shannon Diversity Index based on the midpoints of each cover class for trees, shrubs, forbs, graminoids, mulch and organic litter.
We also recorded several presence–absence variables that served as deductions or additions from the final score. For deductions related to stormwater, we noted the presence of pet/animal waste, visible slope erosion, sediment cake crusting, and inlet or outlet rocks that were out of place. As an addition to the aesthetics score, we recorded whether any art was associated with the facility, such as a mural or painted benches or planters. We then determined total scores for stormwater mitigation, habitat value, and aesthetics using the scoring system shown in Table 2. While the scores we assigned cannot be quantitatively linked to functions or metrics like nutrient retention or pollinator populations, they allow a comparative assessment of GSI facilities across the city. In addition, we estimated the dimensions of the facility to calculate its approximate size. Size was considered separately from the other variables because it magnifies both the positive and negative qualities of a facility. Finally, we recorded the presence of educational signage and noted whether there was an indication of an organization responsible for the installation.
For sociodemographic variables, we used 2019 American Community Survey data from the U.S. Census at the census block group level. The variables we considered were race (the percent of the population identifying as Black), median household income, percent of vacant properties, and educational attainment (the percent of the population over 25 years of age with a high school degree or higher), which have been related to other environmental justice concerns [23,48] and the distribution of GSI [30] in Baltimore. Income data were unavailable for census block groups in which three regulatory and three voluntary facilities were located. We also considered the effect of facility age, using the recorded year of project completion to determine age in years. Some facilities may have been built before their recorded completion year if official sign-off was delayed (regulatory) or if the exact date of completion was not reported (voluntary). Summaries of explanatory variables are shown in Table 3.

2.3. Statistical Analysis
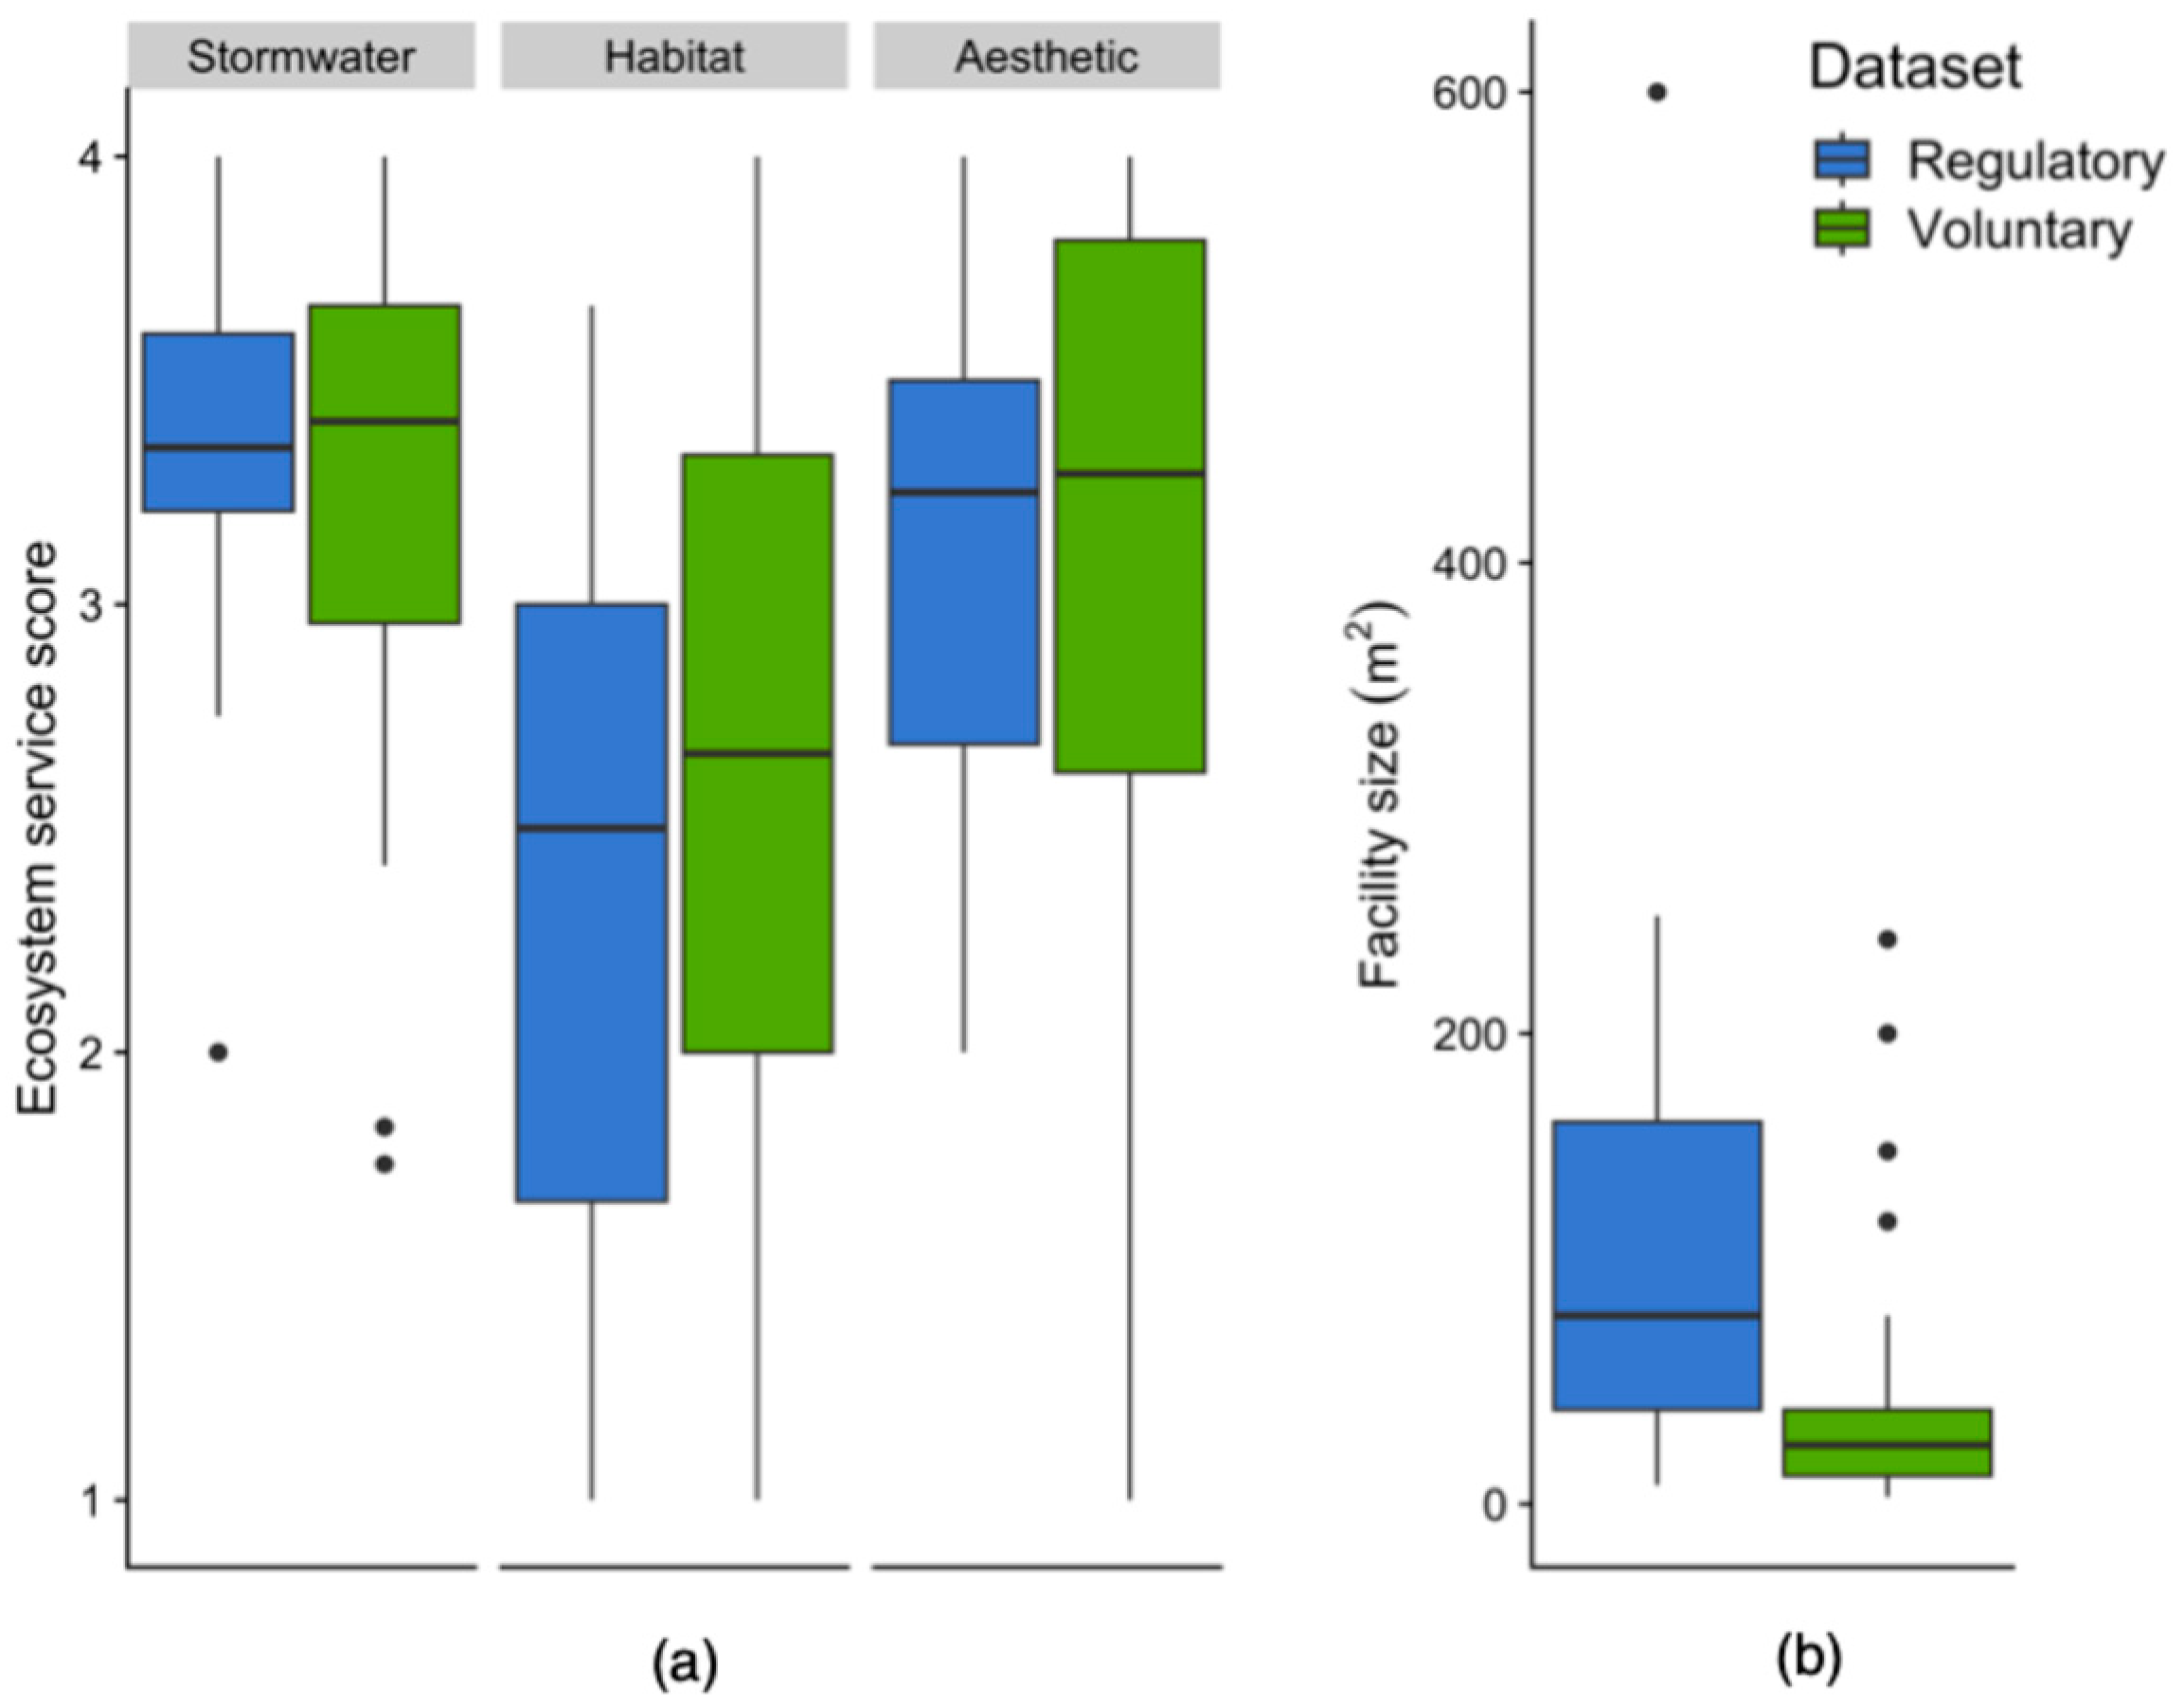
We compared scores and sizes for voluntary and regulatory facilities using Wilcoxon rank-sum tests, since the data were not normally distributed. We used Spearman’s rank correlation tests to examine relationships between facility scores and sizes and the sociodemographic characteristics of the census block groups in which facilities were located. We also tested the association between scores and facility age using Spearman’s rank correlation tests. Finally, we used Wilcoxon rank sum tests to determine whether there were differences in sociodemographic characteristics between voluntary facilities that had educational signage vs. those without. All analyses were performed with R version 4.4.2 [49]; correlation matrices were generated with the corrplot package [50].

3. Results

The GSI facilities we assessed received a wide range of stormwater, habitat, and aesthetic scores, but there were no significant differences between scores for regulatory and voluntary facilities (Figure 2). However, regulatory facilities were significantly larger in size (p < 0.001, Figure 2). Figure 3 shows examples of regulatory and voluntary facilities with different scores.
Correlations among scores, size, and explanatory variables are shown in Figure 4. For regulatory facilities, scores for aesthetics and stormwater, as well as facility size, were negatively associated with income and educational attainment (p < 0.05), and stormwater scores and size were also positively associated with Black populations. The age of regulatory facilities was negatively related to aesthetic scores (p < 0.05). Contrasting patterns emerged for voluntary facilities. Aesthetic scores increased with income and education, and decreased with Black population and vacancy. Contributing to aesthetic scores, eight voluntary facilities featured art—primarily murals on associated buildings. Correlations linking habitat and stormwater scores for voluntary facilities to sociodemographic variables were less strong, but these scores were also positively associated with education and negatively associated with the Black population and vacancy. Voluntary facility size was also negatively related to vacancy. No characteristics of voluntary facilities were related to facility age.
Educational signage was included with 18 facilities, all of which were voluntary. Voluntary GSI projects that included educational signage were in census block groups that had slightly higher educational attainment (p < 0.05) than those without signage, but there were no other significant differences in the sociodemographic variables we considered. All but two of the educational signs included an indication of the organization responsible for the installation, and one voluntary facility included a responsible organization without educational signage.

4. Discussion

Our assessment shows that both regulatory requirements for stormwater mitigation and voluntary, grant-funded efforts to address stormwater issues can lead to highly variable provision of ecosystem services from GSI facilities. While some GSI facilities we evaluated were clearly intended to provide co-benefits, featuring diverse plants and artistic elements, others were simple depressions in turfgrass landscapes, apparently designed for stormwater function alone. Some were well maintained to retain their original function and co-benefits, while others appeared neglected or poorly managed, collecting debris and either overgrown with weeds or lacking living vegetation (Figure 3). These findings challenge the assumption that GSI is always an amenity, adding complexity to the understanding of distributional equity for GSI ecosystem services and the use of GSI as a sustainable solution in cities.

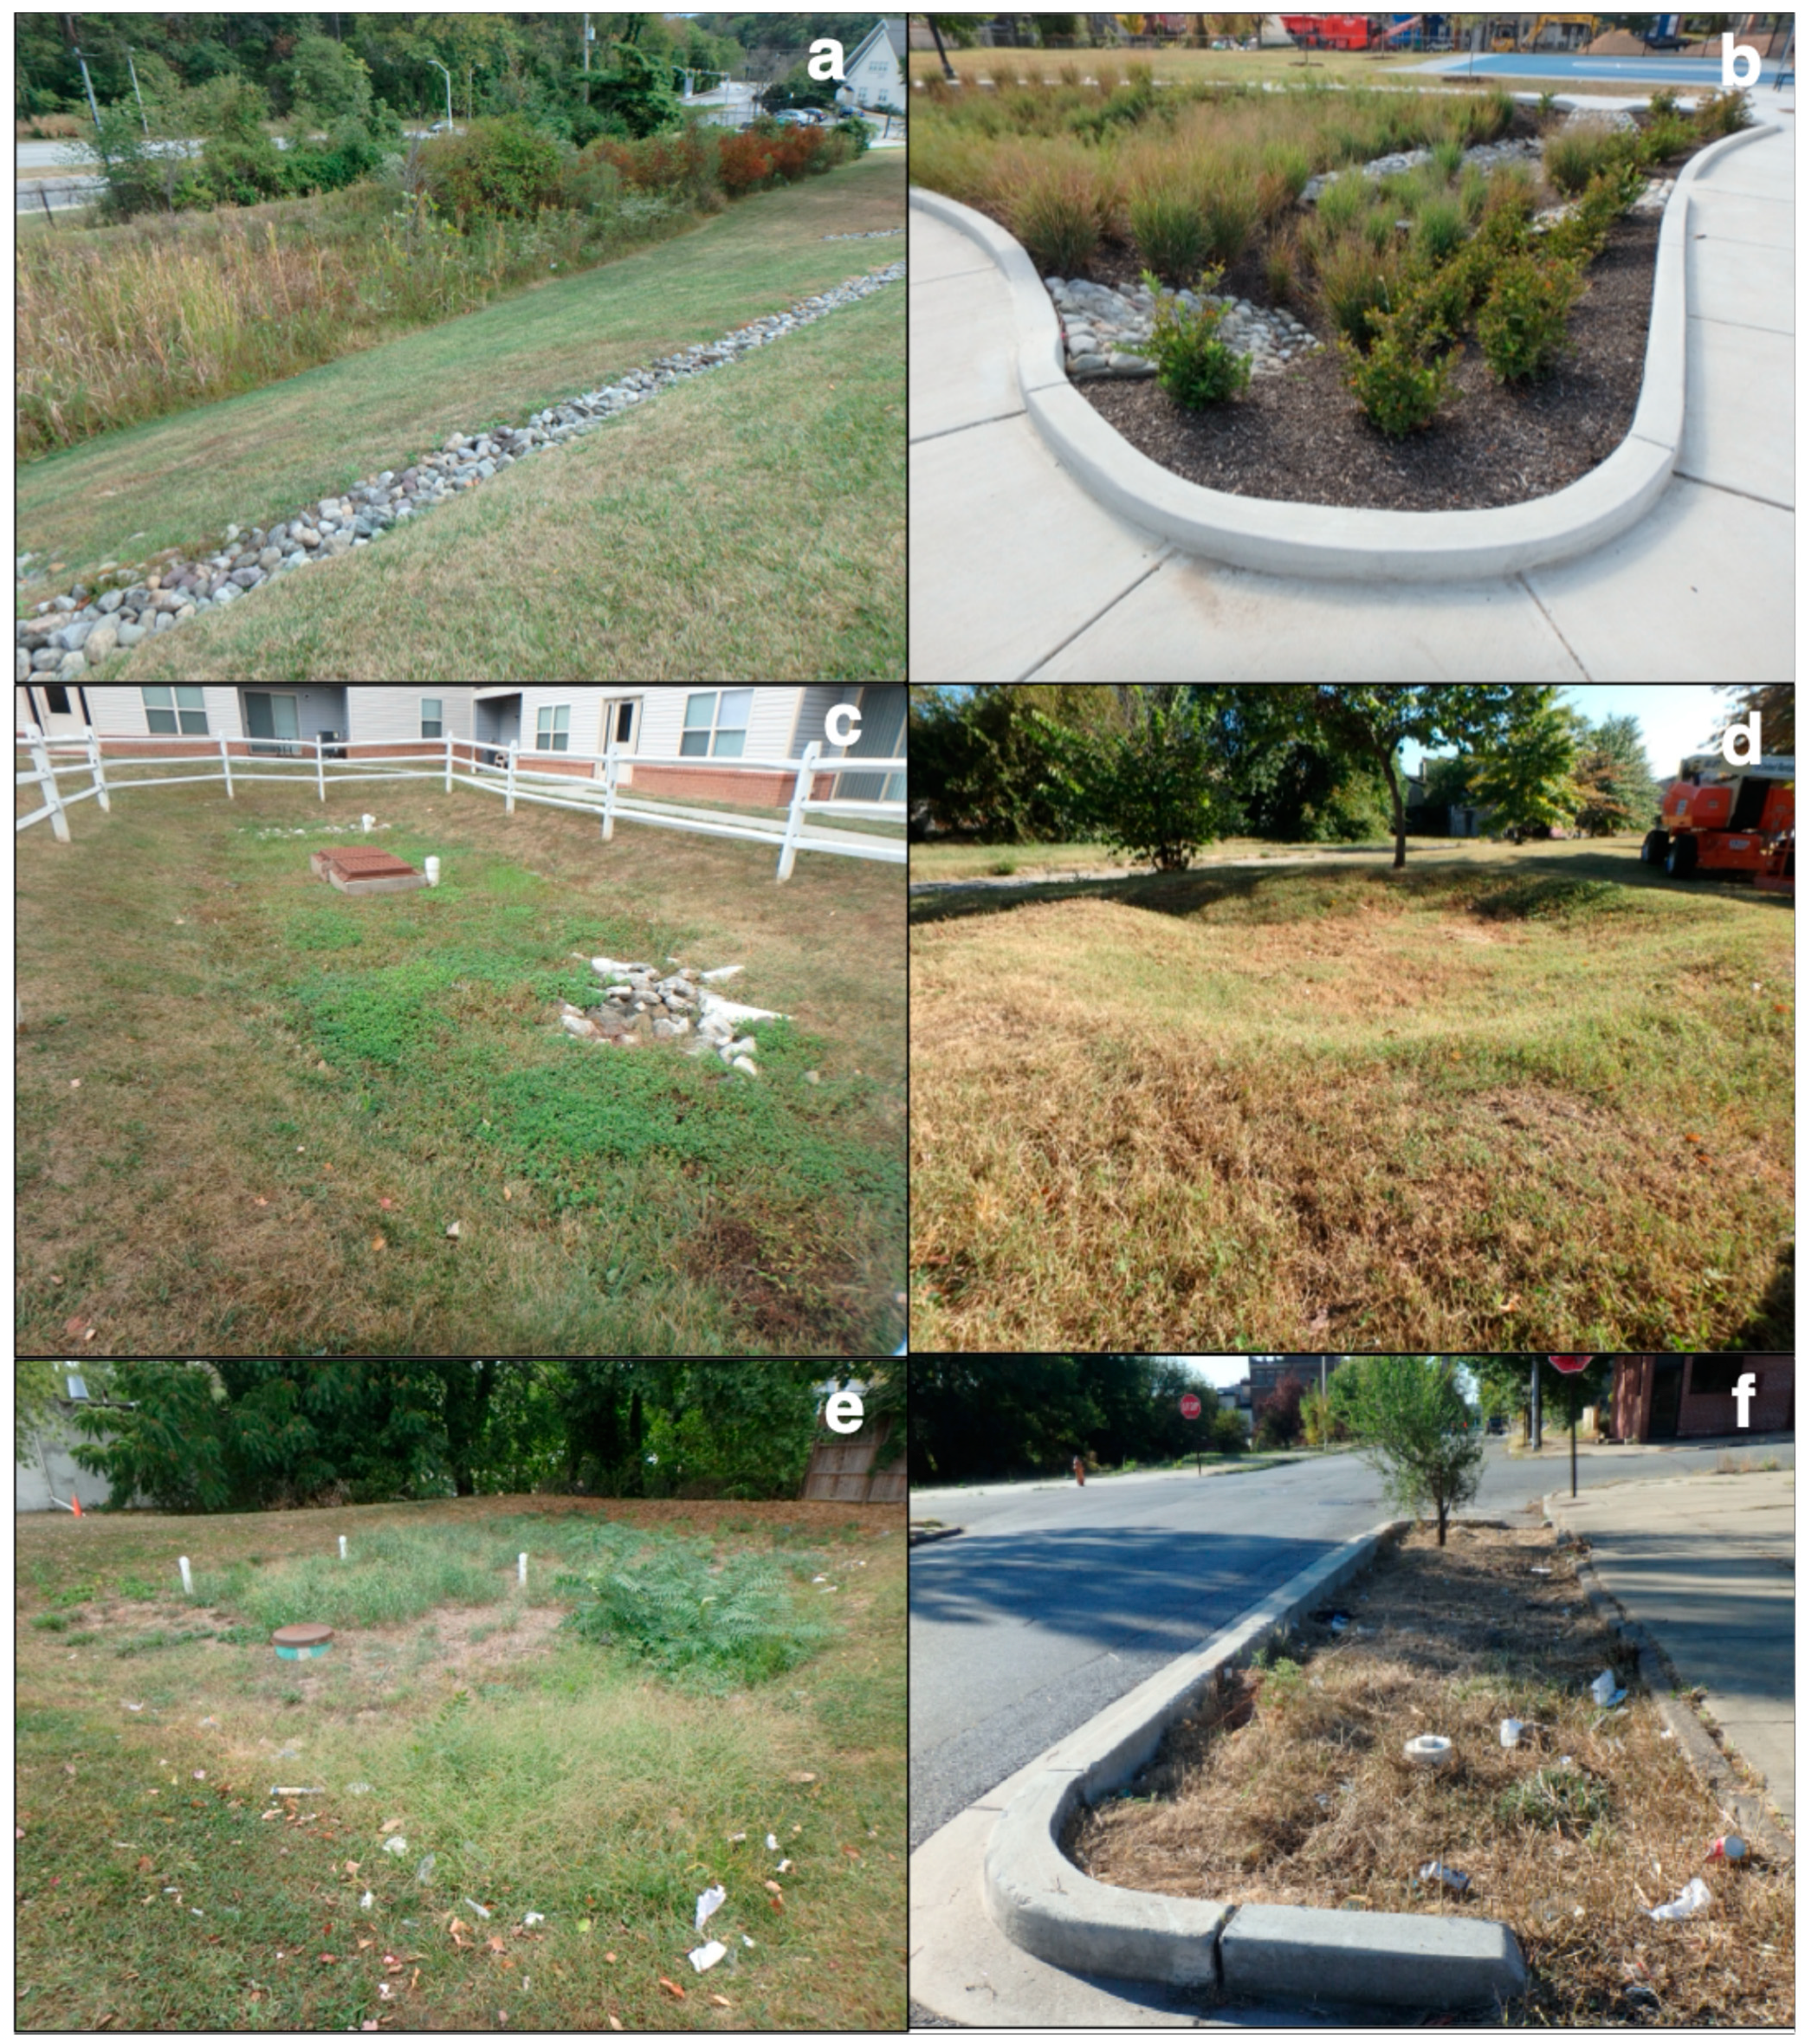
4.1. Ecosystem Services Are Variable for Both Regulatory and Voluntary GSI

Despite the contrasting motivations and requirements for regulatory and voluntary GSI, neither approach had significantly better outcomes overall for stormwater, habitat, or aesthetic ecosystem services. Both regulatory and voluntary approaches to GSI have benefits and limitations that ultimately balanced each other for these three ecosystem services in our analysis, as explained in more detail below, although voluntary facilities did provide more education in the form of signage. The variation in ecosystem service scores within each type of GSI stemmed from differences in both design and maintenance across facilities. While it would be valuable to fully separate the influence of design and maintenance on ecosystem service scores, poor maintenance often obscured original design elements. However, there were some notable differences in design between regulatory and voluntary facilities that we could identify.
First, voluntary facilities included more educational and aesthetic design features than regulatory facilities, even if aesthetic scores were not higher in total. Only voluntary facilities were associated with educational signage and art, and voluntary facilities had, on average, significantly more cover of showy flowers than regulatory facilities. These findings likely reflect the broader missions of both non-profit organizations that install voluntary GSI and philanthropic organizations that fund them. Public art, education, and pollinator habitat can all appeal to different aspects of funders’ missions [16], and successful grant applications would need to clearly include these co-benefits of GSI in project designs, unlike GSI in a regulatory context. Voluntary facilities are also likely to include more community input in their designs, as grant-funded projects are often developed and implemented in coordination with schools, churches, and community groups [17], potentially leading to more explicit co-benefits. For some of the projects we assessed, GSI facilities were only one component of a larger project to revitalize community space, and their stormwater function could be regarded as a co-benefit rather than the focus of the project. However, we did assess some voluntary facilities that appeared to be designed purely for stormwater function.
We also found that regulatory facilities were substantially larger than voluntary facilities, on average. This difference likely stems from the different constraints on the two types of facilities. While regulatory facilities must be sized to mitigate the effects of construction, many voluntary facilities are intentionally designed to be small to avoid full regulatory requirements and associated costs [51]. Although size did not factor into our ecosystem services scores directly, the difference suggests that well-maintained regulatory facilities are likely to provide greater benefits on an individual basis. On the other hand, many of the small facilities we assessed were one of several in a single project, and further study would be necessary to determine how facility size, number, placement, composition, and connection contribute to different ecosystem services in Baltimore [52]. On a landscape scale, GSI is not always installed in a strategic way that would facilitate additive effects [30,53,54].
Regardless of the original design and planning, GSI facilities can degrade over time without proper maintenance [5,11]. We did find that regulatory facilities exhibited declining aesthetic scores with age; however, this finding could suggest either inadequate maintenance leading to gradual degradation or a shift toward more aesthetic design elements in newer installations. Voluntary facilities conversely showed no relationship between age and any ecosystem service scores. The lack of a strong relationship between GSI age and condition could be due to the short time span of this study—most of the facilities were quite new at the time of data collection (Table 3), and more time is likely necessary to determine a generalized relationship. However, the high level of variation in GSI condition over the short time span in this study shows that very fast declines are possible without appropriate maintenance.
Baltimore’s regulatory requirement for maintenance is intended to prevent such declines. Yet even when considering only maintenance-related raw scores such as vegetation maintenance and trash, regulatory scores were variable and not significantly greater than voluntary scores. This finding aligns with previous research documenting the deterioration of some GSI facilities despite maintenance requirements [5,13]. Regulatory requirements in Baltimore may fail due to a combination of disjointed, individual maintenance schemes for each property; lack of training for maintenance personnel; the relatively long time between required inspections; and limited city capacity to carry out and follow up on inspections. Available MS4 Annual Reports from the City of Baltimore’s Department of Public Works (https://publicworks.baltimorecity.gov/regulatory-mandates-plans-and-reports, accessed on January 18 2025) show highly variable numbers of annual maintenance and follow-up inspections between 2015 and 2019, and there was only one inspector for the city as of 2014 [13]. Without adequate training, monitoring, and enforcement, regulatory requirements for maintenance fall short of ensuring ecosystem service provision.
Maintenance issues have different underlying causes for voluntary facilities, with equally variable outcomes. Several voluntary facilities we assessed were so degraded that they were difficult to locate. These projects, which grant report photographs showed as attractive facilities in well-designed urban spaces, degraded within just a few years to barely discernible depressions. Some voluntary facilities in public rights-of-way lacked vegetation and accumulated debris, creating eyesores in well-trafficked areas. These situations can result from both lack of maintenance and uncoordinated maintenance responses—sometimes a call to the city’s complaint line regarding untidy or overgrown vegetation in a GSI facility can result in city crews simply mowing down the original plants [17], which would require additional funds and labor to replace. Although signage indicating a responsible organization could help mitigate this problem, most voluntary facilities in our study lacked this information. Inadequate coordination between city crews and groups responsible for GSI underscores the challenge of maintaining “infrastructure” that is not designed or managed as a system. Indeed, a lack of clear communication and responsibility has been identified as an overarching barrier to GSI maintenance [11].
On the other hand, some voluntary GSI facilities were in excellent condition. In some cases, maintenance for voluntary GSI may be carried out by paid staff, such as when the facility is on a school, park, or church property that employs a landscape crew or contractor. In many cases, though, community members or groups provide maintenance, sometimes with little or no outside support. Such maintenance can be a point of individual and community pride; however, maintenance can also create a burden for those who take it on, especially when support is lacking for basics like trash collection [17]. The common reliance on uncompensated labor under nonbinding agreements also means that if key community members leave, pass away, or become otherwise unable or unwilling to provide maintenance, more voluntary facilities will fall into disrepair over time. These aspects of maintenance add further nuance to the questions of when, for whom, and for how long GSI can be regarded as an amenity.

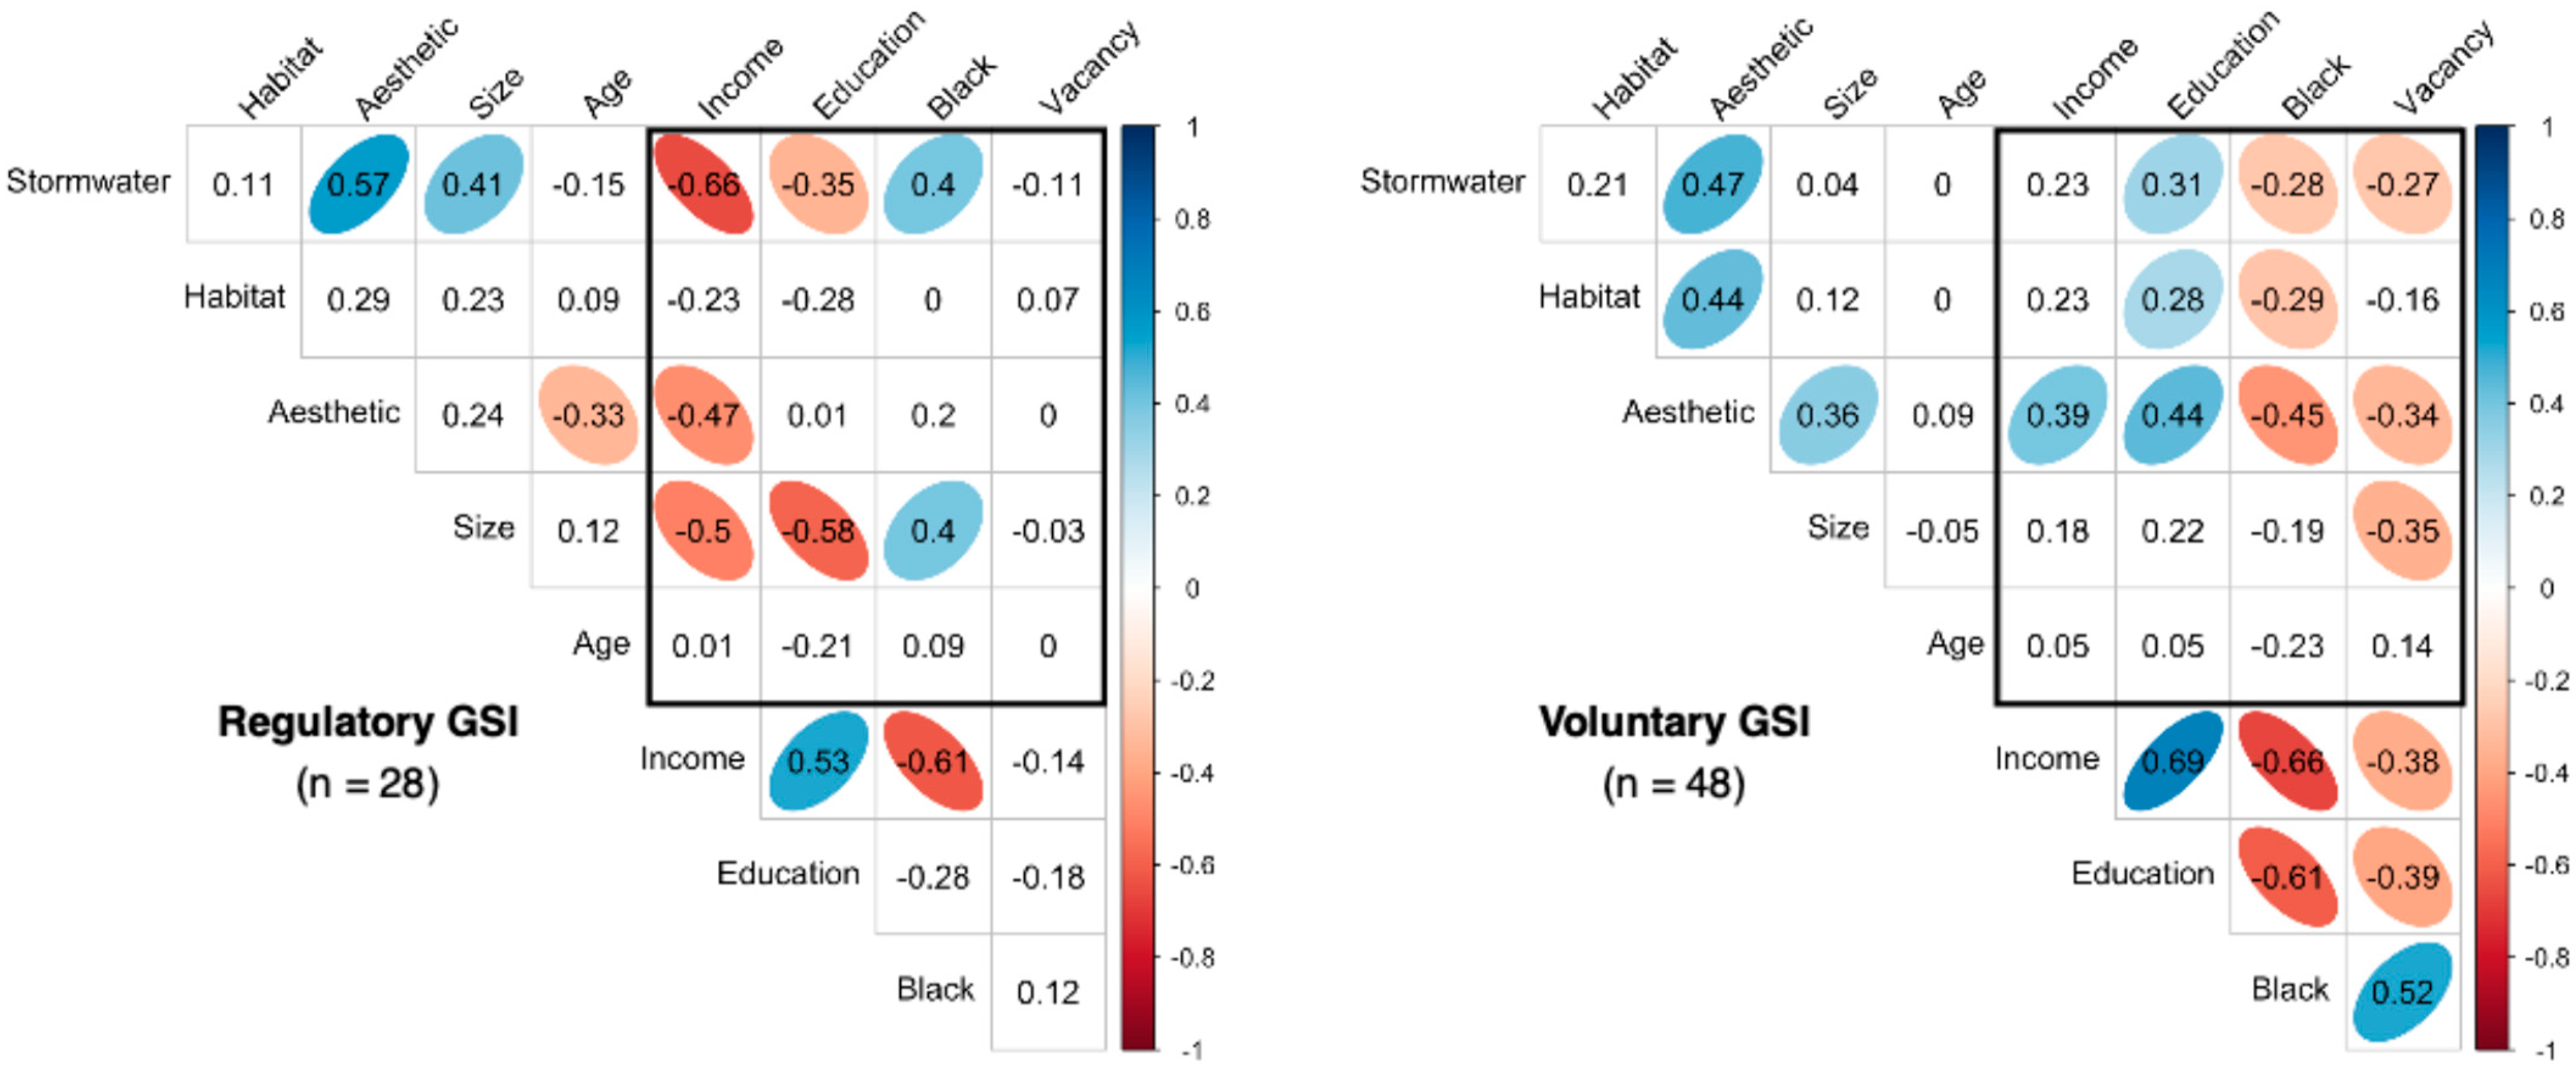
4.2. Ecosystem Service Scores Are Related to Sociodemographic Characteristics

Variation in our ecosystem service scores was related to the sociodemographic characteristics of the census block groups in which GSI facilities were located. We observed contrasting patterns between regulatory and voluntary GSI, which interact with their distinct spatial distributions across Baltimore. For example, regulatory GSI was less prevalent in areas with greater Black populations [30]. However, we found that stormwater scores for regulatory facilities improved with increasing Black populations, suggesting that while Black neighborhoods have fewer regulatory facilities overall, they may be of higher quality. In general, regulatory facilities received higher scores in areas with lower socioeconomic standing, suggesting that although regulatory requirements do not necessarily lead to more GSI in these areas, they are relatively successful at maintaining the benefits of the facilities that are located there.
In contrast, voluntary GSI was more commonly located in both low-income, predominantly Black areas and high-income, predominantly white areas, and it was also more common in areas with high rates of vacancy [30]. These patterns reflect nonprofit efforts to bring GSI to underserved neighborhoods, as well as partnerships with institutions in more affluent areas. Yet we found that voluntary facilities had worse aesthetic, habitat, and stormwater scores in areas with greater Black populations, and also had lower aesthetic scores in low-income areas. Aesthetics and stormwater scores also decreased in areas with greater vacancy. These findings suggest that well-intentioned programs to bring GSI to underserved neighborhoods may be doing more harm than good by installing GSI facilities that degrade quickly after construction. Maintenance burdens may be particularly felt in neighborhoods that are already under-resourced, while neighborhoods with higher socioeconomic standing may have more money, time, and even knowledge to devote to GSI maintenance. Voluntary facilities notably received higher scores for all ecosystem services in areas with higher educational attainment, possibly reflecting access to connections and resources that improve maintenance outcomes.

4.3. Limitations and Opportunities for Future Research

We used feasible, evidence-backed visual indicators of the ecosystem services in question, but much more extensive studies would be necessary to know how well these indicators correlate to actual and perceived benefits in this system. For instance, tracking usage of GSI facilities by multiple animal taxa over multiple seasons would provide an understanding of how different species respond to the habitat indicators we chose, and could suggest the need for more detailed information like plant species diversity that was beyond the scope of our rapid assessment. In addition, while we could record characteristics known to degrade the stormwater function of GSI facilities, we could not tell how well facilities that appeared functional were actually working to capture, infiltrate, and treat stormwater, nor the extent to which visual signs of degradation diminished function. Some of the voluntary facilities we assessed did not appear to be constructed such that they would capture stormwater from the surrounding landscape at all; however, without observing them through precipitation events, we could not be sure. Some facilities therefore likely received higher stormwater scores than was warranted, and tracking stormwater movement and quality in the study facilities across different types of storms would help refine these scores. In addition to more intensive studies, long-term monitoring of these facilities as they age would provide insight into changes in their condition and performance over time to better inform urban planning and resource allocation.
The question of whether and to what extent communities perceive any of the services we assessed as benefits would require an in-depth interview and/or survey approach (e.g., [55]). In addition, without original design information, we could not know the extent to which our scores correlated with maintenance vs. design features; future studies could focus on obtaining design documentation and maintenance records to clarify this distinction and provide more targeted suggestions for improving ecosystem service provision. Finally, because GSI facilities in Baltimore were not numerous nor randomly distributed across the city, we were limited to assessing all existing facilities that met our criteria rather than sampling to cover the full range of the city’s sociodemographic characteristics. A follow-up study once more GSI facilities have been built would be valuable to validate our findings.

5. Conclusions

Regulations and urban greening strategies that encourage GSI often assume that co-benefits justify construction. Yet we found that neither regulatory requirements nor grant funding provide adequate resources to ensure that any ecosystem services—including stormwater function—are provided over time. Our study shows that even when co-benefits are included in designs, they can deteriorate quickly without adequate maintenance, transforming amenities into disamenities. Maintenance itself can create a burden for communities tasked with GSI upkeep in the absence of institutional support. Thus, the mere presence of GSI in the landscape does not guarantee benefits.
The contrasting patterns we observed between regulatory and voluntary GSI highlight the need for a more integrated approach to GSI implementation. While regulatory GSI can benefit from established engineering standards and inspection requirements, it often lacks the community engagement and co-benefit considerations that characterize voluntary projects. Conversely, voluntary GSI frequently incorporates community values and aesthetic elements, but may suffer from inadequate technical oversight and long-term maintenance planning. A hybrid approach that combines the technical rigor of regulatory requirements with the community-centered design of voluntary projects could potentially lead to more sustainable outcomes. Further research that brings together stakeholders from both regulatory and voluntary GSI processes could inform a concrete implementation plan to achieve this theoretical melding.
GSI is intended to be infrastructure and requires careful attention at every stage from planning through installation and maintenance to function as such. Yet it is currently treated in a disjointed, piecemeal fashion that leads to highly variable outcomes and an inequitable distribution of benefits and burdens. In order for GSI to be a sustainable part of urban infrastructure globally, cities must develop transparent, data-driven systems that support ongoing maintenance while ensuring meaningful community participation in decision-making. However, achieving equitable outcomes will require careful attention to how these institutional frameworks are implemented, particularly in historically underserved communities.

Author Contributions

Conceptualization, J.P.S., M.L.C., L.E.G.B. and S.T.A.P.; methodology, J.P.S., M.L.C. and L.E.G.B.; formal analysis, J.P.S.; investigation, J.P.S. and L.E.G.B.; resources, M.L.C.; data curation, J.P.S. and L.E.G.B.; writing—original draft preparation, J.P.S.; writing—review and editing, J.P.S., L.E.G.B., M.L.C. and S.T.A.P.; visualization, J.P.S. and L.E.G.B.; supervision, M.L.C.; project administration, M.L.C. and S.T.A.P.; funding acquisition, M.L.C. and S.T.A.P. All authors have read and agreed to the published version of the manuscript.

Funding

This research was funded by the JPB Foundation, grant #933.

Institutional Review Board Statement

Not applicable.

Informed Consent Statement

Not applicable.

Data Availability Statement

All data generated during this study are publicly available in the Dryad data repository: https://doi.org/10.5061/dryad.612jm64fs.

Acknowledgments

The authors would like to thank Amanda Phillips de Lucas and Morgan Grove for their support in planning and implementing this study. Staff at the Baltimore City Department of Public Works, Blue Water Baltimore, and Parks & People provided helpful insights and assistance in developing the original GSI datasets used in this study. We would also like to thank the other members of the “Is Green Infrastructure a Universal Good?” research team for their support and input.

Conflicts of Interest

The authors declare no conflicts of interest. The funder had no role in the design of the study; in the collection, analyses, or interpretation of data; in the writing of the manuscript; or in the decision to publish the results.

Abbreviations

The following abbreviations are used in this manuscript:
GSIGreen stormwater infrastructure
US EPAUnited States Environmental Protection Agency
NPDESNational Pollutant Discharge Elimination System
MS4Municipal Separate Storm Sewer System

References

  1. Spahr, K.M.; Smith, J.M.; McCray, J.E.; Hogue, T.S. Reading the Green Landscape: Public Attitudes toward Green Stormwater Infrastructure and the Perceived Nonmonetary Value of Its Co-Benefits in Three US Cities. J. Sustain. Water Built Environ. 2021, 7, 04021017. [Google Scholar] [CrossRef]
  2. Bell, C.D.; Spahr, K.; Grubert, E.; Stokes-Draut, J.; Gallo, E.; McCray, J.E.; Hogue, T.S. Decision Making on the Gray-Green Stormwater Infrastructure Continuum. J. Sustain. Water Built Environ. 2019, 5, 04018016. [Google Scholar] [CrossRef]
  3. Wang, M.; Sun, C.; Zhang, D. Opportunities and Challenges in Green Stormwater Infrastructure (GSI): A Comprehensive and Bibliometric Review of Ecosystem Services from 2000 to 2021. Environ. Res. 2023, 236, 116701. [Google Scholar] [CrossRef] [PubMed]
  4. Taguchi, V.J.; Weiss, P.T.; Gulliver, J.S.; Klein, M.R.; Hozalski, R.M.; Baker, L.A.; Finlay, J.C.; Keeler, B.L.; Nieber, J.L. It Is Not Easy Being Green: Recognizing Unintended Consequences of Green Stormwater Infrastructure. Water 2020, 12, 522. [Google Scholar] [CrossRef]
  5. DelGrosso, Z.L.; Hodges, C.C.; Dymond, R.L. Identifying Key Factors for Implementation and Maintenance of Green Stormwater Infrastructure. J. Sustain. Water Built Environ. 2019, 5, 05019002. [Google Scholar] [CrossRef]
  6. McPhillips, L.E.; Matsler, A.M. Temporal Evolution of Green Stormwater Infrastructure Strategies in Three US Cities. Front. Built Environ. 2018, 4, 26. [Google Scholar] [CrossRef]
  7. Hoover, F.A.; Meerow, S.; Coleman, E.; Grabowski, Z.; McPhearson, T. Why Go Green? Comparing Rationales and Planning Criteria for Green Infrastructure in U.S. City Plans. Landsc. Urban Plan. 2023, 237, 104781. [Google Scholar] [CrossRef]
  8. Erickson, A.J.; Gulliver, J.S.; Kang, J.-H.; Weiss, P.T.; Wilson, C.B. Maintenance for Stormwater Treatment Practices. J. Contemp. Water Res. Educ. 2010, 146, 75–82. [Google Scholar] [CrossRef]
  9. US EPA. Compendium of MS4 Permitting Aproaches Part 6: Green Infrastructure; US EPA: Washington, DC, USA, 2022; p. 65.
  10. Houle, J.J.; Roseen, R.M.; Ballestero, T.P.; Puls, T.A.; Sherrard, J. Comparison of Maintenance Cost, Labor Demands, and System Performance for LID and Conventional Stormwater Management. J. Environ. Eng. 2013, 139, 932–938. [Google Scholar] [CrossRef]
  11. Blecken, G.-T.; Hunt III, W.F.; Al-Rubaei, A.M.; Viklander, M.; Lord, W.G. Stormwater Control Measure (SCM) Maintenance Considerations to Ensure Designed Functionality. Urban Water J. 2017, 14, 278–290. [Google Scholar] [CrossRef]
  12. Everett, G.; Lamond, J.E.; Morzillo, A.T.; Matsler, A.M.; Chan, F.K.S. Delivering Green Streets: An Exploration of Changing Perceptions and Behaviours over Time around Bioswales in Portland, Oregon. J. Flood Risk Manag. 2018, 11, S973–S985. [Google Scholar] [CrossRef]
  13. Klein, R. Stormwater Best Management Practices Greater Baltimore Survey 2016; Community & Environmental Defense Services: Owings Mills, MD, USA, 2016; p. 88. [Google Scholar]
  14. Barclay, N.; Klotz, L. Role of Community Participation for Green Stormwater Infrastructure Development. J. Environ. Manag. 2019, 251, 109620. [Google Scholar] [CrossRef] [PubMed]
  15. Mandarano, L.; Meenar, M. Equitable Distribution of Green Stormwater Infrastructure: A Capacity-Based Framework for Implementation in Disadvantaged Communities. Local Environ. 2017, 22, 1338–1357. [Google Scholar] [CrossRef]
  16. US EPA. Green Infrastructure Funding and Technical Assistance Opportunities. Available online: https://www.epa.gov/green-infrastructure/green-infrastructure-funding-and-technical-assistance-opportunities (accessed on 15 December 2024).
  17. Phillips de Lucas, A.K. Gifting a White Elephant, in the Form of Green Infrastructure. Nature of Cities 2020. Available online: https://www.thenatureofcities.com/2020/08/18/gifting-a-white-elephant-in-the-form-of-green-infrastructure/ (accessed on 9 February 2025).
  18. Comber, A.; Brunsdon, C.; Green, E. Using a GIS-Based Network Analysis to Determine Urban Greenspace Accessibility for Different Ethnic and Religious Groups. Landsc. Urban Plan. 2008, 86, 103–114. [Google Scholar] [CrossRef]
  19. Ferguson, M.; Roberts, H.E.; McEachan, R.R.C.; Dallimer, M. Contrasting Distributions of Urban Green Infrastructure across Social and Ethno-Racial Groups. Landsc. Urban Plan. 2018, 175, 136–148. [Google Scholar] [CrossRef]
  20. Kabisch, N.; Haase, D. Green Justice or Just Green? Provision of Urban Green Spaces in Berlin, Germany. Landsc. Urban Plan. 2014, 122, 129–139. [Google Scholar] [CrossRef]
  21. Wolch, J.; Wilson, J.P.; Fehrenbach, J. Parks and Park Funding in Los Angeles: An Equity-Mapping Analysis. Urban Geogr. 2005, 26, 4–35. [Google Scholar] [CrossRef]
  22. Wüstemann, H.; Kalisch, D.; Kolbe, J. Access to Urban Green Space and Environmental Inequalities in Germany. Landsc. Urban Plan. 2017, 164, 124–131. [Google Scholar] [CrossRef]
  23. Boone, C.G.; Buckley, G.L.; Grove, J.M.; Sister, C. Parks and People: An Environmental Justice Inquiry in Baltimore, Maryland. Ann. Assoc. Am. Geogr. 2009, 99, 767–787. [Google Scholar] [CrossRef]
  24. Lindsey, G.; Maraj, M.; Kuan, S. Access, Equity, and Urban Greenways: An Exploratory Investigation. Prof. Geogr. 2001, 53, 332–346. [Google Scholar] [CrossRef]
  25. Talen, E. The Social Equity of Urban Service Distribution: An Exploration of Park Access in Pueblo, Colorado, and Macon, Georgia. Urban Geogr. 1997, 18, 521–541. [Google Scholar] [CrossRef]
  26. Sister, C.; Wolch, J.; Wilson, J. Got Green? Addressing Environmental Justice in Park Provision. GeoJournal 2010, 75, 229–248. [Google Scholar] [CrossRef]
  27. Smoyer-Tomic, K.E.; Hewko, J.N.; Hodgson, M.J. Spatial Accessibility and Equity of Playgrounds in Edmonton, Canada. Can. Geogr./Le Géographe Can. 2004, 48, 287–302. [Google Scholar] [CrossRef]
  28. Weiss, C.C.; Purciel, M.; Bader, M.; Quinn, J.W.; Lovasi, G.; Neckerman, K.M.; Rundle, A.G. Reconsidering Access: Park Facilities and Neighborhood Disamenities in New York City. J. Urban Health 2011, 88, 297–310. [Google Scholar] [CrossRef] [PubMed]
  29. Wendel, H.E.W.; Downs, J.A.; Mihelcic, J.R. Assessing Equitable Access to Urban Green Space: The Role of Engineered Water Infrastructure. Environ. Sci. Technol. 2011, 45, 6728–6734. [Google Scholar] [CrossRef] [PubMed]
  30. Solins, J.P.; Phillips de Lucas, A.K.; Brissette, L.E.G.; Morgan Grove, J.; Pickett, S.T.A.; Cadenasso, M.L. Regulatory Requirements and Voluntary Interventions Create Contrasting Distributions of Green Stormwater Infrastructure in Baltimore, Maryland. Landsc. Urban Plan. 2023, 229, 104607. [Google Scholar] [CrossRef]
  31. Bedimo-Rung, A.; Gustat, J.; Tompkins, B.; Rice, J.; Thomson, J. Development of a Direct Observation Instrument to Measure Environmental Characteristics of Parks for Physical Activity. J. Phys. Act. Health 2005, 3 (Suppl. S1), S176–S189. [Google Scholar] [CrossRef]
  32. Gidlow, C.J.; Ellis, N.J.; Bostock, S. Development of the Neighbourhood Green Space Tool (NGST). Landsc. Urban Plan. 2012, 106, 347–358. [Google Scholar] [CrossRef]
  33. Saelens, B.E.; Frank, L.D.; Auffrey, C.; Whitaker, R.C.; Burdette, H.L.; Colabianchi, N. Measuring Physical Environments of Parks and Playgrounds: EAPRS Instrument Development and Inter-Rater Reliability. J. Phys. Act Health 2006, 3, S190–S207. [Google Scholar] [CrossRef]
  34. van Dillen, S.M.E.; de Vries, S.; Groenewegen, P.P.; Spreeuwenberg, P. Greenspace in Urban Neighbourhoods and Residents’ Health: Adding Quality to Quantity. J. Epidemiol. Community Health 2012, 66, e8. [Google Scholar] [CrossRef]
  35. Cohen, J.R. Abandoned Housing: Exploring Lessons from Baltimore. Hous. Policy Debate 2001, 12, 415–448. [Google Scholar] [CrossRef]
  36. Massey, D.S.; Tannen, J. A Research Note on Trends in Black Hypersegregation. Demography 2015, 52, 1025–1034. [Google Scholar] [CrossRef]
  37. Brown, L.T. The Black Butterfly: The Harmful Politics of Race and Space in America; Johns Hopkins University Press: Baltimore, MD, USA, 2021; ISBN 978-1-4214-3987-7. [Google Scholar]
  38. Holtan, M.T.; Dieterlen, S.L.; Sullivan, W.C. Social Life Under Cover: Tree Canopy and Social Capital in Baltimore, Maryland. Environ. Behav. 2015, 47, 502–525. [Google Scholar] [CrossRef]
  39. Schwarz, K.; Fragkias, M.; Boone, C.G.; Zhou, W.; McHale, M.; Grove, J.M.; O’Neil-Dunne, J.; McFadden, J.P.; Buckley, G.L.; Childers, D.; et al. Trees Grow on Money: Urban Tree Canopy Cover and Environmental Justice. PLoS ONE 2015, 10, e0122051. [Google Scholar] [CrossRef] [PubMed]
  40. Solins, J.P.; Phillips de Lucas, A.K.; Cadenasso, M.L.; Grove, J.M. Green Stormwater Infrastructure Projects Voluntarily Installed in Baltimore City Through 2019. Environmental Data Initiative. 2021. Available online: https://portal.edirepository.org/nis/mapbrowse?packageid=knb-lter-bes.5015.1 (accessed on 9 February 2025).
  41. Scott, T.; Lane, C.; Scheuler, T. Bioretention Illustrated: A Visual Guide for Constructing, Inspecting, Maintaining and Verifying the Bioretention Practice; Chesapeake Stormwater Network: Ellicott City, MD, USA, 2013; p. 95. [Google Scholar]
  42. Beninde, J.; Veith, M.; Hochkirch, A. Biodiversity in Cities Needs Space: A Meta-Analysis of Factors Determining Intra-Urban Biodiversity Variation. Ecol. Lett. 2015, 18, 581–592. [Google Scholar] [CrossRef]
  43. Hennig, E.I.; Ghazoul, J. Pollinating Animals in the Urban Environment. Urban Ecosyst 2012, 15, 149–166. [Google Scholar] [CrossRef]
  44. Wenzel, A.; Grass, I.; Belavadi, V.V.; Tscharntke, T. How Urbanization Is Driving Pollinator Diversity and Pollination—A Systematic Review. Biol. Conserv. 2020, 241, 108321. [Google Scholar] [CrossRef]
  45. Jordan, K.K.; Jones, S.C. Invertebrate Fauna Associated with Mulch in Urban Environments. In Proceedings of the 4th International Conference on Urban Pests, Charleston, SC, USA, 7–10 July 2002; Pocahontas Press: Blacksburg, VA, USA, 2002; pp. 87–94. [Google Scholar]
  46. Stagoll, K.; Manning, A.D.; Knight, E.; Fischer, J.; Lindenmayer, D.B. Using Bird–Habitat Relationships to Inform Urban Planning. Landsc. Urban Plan. 2010, 98, 13–25. [Google Scholar] [CrossRef]
  47. Altman, A.; Shennan, S.; Odling-Smee, J. Ornamental Plant Domestication by Aesthetics-Driven Human Cultural Niche Construction. Trends Plant Sci. 2022, 27, 124–138. [Google Scholar] [CrossRef]
  48. Grove, M.; Ogden, L.; Pickett, S.; Boone, C.; Buckley, G.; Locke, D.H.; Lord, C.; Hall, B. The Legacy Effect: Understanding How Segregation and Environmental Injustice Unfold over Time in Baltimore. Ann. Am. Assoc. Geogr. 2018, 108, 524–537. [Google Scholar] [CrossRef]
  49. R Core Team R. A Language and Environment for Statistical Computing 2024; R Foundation: Vienna, Austria, 2024. [Google Scholar]
  50. Wei, T.; Simko, V. R Package “Corrplot”: Visualization of a Correlation Matrix. 2024. Available online: https://cran.r-project.org/web/packages/corrplot/corrplot.pdf (accessed on 9 February 2025).
  51. Krause, N. (Department of Public Works, Baltimore, MD, USA); Solins, J.P. (University of California, Davis, CA, USA). Personal Communication, 2019.
  52. Tran, T.J.; Helmus, M.R.; Behm, J.E. Green Infrastructure Space and Traits (GIST) Model: Integrating Green Infrastructure Spatial Placement and Plant Traits to Maximize Multifunctionality. Urban For. Urban Green. 2020, 49, 126635. [Google Scholar] [CrossRef]
  53. Kuller, M.; Bach, P.M.; Ramirez-Lovering, D.; Deletic, A. What Drives the Location Choice for Water Sensitive Infrastructure in Melbourne, Australia? Landsc. Urban Plan. 2018, 175, 92–101. [Google Scholar] [CrossRef]
  54. Meerow, S.; Newell, J.P. Spatial Planning for Multifunctional Green Infrastructure: Growing Resilience in Detroit. Landsc. Urban Plan. 2017, 159, 62–75. [Google Scholar] [CrossRef]
  55. Lausen, E.D.; Backhaus, A.; Jensen, M.B.; Lausen, E.D. Urbanites’ Perception of Vegetation in Landscape-Based Stormwater Management Elements (LSM). Urban Ecosyst 2022, 25, 1577–1588. [Google Scholar] [CrossRef]
Figure 1. Locations of assessed regulatory and voluntary GSI facilities in the city of Baltimore, MD, USA.
Sustainability 17 02648 g001
Figure 2. Comparison of ecosystem service scores (a) and total size (b) of regulatory (n = 28) and voluntary (n = 48) GSI facilities. Only size was significantly different between the two datasets.
Sustainability 17 02648 g002
Figure 3. Examples of regulatory (a,c,e) and voluntary (b,d,f) GSI facilities with different scores and characteristics. GSI facilities shown in (a,b) received high scores, while those in (e,f) received low scores. GSI facilities in (c,d) had intermediate scores due to good maintenance, although they lack vegetation complexity and clear aesthetic design elements.
Sustainability 17 02648 g003
Figure 4. For regulatory (left) and voluntary (right) GSI facilities, Spearman correlations among ecosystem service scores, size, age, and sociodemographic variables for the census tracts in which facilities were located. Correlations within the black boxes relate facility characteristics to sociodemographic characteristics. Spearman’s rho is shown for all relationships, but only statistically significant relationships (p < 0.05) include an ellipse that visually represents the strength and direction of the correlation.
Sustainability 17 02648 g004
Table 1. Scoring rubric for GSI facilities. Scores were assigned in the field except for cover scores. Cover was quantified into percentage classes in the field and then assigned a score after data collection.
VariableScore = 4Score = 3Score = 2Score = 1
Bed erosionBed is flat and even; no sign of erosionMinor rill/sheet erosion (<15 cm)Moderate gully erosion (15–30 cm)Major gully erosion (>30 cm)
Inlet erosion
(N/A if no inlet)
No evidence of erosion at the inletMinor gully erosion (<15 cm)Moderate gully erosion (15–30 cm)Major gully erosion (>30 cm)
Inlet obstructionNo obstruction to water entering the facility at the inlet; inlet free of sediment/debrisMinor amount of sediment/debris accumulation at the inlet (<2.5 cm)Moderate amount of sediment/debris accumulation at the inlet (2.5–8 cm)Major obstruction of the inlet is likely preventing water from entering the facility (>8 cm)
Outflow obstruction
(N/A if no outflow)
Outflow device is free of sediment/debrisMinor amount of sediment/debris; nominal loss of capacityModerate amount of sediment/debris; substantial loss of capacityOutflow device is completely clogged with sediment/debris
TrashFacility is largely free from trash (<1% coverage)Facility contains trash, but it is concentrated or not highly noticeable (1–5% coverage)Facility contains noticeable amounts of trash (5–25% coverage)Facility is dominated by trash (>25% coverage)
Damage to structural elements
(N/A if none present)
Facility has no signs of damageFacility shows signs of minor damage (e.g., cracks in cement, graffiti)Facility shows moderate signs of damage (e.g., some broken structures or missing parts)Facility is majorly damaged (e.g., structures broken beyond function)
Vegetation maintenanceVegetation is well maintained; lack of weeds, overgrowth, or diebackVegetation is maintained, but appears some time has passed without attentionFew signs of upkeep; many weeds present, vegetation overgrown, etc.No signs of upkeep; vegetation completely overgrown; mostly weeds
Tree & shrub cover>50%25–50%5–24%<5%
Cover of plants with showy flowers>50%25–50%5–24%<5%
Total vegetation cover>125%100–125%50–99%<50%
Shannon Index for cover types>1.41.21–1.41–1.2<1
Table 2. Factors used to determine total stormwater, aesthetic, and habitat scores.
Ecosystem ServiceMean of Scores for:Additional Factors
StormwaterInlet erosion (if inlet present)
Bed erosion
Inlet obstruction (if inlet present)
Outflow obstruction (if outflow present)
Total vegetation cover
Trash
Subtract 0.25 for presence of:
  • pet waste
  • sediment caking
  • slope erosion
  • inlet or outlet rocks out of place
HabitatTotal vegetation cover
Cover of plants with showy flowers
Shannon Index for cover types
AestheticsVegetation maintenance
Cover of plants with showy flowers
Trash
Damage (if structural elements present)
Add 0.5 for presence of art
Table 3. Summary of explanatory variables for regulatory and voluntary facilities. Sociodemographic characteristics are for census block groups in which facilities were located.
VariableRegulatory (n = 28)Voluntary (n = 48)
MinMaxMeanMedianMinMaxMeanMedian
Income (US $)12,618141,25046,74739,29714,750140,62549,20643,846
Education (%)42.298.582.282.854.7100.079.279.4
Black (%)1.4100.064.683.00.6100.064.373.8
Vacancy (%)052.914.79.0060.124.620.6
Facility age (years)3125.85093.94
Disclaimer/Publisher’s Note: The statements, opinions and data contained in all publications are solely those of the individual author(s) and contributor(s) and not of MDPI and/or the editor(s). MDPI and/or the editor(s) disclaim responsibility for any injury to people or property resulting from any ideas, methods, instructions or products referred to in the content.

