
Green Building Design and Sustainable Development Optimization Strategy Based on Evolutionary Game Theory Model


Abstract
1. Introduction
2. Literature Review
3. Evolutionary Game Model Analysis
3.1. Model Assumptions
3.2. Model Building
3.3. Discussion of the Model Evolution Stability Strategy (ESS)
4. Numerical Simulation
4.1. Model Validation
4.2. Simulation Analysis
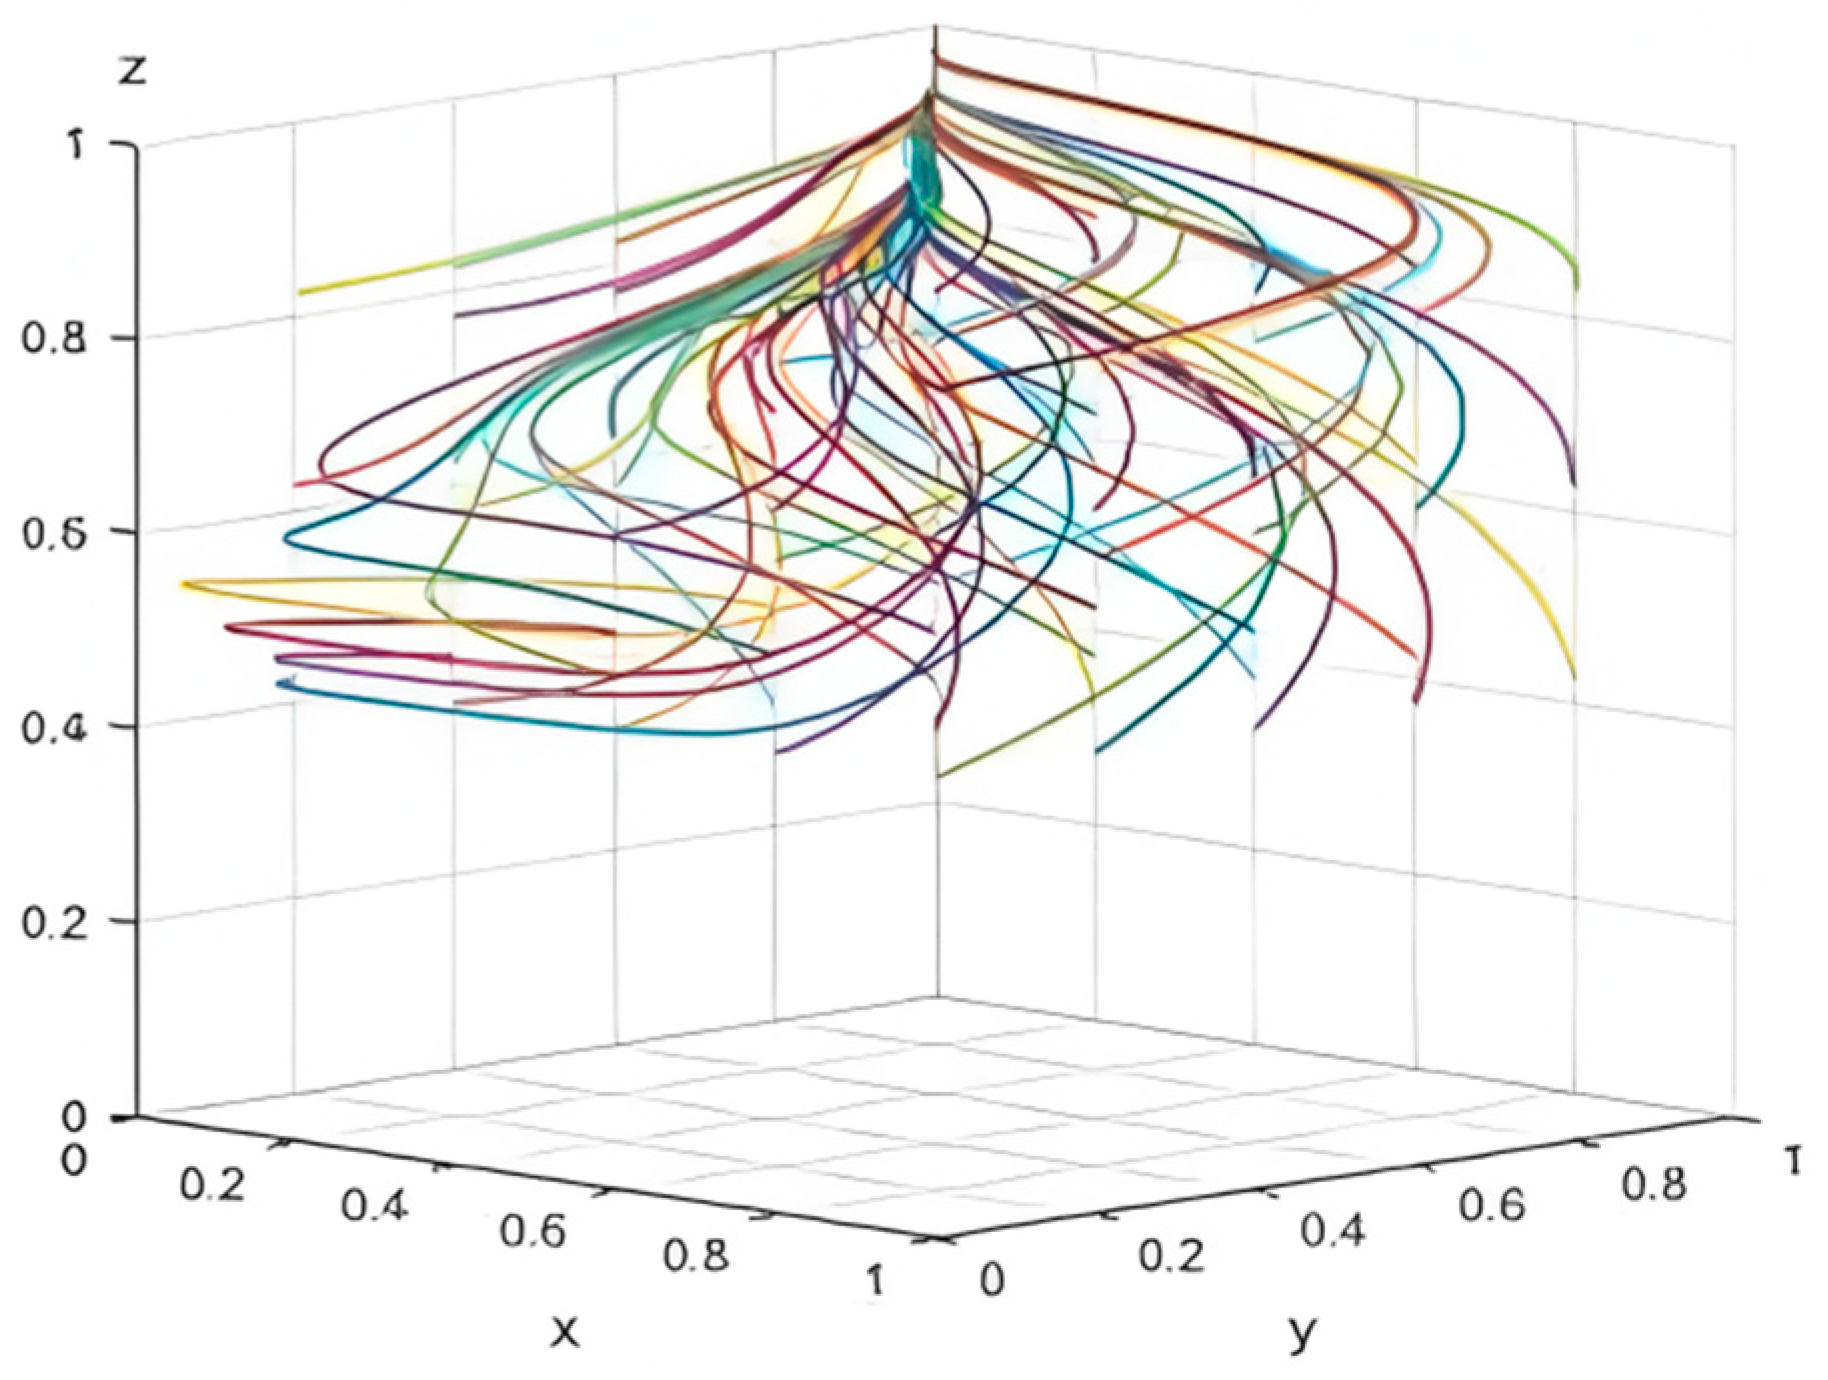
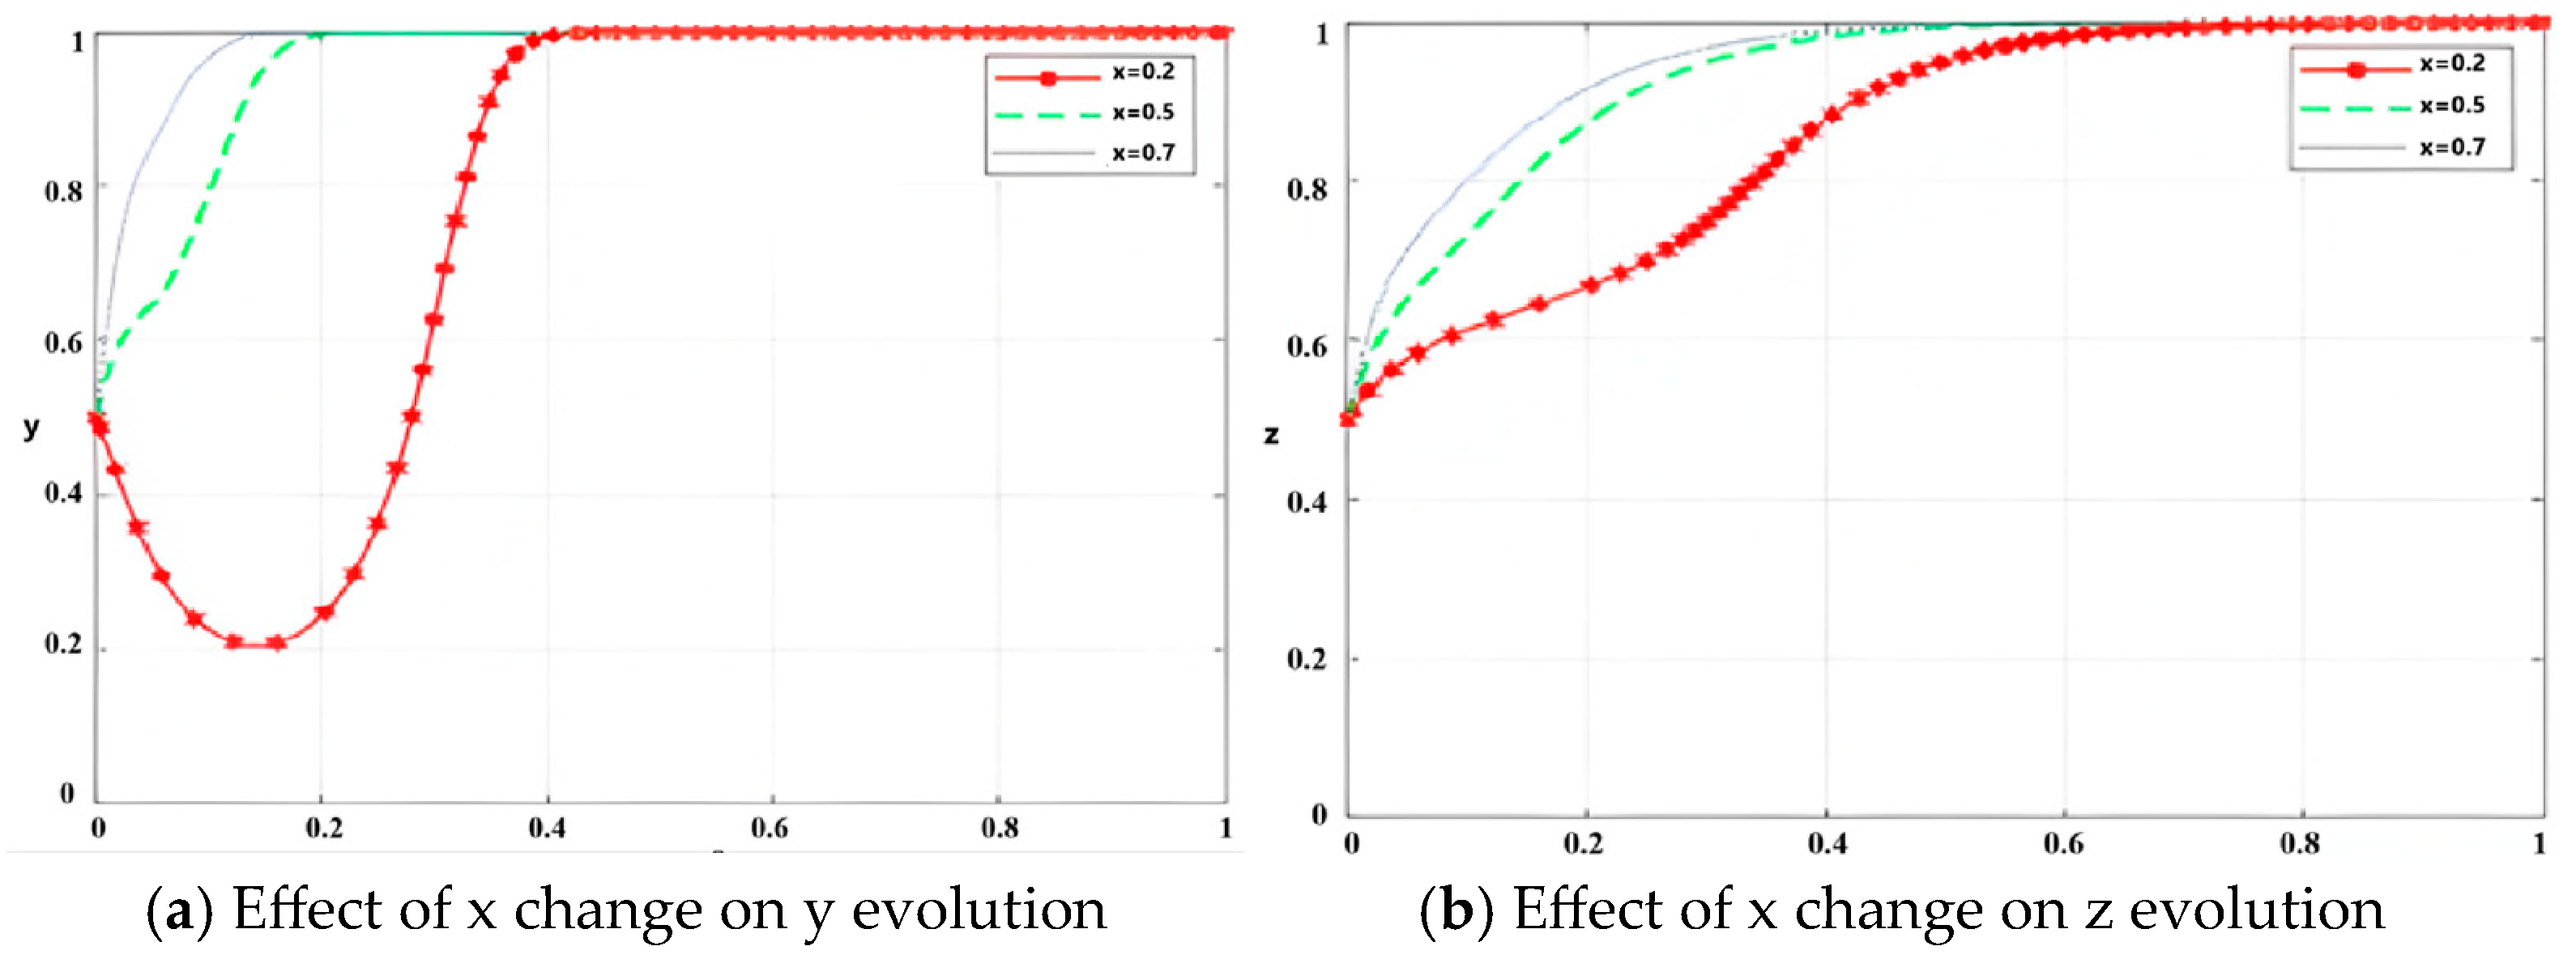
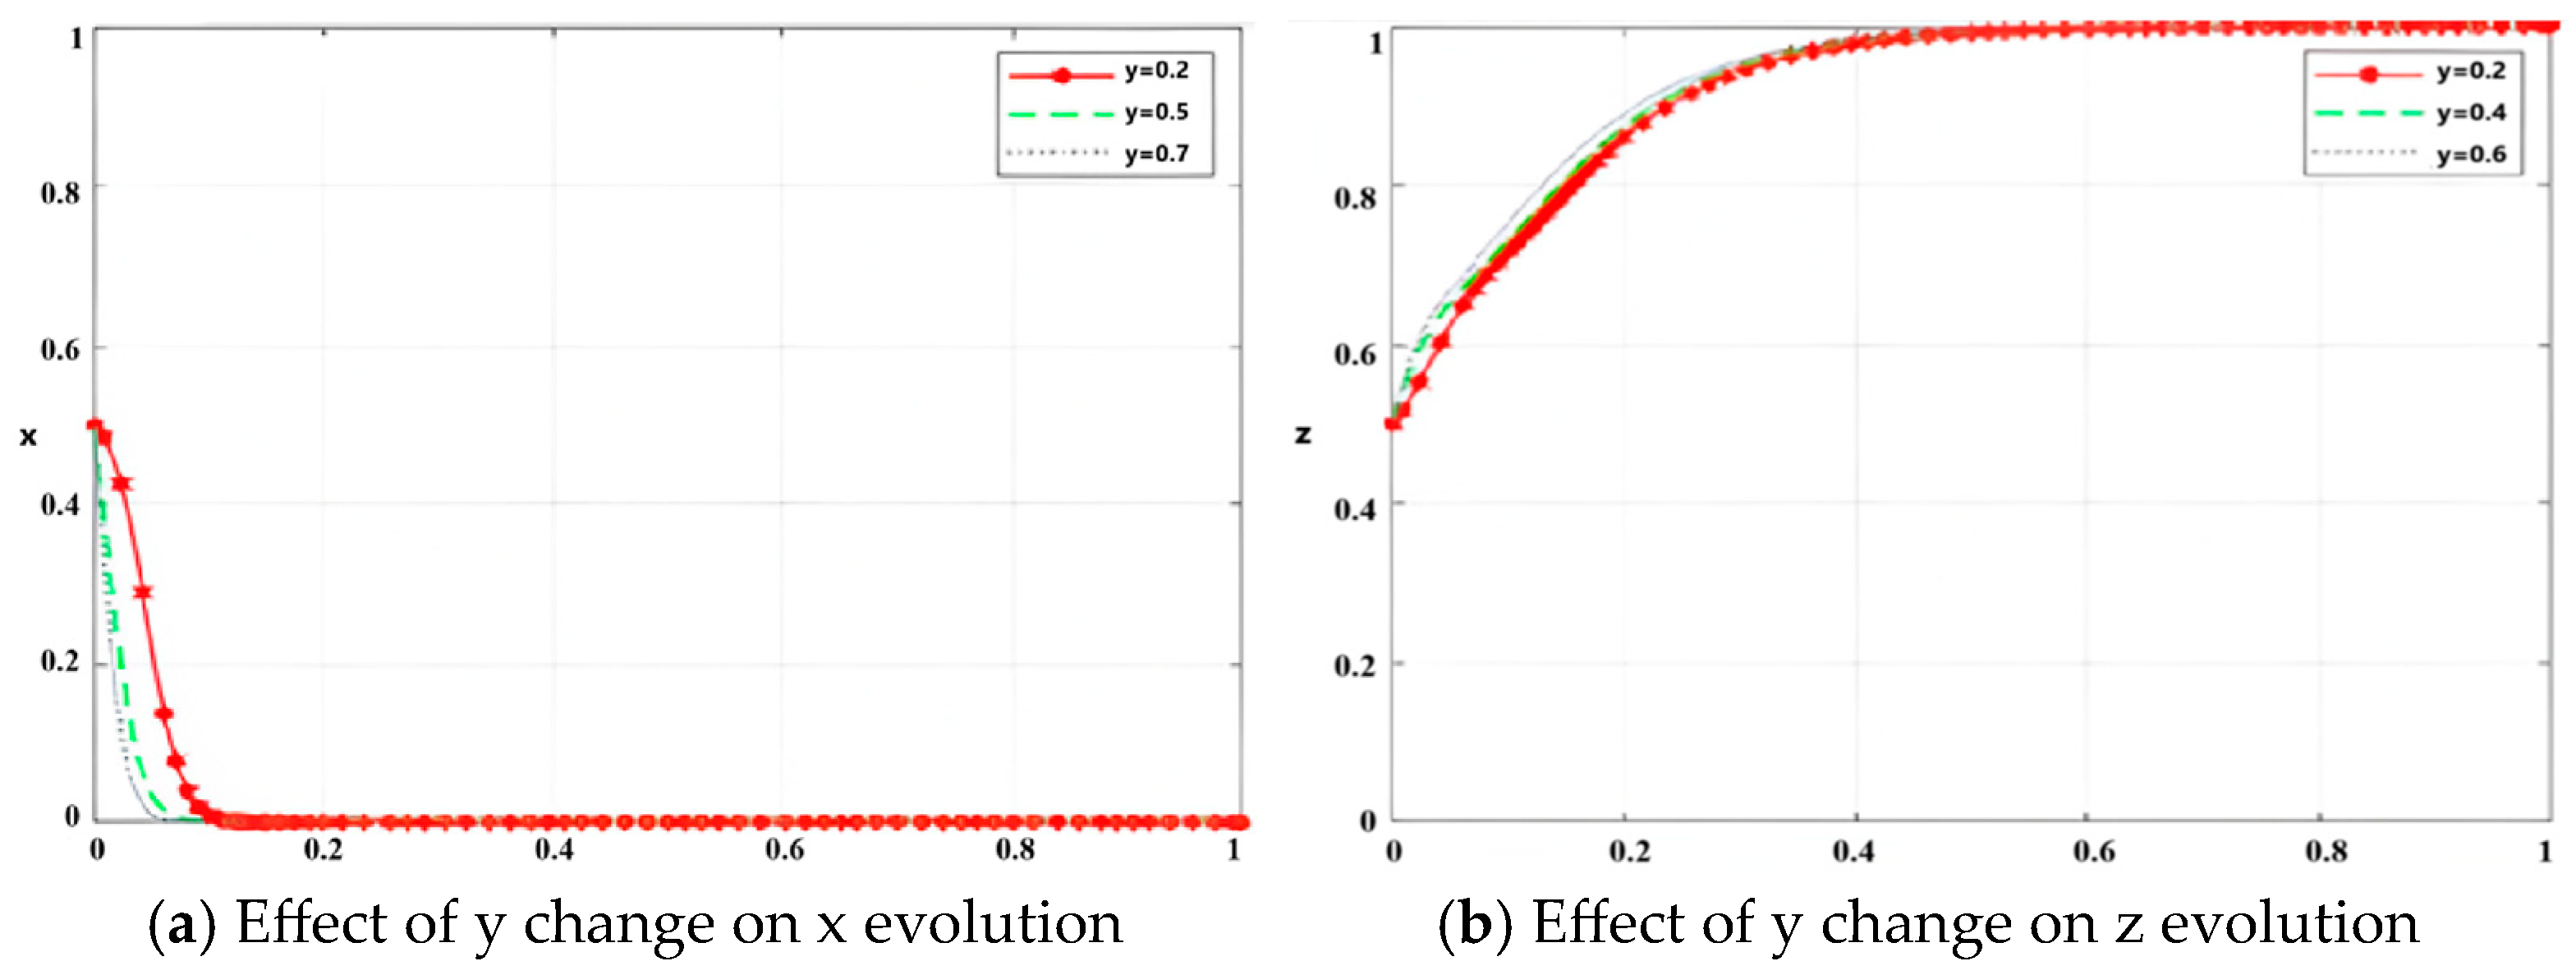
4.2.1. The Impact of the Initial Strategy on the Change of the System
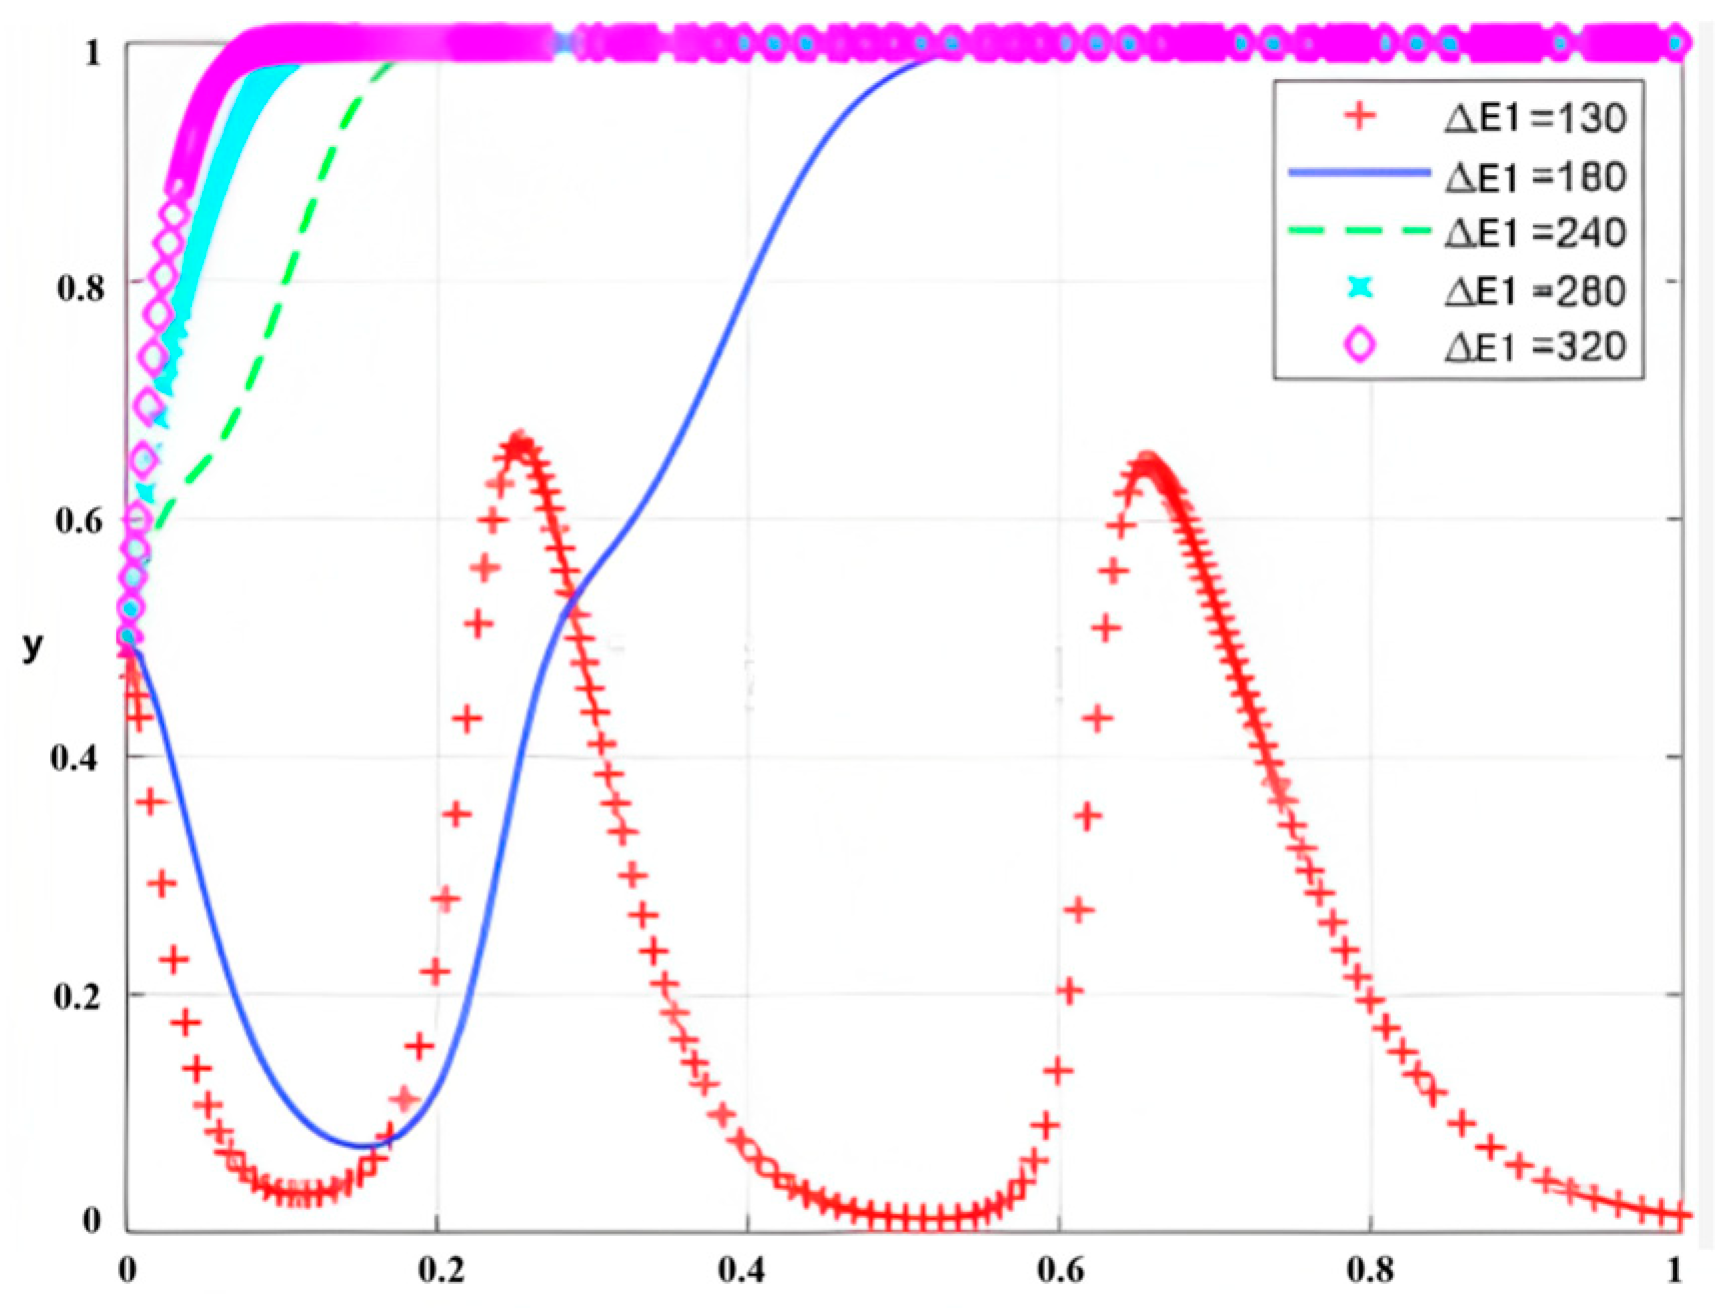
4.2.2. The Effect of Parameters of Benefits and Costs on Evolution
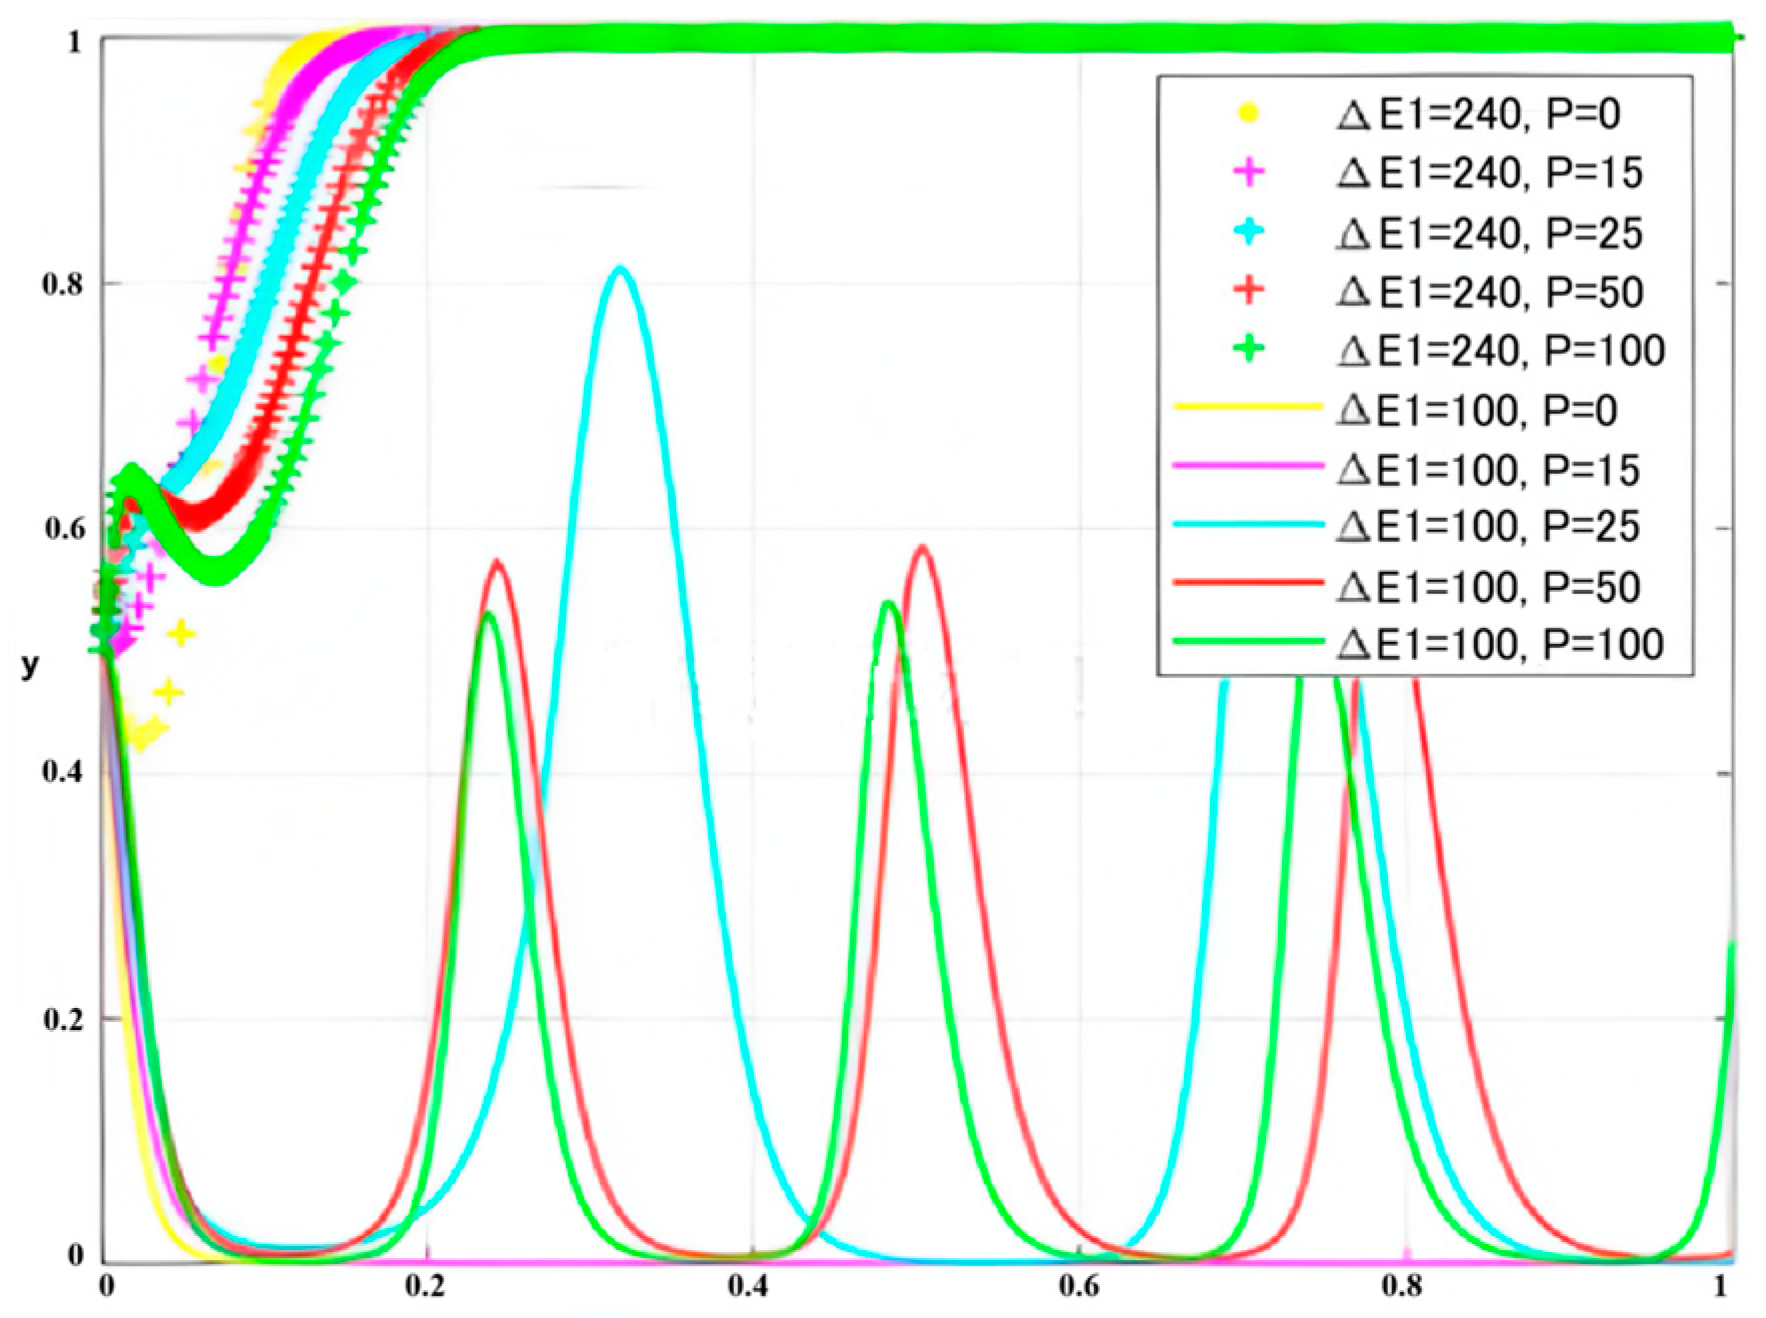
4.2.3. The Effect of Reward and Punishment Parameters
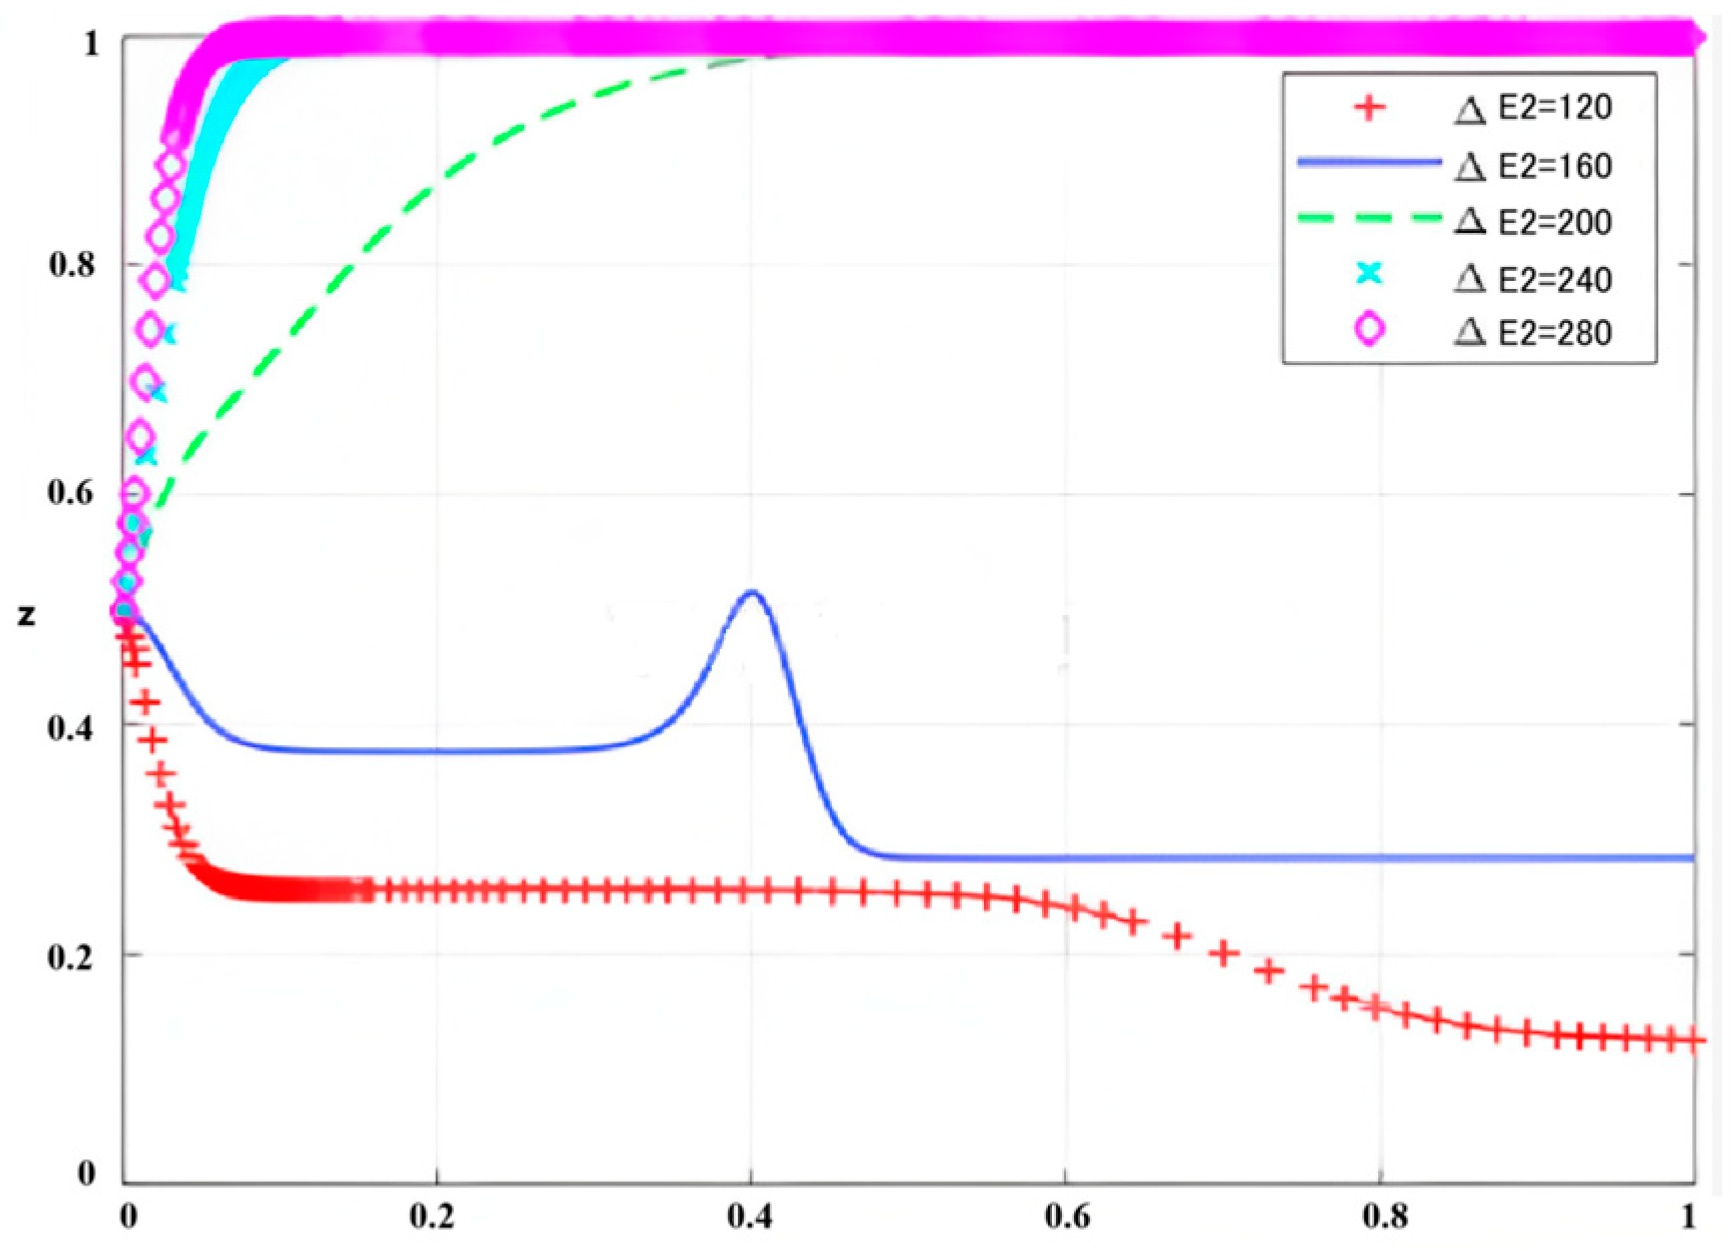
4.2.4. The Effect of Tenant Expectations on System Evolution
5. Conclusions
6. Recommendations and Countermeasures
6.1. Recommendations
6.2. Countermeasures
Author Contributions
Funding
Institutional Review Board Statement
Informed Consent Statement
Data Availability Statement
Conflicts of Interest
References
- Tayyab, A.; Ajibade, A.A. Managing green building development—A review of current state of research and future directions. Build. Environ. 2019, 155, 83–104. [Google Scholar]
- Govind, S.M.; Murali, S.; Elias, J.; Delfiya, D.A.; Alfiya, P.; Samuel, M.P. Experimental investigations on unglazed photovoltaic thermal system using water and nanofluid cooling medium. Renew. Energy 2022, 188, 986–996. [Google Scholar]
- Obalanlege, M.A.; Mahmoudi, Y.; Douglas, R.; Ebrahimnia-Bajestan, E.; Davidson, J.; Bailie, D. Performance assessment of a hybrid photovoltaic thermal and heat pump system for solar heating and electricity. Renew. Energy 2020, 148, 558–572. [Google Scholar] [CrossRef]
- Liu, Y.; Zuo, J.; Pan, M. The incentive mechanism and decision-making behavior in the green building supply market: A tripartite evolutionary game analysis. Build. Environ. 2022, 214, 108903. [Google Scholar] [CrossRef]
- Lu, W.; Du, L.; Tam, V.W. Evolutionary game strategy of stakeholders under the sustainable and innovative business model: A case study of green building. J. Clean. Prod. 2022, 333, 130–136. [Google Scholar] [CrossRef]
- Patro, P.R.; Kumar, N.K. A case study on life cycle cost analysis of a green building. Int. J. Technol. 2015, 5, 322–328. [Google Scholar] [CrossRef]
- Song, H.; Gao, X. Green supply chain game model and analysis under revenue -sharing contract. J. Clean. Prod. 2018, 170, 183–192. [Google Scholar] [CrossRef]
- Safaei, M.; Dawsari, S.A.; Yahya, K. Optimizing multi-channel green supply chain dynamics with renewable energy integration and emissions reduction. Sustainability 2024, 16, 9710. [Google Scholar] [CrossRef]
- Yuan, Z.; Zhao, M.; Du, M. Price discount of green residential building in China’s second-hand housing market: Evidence from shenzhen. Sustain. Energy Technol. Assess. 2022, 52, 102171. [Google Scholar] [CrossRef]
- Wu, Z.; Ma, G. Incremental cost-benefit quantitative assessment of green building: A case study in China. Energy Build. 2022, 269, 112251. [Google Scholar] [CrossRef]
- Stocchero, A.; Seadon, J.K.; Falshaw, R.; Edwards, M. Urban equilibrium for sustainable cities and the contribution oftimber buildings to balance urban carbon emissions: A new zealand case study. J. Clean. Prod. 2017, 143, 1001–1010. [Google Scholar] [CrossRef]
- Dwaikat, L.N.; Ali, K.N. Green buildings cost premium: A review of empirical evidence. Energy Build. 2016, 110, 396–403. [Google Scholar] [CrossRef]
- Hu, Q.; Shen, G.Q. Promoting green buildings in China’s multi-level governance system: A tripartite evolutionary game analysis. Build. Environ. 2023, 242, 110548. [Google Scholar] [CrossRef]
- Blumenthal, V.; Jensen, O. Consumer immersion in the experiencescape of managed visitor attractions: The nature of the immersion process and the role of involvement. Tour. Manag. Perspect. 2019, 30, 159–170. [Google Scholar] [CrossRef]
- Elbedweihy, A.M.; Chanaka, J.; Elsharnouby, M.H.; Elsharnouby, T.H. Customer relationship building: The role of brand attractiveness and consumer brand identification. J. Bus. Res. 2016, 69, 213. [Google Scholar] [CrossRef]
- Olubunmi, O.A.; Xia, P.B.; Skitmore, M. Green buildingincentives: A review. Renew. Sustain. Energy Rev. 2016, 59, 1161–1621. [Google Scholar] [CrossRef]
- Mojumder, A.; Singh, A.; Kumar, A. Mitigating the barriers to green procurement adoption: An exploratory study of the Indian construction industry. J. Clean. Prod. 2022, 372, 133505. [Google Scholar] [CrossRef]
- Donovan, R.J.; Rossiter, J.R.; Marcoolyn, G.; Nesdale, A. Store atmosphere and purchasing behavior. J. Retail. 1994, 70, 283–294. [Google Scholar] [CrossRef]
- Long, G.Q.; Xu, T.X.; Li, C. Evaluation of green building incremental cost and benefit based on SD model. E3S Web Conf. 2021, 237, 03012. [Google Scholar] [CrossRef]
- Zhang, F.F.; Yin, X.X. Research on the impact of green building design on residential quality of life. Eng. Constr. 2024, 38, 693–694+697. [Google Scholar]
- Aguilar, F.X.; Hendrawan, D.; Cai, Z.; Roshetko, J.M.; Stallmann, J. Smallholder farmer resilience to water scarcity. Environ. Dev. Sustain. 2022, 24, 2543–2576. [Google Scholar] [CrossRef]
- Pan, Y.Q.; Wei, J.J.; Liang, Y.M. Assessment of carbon emission reduction potential of green building energy saving technologies in typical public building operations. Heat. Vent. Air Cond. 2022, 52, 83–89+131. [Google Scholar]
- Wu, Z.; Liu, M.; Ma, G. A machine learning-based two-stage integrated framework for cost reasonableness prediction of green building projects. J. Build. Eng. 2025, 100, 111733. [Google Scholar] [CrossRef]
- Zhou, S.B.; Li, Y.; Li, H.Y. Evolutionary game analysis of supply and demand subjects of green buildings based on prospect theory. J. Eng. Manag. 2024, 38, 25–30. [Google Scholar]
- Sinyoung, S.; Jeeraro, A.; Udomkun, P. Enhancing CO2 sequestration through corn stalk biochar-enhanced mortar: A synergistic approach with algal growth for carbon capture applications. Sustainability 2025, 17, 342. [Google Scholar] [CrossRef]
- Wang, Y.; Wang, D.; Shi, X. Exploring the dilemma of overcapacity governance in China’s coal industry: A tripartite evolutionary game model. Resour. Policy 2021, 71, 102000. [Google Scholar] [CrossRef]
- Mounir, S.; Maaloufa, Y.; Khabbazi, A. Energy efficiency of a solar green building using bio-sourced materials for indoor temperature and humidity optimization. Energy Eng. 2024, 122, 41–62. [Google Scholar]
- Zhang, S.; Sun, S.R.; Ma, H.M. Evolutionary Game of Three Groups Based on Reducing Source of Packaging Garbage. Packag. Eng. 2018, 39, 129–137. [Google Scholar]
- Dong, D.; Zhang, R.; Guo, W.; Gong, D.; Zhao, Z.; Zhou, Y.; Xu, Y.; Fujioka, Y. Assessing Spatiotemporal Dynamics of Net Primary Productivity in Shandong Province, China (2001–2020) Using the CASA Model and Google Earth Engine: Trends, Patterns, and Driving Factors. Remote Sens. 2025, 17, 488. [Google Scholar] [CrossRef]
- Oyewo, B. Corporate governance and carbon emissions performance: International evidence on curvilinear relationships. J. Environ. Manag. 2023, 334, 117474. [Google Scholar] [CrossRef]
- Singh, S.; Kumar, K. A study of lean construction and visual management tools through cluster analysis. Ain Shams Eng. J. 2021, 12, 1153–1162. [Google Scholar] [CrossRef]
- Higuchi, A.; Maehara, R. A factor-cluster analysis profile of consumers. J. Bus. Res. 2021, 123, 70–78. [Google Scholar] [CrossRef]


| Key Players | Parameter | Definitions |
|---|---|---|
| Government | GP | The cost of active government regulation, the comprehensive cost required by the government to implement energy transformation and regulation, including labor costs (such as salaries, training, and management expenses for regulatory personnel), material costs (such as office equipment, monitoring facilities, and technical support), and financial expenditures (such as special funds, operation and maintenance expenses, etc.). This parameter is calculated by quantitatively evaluating different resource inputs and using a weighted sum method. |
| αGP | Cost of passive government regulation (0 < α < 1). The determination of this parameter is based on historical regulatory data and expert evaluations, reflecting the proportion of resources that the government can save when reducing regulatory investment. For example, the specific value of alpha can be determined by comparing the actual expenditures of the government under active and passive regulation using statistical regression or expert scoring methods and used as a reduction factor in the model. | |
| SR | Direct financial subsidies provided by the government to encourage investors to implement energy transformation. | |
| SU | The economic incentives provided by the government to encourage tenants to accept renovation projects. | |
| W | Environmental and social benefits from energy-saving retrofits. | |
| P | Investors refuse to implement energy-saving retrofits and government fines. | |
| D | Losses caused by the government’s failure to meet tenants’ expectations. | |
| Investors | C1 | The investor’s base cost, including funds, equipment, technology, and management expenses. |
| E1 | Traditional income for investors. | |
| ∆C1 | Increased costs for investors due to energy-saving retrofit, including technical renovation costs, equipment renewal costs, and related management and maintenance costs. When calculating it specifically, various costs in the renovation project can be decomposed, such as technical renovation fees, equipment procurement and installation fees, and subsequent operation and maintenance fees. Then, actual project data or market research data can be used for quantification and, finally, summarized to form the total incremental cost. | |
| ∆E1 | Energy-saving retrofits bring additional income to the investor, including cost savings brought by energy conservation and consumption reduction, premium income generated by enhancing market competitiveness, etc. The specific composition can be divided into direct energy-saving benefits and indirect brand effect benefits. The data sources can include financial statements of enterprises, market research data, and relevant industry literature. After determining the contribution ratio of each form of income through expert evaluation and quantitative models, the total incremental income value can be obtained through weighted summation. | |
| T | T represents the turnover cost incurred by investors due to tenants choosing to move out after energy transformation, including rental penalties, tenant relocation, and the cost of finding new tenants. By collecting actual case data and market research results, various expenses are segmented and quantified, and, finally, the total cost of the item is synthesized using a weighted method. | |
| Tenants | C2 | The basic cost of the tenant, including rent, energy consumption, and daily management expenses. |
| E2 | The traditional income of the tenant. | |
| ∆C2 | Tenants accept the incremental cost of energy-efficient retrofit; this includes adjustment costs incurred due to renovation, adaptation to new systems or technologies, as well as rental changes that may be caused by environmental improvements. By collecting actual operational data and market research data from tenants, refining the composition of various costs, and using quantitative methods for comprehensive evaluation, the total incremental cost of tenants can ultimately be obtained. | |
| ∆E2 | Tenants receive additional income from energy-efficient retrofit; the main sources are the improved working environment, reduced energy consumption, resulting in cost savings, and possible rental discounts. By collecting business operation data, preferential information in lease contracts, and market research results, these benefits can be quantified, and the weighted sum method can be used to calculate the overall incremental income of the lessor. |
| Strategies of Key Players | Tenants (z) | Tenants (1 − z) | |
|---|---|---|---|
| Government (x) | Investors (y) | W − GP − SR − SU | W − GP − SR |
| E1 + ∆E1 + SR − C1 − ∆C1 | SR − C1 − ∆C1 | ||
| E2 + ∆E2 + SU − C2 − ∆C2 | E2 − C2 | ||
| Investors (1 − y) | P − GP | P − GP | |
| E1 − C1 − T − P | E1 − C1 − P | ||
| E2 − C2 | E2 − C2 | ||
| Government (1 − x) | Investors (y) | W − αGP − D | W − αGP |
| E1 + ∆E1 − C1 − ∆C1 | −C1 − ∆C1 | ||
| E2 + ∆E2 − C2 − ∆C2 | E2 − C2 | ||
| Investors (1 − y) | −αGP − D | −αGP | |
| E1 − C1 − T | E1 − C1 | ||
| E2 − C2 | E2 − C2 | ||
| Balance Point | Eigenvalue | Eigenvalue Symbol |
|---|---|---|
| (0,0,0) | 0; −∆C1 − E1; P + (α − 1)GP | (0, −, *) |
| (1,0,0) | 0; (1 − α)GP − P; P − E1 + SR − ∆C1 | (0, *, *) |
| (0,1,0) | ∆C1 + E1; ∆E2 − ∆C2; (α − 1)GP − SR | (+, *, −) |
| (0,0,1) | 0; T − ∆C1 + ∆E1; D + P + (α − 1)GP | (0, *, *) |
| (1,1,0) | (1 − α)GP + SR; SU + ∆E2 − ∆C2; E1 − P − SR + ∆C1 | (+, *, *) |
| (1,0,1) | 0; (1 − α)GP − P − D; T + P + SR − ∆C1 + ∆E1 | (0, *, *) |
| (0,1,1) | ∆C2 − ∆E2; ∆C1 − T − ∆E1; D − SR − SU + (α − 1)GP | (*, *, *) |
| (1,1,1) | ∆C2 − SU − ∆E2; ∆C1 − P − SR − T − ∆E1; (1 − α)GP − D + SR + SU | (*, *, *) |
| Key Player | Parameters | Initial Values | Key Player | Parameters | Initial Values |
|---|---|---|---|---|---|
| Government | GP | 26 | Investors | ∆C1 | 175 |
| α | 0.7 | ∆E1 | 240 | ||
| SR | 100 | T | 32 | ||
| SU | 55 | Tenants | ∆C2 | 190 | |
| P | 25 | ||||
| D | 17 | ∆E2 | 200 |
Disclaimer/Publisher’s Note: The statements, opinions and data contained in all publications are solely those of the individual author(s) and contributor(s) and not of MDPI and/or the editor(s). MDPI and/or the editor(s) disclaim responsibility for any injury to people or property resulting from any ideas, methods, instructions or products referred to in the content. |
© 2025 by the authors. Licensee MDPI, Basel, Switzerland. This article is an open access article distributed under the terms and conditions of the Creative Commons Attribution (CC BY) license (https://creativecommons.org/licenses/by/4.0/).
Share and Cite
Si, Y.; Yang, Y.; Shao, Z. Green Building Design and Sustainable Development Optimization Strategy Based on Evolutionary Game Theory Model. Sustainability 2025, 17, 2649. https://doi.org/10.3390/su17062649
Si Y, Yang Y, Shao Z. Green Building Design and Sustainable Development Optimization Strategy Based on Evolutionary Game Theory Model. Sustainability. 2025; 17(6):2649. https://doi.org/10.3390/su17062649
Chicago/Turabian StyleSi, Yujing, Yi Yang, and Ze Shao. 2025. "Green Building Design and Sustainable Development Optimization Strategy Based on Evolutionary Game Theory Model" Sustainability 17, no. 6: 2649. https://doi.org/10.3390/su17062649
APA StyleSi, Y., Yang, Y., & Shao, Z. (2025). Green Building Design and Sustainable Development Optimization Strategy Based on Evolutionary Game Theory Model. Sustainability, 17(6), 2649. https://doi.org/10.3390/su17062649