
Assessing Vegetation Response to Drought in the Central Part of Oltenia Plain (Romania) Using Vegetation and Drought Indices

 , , , ,
  and
and
Abstract
1. Introduction
2. Materials and Methods
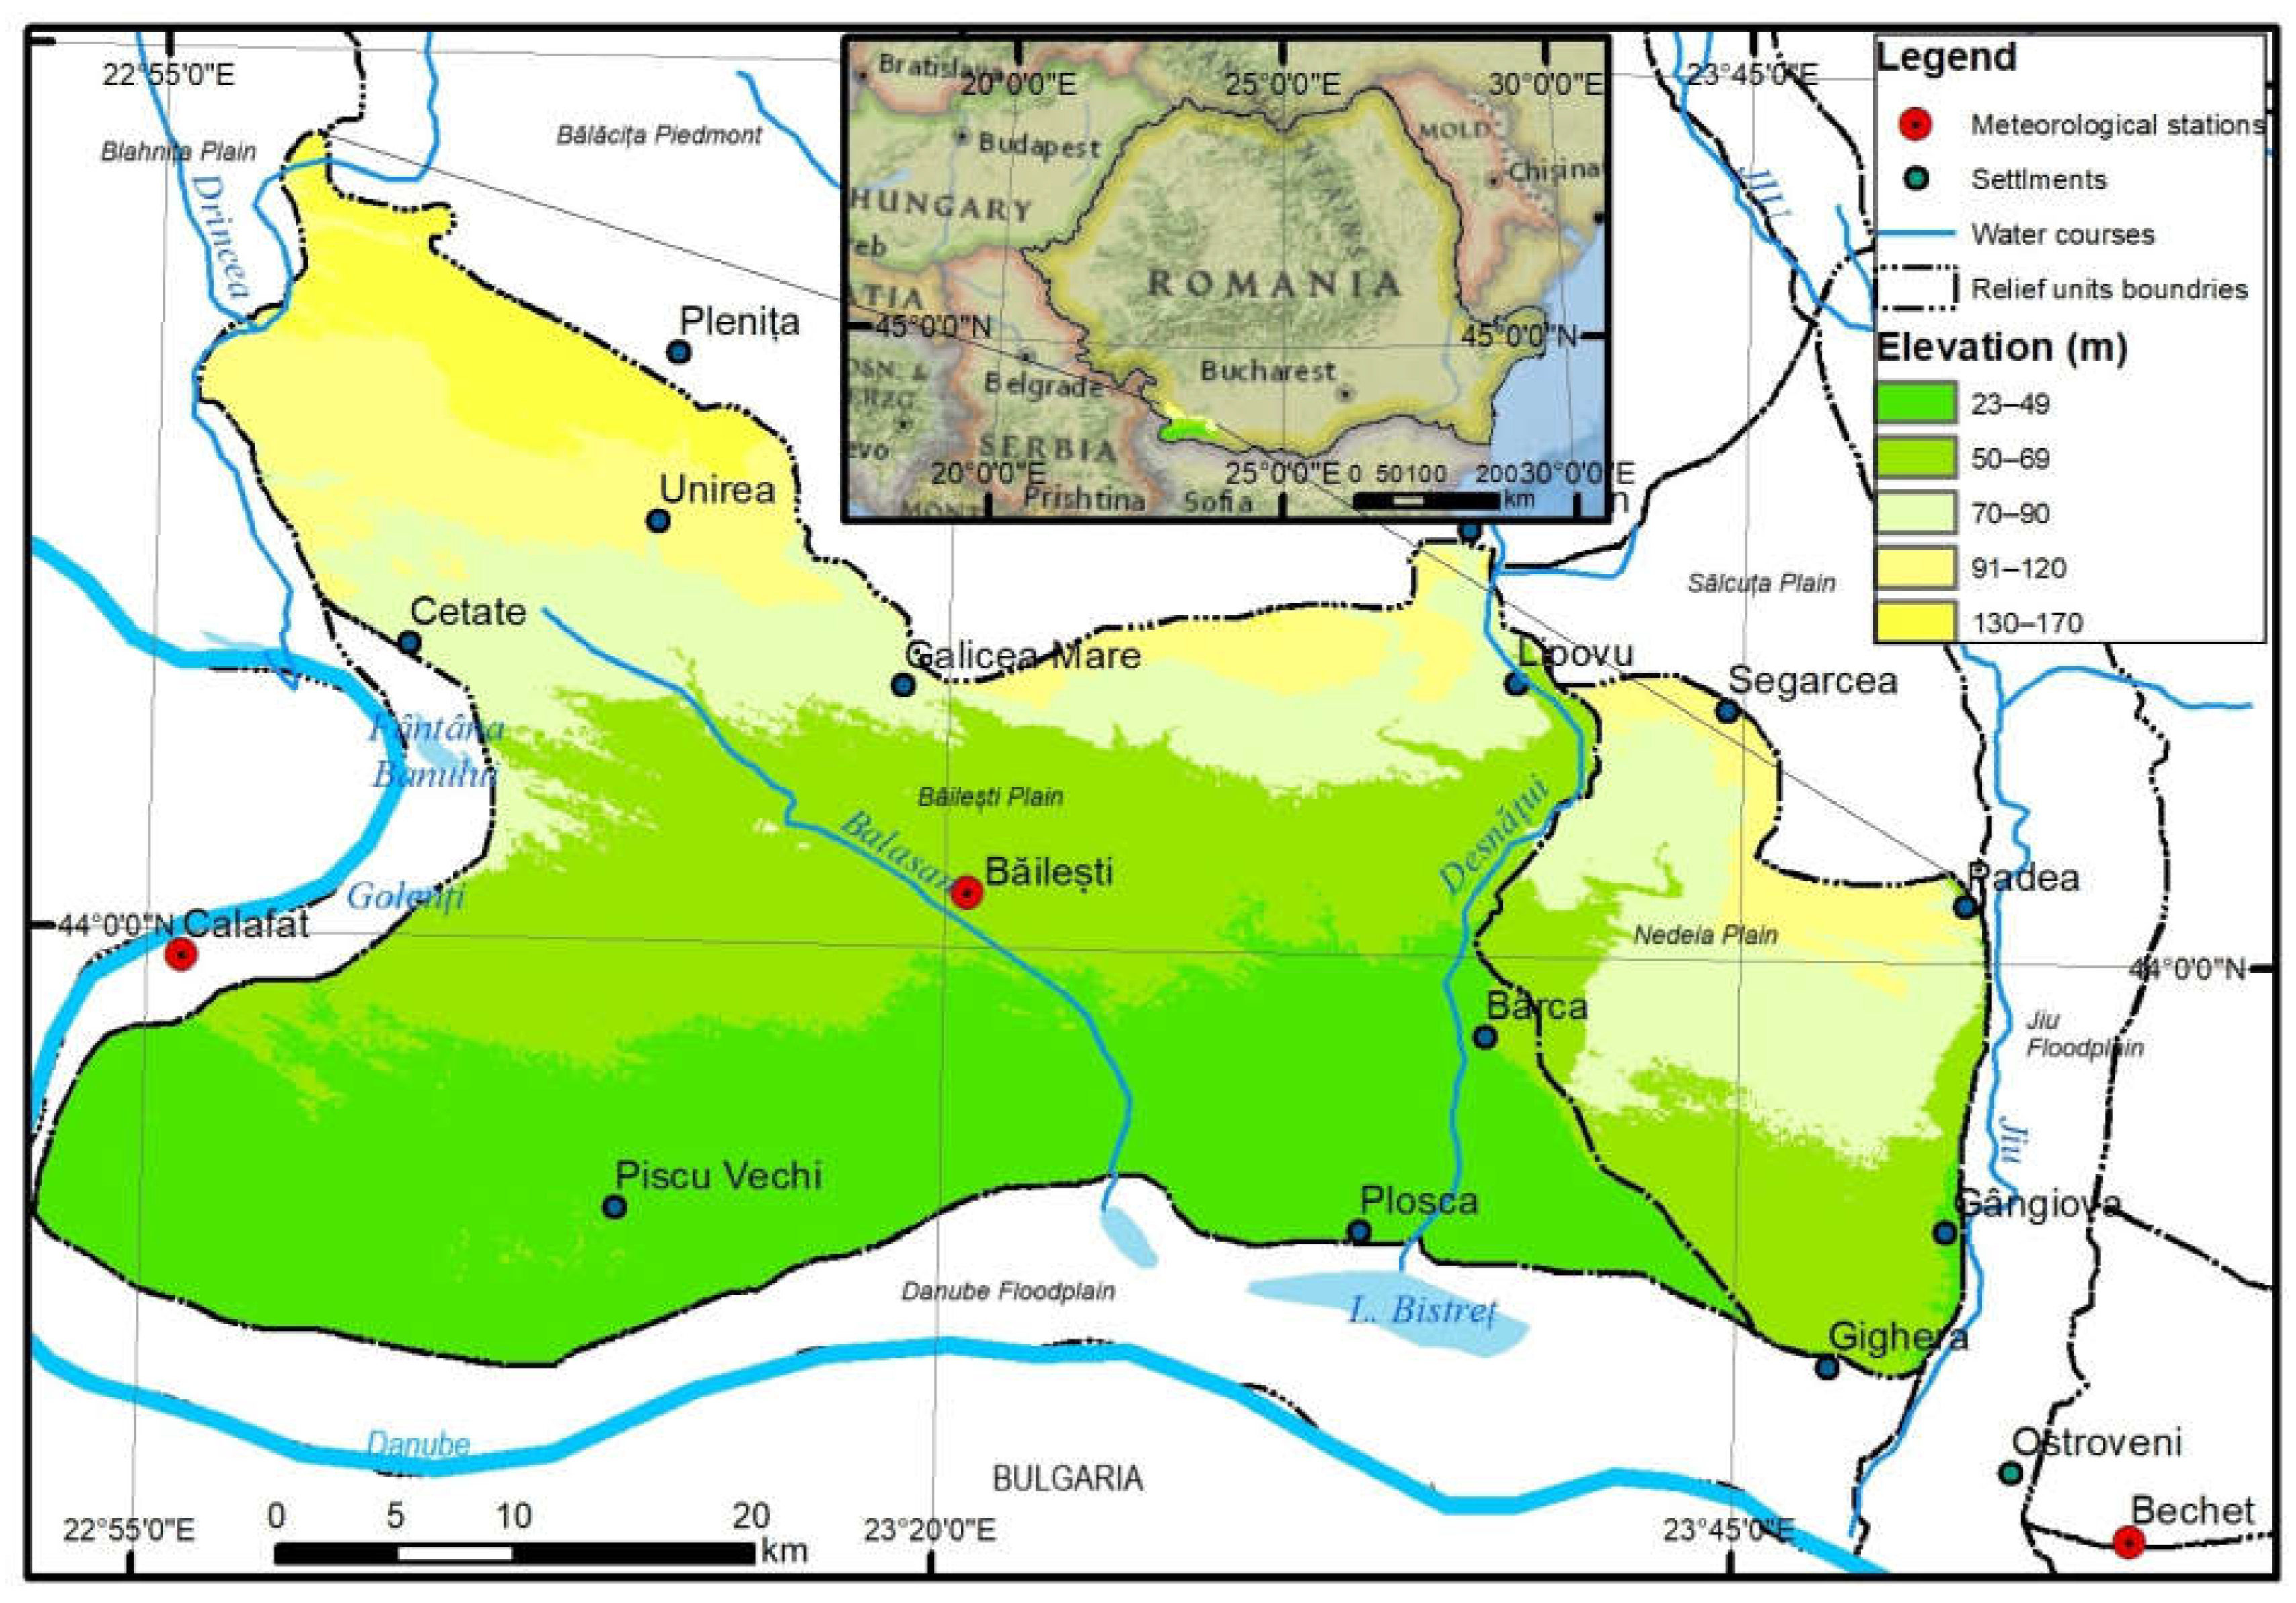
2.1. Study Area
2.2. Climate Data
2.3. Methods
2.3.1. Statistical Measures
2.3.2. Mann–Kendall Test
2.3.3. Standardized Precipitation Index (SPI)
- Step 1: we computed the average of the precipitation data (AVERAGE function) and then we calculated the variance based on all precipitation data (VAR.P function l).
- Step 2: we calculated α and β parameters, where α is the shape parameter of the distribution, l, determined as =(AVERAGE2)/VAR.P, and β is the scale parameter of the distribution, computed in Excel as =VAR.P/AVERAGE.
- Step 3: we computed CDF as gamma distribution using the formula: CDF = GAMMA.DIST (precipitation; α; β; TRUE).
- Step 4: we computed CDF for the specified mean and standard deviation as follows =NORM.INV (CDF; 0; 1).
2.4. The Standardized Precipitation–Evapotranspiration Index (SPEI)
2.5. Sentinel Data
2.6. Normalized Difference Vegetation Index
2.7. Normalized Difference Moisture Index
3. Results
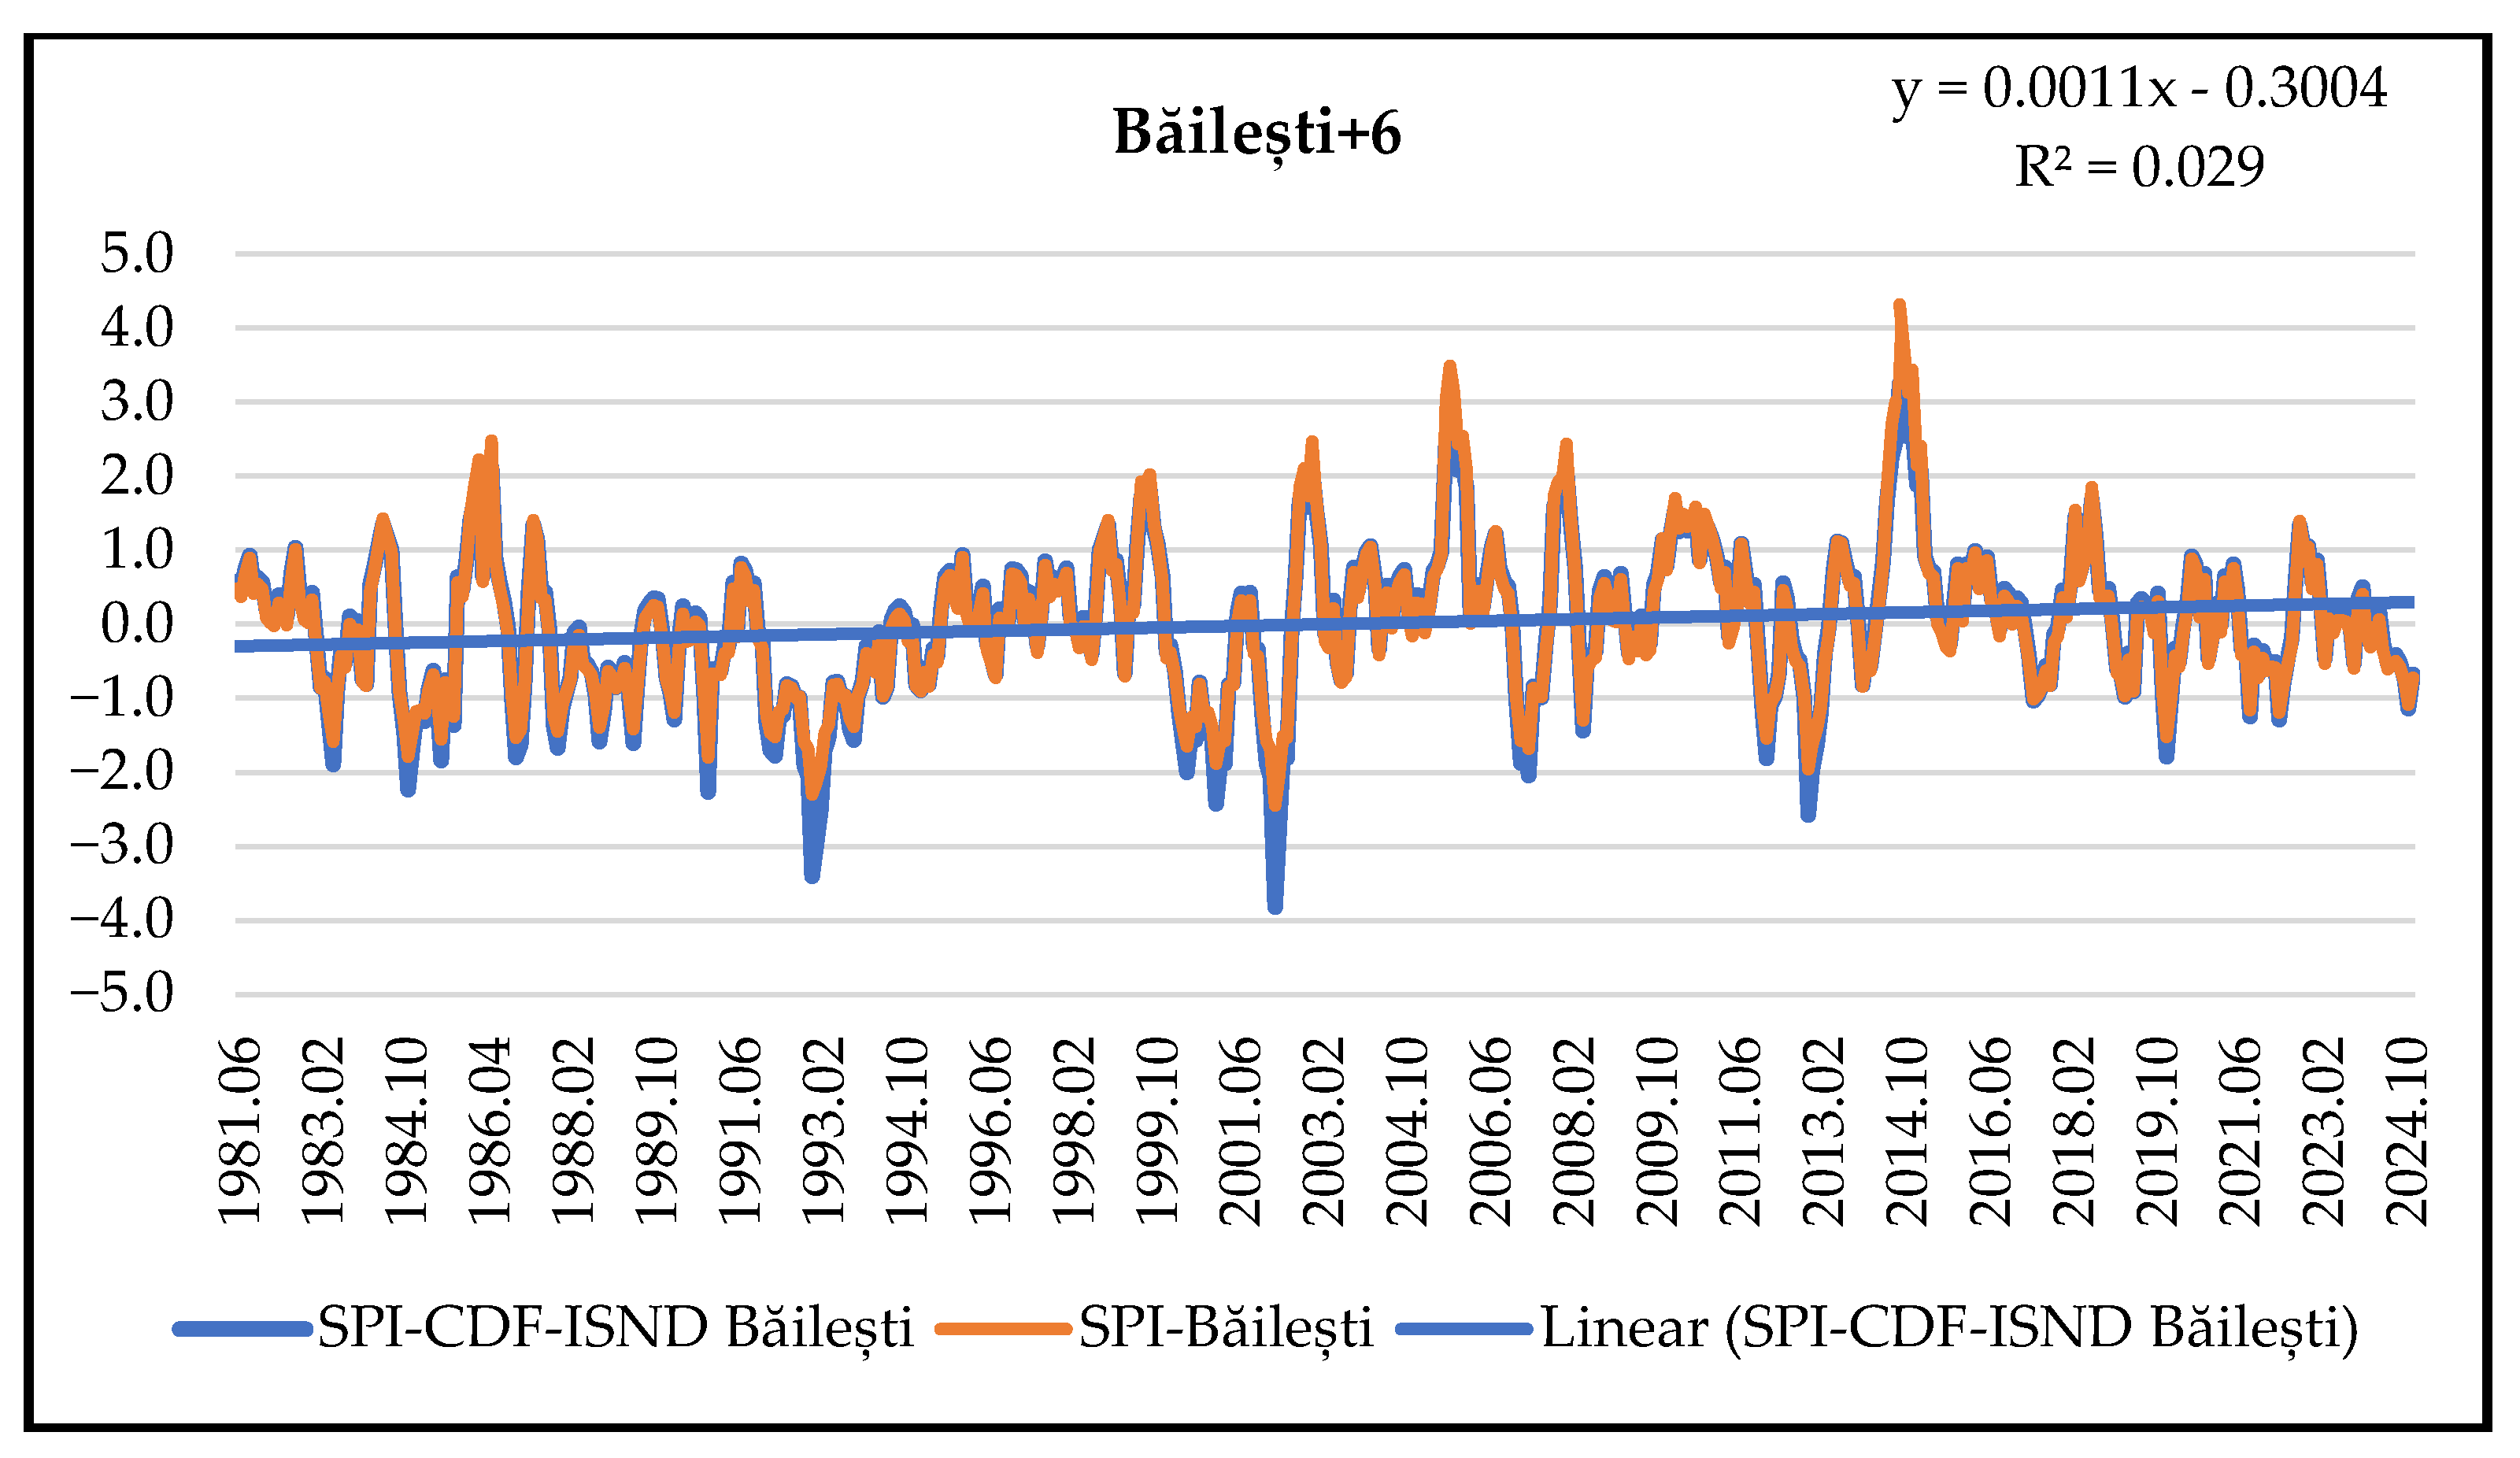
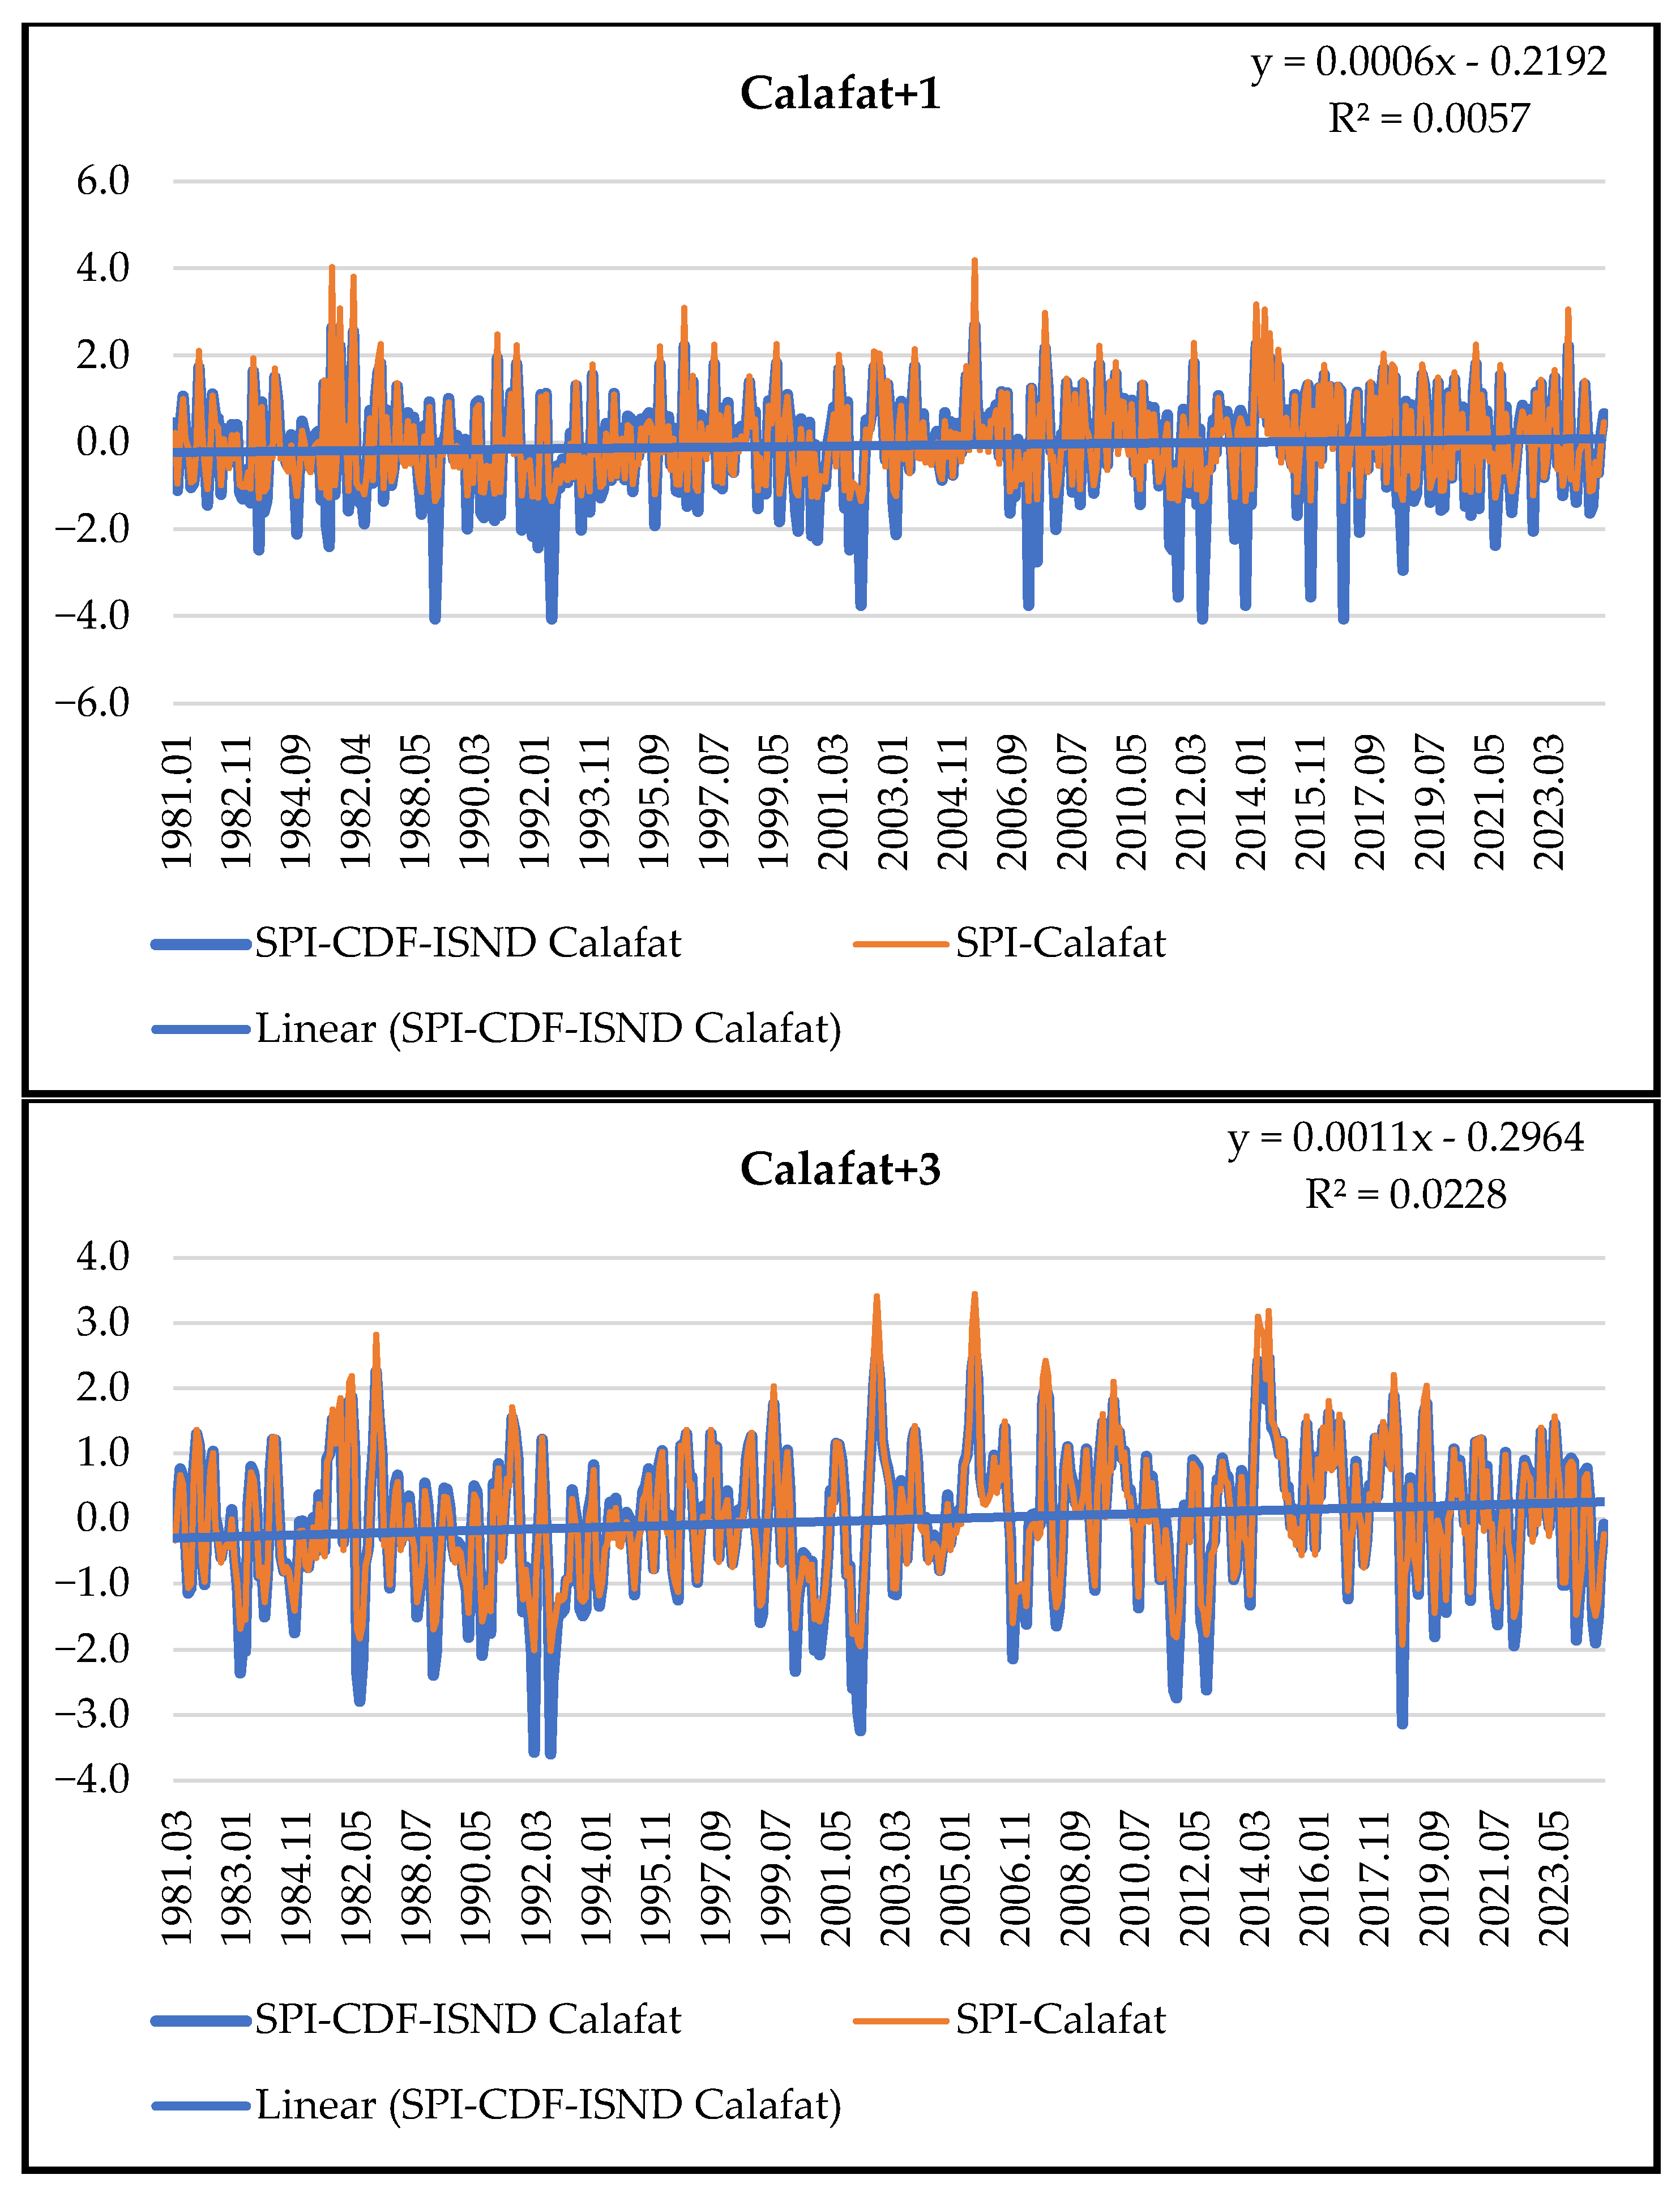
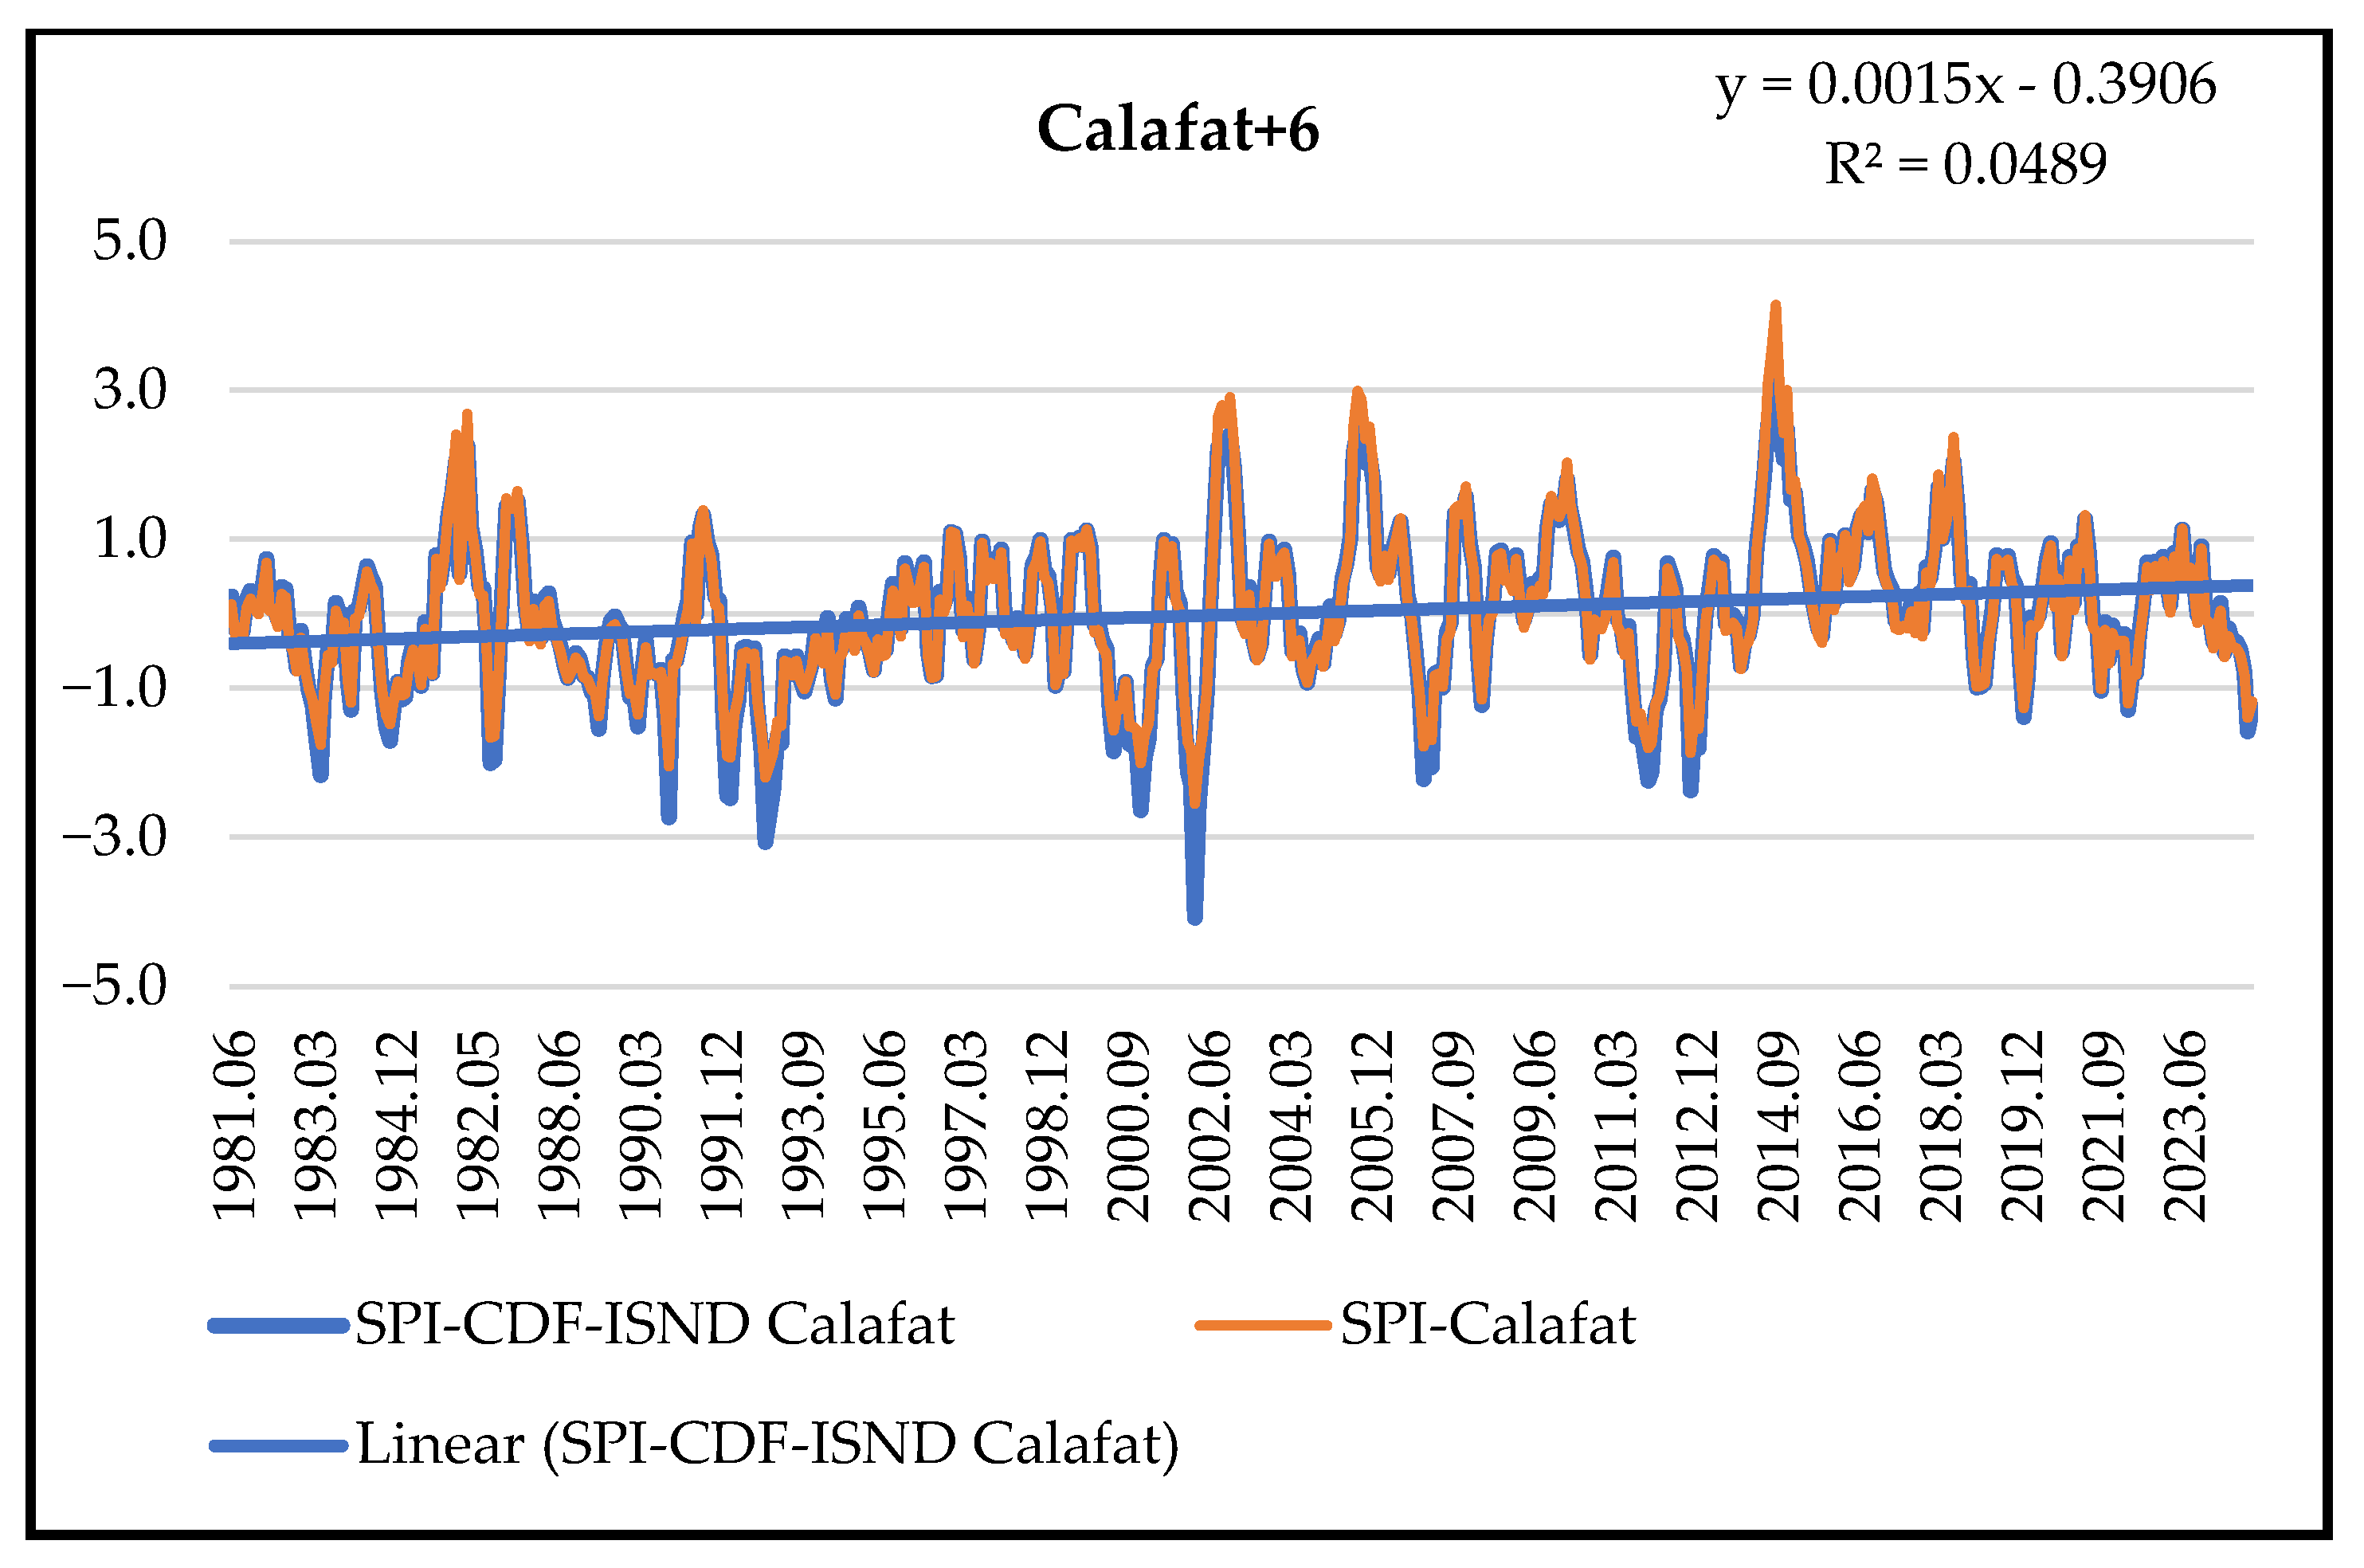
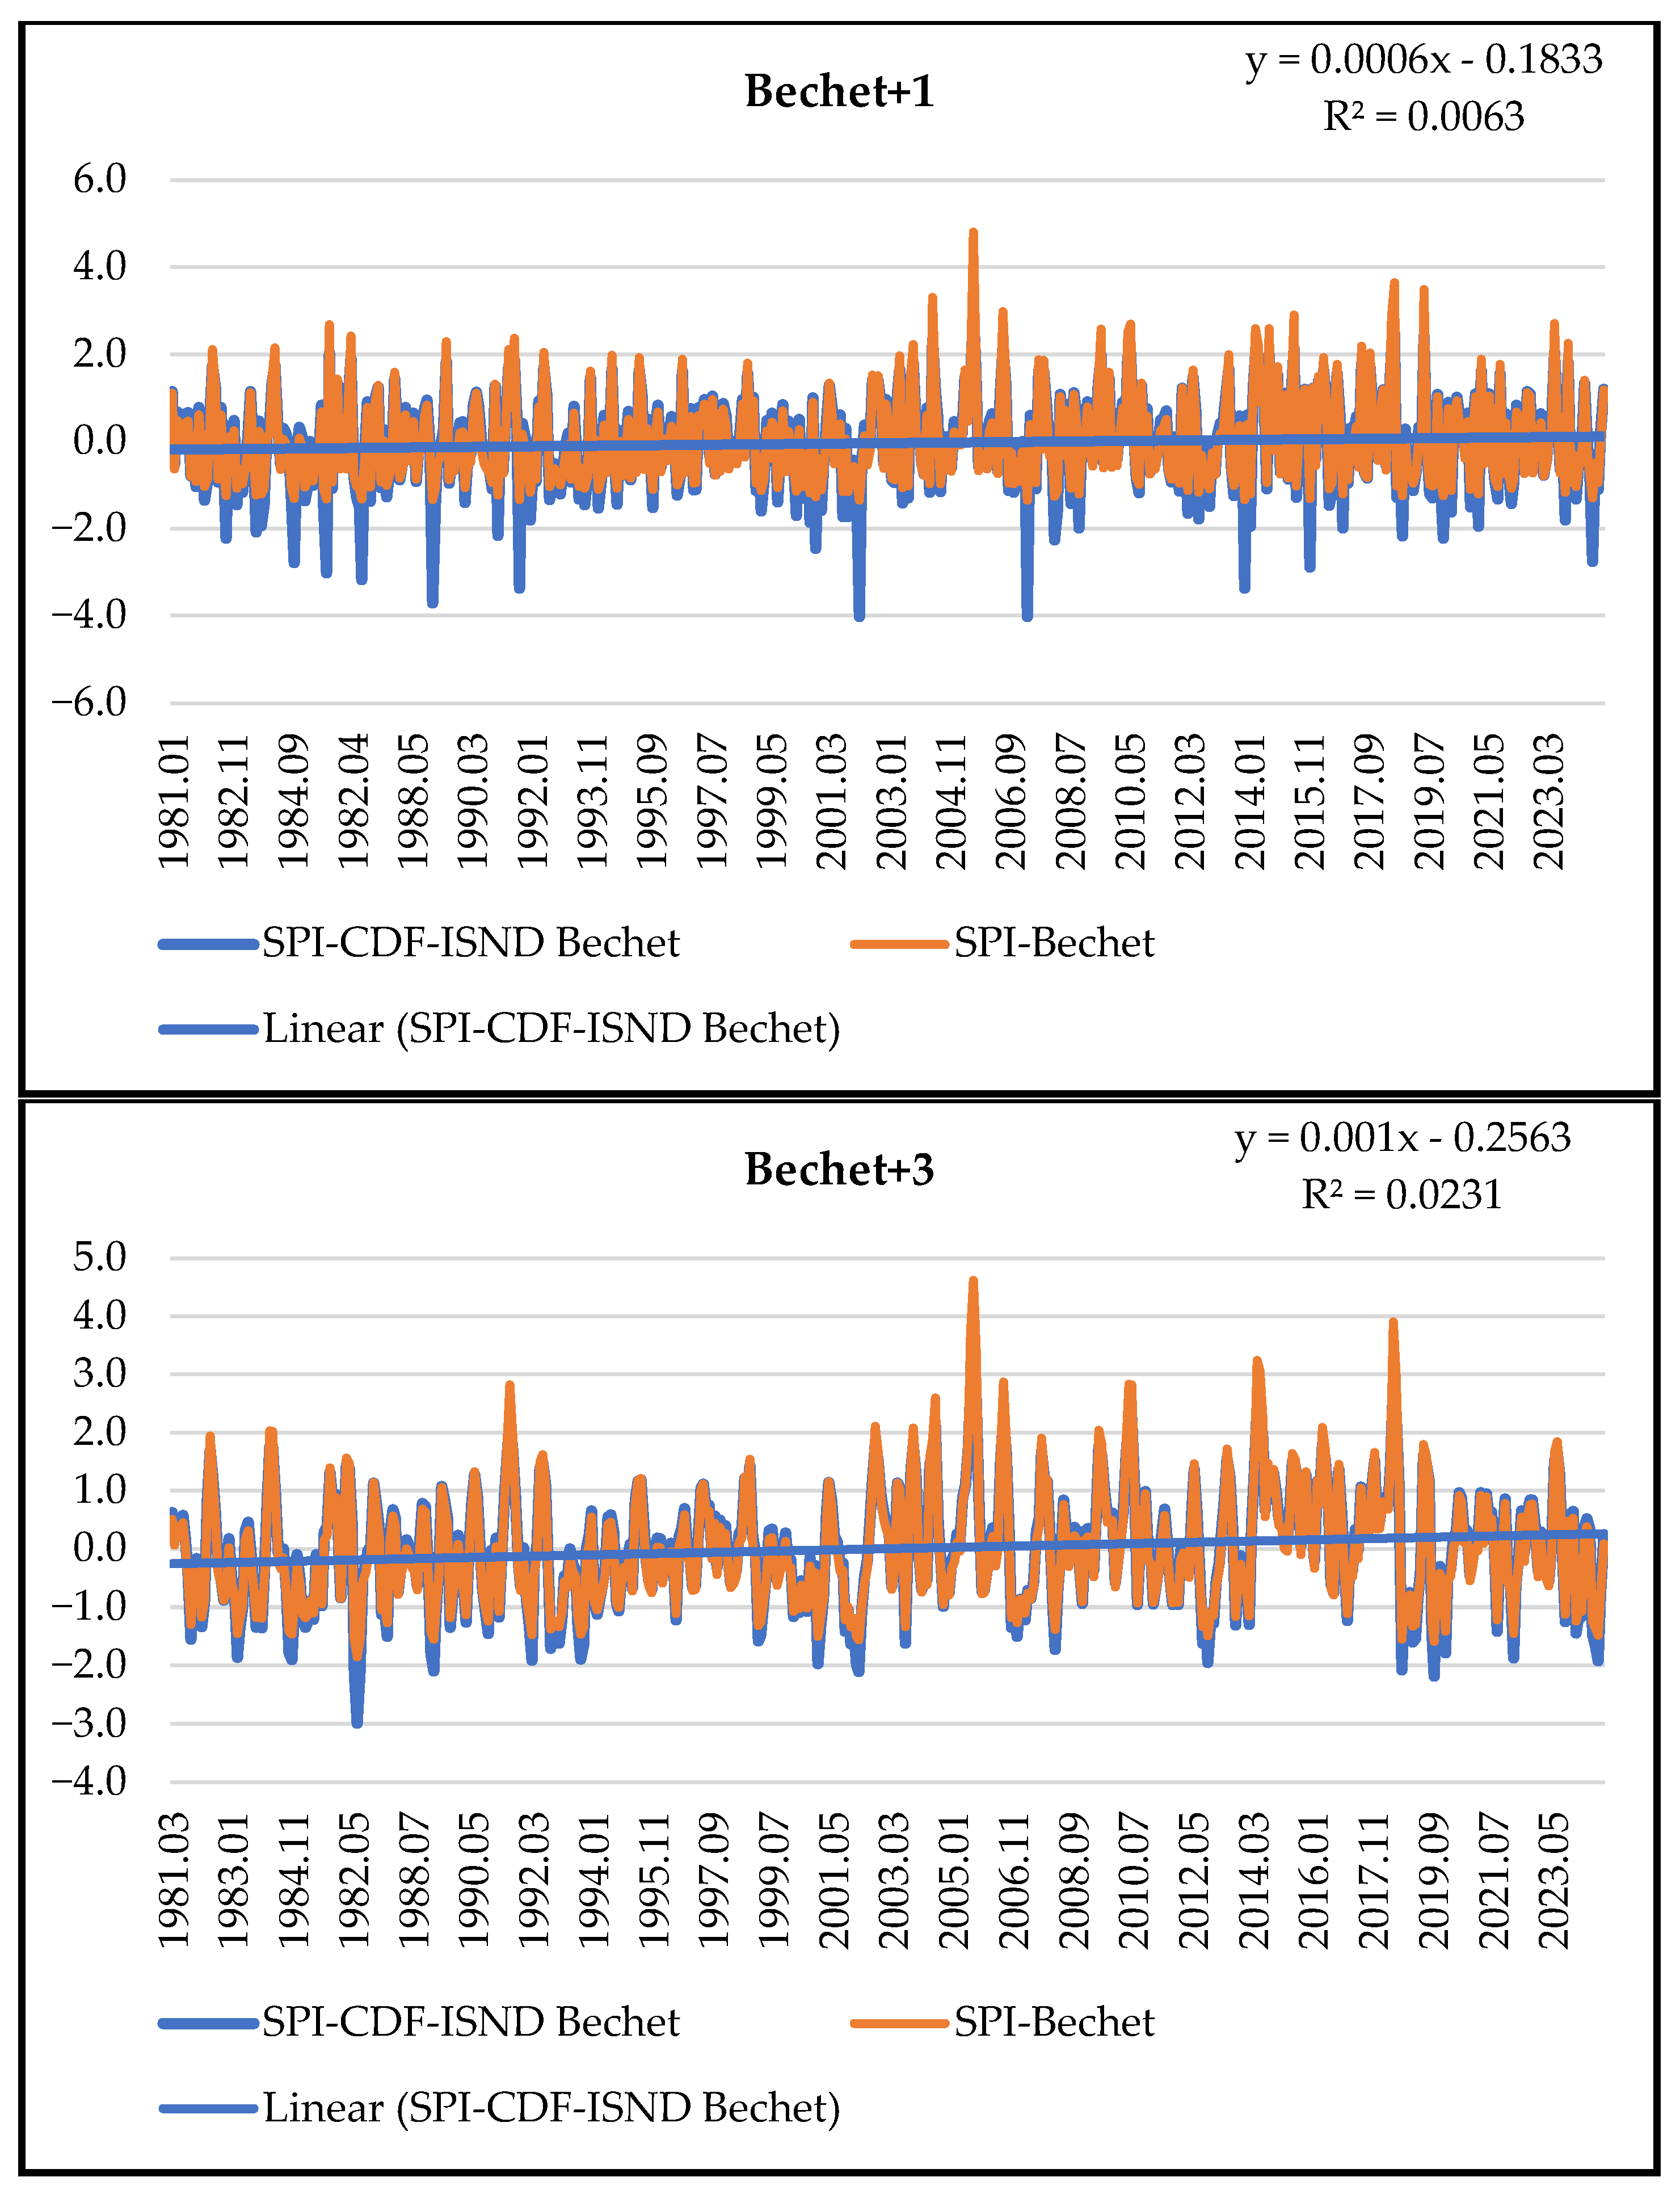
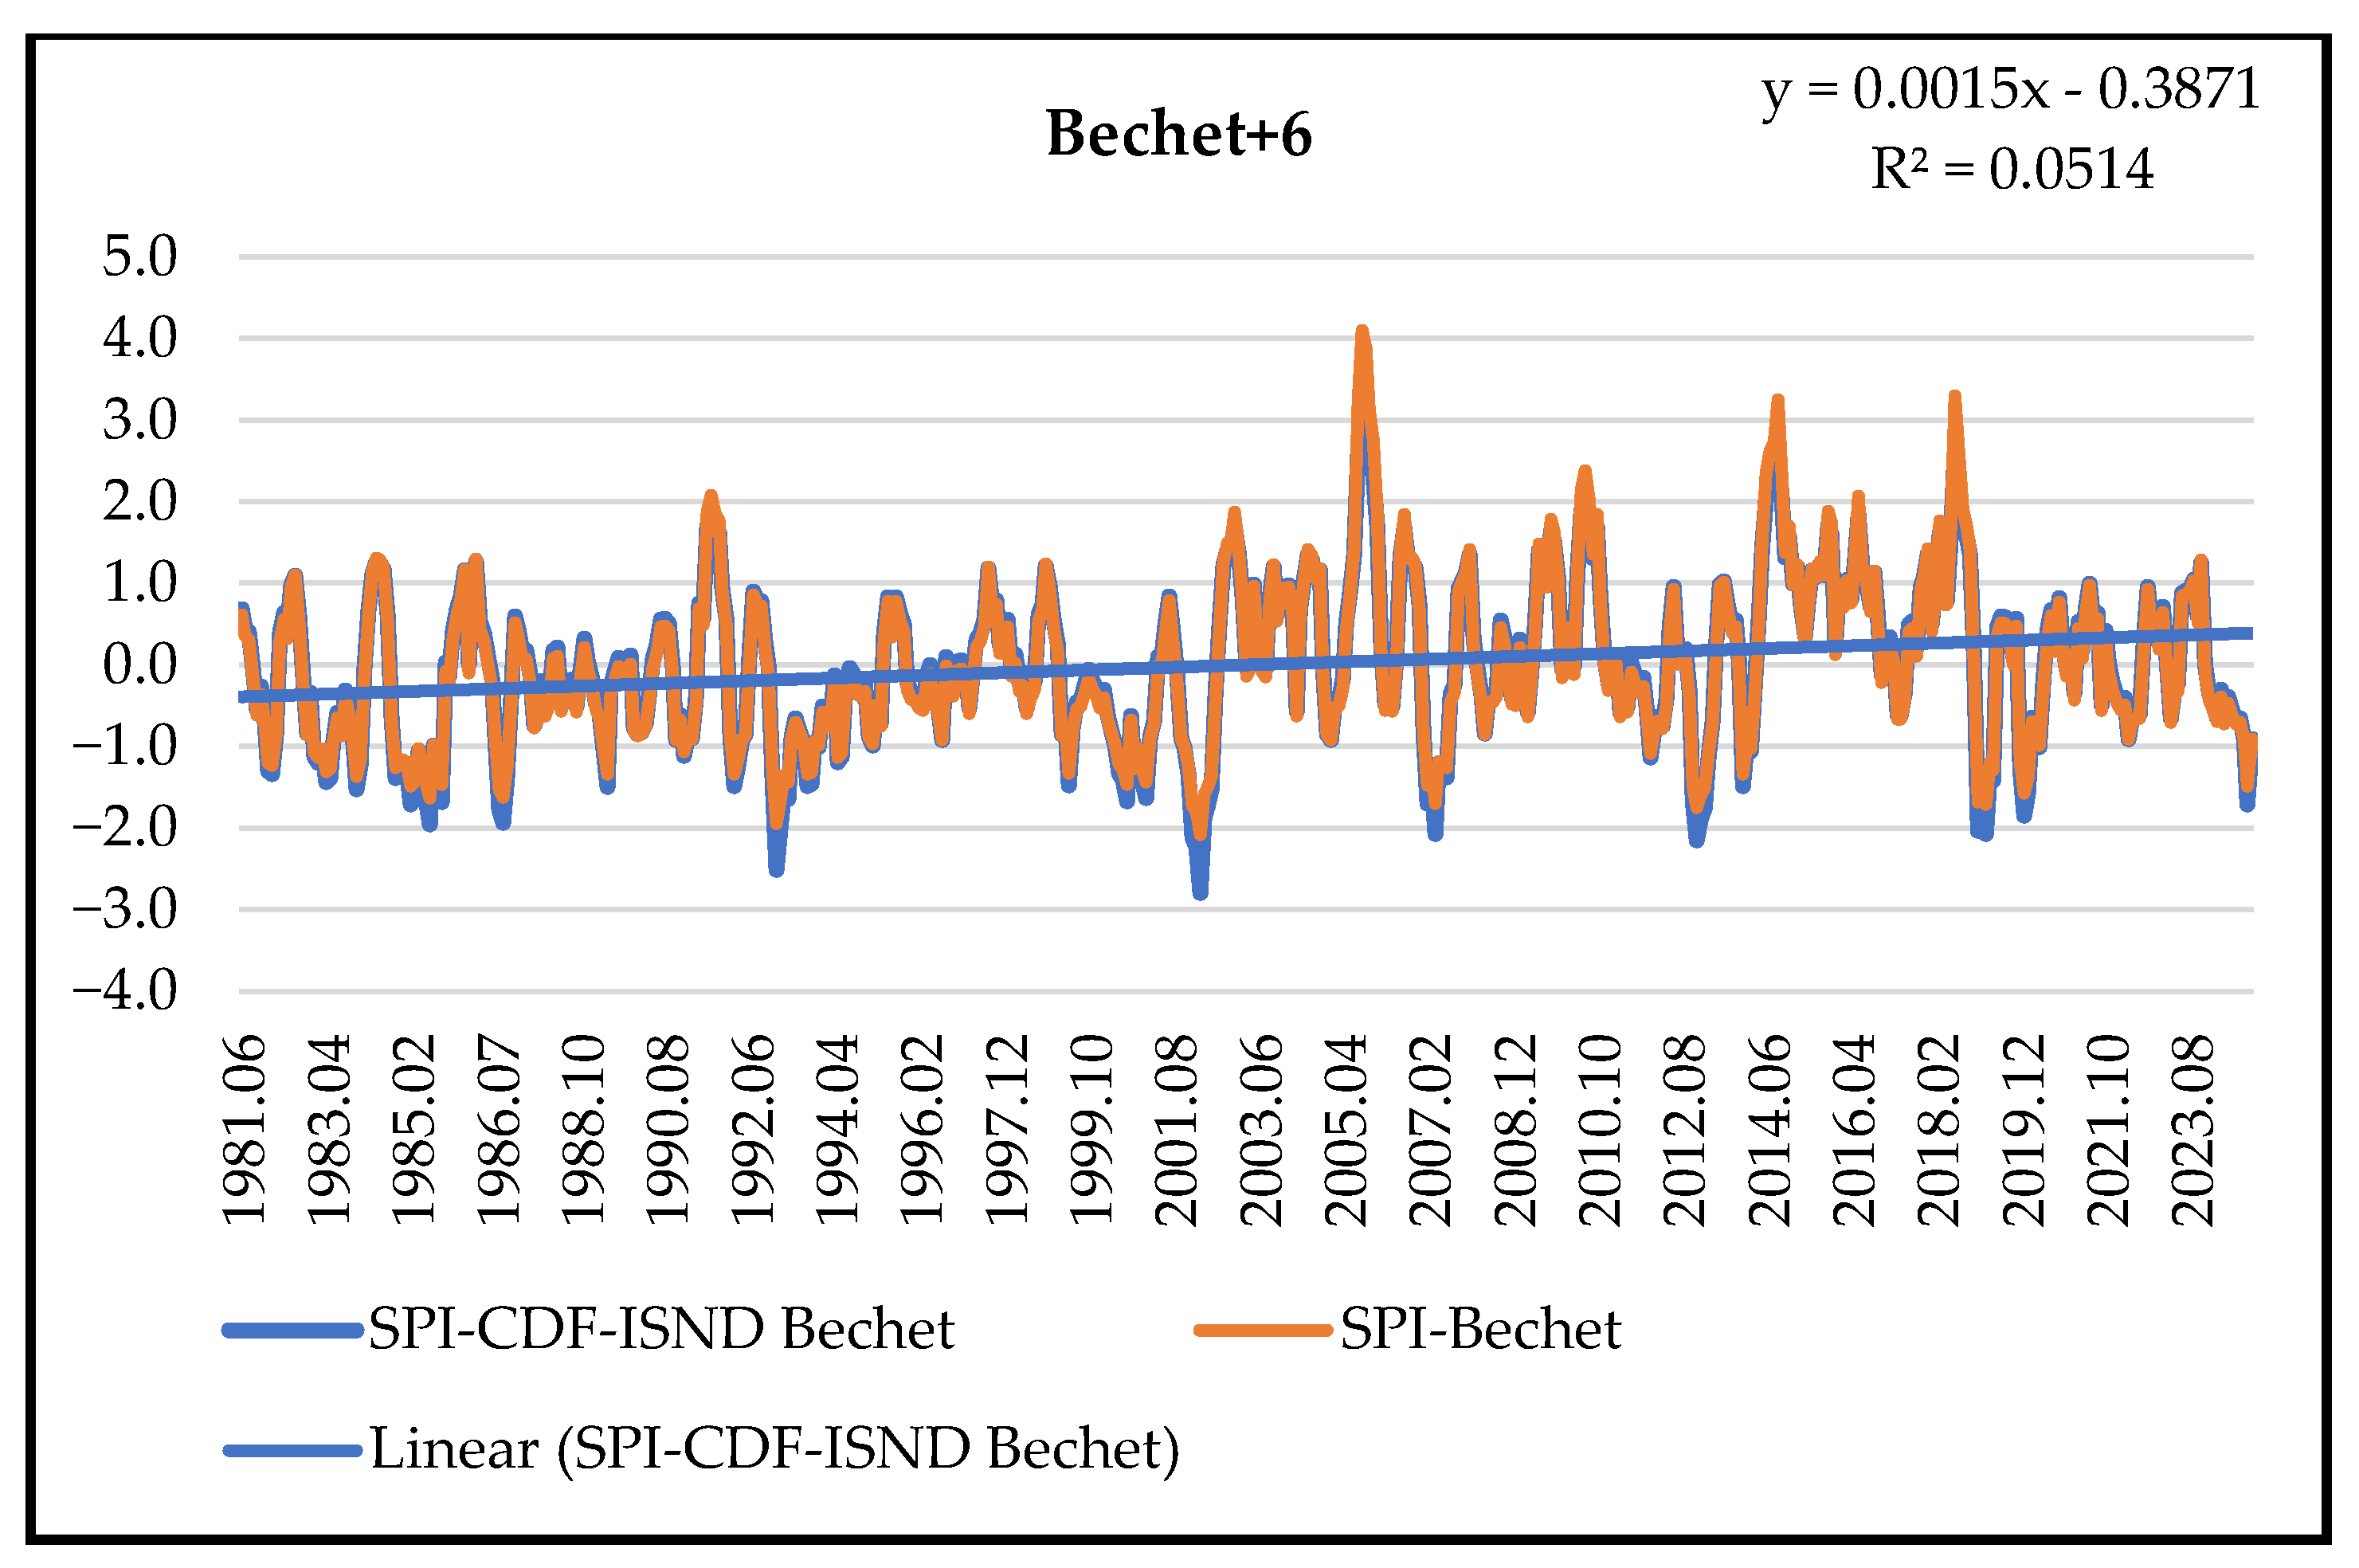
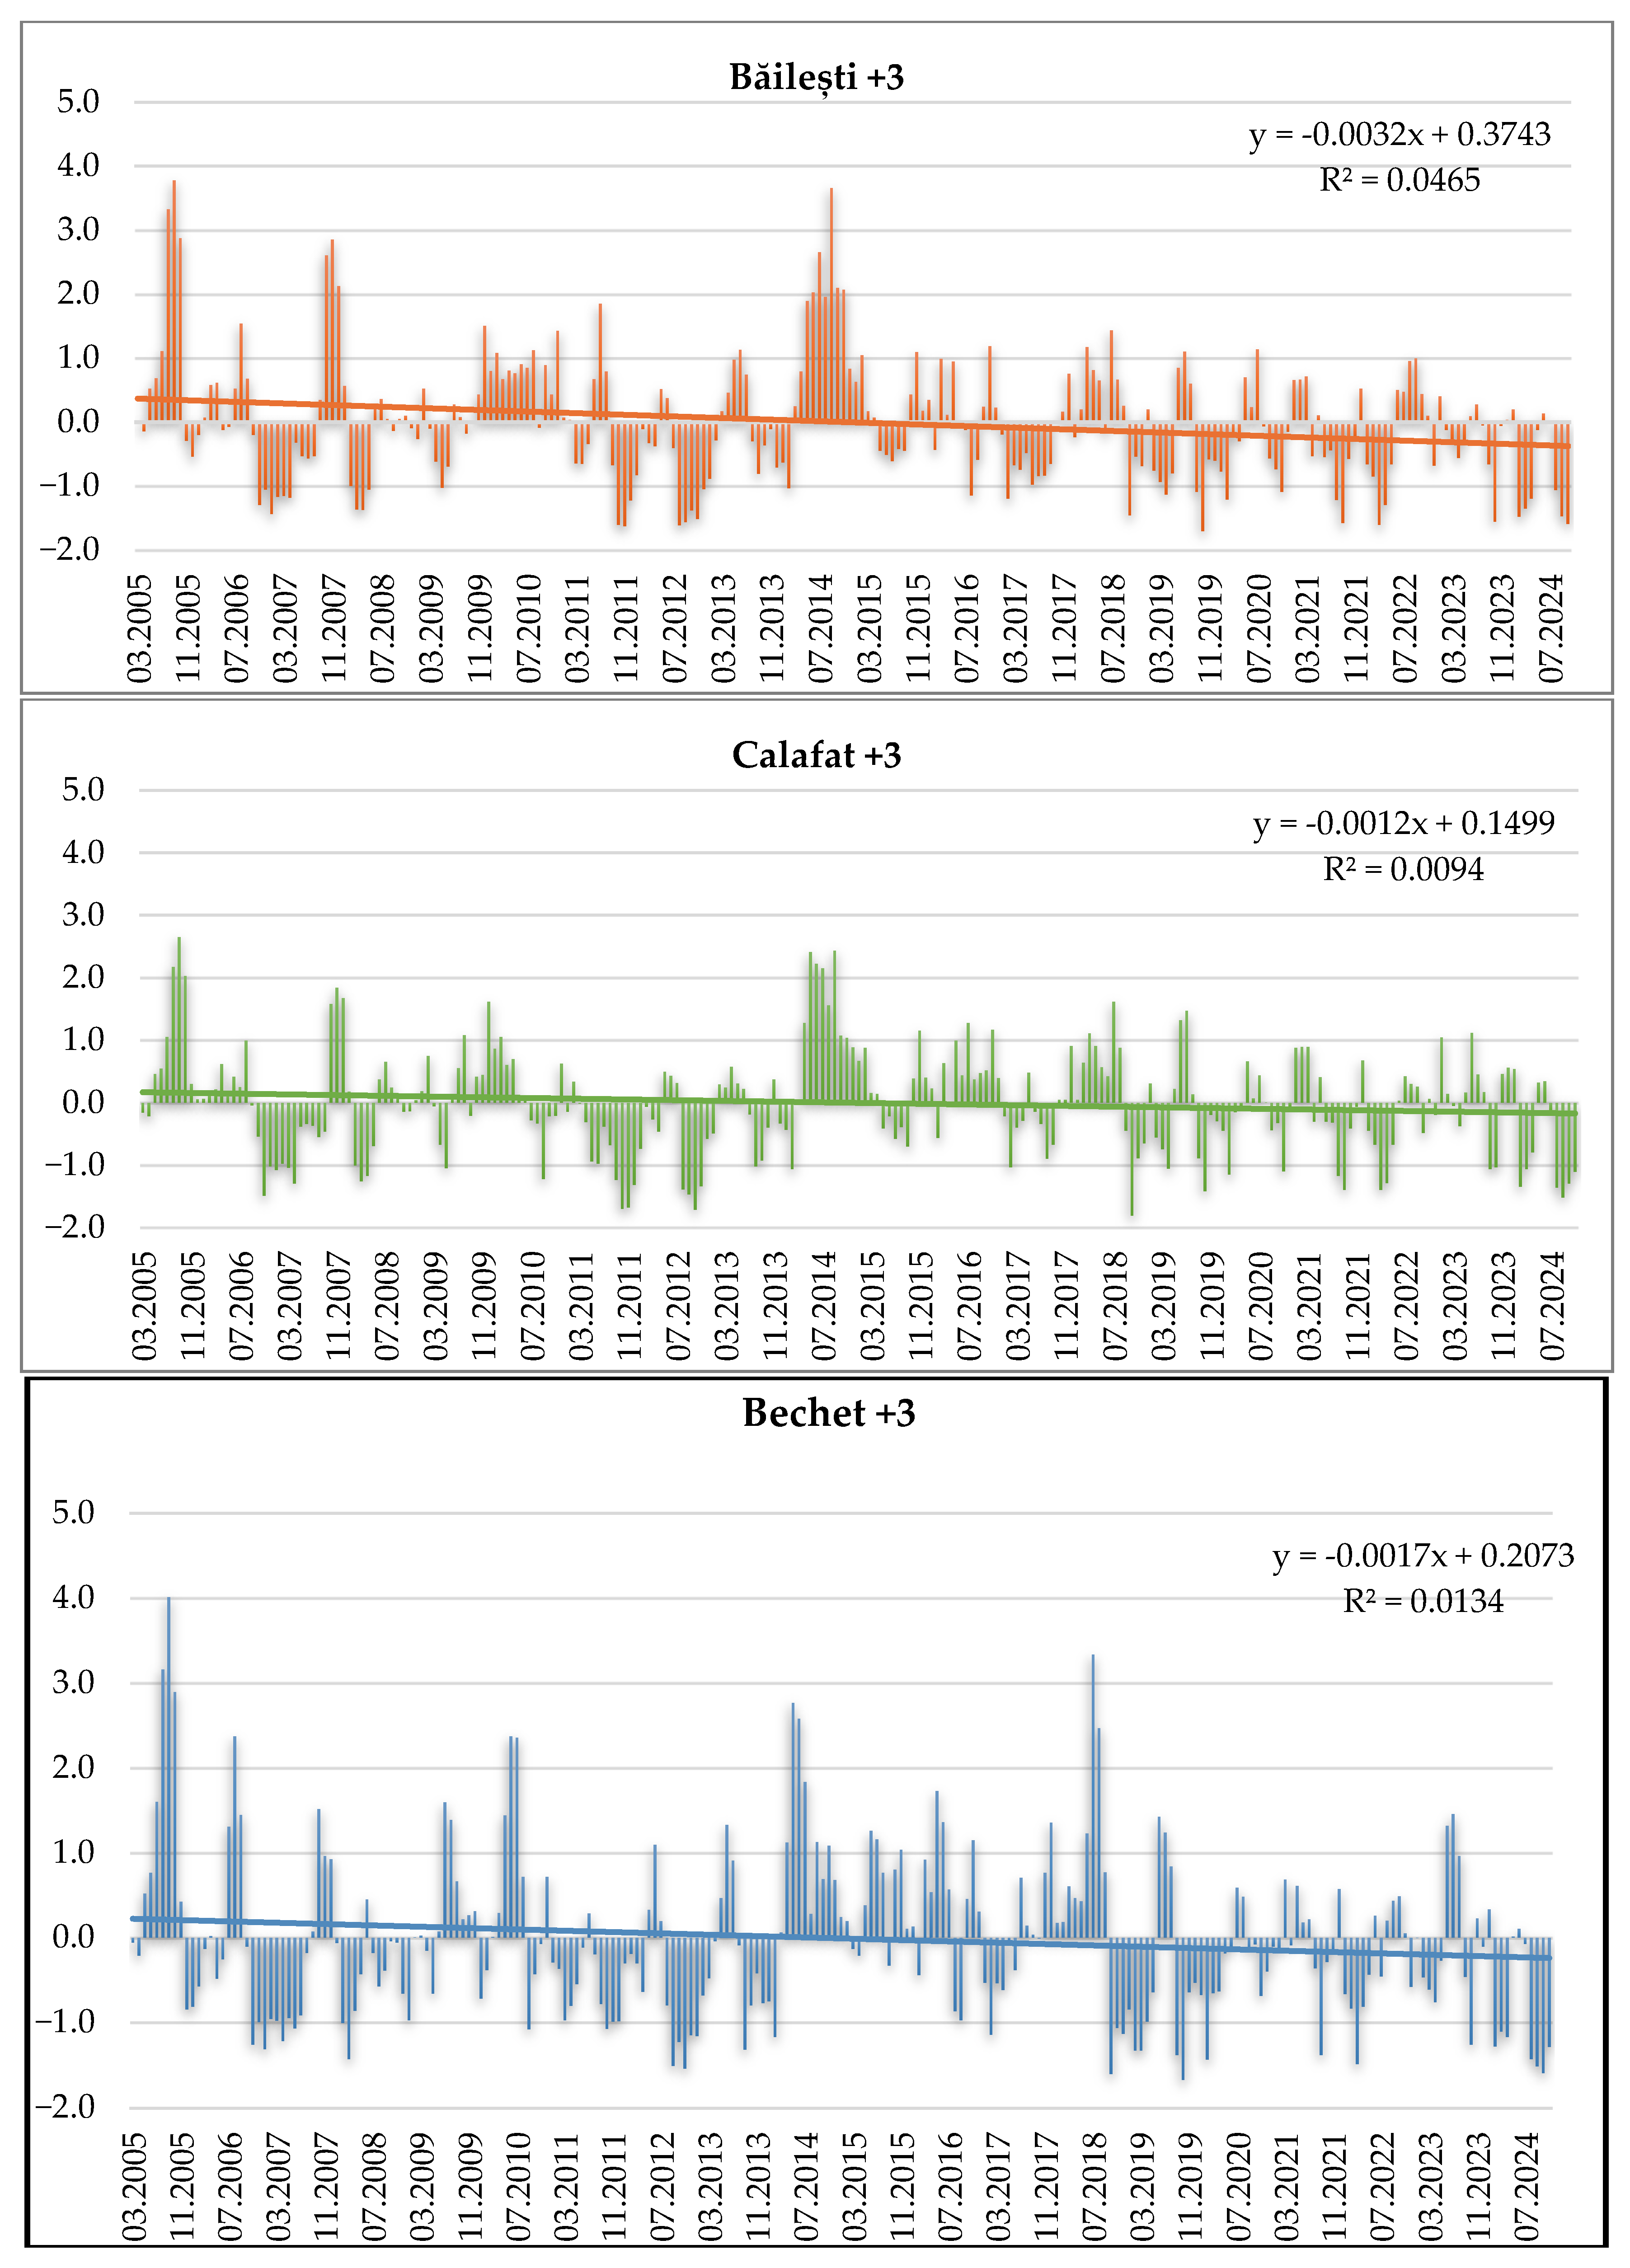
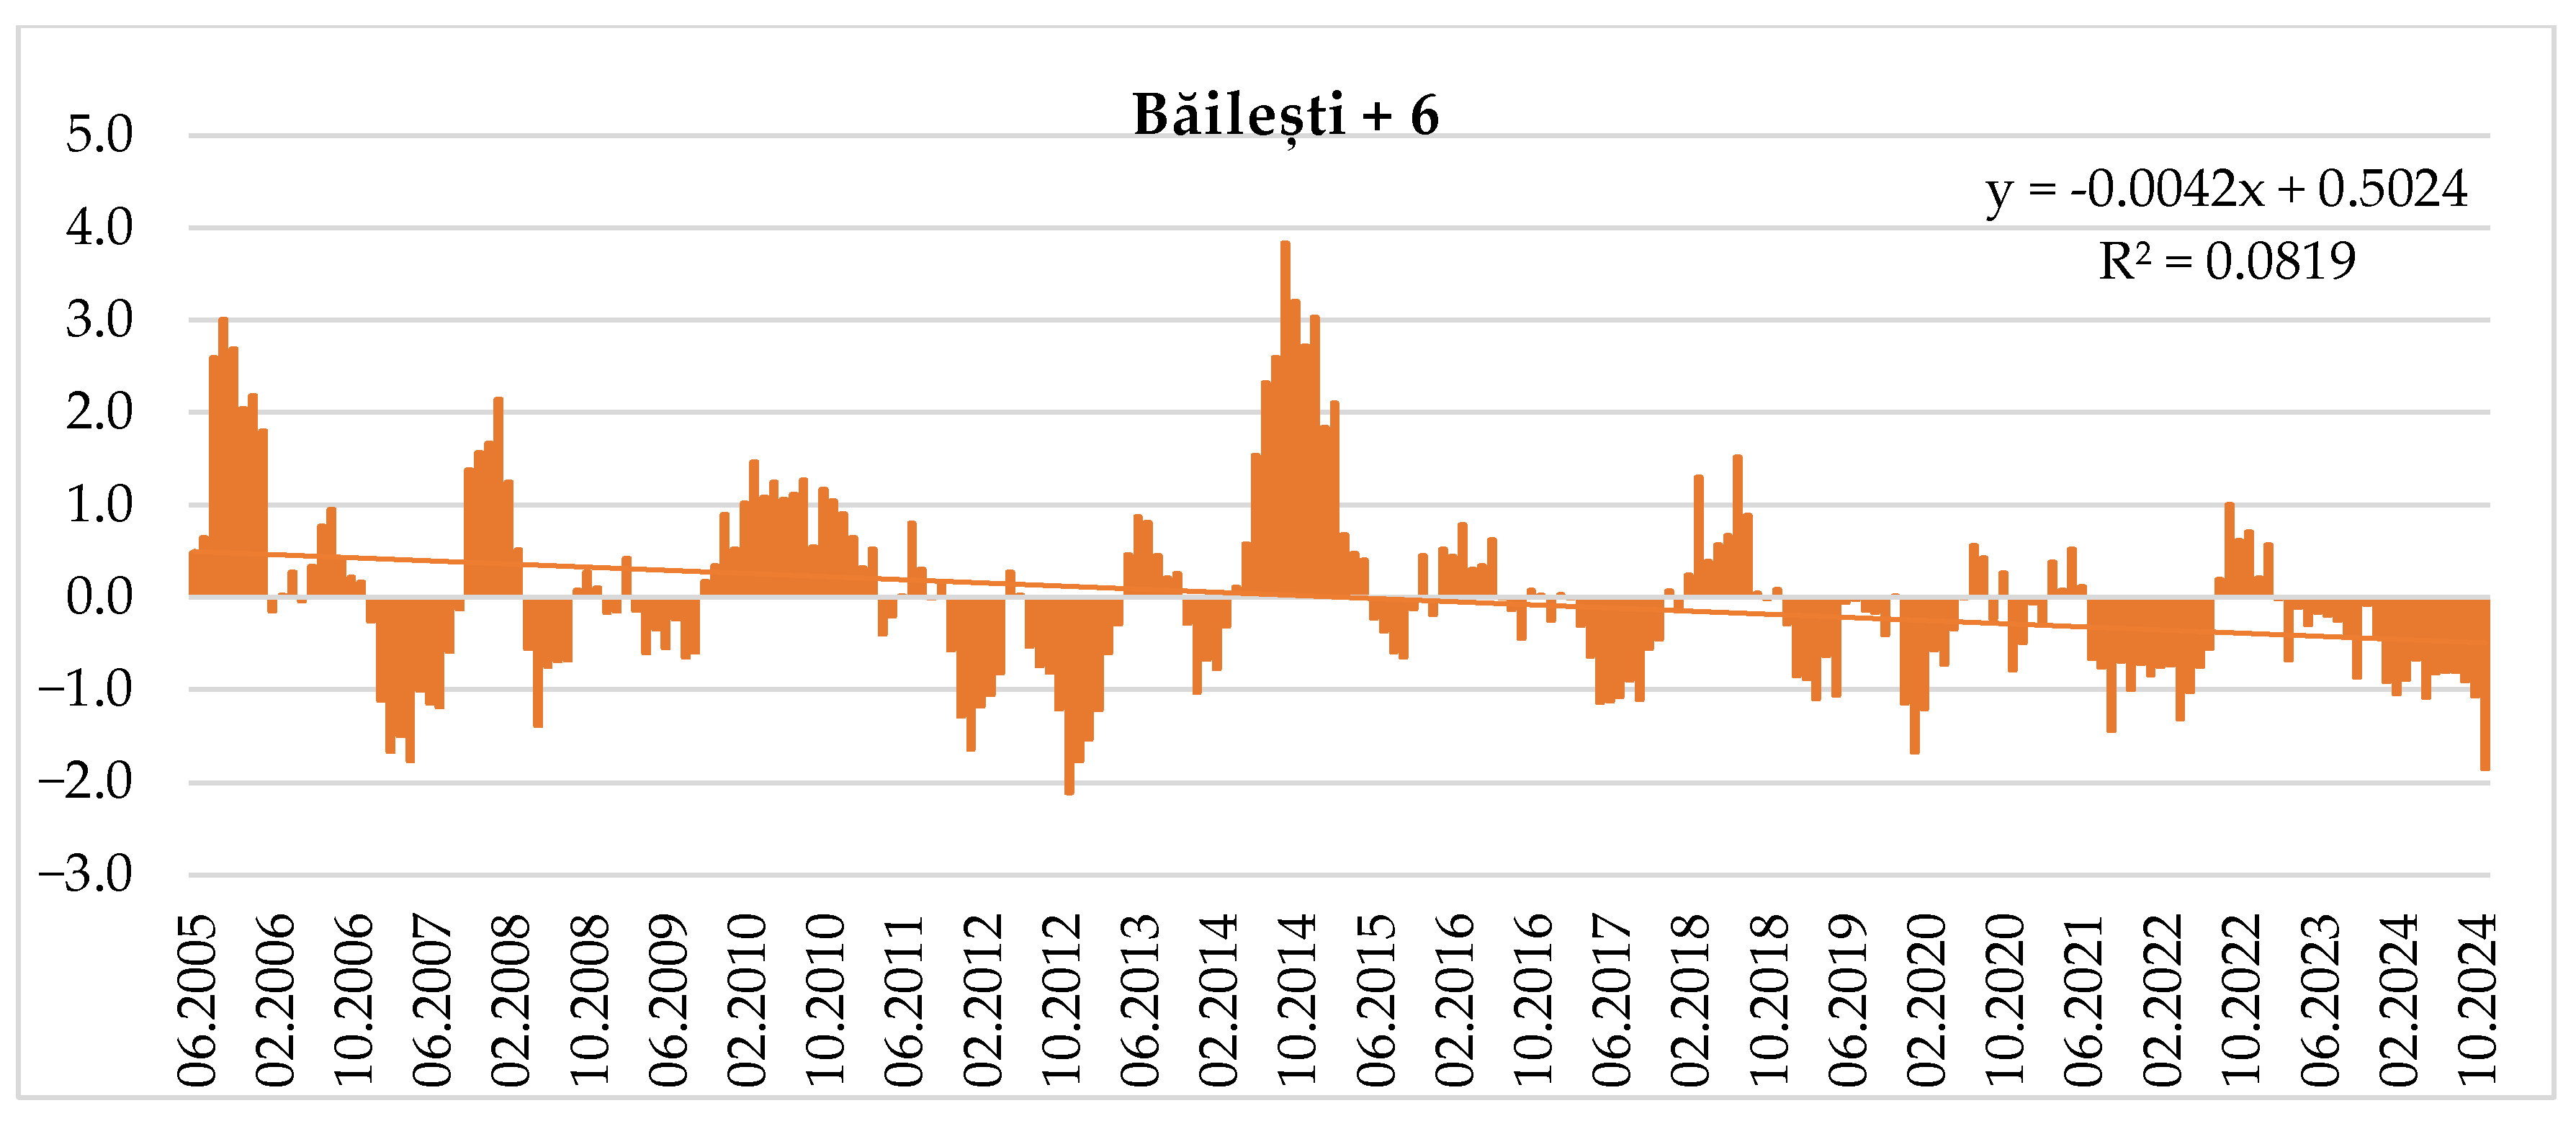
3.1. SPI-CDF-ISND
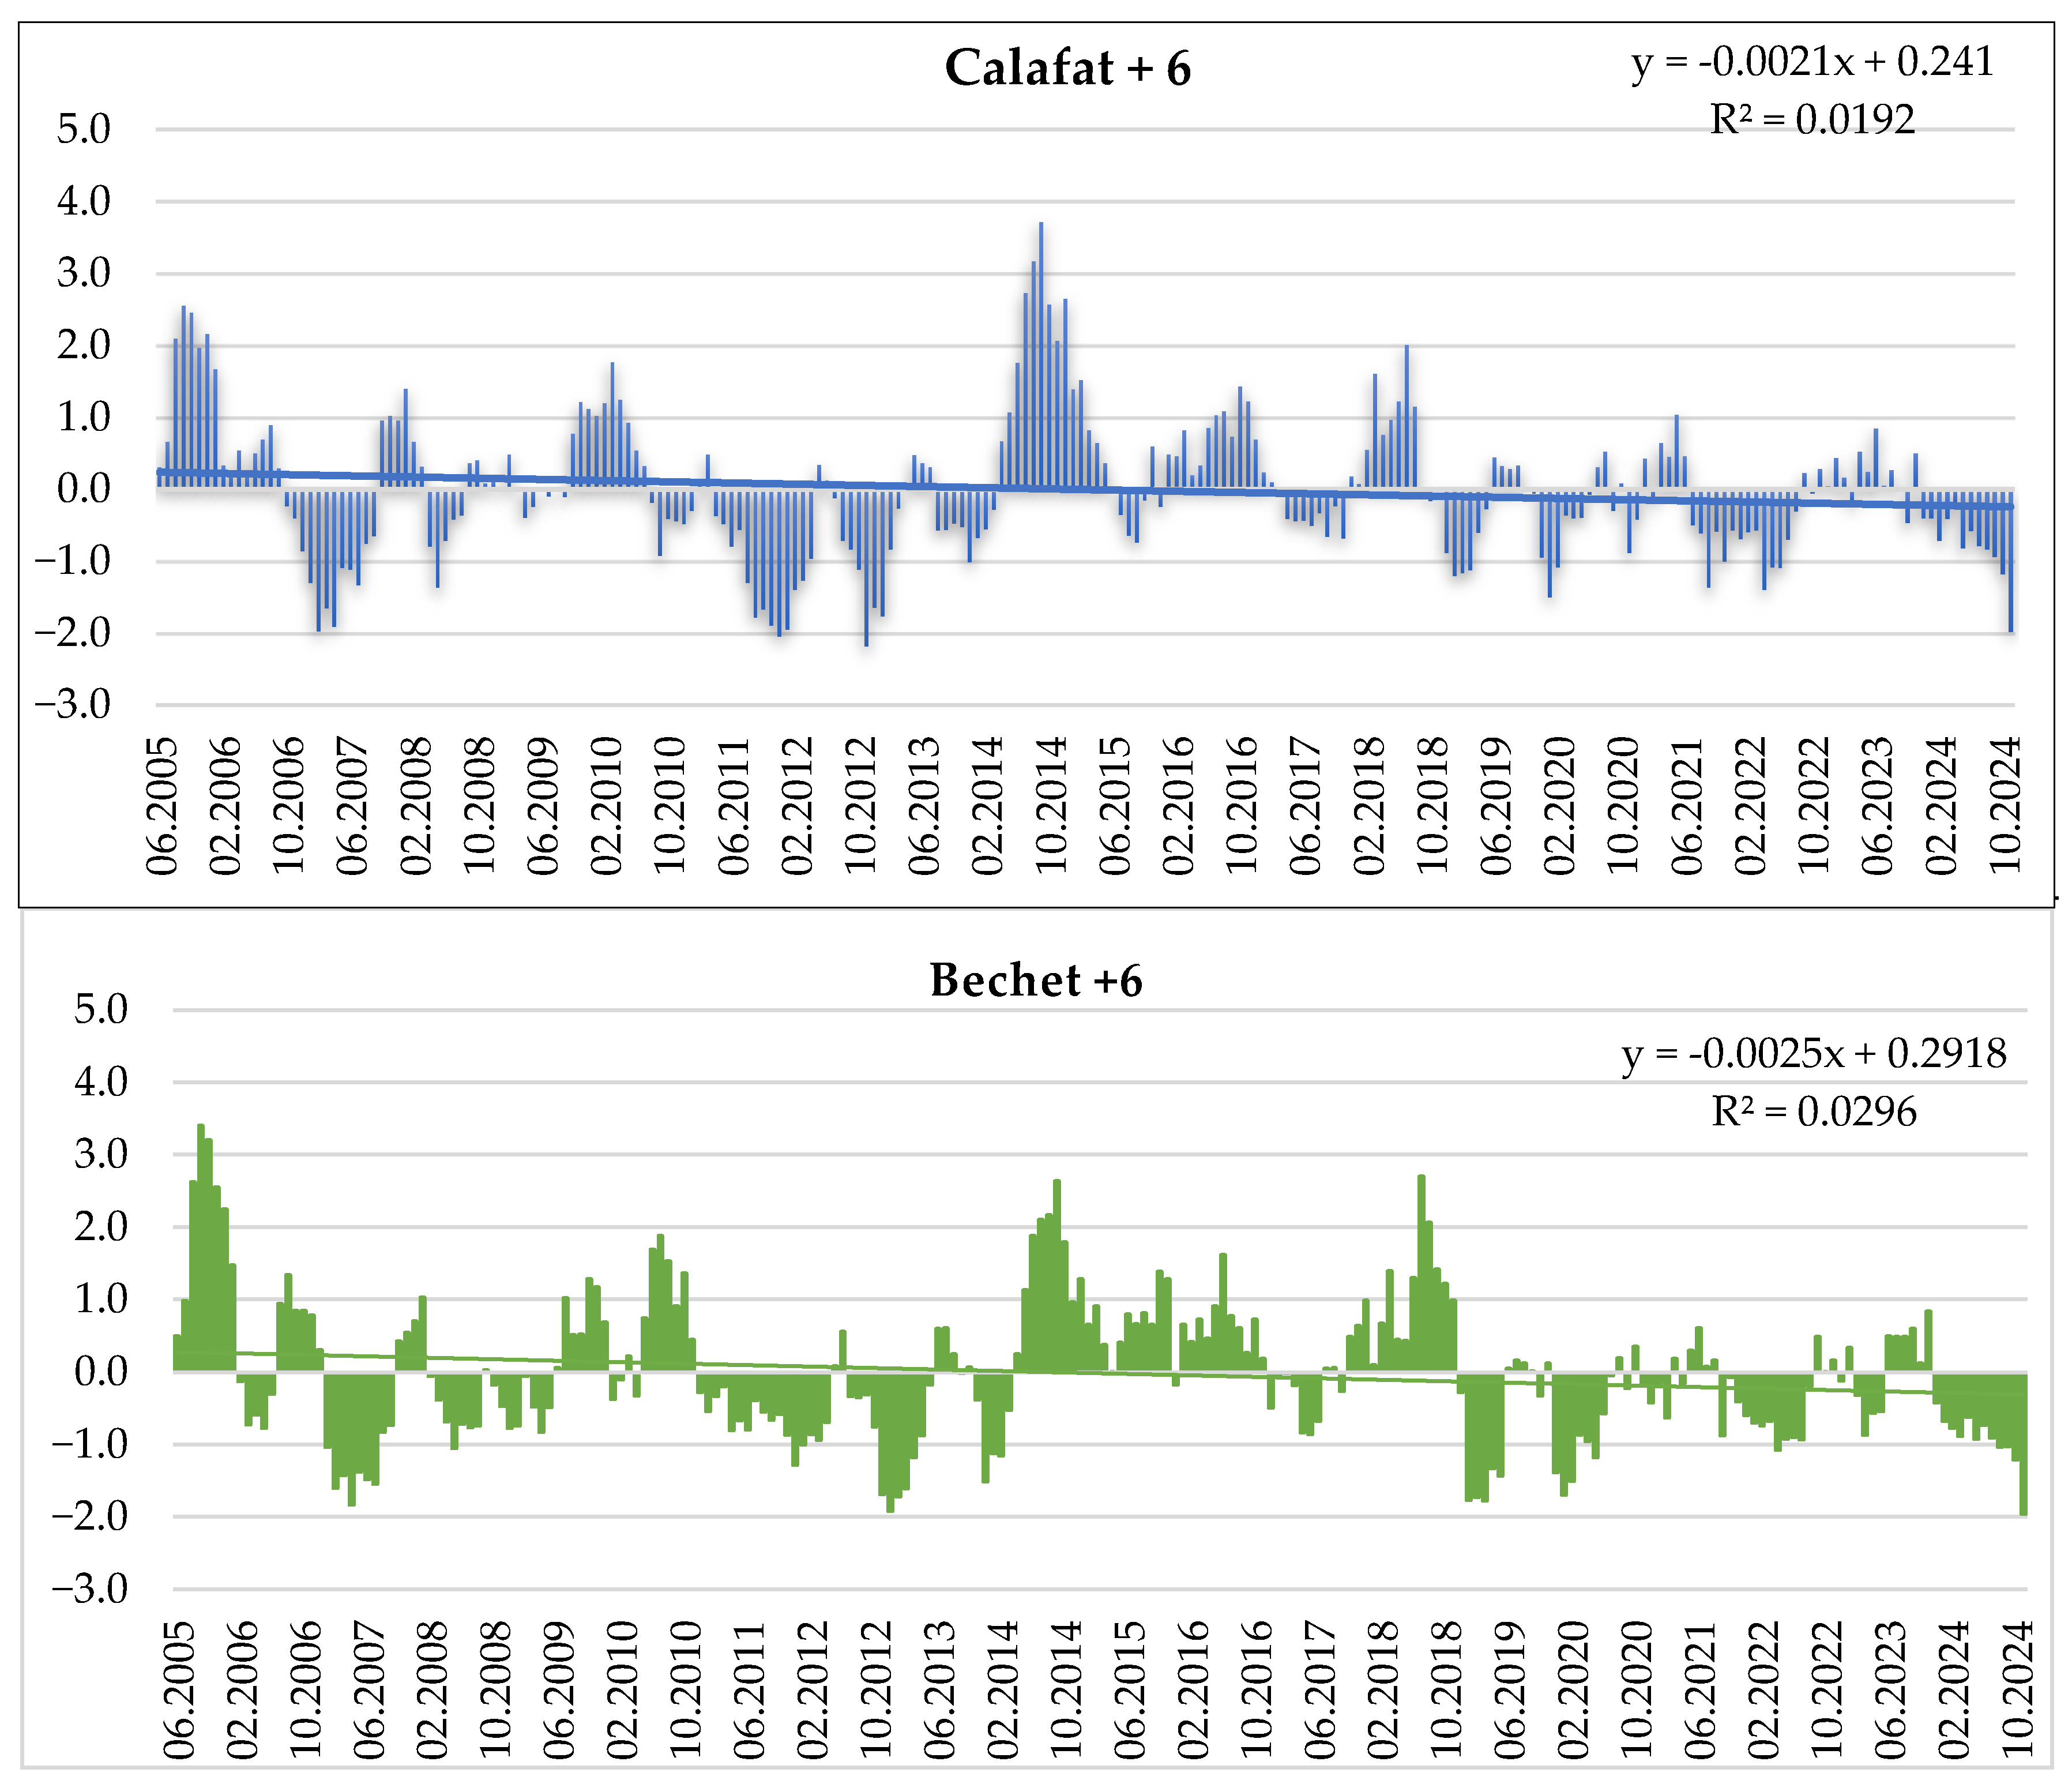
3.2. Standardized Precipitation Evapotranspiration Index
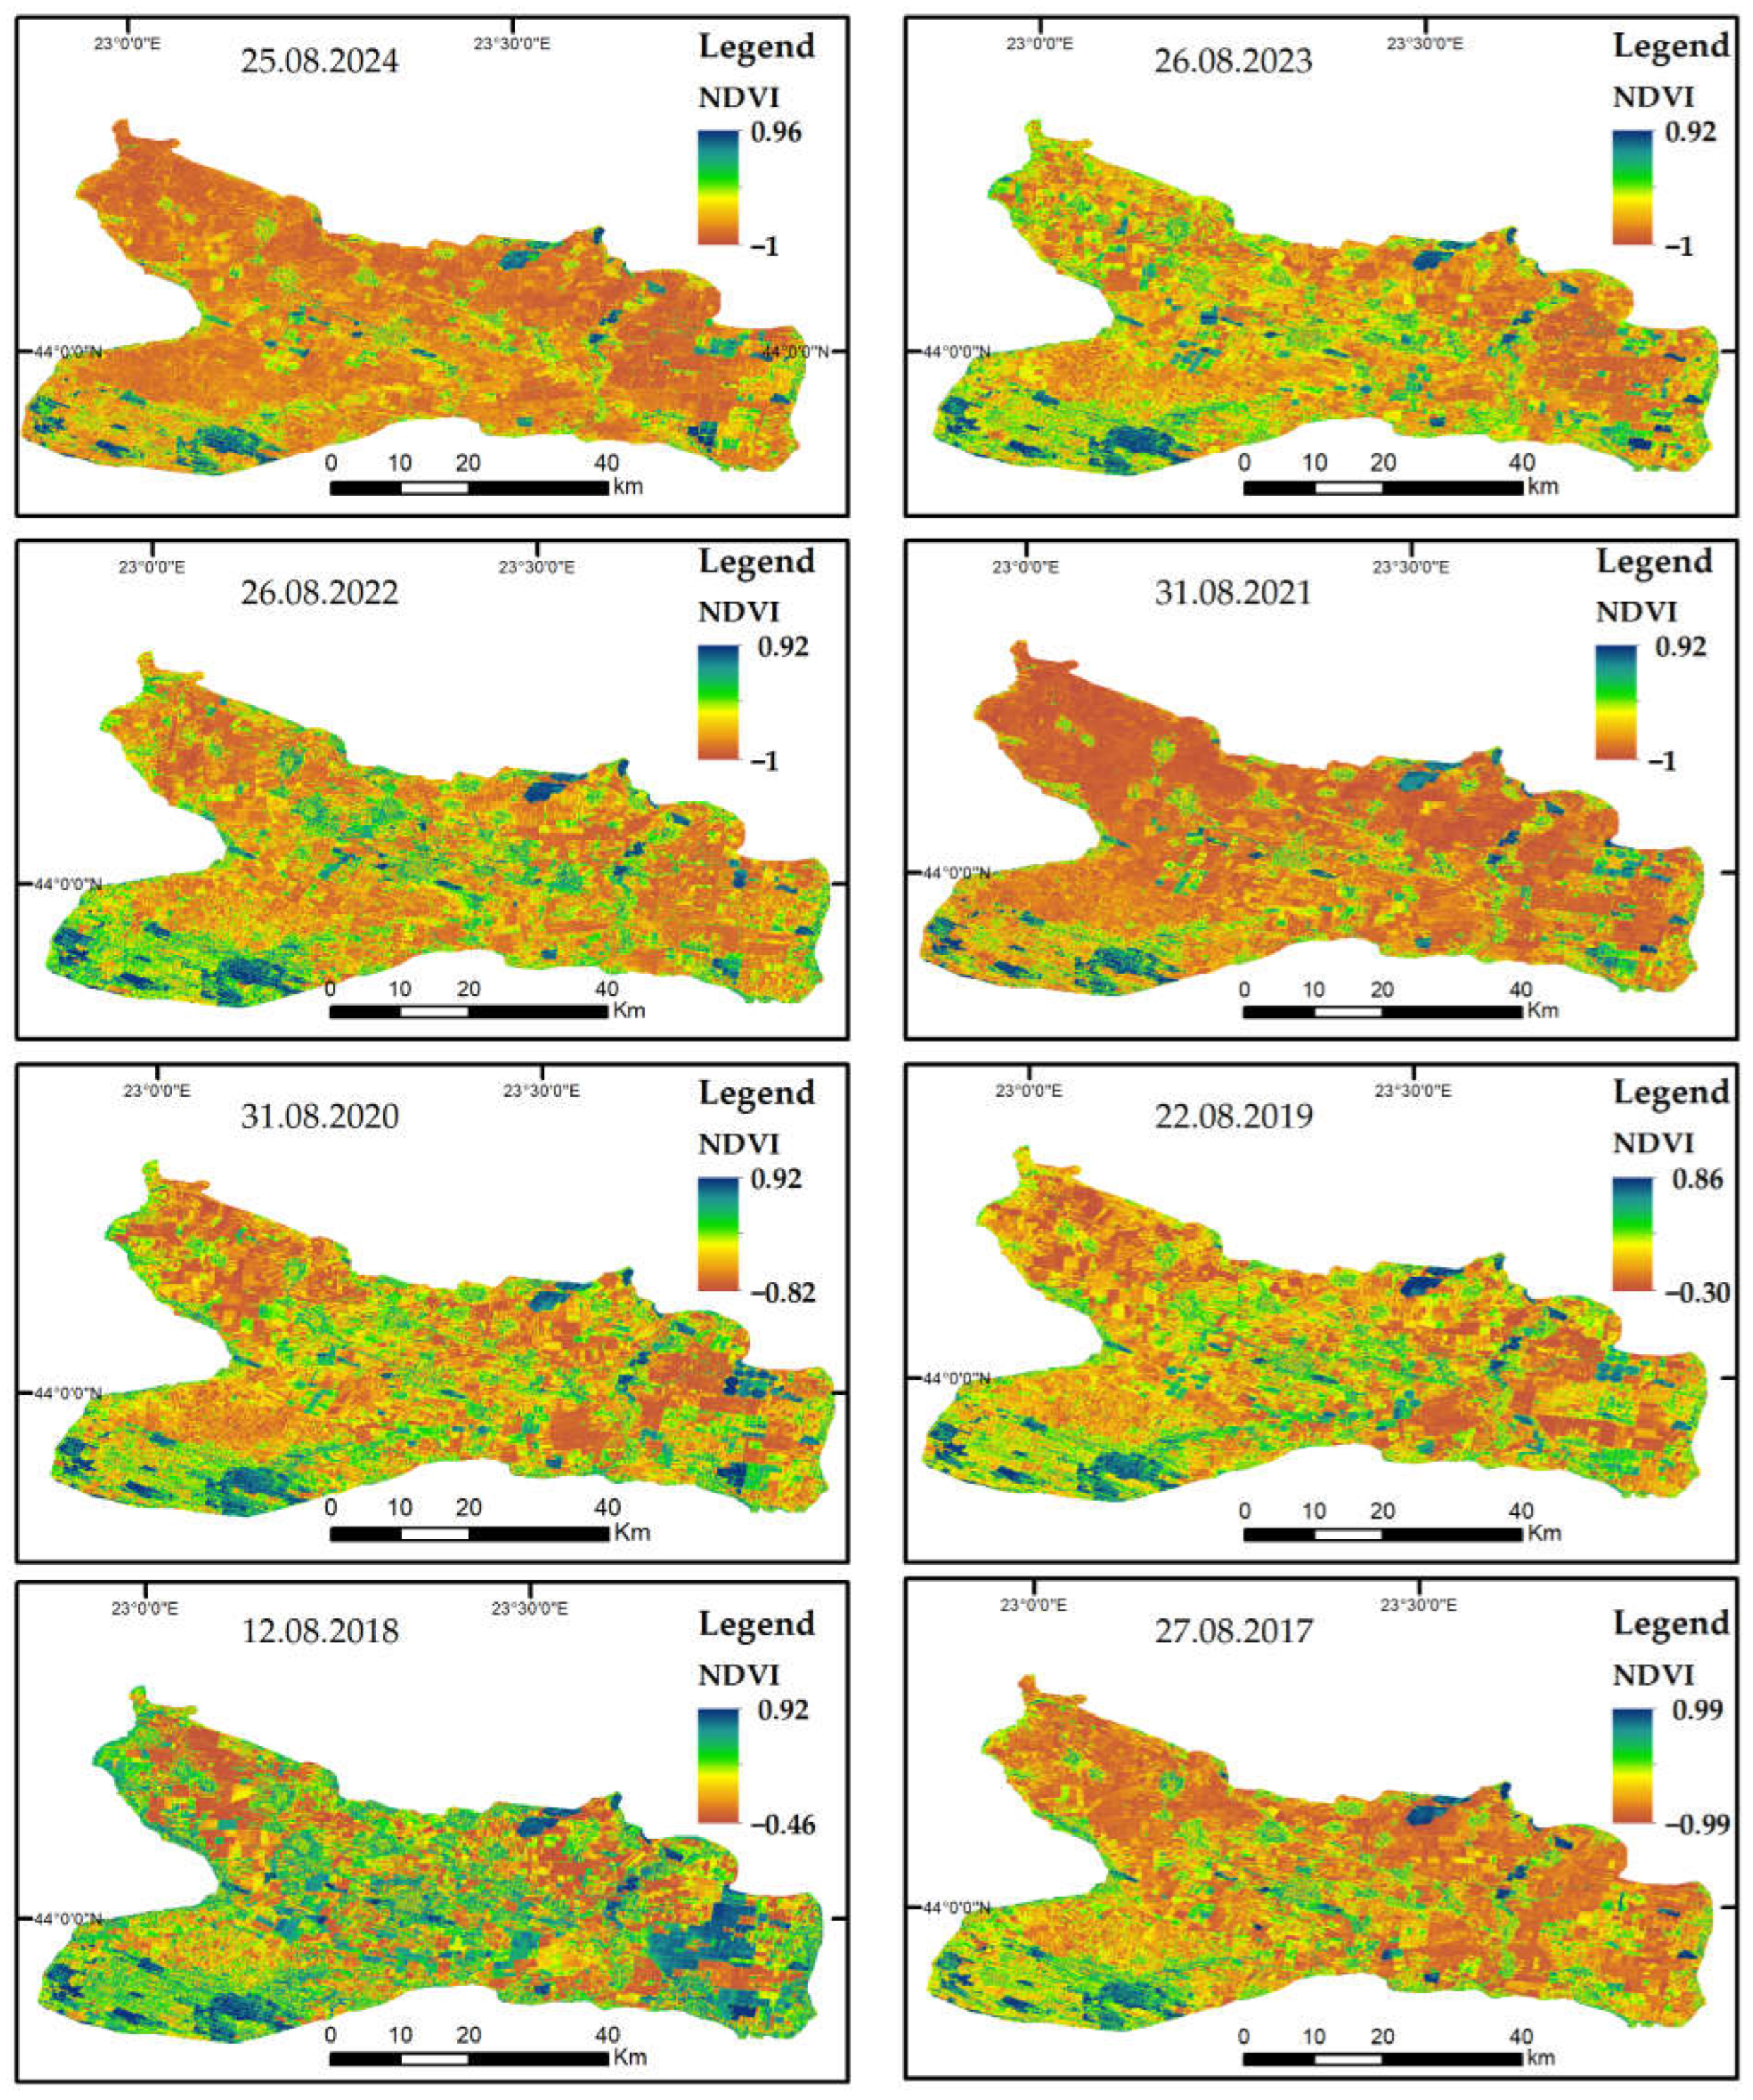
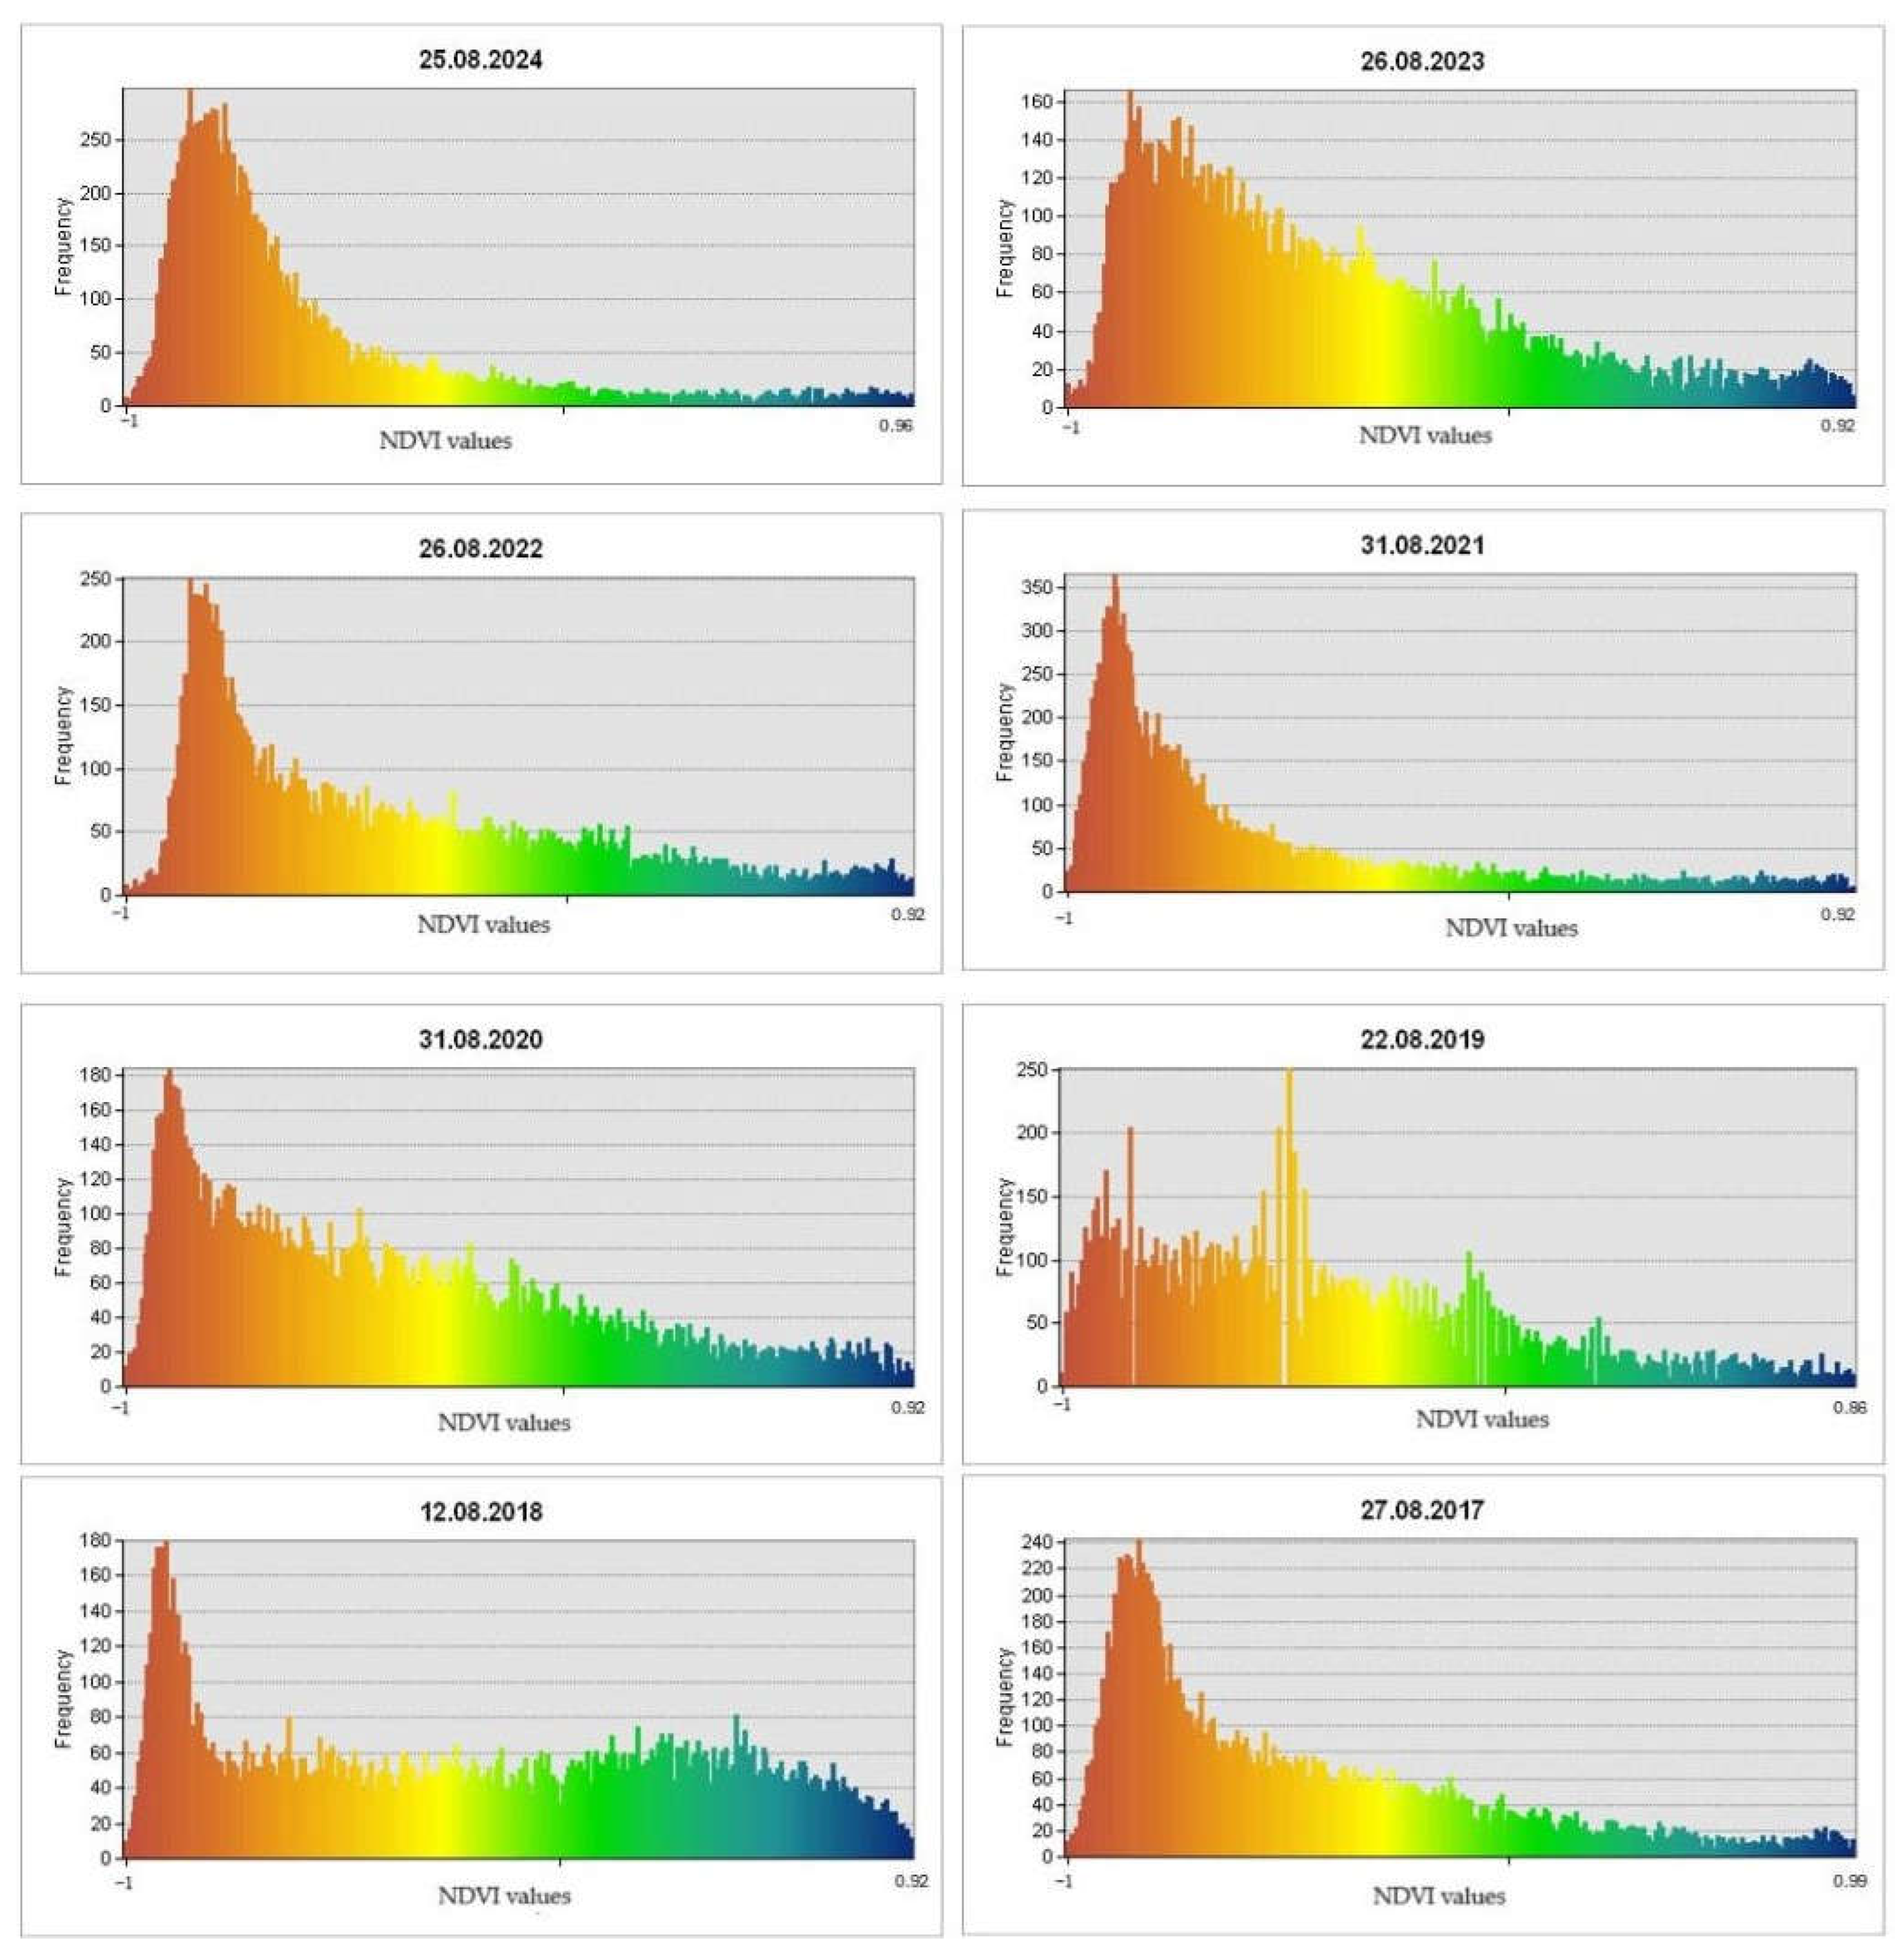
3.3. Normalized Difference Vegetation Index—Time Series Analysis
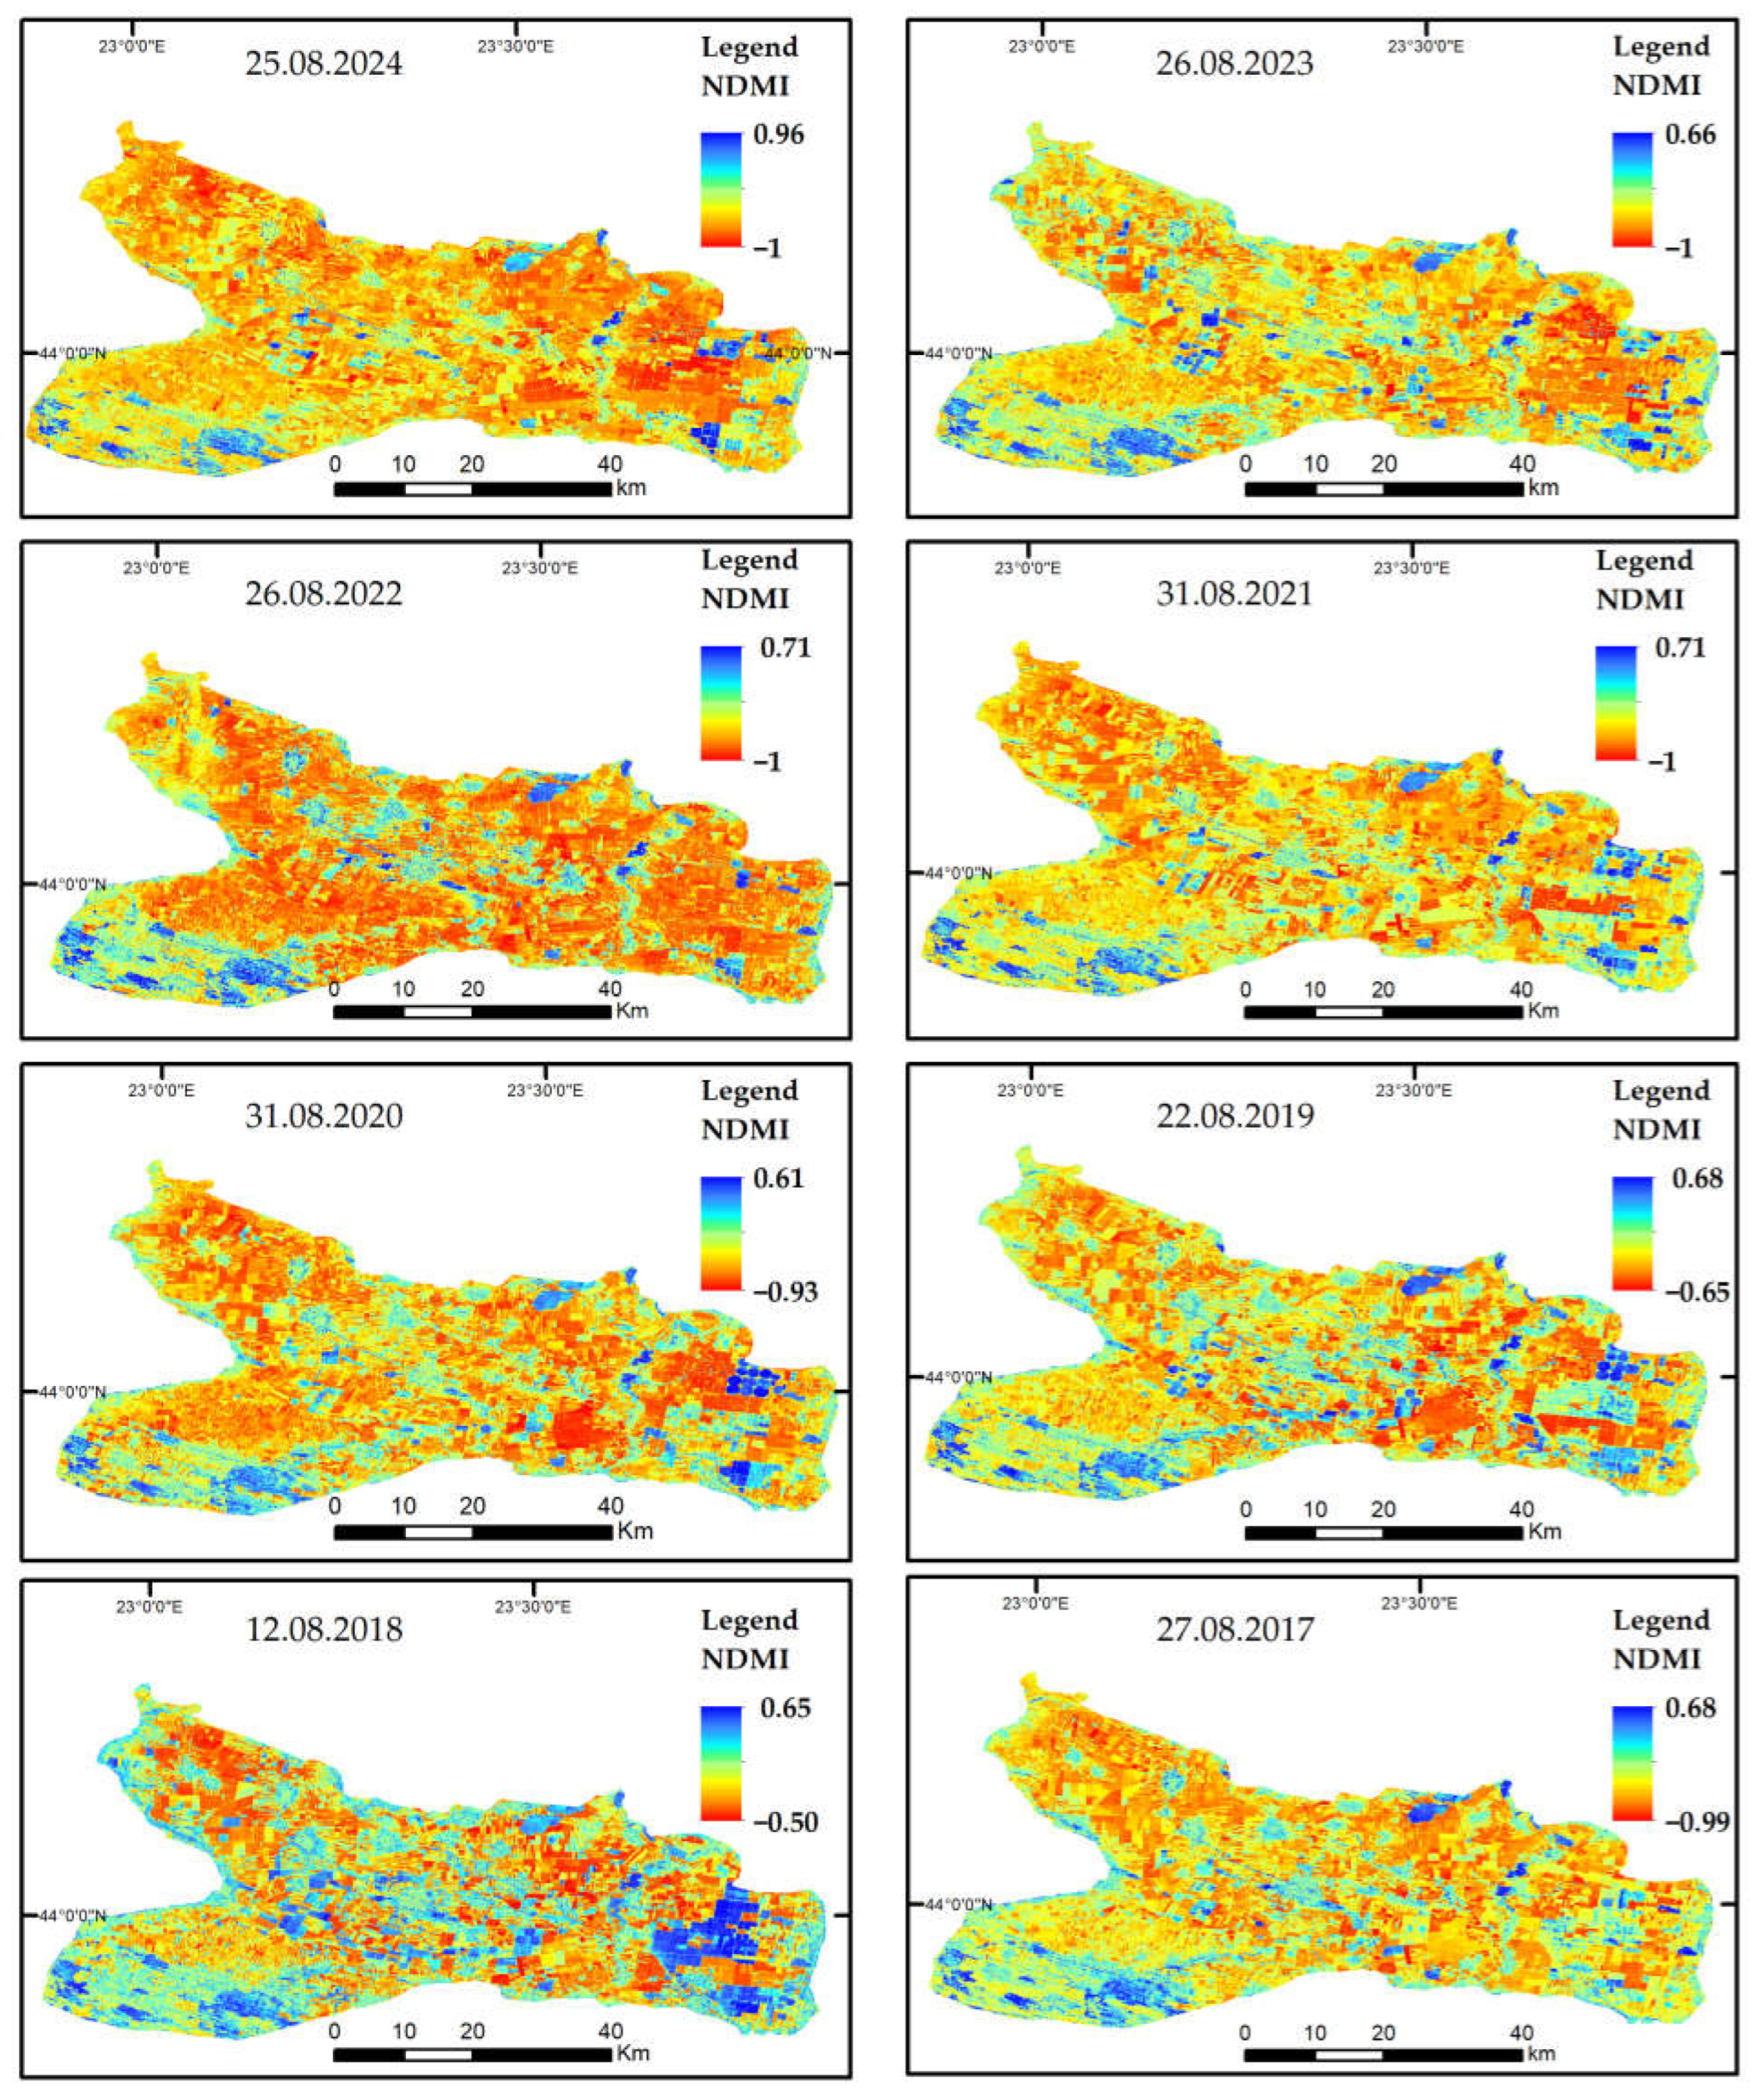
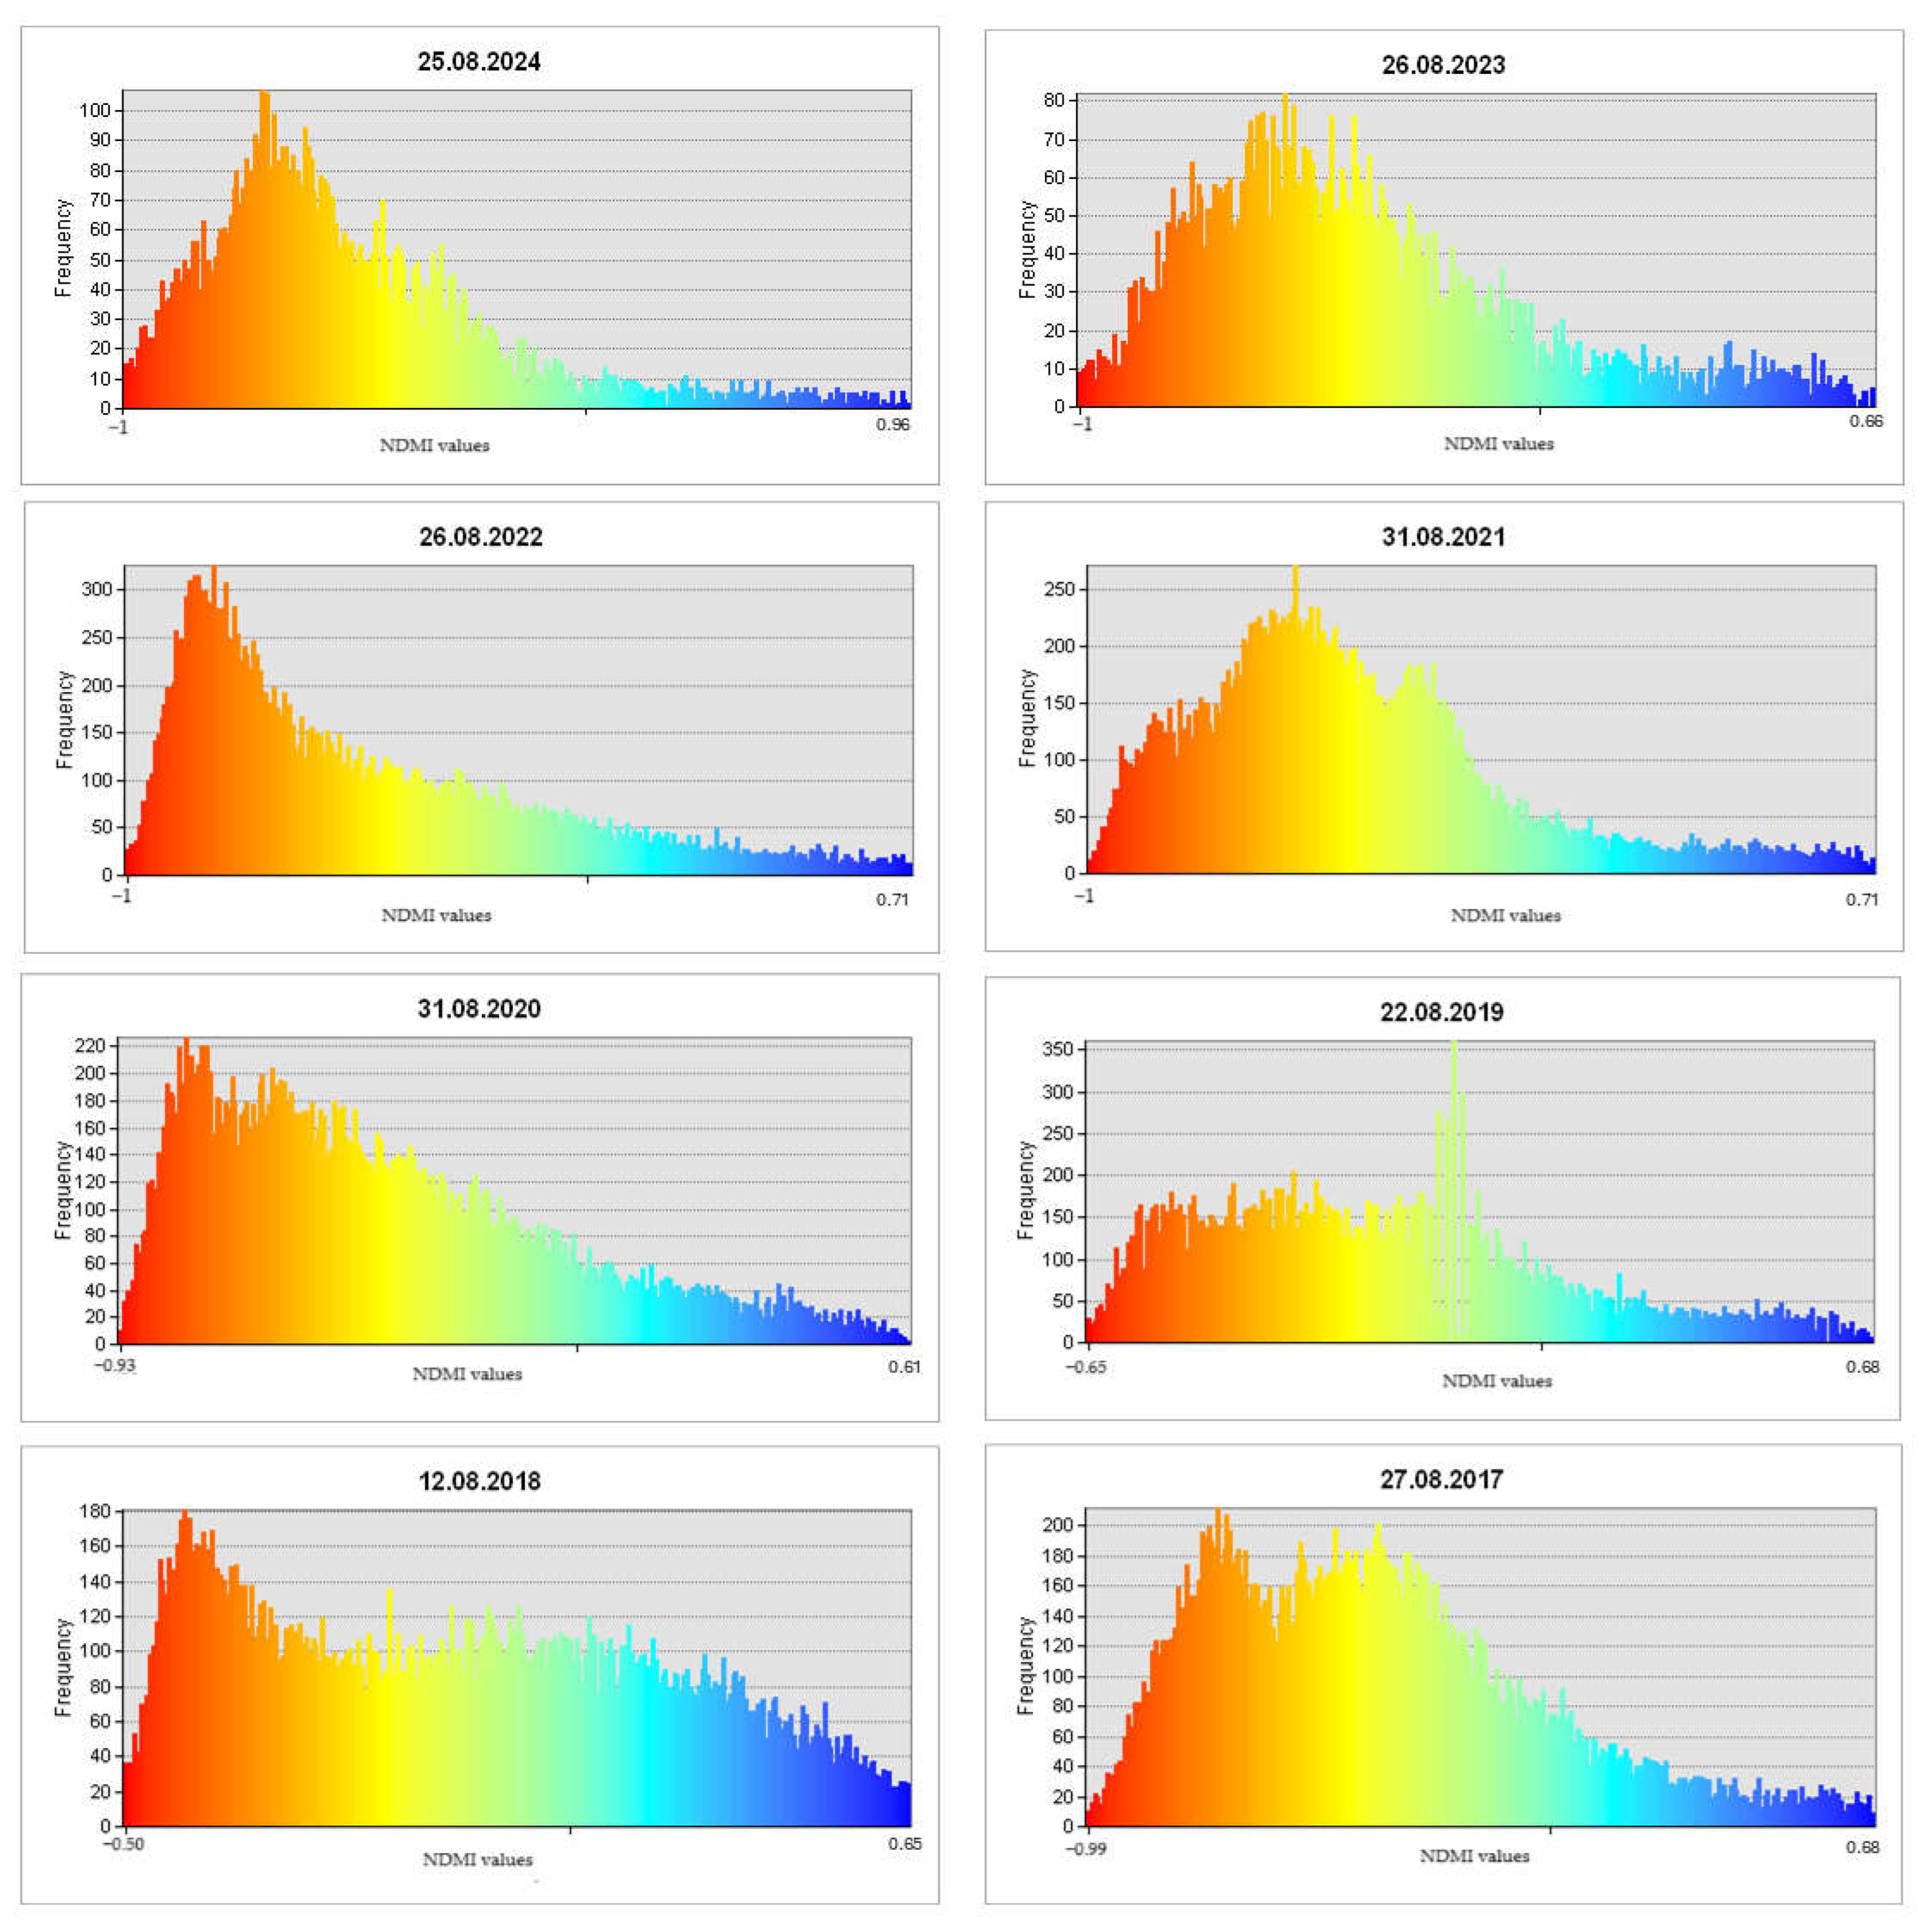
3.4. Normalized Difference Moisture Index—Time Series Analysis
4. Discussion
5. Conclusions
Author Contributions
Funding
Institutional Review Board Statement
Informed Consent Statement
Data Availability Statement
Conflicts of Interest
References
- Seneviratne, S.I.; Zhang, X.; Adnan, M.; Badi, W.; Dereczynski, C.; Di Luca, A.; Ghosh, S.; Iskandar, I.; Kossin, J.; Lewis, S.; et al. Weather and Climate. In Climate Change 2021: The Physical Science Basis. Contribution of Working Group I to the Sixth Assessment Report of the Intergovernmental Panel on Climate Change; Masson-Delmotte, V., Zhai, P., Pirani, A., Connors, S.L., Péan, C., Berger, S., Caud, N., Chen, Y., Goldfarb, L., Gomis, M.I., Eds.; Cambridge University Press: Cambridge, UK; New York, NY, USA, 2021; pp. 1513–1766. [Google Scholar] [CrossRef]
- Wilhite, D.A.; Glantz, M.H. Understanding: The Drought Phenomenon: The Role of Definitions. Water Int. 1985, 10, 111–120. [Google Scholar] [CrossRef]
- Kubiak-Wójcicka, K.; Pilarska, A.; Kamiński, D. Meteorological drought in the upper Noteć catchment area (Central Poland) in the light of NDVI and SPI indicators. Appl. Water Sci. 2024, 14, 180. [Google Scholar] [CrossRef]
- Zhuang, Y.; Fu, R.; Lisonbee, J.; Sheffield, A.M.; Parker, B.A.; Deheza, G. Anthropogenic warming has ushered in an era of temperature-dominated droughts in the western United States. Sci. Adv. 2024, 10, eadn9389. [Google Scholar] [CrossRef] [PubMed]
- Pan, S.; He, Z.; Gu, X.; Xu, M.; Chen, L.; Yang, S.; Tan, H. Agricultural drought-driven mechanism of coupled climate and human activities in the karst basin of southern China. Sci. Rep. 2024, 14, 12072. [Google Scholar] [CrossRef]
- Li, Y.; Huang, Y.; Li, Y.; Zhang, H.; Fan, J.; Deng, Q.; Wang, X. Spatiotemporal heterogeneity in meteorological and hydrological drought patterns and propagations influenced by climatic variability, LULC change, and human regulations. Sci. Rep. 2024, 14, 5965. [Google Scholar] [CrossRef]
- Lee, J.-W.; Hong, E.-M.; Jang, W.-J.; Kim, S.-J. Assessment of socio-economic drought information using drought-related Internet news data (Part A: Socio-economic drought data construct and evaluation socio-economic drought information). Int. J. Disaster Risk 2022, 75, 102961. [Google Scholar] [CrossRef]
- van Mourik, J.; Ruijsch, D.; van der Wiel, K.; Hazeleger, W.; Wanders, N. Regional drivers and characteristics of multi-year droughts. Weather Clim. Extrem. 2025, 48, 100748. [Google Scholar] [CrossRef]
- Rossi, L.; Wens, M.; De Moel, H.; Cotti, D.; Sabino Siemons, A.-S.; Toreti, A.; Maetens, W.; Masante, D.; Van Loon, A.; Hagenlocher, M.; et al. European Drought Risk Atlas; Publications Office of the European Union: Luxembourg, 2023. [Google Scholar] [CrossRef]
- Rakovec, O.; Samaniego, L.; Hari, V.; Markonis, Y.; Moravec, V.; Thober, S.; Hanel, M.; Kumar, R. The 2018–2020 multi-year drought sets a new benchmark in Europe. Earth’s Future 2022, 10, e2021EF002394. [Google Scholar] [CrossRef]
- Blauhut, V.; Stoelzle, M.; Ahopelto, L.; Brunner, M.I.; Teutschbein, C.; Wendt, D.E.; Akstinas, V.; Bakke, S.J.; Barker, L.J.; Bartošová, L.; et al. Lessons from the 2018–2019 European droughts: A collective need for unifying drought risk management. Nat. Hazards Earth Syst. Sci. 2022, 22, 2201–2217. [Google Scholar] [CrossRef]
- Cheval, S.; Busuioc, A.; Dumitrescu, A.; Birsan, M.V. Spatiotemporal variability of meteorological drought in Romania using the standardized precipitation index (SPI). Clim. Res. 2014, 60, 235–248. [Google Scholar] [CrossRef]
- Nagavciuc, V.; Scholz, P.; Ionita, M. Hotspots for warm and dry summers in Romania. Nat. Hazards Earth Syst. Sci. 2022, 22, 1347–1369. [Google Scholar] [CrossRef]
- Angearu, C.-V.; Onțel, I.; Boldeanu, G.; Mihailescu, D.; Nertan, A.; Craciunescu, V.; Catana, S.; Irimescu, A. Multi-Temporal Analysis and Trends of the Drought Based on MODIS Data in Agricultural Areas, Romania. Remote Sens. 2020, 12, 3940. [Google Scholar] [CrossRef]
- Bojariu, R.; Bîrsan, M.V.; Cică, R.; Velea, L.; Burcea, S.; Dumitrescu, A.; Dascășu, S.I.; Gothard, M.; Dobrinescu, A.; Cărbunaru, F.; et al. Schimbările Climatice—De la Bazele Fizice la Riscuri şi Adaptare; Editura Printech: București, România, 2015. [Google Scholar]
- Ionita, M.; Scholz, P.; Chelcea, S. Assessment of droughts in Romania using the Standardized Precipitation Index. Nat. Hazards 2016, 81, 1483–1498. [Google Scholar] [CrossRef]
- Prăvălie, R.; Piticar, A.; Roșc, B.; Sfîcă, L.; Bandoc, G.; Tiscovschi, A.; Patriche, C. Spatio-temporal changes of the climatic water balance in Romania as a response to precipitation and reference evapotranspiration trends during 1961–2013. Catena 2019, 172, 295–312. [Google Scholar] [CrossRef]
- Onțel, I.; Vlăduț, A. Impact of drought on the productivity of agricultural crops within the Oltenia Plain, Romania. Geogr. Pannonica 2015, 19, 9–19. [Google Scholar] [CrossRef]
- Prăvălie, R. Climate issues on aridity trends of Southern Oltenia in the last five decades. Geogr. Tech. 2013, 1, 70–79. Available online: http://www.technicalgeography.org/pdf/1_2013/08_1_2013.pdf (accessed on 10 December 2024).
- Răducă, C.; Crişu, L.; Boengiu, S. Aridity risk in the west of the Oltenia Plain: Natural factors and human impacts on land degradation. Forum Geogr. 2019, XVIII, 143–152. [Google Scholar] [CrossRef]
- Vlăduț, A.; Onțel, I.; Roșca, C.; Chivu, A. Analysis of Drought Phenomenon within Oltenia Plain, Romania (1961–2010). Riscuri Și Catastr. 2013, 12, 45–56. [Google Scholar]
- Dumitraşcu, M.; Mocanu, I.; Mitrică, B.; Dragotă, C.; Grigorescu, I.; Dumitrică, C. The assessment of socio-economic vulnerability to drought in Southern Romania (Oltenia Plain). Int. J. Disaster Risk Reduct. 2018, 27, 142–154. [Google Scholar] [CrossRef]
- Ault, T.R. On the essentials of drought in a changing climate. Science 2020, 368, 256–260. [Google Scholar] [CrossRef]
- Kchouk, S.; Melsen, L.A.; Walker, D.W.; van Oel, P.R. A review of drought indices: Predominance of drivers over impacts and the importance of local context. Nat. Hazards Earth Syst. Sci. 2022, 22, 323–344. [Google Scholar] [CrossRef]
- Ionita, M.; Scholz, P.; Chelcea, S. Spatio-temporal variability of dryness/wetness in the Danube River Basin. Hydrol. Process. 2015, 29, 4483–4497. [Google Scholar] [CrossRef]
- Bădăluță, C.A.; Haliuc, A.; Bădăluță, G.; Scriban, R.E. Spatiotemporal variability of drought in Romania during 1901–2021 using the Standardized Precipitation Evapotranspiration Index (SPEI). Analele Univ. Oradea Ser. Geogr. 2024, 34, 33–44. [Google Scholar] [CrossRef]
- Lazăr, A.; Marin, A.; Nedelea, A. Agriculture drought assessment based on remote sensing, cloud computing, multi-temporal analysis. A case study: The Mostiștea Plain (Romania). Forum Geogr. 2020, XIX, 158–164. [Google Scholar] [CrossRef]
- Minea, I.; Iosub, M.; Boicu, D. Multi-scale approach for different type of drought in temperate climatic conditions. Nat. Hazards 2022, 110, 1153–1177. [Google Scholar] [CrossRef]
- Chelu, A.; Zaharia, L.; Toroimac, I.G. Temporal and Spatial Variability of Drought Based on SPEI Analysis in Southeastern Romania. In Proceedings of the 2020 “Air and Water—Components of the Environment” Conference Proceedings, Cluj-Napoca, Romania, 18–20 March 2022; pp. 71–80. [Google Scholar] [CrossRef]
- Venturi, S.; Mateescu, E.; Virsta, A.; Petrescu, N.; Dunea, D.; Casadei, S. Drought monitoring in Southeastern Romania based on the comparison and correlation of SPEI and SPI indices. Sci. Pap. Ser. E Land Reclam. Earth Obs. Surv. Environ. Eng. 2024, XIII, 655–661. [Google Scholar]
- Posea, G.; Badea, L. România. Unităţile de Relief (Regionarea Geomorfologică) [Romania. Relief Units (Geomorphological Regionalization]; Editura Ştiinţifică şi Enciclopedică: Bucureşti, România, 1984. [Google Scholar]
- Vlăduț, A.; Onțel, I. Summer air temperature variability and trends within Oltenia Plain. J. Geogr. Inst. Jovan Cvijic SASA 2013, 63, 371–381. [Google Scholar] [CrossRef]
- Administrația Națională de Meteorologie. Catalog Date 2024 [National Meteorological Administration—Data Catalog 2024]. Available online: https://www.meteoromania.ro/ (accessed on 15 December 2024).
- Popov, H. Using Köppen Climate Classification Like Diagnostic Tool to Quantify Climate Variation in Lower Danube Valley for the Period 1961–2017. In The Lower Danube River; Negm, A., Zaharia, L., Ioana-Toroimac, G., Eds.; Earth and Environmental Sciences Library; Springer: Cham, Switzerland, 2022. [Google Scholar] [CrossRef]
- Ielenicz, M. Romania. Geografie Fizică. Volumul II—Clima, Ape, Vegetatie, Soluri, Mediu [Romania. Physical Geography. Volume II—Climate, Waters, Vegetation, Soils, Environment]; Editura Universitară: București, România, 2007; ISBN 978-973-749-190-9. [Google Scholar]
- Pearson, E.S.; Hartley, H.O. Biometrika Tables for Statisticians; Cambridge University Press: Cambridge, UK, 1966; Volume I. [Google Scholar]
- Jaiswal, R.K.; Lohani, A.K.; Tiwari, H.L. Statistical Analysis for Change Detection and Trend Assessment in Climatological Parameters. Environ. Process. 2015, 2, 729–749. [Google Scholar] [CrossRef]
- Liu, C.; Yang, C.; Yang, Q.; Wang, J. Spatiotemporal drought analysis by the standardized precipitation index (SPI) and standardized precipitation evapotranspiration index (SPEI) in Sichuan Province, China. Sci. Rep. 2021, 11, 1280. [Google Scholar] [CrossRef]
- Salmi, T.; Määttä, A.; Anttila, P.; Ruoho-Airola, T.; Ammell, T. Detecting Trends of Annual Values of Atmospheric Pollutants by the Mann-Kendall Test and Sen’s Slope Estimates: The Excel Template Application MAKESENS; Publications of Air Quality 31, Report Code FMI-AQ-31; Ilmatieteen laitos: Helsinki, Finland, 2002; Available online: http://www.fmi.fi/kuvat/MAKESENS_MANUAL.pdf (accessed on 14 December 2024).
- McKee, T.B.; Doesken, N.J.; Kleist, J. The relationship of drought frequency and duration to time scales. In Proceedings of the Eighth Conference on Applied Climatology, Anaheim, CA, USA, 17–22 January 1993; pp. 179–184. [Google Scholar]
- Patriche, C.V. Metode Statistice Aplicate în Climatologie [Statistical Methods Applied in Climatology]; Editura Terra Nostra: Iași, România, 2009; 170p, ISBN 978-973-1888-08-8. [Google Scholar]
- Shiau, J.T. Effects of Gamma-Distribution Variations on SPI-Based Stationary and Nonstationary Drought Analyses. Water Resour. Manag. 2020, 34, 2081–2095. [Google Scholar] [CrossRef]
- Guttman, N.B. Accepting the Standardized Precipitation Index: A Calculation Algorithm. JAWRA J. Am. Water Resour. Assoc. 1995, 35, 311–322. [Google Scholar] [CrossRef]
- Vicente-Serrano, S.M.; Beguería, S.; López-Moreno, J.I. A Multi-scalar drought index sensitive to global warming: The Standardized Precipitation Evapotranspiration Index—SPEI. J. Clim. 2010, 23, 1696–1718. [Google Scholar] [CrossRef]
- Li, Y.; Yao, N.; Sahin, S.; Appels, W.M. Spatiotemporal variability of four precipitation-based drought indices in Xinjiang, China. Theor. Appl. Climatol. 2017, 129, 1017–1034. [Google Scholar] [CrossRef]
- Wolf, J.F.; Abatzoglou, J. The suitability of drought metrics historically and under climate change scenarios. In Proceedings of the 47th Annual Water Resources Conference, Albuquerque, NM, USA, 7–10 November 2011. [Google Scholar]
- Secci, D.; Tanda, M.G.; D’Oria, M.; Todaro, V.; Fagandini, C. Impacts of climate change on groundwater droughts by means of standardized indices and regional climate models. J. Hydrol. 2021, 603 Pt D, 127154. [Google Scholar] [CrossRef]
- Begueria, S.; Vicente-Serrano, S.M.; Reigb, F.; Latorrea, B. Standardized precipitation evapotranspiration index (SPEI) revisited: Parameter fitting, evapotranspiration models, tools, datasets and drought monitoring. Int. J. Climatol. 2014, 34, 3001–3023. [Google Scholar] [CrossRef]
- Allen, R.G.; Pereira, L.S.; Raes, D.; Smith, M. Penman-Monteith Equation. In Encyclopedia of Soils in the Environment; Academic Press: Cambridge, MA, USA, 2005; pp. 180–188. [Google Scholar] [CrossRef]
- Wang, P.; Qian, Y. Revisiting the Saturation Vapor Pressure of Water: A More Accurate Parameterization. J. Appl. Meteorol. Climatol. 2021, 60, 527–540. [Google Scholar]
- Owen, P.R.; McCarty, J.L. Estimating Actual Vapor Pressure in Meteorological Models. J. Clim. 2019, 32, 2905–2917. [Google Scholar]
- Paulo, A.A.; Rosa, R.D.; Pereira, L.S. Climate trends and behaviour of drought indices based on precipitation and evapotranspiration in Portugal. Nat. Hazards Earth Syst. Sci. 2012, 12, 1481–1491. [Google Scholar] [CrossRef]
- European Space Agency. Sentinel-2 Data. Available online: https://apps.sentinel-hub.com/ (accessed on 10 December 2024).
- Main-Knorn, M.; Pflug, B.; Louis, J.; Debaecker, V.; Müller-Wilm, U.; Gascon, F. Sen2Cor for Sentinel-2. Proc. Image Signal Process. Remote Sens. 2017, XXIII, 10457. [Google Scholar] [CrossRef]
- Rouse, J.W.; Hass, R.H.; Schell, J.A.; Deering, D.W.; Harlan, J.C. Monitoring the Vernal Advancement and Retrogradation (Greenwave Effect) of Natural Vegetation. In NASA/GSFC Type III Final Report; NASA/GSFC: Greenbelt, MD, USA, 1974. [Google Scholar]
- Gao, B.C. NDWI—A normalized difference water index for remote sensing of vegetation liquid water from space. Remote Sens. Environ. 1996, 58, 257–266. [Google Scholar] [CrossRef]
- Drisya, J.; Sathish Kumar, D.; Roshni, T. Spatiotemporal Variability of Soil Moisture and Drought Estimation Using a Distributed Hydrological Model. In Integrating Disaster Science and Management; Samui, P., Kim, D., Ghosh, C., Eds.; Elsevier: Amsterdam, The Netherlands, 2018; pp. 451–460. [Google Scholar] [CrossRef]
- Pearson, E.S.; Hartley, H.O. Biometrika Tables for Statisticians; Cambridge University Press: Cambridge, UK, 1972; Volume II. [Google Scholar]
- Cheval, S.; Dumitrescu, A.; Birsan, M.V. Variability of the aridity in the South-Eastern Europe over 1961–2050. Catena 2017, 151, 74–86. [Google Scholar] [CrossRef]
- van den Besselaar, E.J.M.; Tank, A.M.G.K.; Buishand, T.A. Trends in European precipitation extremes over 1951–2010. Int. J. Climatol. 2012, 33, 2682–2689. [Google Scholar] [CrossRef]
- Ossó, A.; Allan, R.P.; Hawkins, E.; Shaffrey, L.; Maraun, D. Emerging new climate extremes over Europe. Clim. Dyn. 2022, 58, 487–501. [Google Scholar] [CrossRef]
- Croitoru, A.E.; Piticar, A.; Dragotă, C.S.; Burada, D.C. Recent changes in reference evapotranspiration in Romania. Glob. Planet. Change 2013, 111, 127–137. [Google Scholar] [CrossRef]
- Prăvălie, R. Analysis of temperature, precipitation and potential evapotranspiration trends in southern Oltenia in the context of climate change. Geogr. Tech. 2014, 9, 68–84. [Google Scholar]
- Spinoni, J.; Naumann, G.; Vogt, J.V.; Barbosa, P. The biggest drought events in Europe from 1950 to 2012. J. Hydrol. Reg. Stud. 2015, 3, 509–524. [Google Scholar] [CrossRef]
- Jaagus, J.; Aasa, A.; Aniskevich, S.; Boincean, B.; Bojariu, R.; Briede, A.; Danilovich, I.; Domínguez Castro, F.; Dumitrescu, A.; Labuda, M.; et al. Long-term changes in drought indices in eastern and central Europe. Int. J. Climatol. 2022, 42, 225–249. [Google Scholar] [CrossRef]
- El-Hokayem, L.; De Vita, P.; Conrad, C. Local identification of groundwater dependent vegetation using high-resolution Sentinel-2 data–A Mediterranean case study. Ecol. Indic. 2023, 146, 109784. [Google Scholar] [CrossRef]
- Harmse, C.J.; Gerber, H.; Van Niekerk, A. Evaluating several vegetation indices derived from Sentinel-2 imagery for quantifying localized overgrazing in a semi-arid region of South Africa. Remote Sens. 2022, 14, 1720. [Google Scholar] [CrossRef]
- Urban, M.; Berger, C.; Mudau, T.E.; Heckel, K.; Truckenbrodt, J.; Odipo, V.O.; Smit, I.P.J.; Schmullius, C. Surface moisture and vegetation cover analysis for drought monitoring in the southern Kruger National Park using Sentinel-1, Sentinel-2, and Landsat-8. Remote Sens. 2018, 10, 1482. [Google Scholar] [CrossRef]
- Gaikwad, S.V.; Vibhute, A.D.; Kale, K.V. Assessing meteorological drought and detecting LULC dynamics at a regional scale using SPI, NDVI, and random forest methods. SN Comput. Sci. 2022, 3, 458. [Google Scholar] [CrossRef]
- Varghese, D.; Radulović, M.; Stojković, S.; Crnojević, V. Reviewing the potential of Sentinel-2 in assessing the drought. Remote Sens. 2021, 13, 3355. [Google Scholar] [CrossRef]


| Station | Altitude (m) | Latitude | Longitude |
|---|---|---|---|
| Băilești | 58 | 44°1′ N | 23°19′ E |
| Calafat | 60.8 | 43°59′ N | 22°57′ E |
| Bechet | 36 | 43°47′ N | 23°57′ E |
| Drought Category | SPI Values |
|---|---|
| mild drought | 0 to −0.99 |
| moderate drought | −1.00 to −1.49 |
| severe drought | −1.50 to −1.99 |
| extreme draught | −2.0 and below |
| Station | SKEW |
|---|---|
| Băilești | 0.97 |
| Calafat | 0.79 |
| Bechet | 0.74 |
| Year | Băilești | Calafat | Bechet | Year | Băilești | Calafat | Bechet |
|---|---|---|---|---|---|---|---|
| 1981 | 0.70 | 0.21 | 0.06 | 2003 | 0.15 | 0.14 | 0.88 |
| 1982 | 0.29 | −0.27 | −0.01 | 2004 | 0.26 | −0.69 | 0.19 |
| 1983 | −1.22 | −1.45 | −1.88 | 2005 | 2.03 | 1.92 | 2.32 |
| 1984 | −0.12 | −0.45 | 0.16 | 2006 | 0.41 | 0.24 | 0.53 |
| 1985 | −0.40 | −0.07 | −1.31 | 2007 | 0.74 | 0.44 | −0.03 |
| 1986 | 0.49 | 0.61 | −0.08 | 2008 | −0.31 | 0.08 | −0.65 |
| 1987 | 0.12 | 1.01 | 0.10 | 2009 | 0.61 | 1.17 | 1.05 |
| 1988 | −0.91 | −0.64 | −0.27 | 2010 | 1.60 | 0.48 | 1.48 |
| 1989 | −0.71 | −1.09 | −0.84 | 2011 | −0.60 | −1.77 | −1.28 |
| 1990 | −0.58 | −1.02 | −0.33 | 2012 | −0.98 | −0.57 | −0.56 |
| 1991 | −0.28 | 0.06 | 0.75 | 2013 | 0.27 | 0.02 | −0.21 |
| 1992 | −2.66 | −2.15 | −0.93 | 2014 | 3.00 | 2.87 | 2.55 |
| 1993 | −1.16 | −0.93 | −1.30 | 2015 | 0.11 | 0.27 | 0.96 |
| 1994 | −0.65 | −0.72 | −1.04 | 2016 | 0.64 | 1.41 | 1.30 |
| 1995 | 0.34 | 0.11 | 0.32 | 2017 | −0.35 | 0.34 | 0.76 |
| 1996 | 0.30 | 0.43 | −0.33 | 2018 | 0.66 | 0.68 | 1.22 |
| 1997 | 0.17 | −0.05 | 0.37 | 2019 | −0.48 | 0.14 | −0.58 |
| 1998 | 0.54 | 0.26 | 0.31 | 2020 | 0.07 | 0.16 | −0.26 |
| 1999 | 1.15 | 0.64 | −0.84 | 2021 | 0.00 | 0.42 | 0.53 |
| 2000 | −2.55 | −2.57 | −2.11 | 2022 | 0.04 | −0.24 | −0.28 |
| 2001 | −0.80 | −0.40 | −0.58 | 2023 | 0.39 | 0.77 | 0.58 |
| 2002 | 0.69 | 1.26 | 0.43 | 2024 | −0.93 | −1.01 | −1.03 |
| ≥2.0 extremely wet | 1.5 to 1.99 Severely wet | 1.0 to 1.49 moderately wet | −0.50 to 0.99 near normal | −0.51 to −1 mild drought | −1.0 to −1.5 moderate drought | −1.51 to −2.0 severe drought | ≤−2 extreme drought |
| Mann–Kendall Trend (First Year: 1981; Last Year: 2024, n = 44) | Sen’s Slope Estimate | ||||
|---|---|---|---|---|---|
| Time Series | Test Z | p-Value | Signific. | Q | |
| BĂILEȘTI | YEAR | 1 | 0.32 | 1.43 | |
| January | 1.4 | 0.16 | 0.44 | ||
| February | −0.31 | 1.24 | −0.05 | ||
| March | 0.6 | 0.55 | 0.24 | ||
| April | −1.17 | 1.76 | −0.4 | ||
| May | 1.7 | 0.09 | + | 0.62 | |
| June | 0.66 | 0.51 | 0.27 | ||
| July | 0.62 | 0.54 | 0.32 | ||
| August | 0.08 | 0.94 | 0.01 | ||
| September | 0.93 | 0.35 | 0.27 | ||
| October | 1.69 | 0.09 | + | 0.64 | |
| November | 0.96 | 0.34 | 0.32 | ||
| December | −0.29 | 1.23 | −0.15 | ||
| CALAFAT | YEAR | 2.13 | 0.03 | * | 2.59 |
| January | 1.69 | 0.09 | + | 0.56 | |
| February | 0.2 | 0.84 | 0.05 | ||
| March | 0.9 | 0.37 | 0.26 | ||
| April | −1.2 | 1.77 | −0.28 | ||
| May | 1.71 | 0.09 | + | 0.59 | |
| June | 1.65 | 0.10 | + | 0.63 | |
| July | 0.48 | 0.63 | 0.14 | ||
| August | −0.09 | 1.07 | −0.05 | ||
| September | −0.06 | 1.05 | −0.02 | ||
| October | 1.43 | 0.15 | 0.7 | ||
| November | 1.17 | 0.24 | 0.44 | ||
| December | −0.02 | 1.02 | −0.02 | ||
| BECHET | YEAR | 2.03 | 0.04 | * | 2.53 |
| January | 0.85 | 0.40 | 0.26 | ||
| February | −0.53 | 1.40 | −0.12 | ||
| March | 0.89 | 0.37 | 0.27 | ||
| April | −0.86 | 1.61 | −0.22 | ||
| May | 1.33 | 0.18 | 0.52 | ||
| June | 2.23 | 0.03 | * | 0.97 | |
| July | −0.29 | 1.23 | −0.1 | ||
| August | −0.5 | 1.38 | −0.1 | ||
| September | 1.59 | 0.11 | 0.38 | ||
| October | 1.99 | 0.05 | * | 0.82 | |
| November | 0.45 | 0.65 | 0.16 | ||
| December | −0.74 | 1.54 | −0.23 | ||
| Year | Bechet | Băilești | Calafat | Year | Bechet | Băilești | Calafat |
|---|---|---|---|---|---|---|---|
| 2005 | 1.88 | 1.69 | 1.59 | 2015 | 0.47 | −0.22 | −0.14 |
| 2006 | 0.07 | 0.09 | −0.18 | 2016 | 0.81 | 0.27 | 1.01 |
| 2007 | −0.46 | 0.36 | −0.05 | 2017 | 0.26 | −0.62 | −0.12 |
| 2008 | −0.93 | −0.53 | −0.34 | 2018 | 0.74 | 0.27 | 0.26 |
| 2009 | 0.55 | 0.26 | 0.75 | 2019 | −0.83 | −0.71 | −0.27 |
| 2010 | 1.00 | 1.26 | 0.08 | 2020 | −0.60 | −0.27 | −0.26 |
| 2011 | −1.32 | −0.75 | −1.73 | 2021 | 0.07 | −0.34 | −0.03 |
| 2012 | −0.85 | −1.05 | −0.90 | 2022 | −0.61 | −0.30 | −0.61 |
| 2013 | −0.55 | −0.06 | −0.36 | 2023 | 0.10 | −0.33 | 0.32 |
| 2014 | 2.15 | 2.88 | 2.79 | 2024 | −1.94 | −1.91 | −1.81 |
| ≥2.0 extremely wet | 1.5 to 1.99 Severely wet | 1.0 to 1.49 moderately wet | −0.50 to 0.99 near normal | −0.51 to −1 mild drought | −1.0 to −1.5 moderate drought | −1.51 to −2.0 severe drought |
Disclaimer/Publisher’s Note: The statements, opinions and data contained in all publications are solely those of the individual author(s) and contributor(s) and not of MDPI and/or the editor(s). MDPI and/or the editor(s) disclaim responsibility for any injury to people or property resulting from any ideas, methods, instructions or products referred to in the content. |
© 2025 by the authors. Licensee MDPI, Basel, Switzerland. This article is an open access article distributed under the terms and conditions of the Creative Commons Attribution (CC BY) license (https://creativecommons.org/licenses/by/4.0/).
Share and Cite
Crișu, L.; Zamfir, A.-G.; Vlăduț, A.; Boengiu, S.; Simulescu, D.; Mititelu-Ionuș, O. Assessing Vegetation Response to Drought in the Central Part of Oltenia Plain (Romania) Using Vegetation and Drought Indices. Sustainability 2025, 17, 2618. https://doi.org/10.3390/su17062618
Crișu L, Zamfir A-G, Vlăduț A, Boengiu S, Simulescu D, Mititelu-Ionuș O. Assessing Vegetation Response to Drought in the Central Part of Oltenia Plain (Romania) Using Vegetation and Drought Indices. Sustainability. 2025; 17(6):2618. https://doi.org/10.3390/su17062618
Chicago/Turabian StyleCrișu, Lavinia, Andreea-Gabriela Zamfir, Alina Vlăduț, Sandu Boengiu, Daniel Simulescu, and Oana Mititelu-Ionuș. 2025. "Assessing Vegetation Response to Drought in the Central Part of Oltenia Plain (Romania) Using Vegetation and Drought Indices" Sustainability 17, no. 6: 2618. https://doi.org/10.3390/su17062618
APA StyleCrișu, L., Zamfir, A.-G., Vlăduț, A., Boengiu, S., Simulescu, D., & Mititelu-Ionuș, O. (2025). Assessing Vegetation Response to Drought in the Central Part of Oltenia Plain (Romania) Using Vegetation and Drought Indices. Sustainability, 17(6), 2618. https://doi.org/10.3390/su17062618