Article

The Cooling Effect and Its Stability in Urban Green Space in the Context of Global Warming: A Case Study of Changchun, China

College of Geography and Ocean Sciences, Yanbian University, Yanji 133000, China
*
Author to whom correspondence should be addressed.
Sustainability 2025, 17(6), 2590; https://doi.org/10.3390/su17062590
Submission received: 6 February 2025 / Revised: 7 March 2025 / Accepted: 12 March 2025 / Published: 15 March 2025
(This article belongs to the Special Issue A Systems Approach to Urban Greenspace System and Climate Change)

Abstract

The urban heat island effect, triggered by global warming and rapid urbanization, has negatively impacted residents’ lives. It has been shown that urban green space (UGS) can improve the urban thermal environment. However, the stability and influencing factors of the urban green space cooling effect (UGSCE) in the context of climate change remain unclear. In this paper, we study the area within the Fifth Ring Road of Changchun City, using multi-source remote sensing image data to quantify and analyze the influencing factors of the cooling effect of urban green space and its stability on both regional and patch scales. The results show that on the regional scale, urban green spaces in Changchun have a strong cooling effect on the surrounding environment, which increases with the surface temperature (LST). However, there is a large fluctuation in the cooling effect. On the patch scale, the cooling effect of 35 green spaces showed a small increasing trend from 2013 to 2024. The cooling extent (CE) was more stable across temperatures relative to the cooling intensity (CI). Factors such as the green space area (A), perimeter (P), landscape shape index (LSI), and mean enhanced vegetation index (MEVI) had different degrees of influence on the cooling effect of green space and its stability. Green spaces with a high MEVI had a stronger cooling effect and stability. Based on this, planning suggestions such as increasing vegetation amount, maintaining green space area, optimizing green space morphology, and focusing on blue–green space are proposed to enhance the cooling effect of urban green space and its stability, which would improve the thermal environment of the city and enhance the comfort of residents. This study provides a reference basis for the scientific planning of urban green space and provides a scientific basis and practical guidance for the sustainable development of the city.

1. Introduction

As urban sprawl and urbanization accelerate, impermeable surfaces replace natural ones [1,2], exacerbating the urban heat island effect [3,4,5]. Aminipouri, M. et al. describe how extensive impermeable surface coverings with higher temperatures and a lack of shading increase outdoor heat exposure and thermal discomfort for humans [6]. Ballester, J et al. estimated that there were 61,672 heat-related deaths in Europe between 30 May and 4 September 2022 [7]. Iungman, T. et al., Tan, W et al., and Beele, E et al. have also mentioned that global warming and urbanization combined increase urban temperatures, exposing more people to heat-related health risks [8,9,10]. The heat island effect has become a widespread urban problem worldwide [11,12,13]. Therefore, studying urban thermal environmental issues has become a key focus for researchers exploring sustainable urban development [14,15,16,17]. Studies by Drake, J.E. et al. [18], Ibsen, P.C. et al. [19], Peng, J. et al. [20], and Li, Y. et al. [21] have shown that urban green spaces (UGSs), which are an important part of urban ecosystems, have a cooling function. Because land resources are limited in cities, the rational use and planning of urban green spaces is crucial to improving their cooling effect [22,23].
In the context of global warming, researchers are increasingly considering the impact of urban heat characteristics on the cooling effect of parks. Some studies have indicated that urban parks enhance the cooling effect in urban areas characterized by higher temperatures, such as Melbourne [24], and in different climatic zones in China [25]. In a study exploring the effect of urban heating characteristics on the cooling effect of parks, Zhou et al. conducted an analysis of 13,868 urban parks in 276 cities in China and concluded that larger parks are more efficient in hotter urban areas [26]. However, there is a lack of research on the stability and driving factors of the urban green space cooling effect (UGSCE) at different temperatures on the city scale. Research on this is therefore imperative. This knowledge is crucial for the rational planning of urban green space, optimizing the urban climate, enhancing the potential for sustainable urban development, and improving the quality of life for future urban residents.
This study uses Changchun, a temperate city in China, as a case study to analyze the stability of the cooling effect of urban green space under varying temperature conditions across different spatial scales. This analysis uses multi-source remote sensing images, and this study explores the key factors affecting the UGSCE and its stability (SUGSCE). The overall green space in the study area was used as the research object on the regional scale, and land use data were combined in order to analyze the effect of the LST on the UGSCE and explore the stability of the UGSCE under different temperature environments. The mechanisms driving the stability of the UGSCE in different environments were also explored on the patch scale. First, the UGSCE and SUGSCE of 35 green spaces in the study area were quantified using buffer analysis and statistical methods. The changes in and stability of the UGSCE were analyzed under different temperature conditions. Finally, after exploring the driving mechanisms of the various influencing factors, a model was developed to find ways to optimize the UGSCE and SUGSCE. It is anticipated that the resulting proposals and reference bases will guide the scientific planning of urban green space, enhance the city’s adaptability to global warming, improve the city’s potential for sustainable development, optimize the urban ecological environment, and enhance the residents’ quality of life.
The research objectives of this study are as follows:
(1)
To explore the impact of changes in the urban thermal environment on the UGSCE and SUGSCE.
(2)
To study the influencing factors and mechanisms of the UGSCE and SUGSCE and to determine which types of green space have a more stable cooling effect under global warming.

2. Materials and Methods
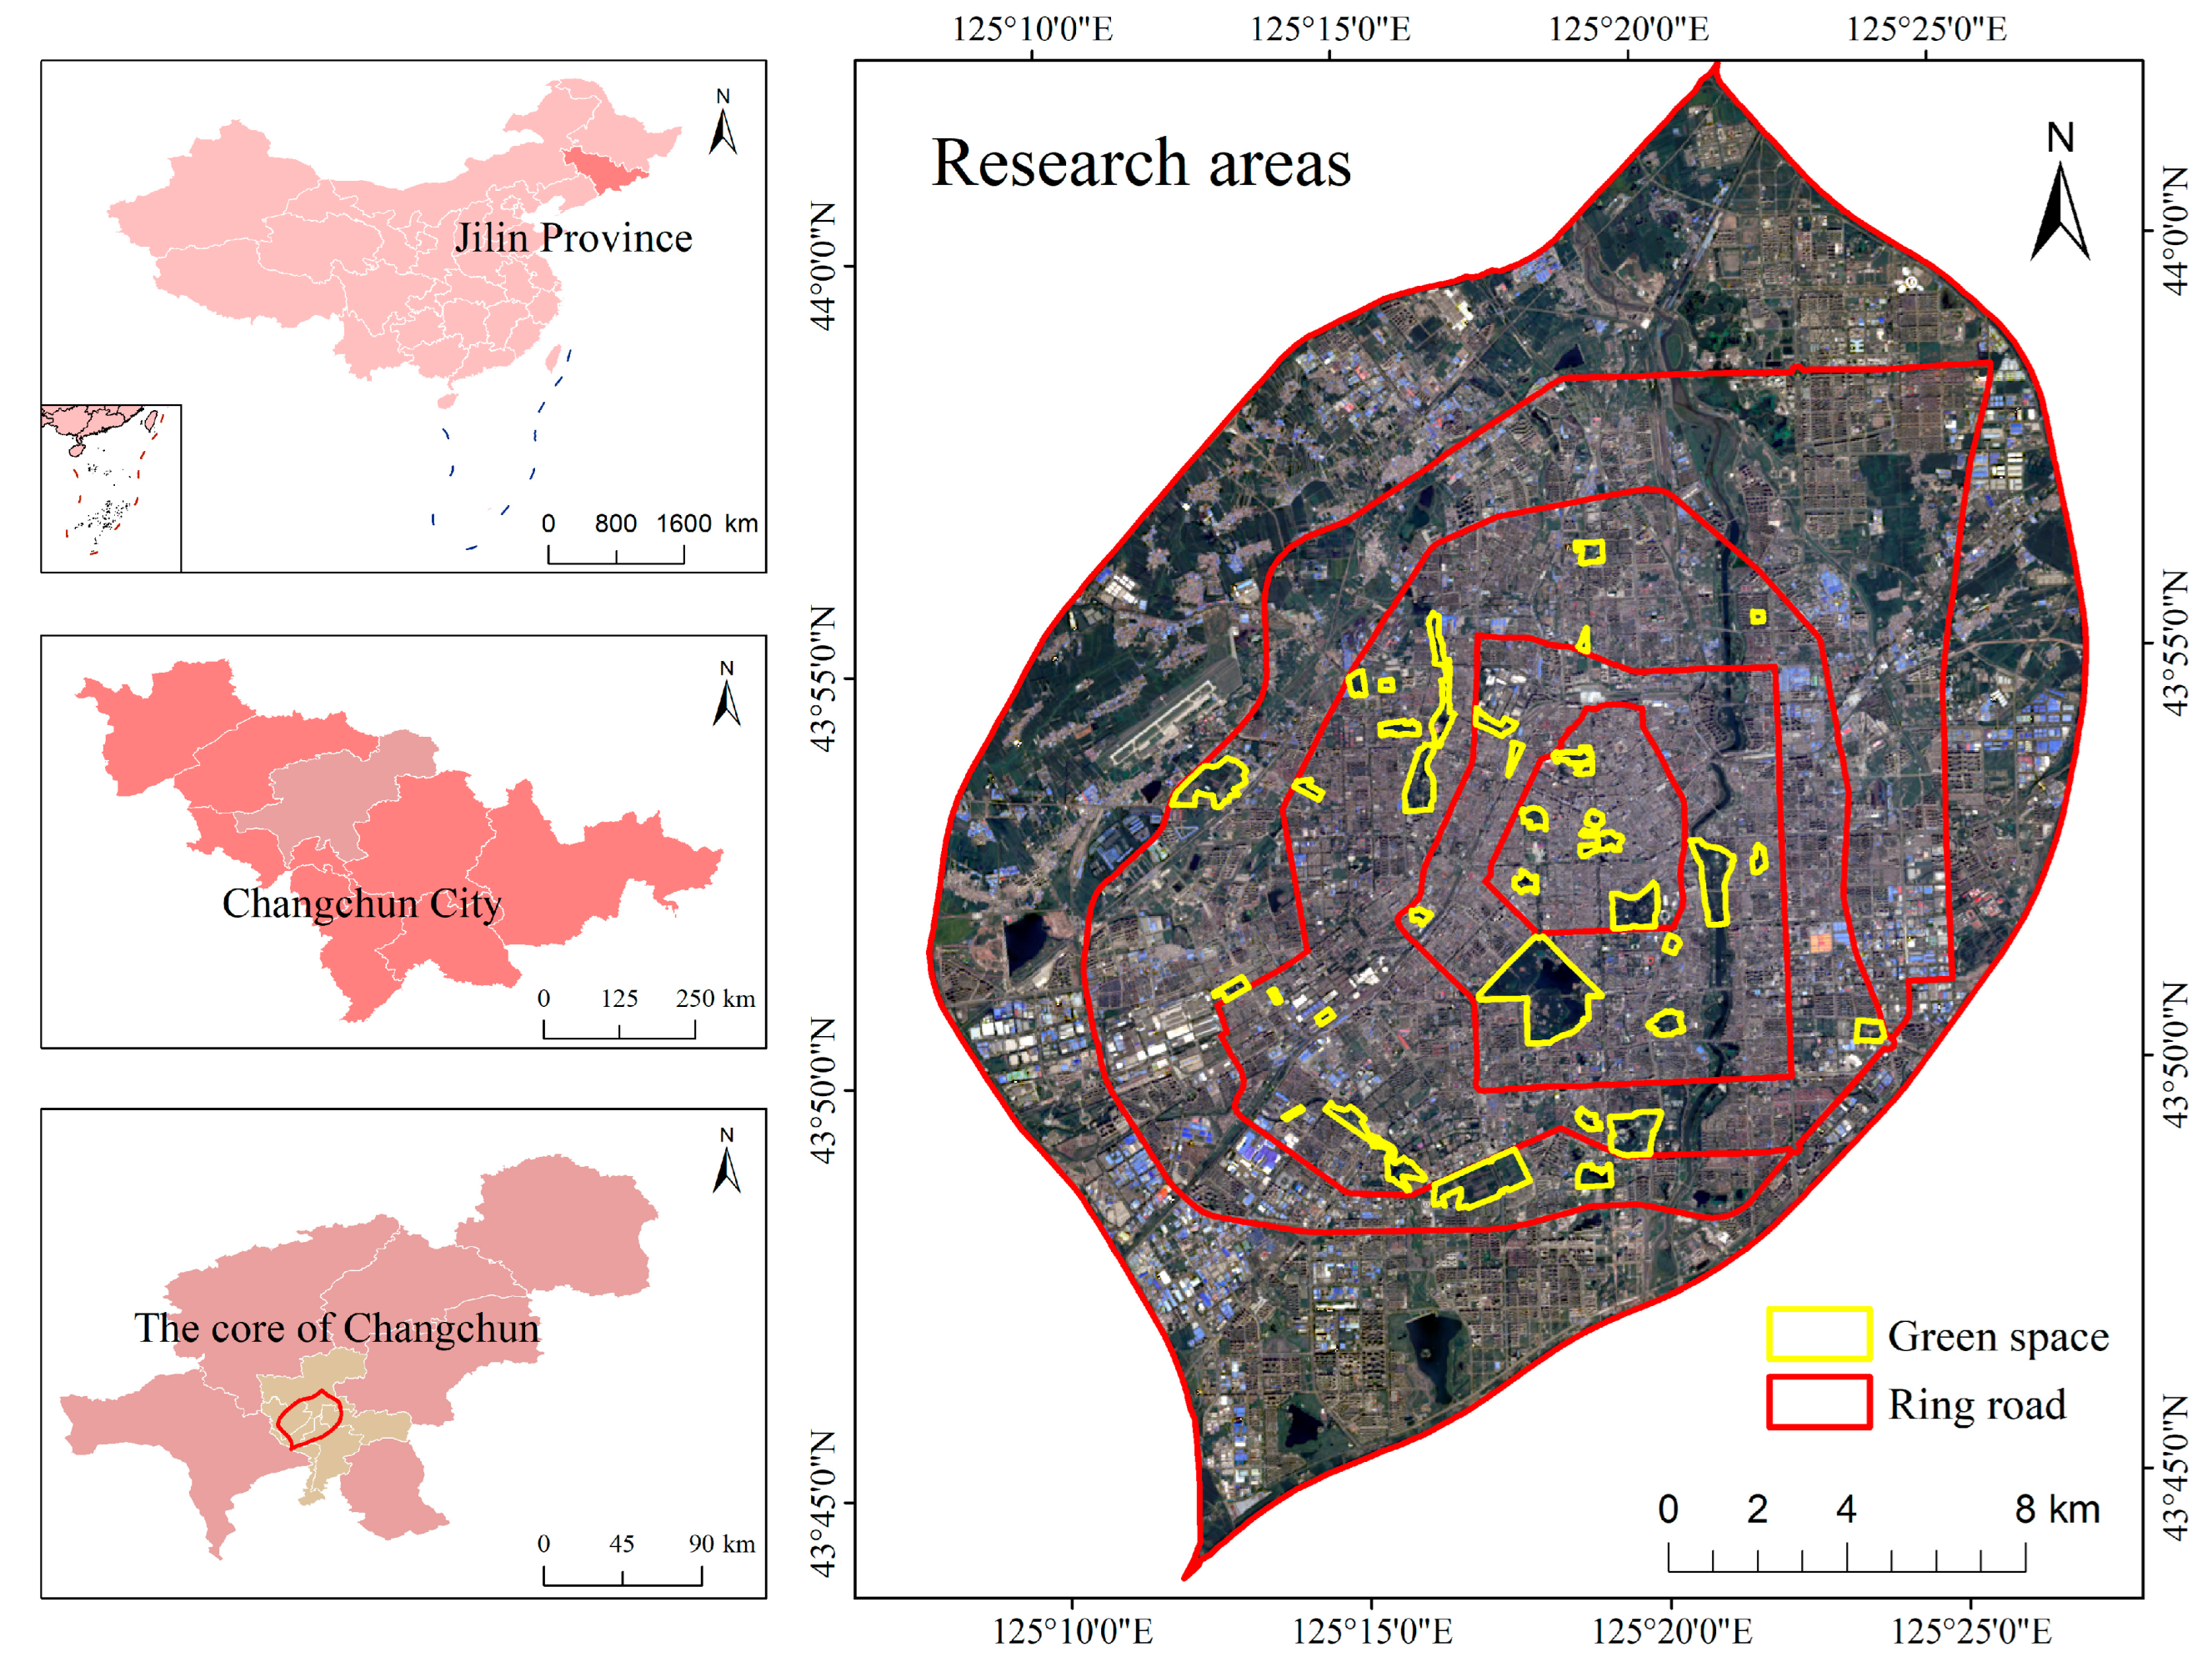
2.1. Study Area

Changchun (43°05′–45°15′ N, 124°18′–127°05′ E) is located in northeastern China, with the Yitong River flowing through the central part of the city. It experiences four distinct seasons and is classified as having a mid-temperate continental monsoon climate. The average annual temperature in Changchun has shown a continuous increase from 1909 to 2021, with urbanization contributing 56.22% to this rise between 1909 and 2015 [27]. In July 2018, the temperature in Changchun City exceeded 32 °C for 17 consecutive days, which adversely affected the life of urban residents [28]. The living environment of urban residents is therefore in urgent need of improvement. Yang Chaobin’s study confirmed that the urban green space in Changchun City has a significant cooling effect in all seasons except for winter [29]. The area within the Fifth Ring Road of Changchun City was selected as the study area (Figure 1). The reasons for this are as follows: (1) Changchun is the capital city of Jilin Province, integrating political, economic, and cultural functions, with a large population and rapid urbanization in recent years, and the urban heat island effect further strengthens the adverse effects of abnormal weather on the city [28]. (2) This area is highly urbanized, and by focusing on the UGSCE, the impact of non-urban green space, such as large areas of farmland in the suburbs and villages surrounding the city, can be minimized. This allows this study to concentrate on urban green space. The elevation in the area ranges from 101 m at the lowest point to 328 m at the highest, a difference of 227 m. (3) The overall low elevation, flat topography, low relief, weak influence of topography on temperature, and minimal interference with the UGSCE allowed this study to be performed smoothly.

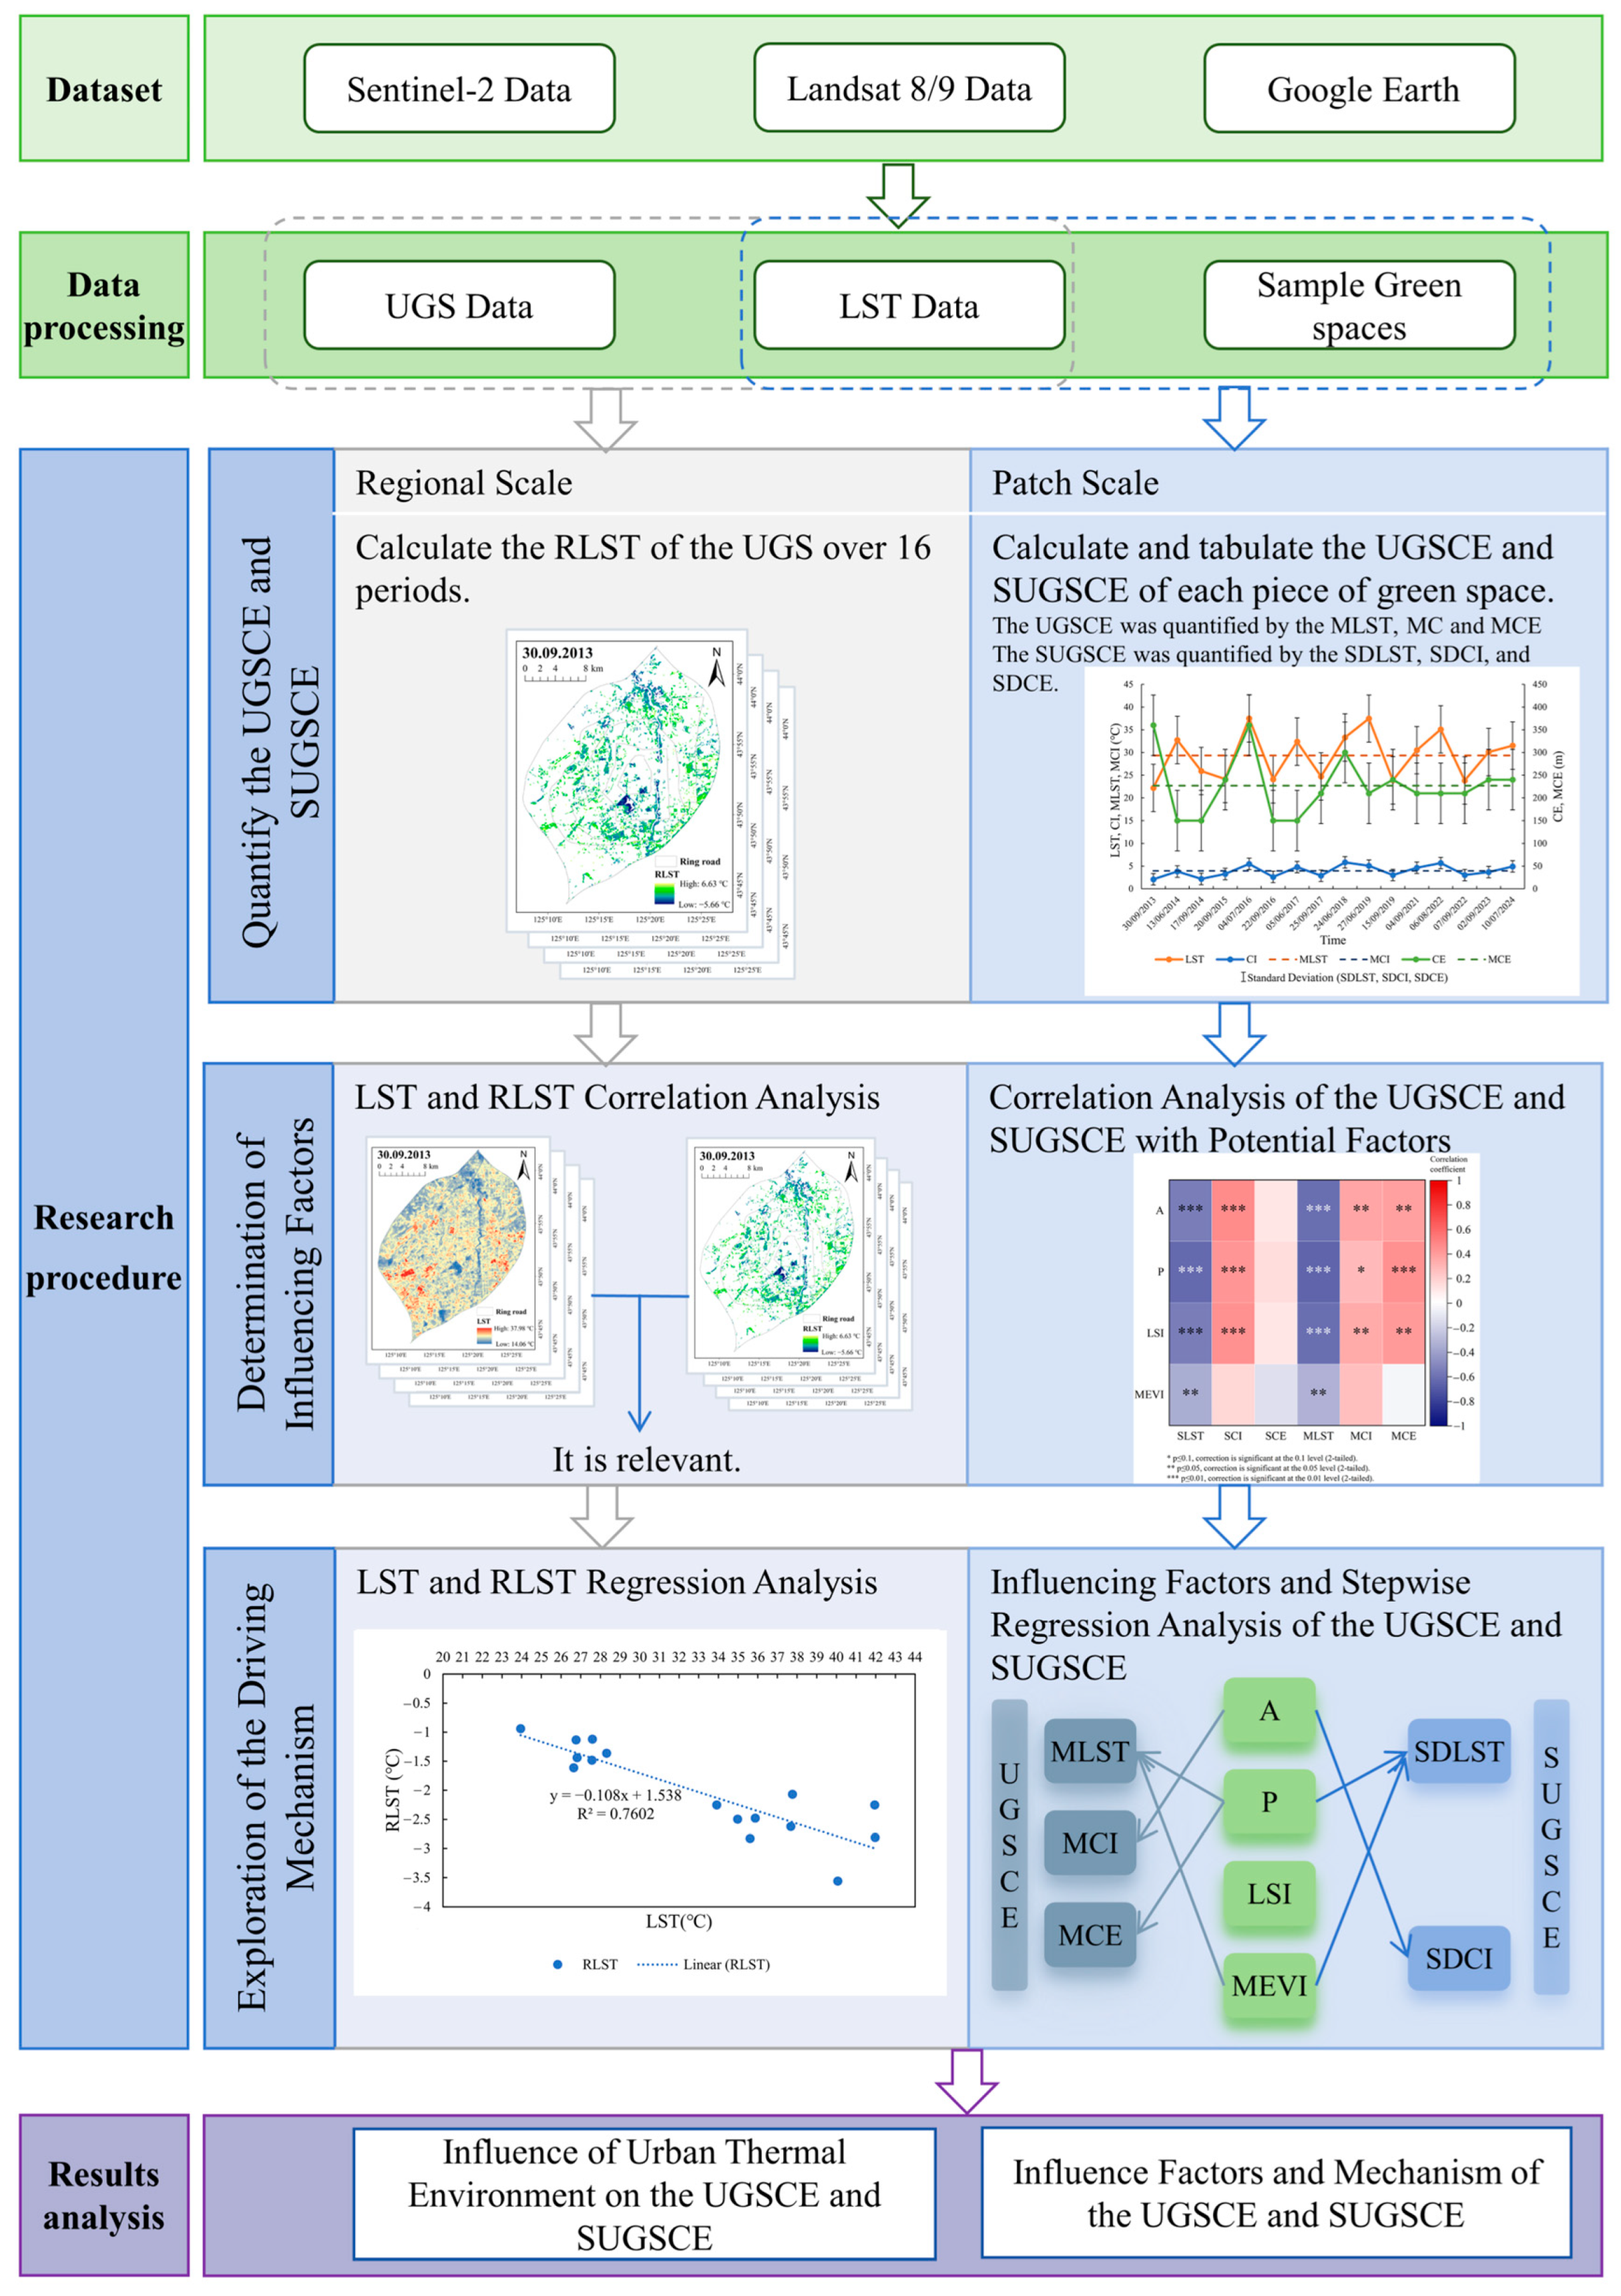
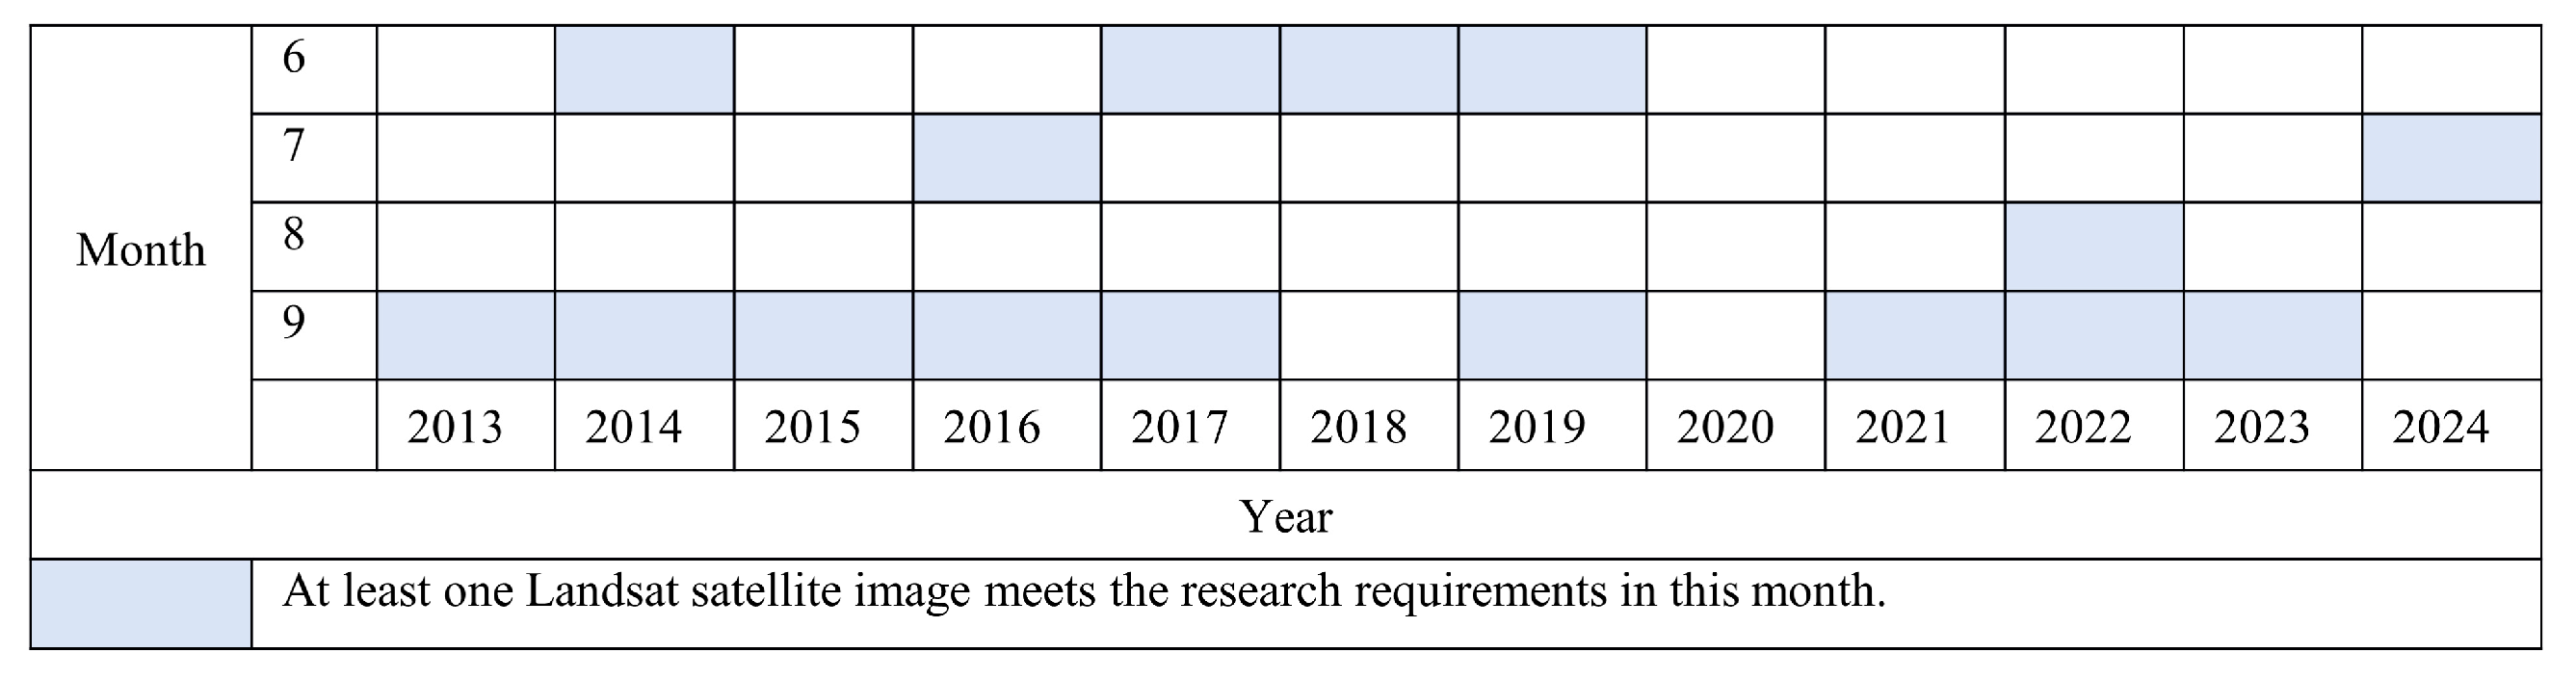
2.2. Research Framework and Data Sources

Figure 2 illustrates the research framework of our study, which includes four main steps: (1) Dataset: the data required for this study are selected; (2) Data Processing; (3) Research Procedure, including the quantification of the UGSCE and SUGSCE, identification of influencing factors, and exploration of the driving mechanisms; and (4) Results Analysis. The UGSCE was quantified using the mean LST (MLST), mean CI (MCI), and mean CE (MCE). The SUGSCE was quantified by the standard deviation of the LST (SDLST), standard deviation of the CI (SDCI), and standard deviation of the CE (SDCE).
The Landsat 8/9 Collection 2 Level 2 satellite imagery was sourced from the U.S. Geological Survey (USGS) website (https://earthexplorer.usgs.gov/, accessed on 3 April 2024). The remote sensing imagery had a path number of 118 and row numbers of 29 and 30. A total of 16 Landsat 8/9 OLI_TIRS satellite digital images were selected from June to September between 2013 and 2024 (Figure 3), when the cloud cover in the study area was less than 5%. This was utilized for the inversion of surface temperature and land use classification in the study area. Because there are some blank areas in Landsat 8/9′s surface temperature product (Collection 2 Level 2), and the use of interpolation to fill in the blank areas was found to be unsatisfactory, this study did not use these data directly in this study but instead utilized them for accuracy checks on inverse-performed surface temperatures. The Sentinel-2 L2A satellite imagery, sourced from the European Space Agency’s Copernicus Data Centre (https://browser.dataspace.copernicus.eu/, accessed on 20 September 2024), has a resolution of 10 m and was used to assist in land use classification to improve classification accuracy. The Google Earth imagery was sourced from the official Google Earth website (https://earth.google.com/web, accessed on 15 October 2024) and was used to select sample green spaces that met the criteria based on historical imagery. The sample green space boundaries were delineated in ArcGIS 10.8.
The urban green space distribution information (UGS data) is a supervised classification of Landsat 8/9 remote sensing images from 2013 to 2024 (Choose one image from each of these years, for a total of 10 images) according to four types of features: water bodies, green space, cultivated land, and construction land. The maximum likelihood method was used in the supervised classification using the ENVI5.3 remote sensing image processing software. Due to the difficulty in properly classifying cultivated land and green space, there are significant annual variations in the distribution of green space in the classification results, which can notably impact research outcomes. To address this, Sentinel-2 satellite imagery with a 10 m resolution and Google Earth historical imagery were used to compare and visually correct the land use classification results for each year from 2013 to 2024. As a result, the green space distribution data for Changchun City from 2013 to 2024 were extracted with a precision of 30 m.
Green space boundary information was obtained from Google Earth. The following types of green space were excluded from the selection: (1) those with an area of less than 1.00 ha (the minimum pixel size of the Landsat image is 30 × 30 m) [30], (2) the greenbelt located at the edge of the study area (part of its buffer zone is not inside the study area), and (3) green space with substantial alterations in parameters such as the perimeter and area and land use within the buffer zone during the 12-year period from 2013 to 2024 (changes in these factors will directly affect the cooling effect of green space, making it difficult to quantify its stability). Following the exclusion, 39 green spaces were selected for this study, as illustrated in Figure 1. Following a more thorough examination, 35 green spaces were selected for in-depth analysis, with the subsequent exclusion of those that did not align with this study’s criteria.

2.3. Research Methods

2.3.1. Inversion of Land Surface Temperature

In this study, a total of 16 remote sensing images from June to September from 2013 to 2024 were inverted for surface temperature via the atmospheric correction method [31] using ENVI 5.3 remote sensing image processing software. The inverse-performed LST was then compared with surface temperature data from NASA Landsat 8 and Landsat 9 (Collection 2 Level 2). The average difference between the two datasets, subtracted from the 16 surface temperature products, ranged from −0.59 to −0.09 °C. This range falls within the required accuracy for this study. The surface temperature (LST) of the inverse performance is detailed in Figure 4. Its mean value is in the range of 23.95 to 41.97 °C, with the minimum value occurring on 30 September 2013 and the maximum value occurring on 4 July 2016, with a mean value of 32.97 °C. As shown in Figure 5, the trend and volatility of the LST exhibit variability on a monthly basis, with an upward trend observed in June and September and volatility evident in July and August, though this latter trend is not fully captured due to the limited data available. However, a general upward trend in the LST is evident from 2013 to 2024.

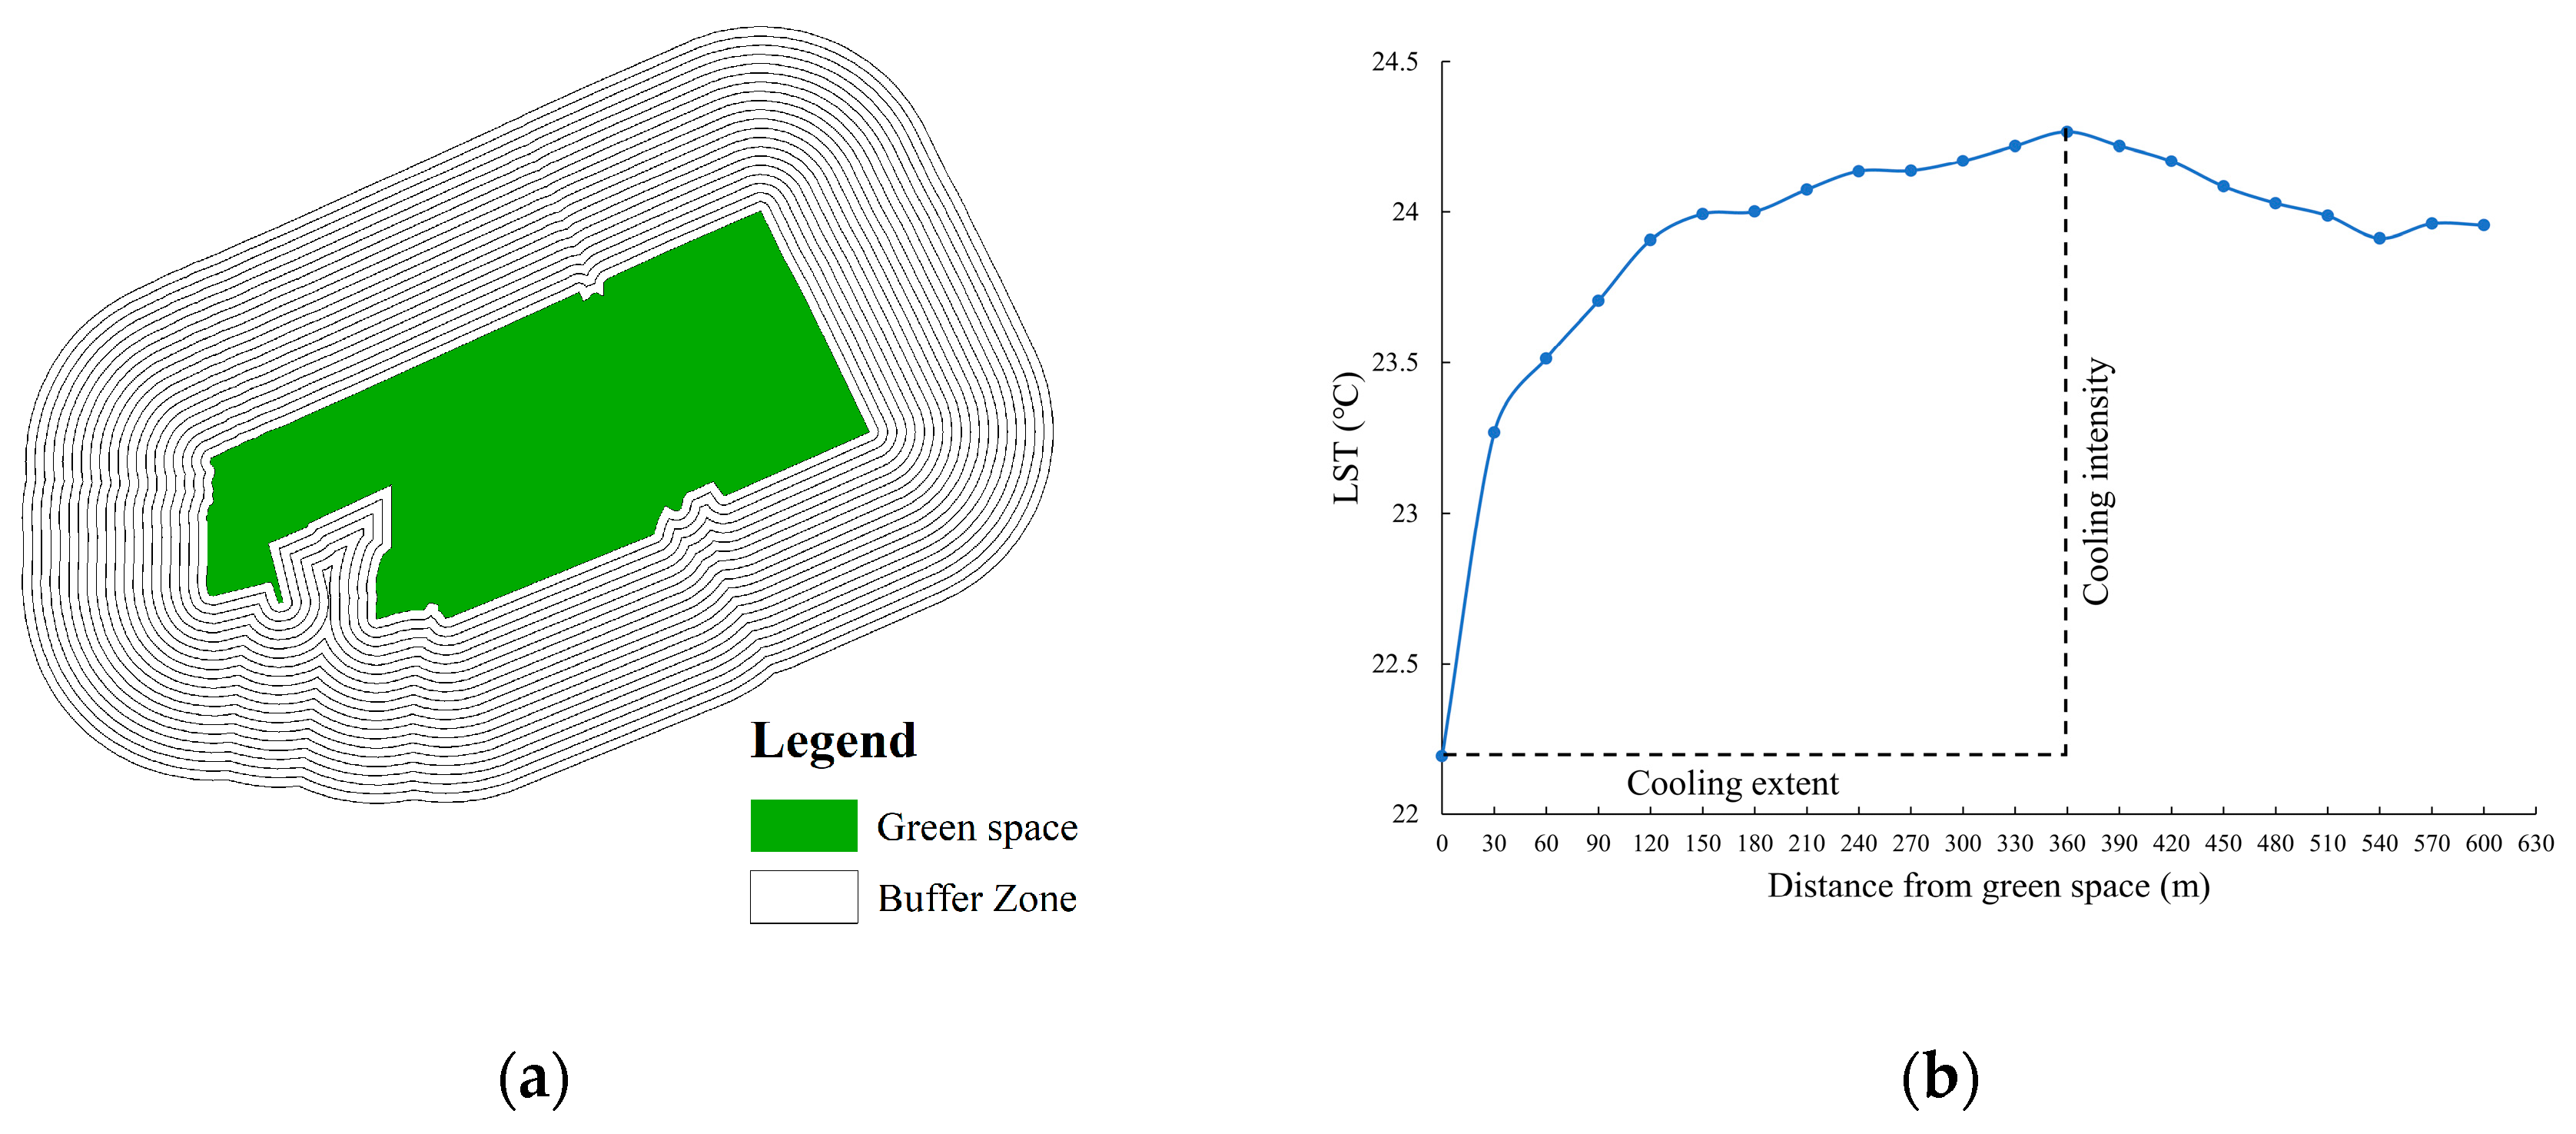
2.3.2. Quantification of the UGSCE and SUGSCE

(1)
Quantification of the UGSCE and SUGSCE on the regional scale
Given the variations in remote sensing images attributable to factors such as the imaging time, climate change, and other variables, we used the relative surface temperature (RLST) index to comparatively analyze the impact of green space on urban temperature over time [32,33,34]. The average RLST of green space was employed to represent the overall UGSCE, and the variance in the RLST of 16 groups of urban green space was used to describe the SUGSCE.
The relative surface temperature (RLST) of Changchun City from 2013 to 2024 was calculated using the ArcGIS 10.8 “raster calculator” function based on surface temperature inversion data. The RLST concept is a relative value concept used for the comparison of data from different years. Specifically, the RLST is calculated by subtracting the temperature of each quadrant from the mean temperature, thereby deriving the relative contribution of each quadrant to the aggregate temperature [32,33,34]. The following Equation (1) was employed to calculate the RLST:
RLST i = LST i LST i ¯
In Equation (1), RLSTi is the relative surface temperature (°C) in year i; LSTi is the surface temperature in year i; and LST i ¯ is the average surface temperature in year i in the study area.
(2)
Quantification of the UGSCE and SUGSCE on the patch scale
As demonstrated in prior studies, the surface temperature, cooling intensity (CI), and cooling extent (CE) of green space have been employed to characterize the cooling effect [26,35]. Distance is used as the horizontal axis, and the average surface temperature is used as the vertical axis to draw a graph of the temperature change with distance (green space 1 is used as an example; see Figure 6 for details). The average temperature refers to that inside the green space; the cooling distance (unit: m) indicates the maximum distance from the edge of the urban green space to the first inflection point of the temperature curve; and CI (unit: °C) is the difference between the temperature at the first inflection point of the temperature curve and the average temperature of the green space. Standard deviation is commonly used in research to describe the stability of a dataset [36,37]. In this study, the mean LST (MLST), mean CI (MCI), and mean CE (MCE) were used to describe the average cooling effect, and the standard deviation of the LST, CE, and CI (SDLST, SDCE, and SDCI) was used to describe the stability of the cooling effect of each green space for 16 periods, as shown in Table 1 (for green space No. 1, see Figure 7 for details).
Once the green space has been delineated, the boundary information of the green space can be mapped for only one phase, which will be used for the data analysis of sixteen phases. A high-definition Google image was downloaded, and 39 screened green space boundaries were mapped in ArcGIS 10.8 to obtain their distribution information. The findings reveal that the cooling range of urban green space typically extends from 20 to 500 m [38,39,40]. The multi-ring buffer function in the neighborhood analysis tool was used to create 20 buffer zones with an interval of 30 m on the periphery of each green space. Then, ArcGIS 10.8 was used to extract the average surface temperature values of the green areas and the buffer zones to obtain the data required for this study, and all the data were processed according to this method. Based on this, it was determined that green spaces with the 14th, 15th, 17th, and 25th serial numbers did not meet this study’s requirements. Only 35 green spaces exhibited a discernible cooling effect in the 16-period data, leading to the exclusion of the 14th, 15th, and 17th green spaces. This resulted in the final retention of 35 green spaces. The surface temperature, cooling intensity, and cooling range of the 35 sample green space patches were calculated for the 16 periods, along with the mean and standard deviation of these three indicators for each green space.

2.3.3. Potential Factor Analysis

The area, perimeter, and shape of a green space were used to quantify its geometry. The green space shape is the ratio of the perimeter of a green space to the perimeter of a circle of equal area, with a minimum value of 1 indicating a perfect circle [41]. The perimeter and area of 35 green spaces were extracted using ArcGIS 10.8, and the landscape shape index (LSI) of the green space was calculated to reflect the complexity of their shape. The 16-period mean enhanced vegetation index (MEVI) was employed as a metric for vegetation coverage. Initially, the EVI of the 16-period data was calculated using GEE. Subsequently, the EVI within the 35 green spaces in the 16 periods was enumerated using ArcGIS 10.8 partitioning. The mean value of the EVI (MEVI) of the 35 green spaces was calculated. The selection of these indicators was guided by several factors: (1) theoretical and practical guidance, (2) the ease of calculation, (3) the ease of interpretation, and (4) minimal redundancy [41,42,43]. Table 2 provides a summary of the selected potential factors included in this study.

2.3.4. Mathematical Statistical Analysis

In this study, we used the SPSSAU platform and Origin 2024 software to correlate the quantitative UGSCE and SUGSCE indexes with the potential influencing factors. We then established multiple regression equations to quantitatively study each correlation and obtained a model of the relationship between the UGSCE and SUGSCE and their influencing factors.
At the regional level, the average RLST of each green space (RLST) was used to represent the UGSCE, and the standard deviation of its 16-period data was calculated and used to analyze the SUGSCE. In order to explore how the temperature affects the UGSCE within the same city, a correlation analysis was performed between the RLST and the LST of each year, and then, regression analyses were performed to further explore the effect of the urban thermal environment on the UGSCE. The area (A), perimeter (P), landscape shape index (LSI), and 16-period mean EVI (MEVI) of the green space patches at the patch level are presented in Table 2. Their effects on the stability of green space cooling were explored through correlation analysis. A one-to-one correlation analysis was conducted between the potentially influential factors and the quantitative indicators of the SUGSCE to find the factors with the highest and lowest influence on cooling stability. With the quantitative index of the SUGSCE as the dependent variable and the influencing factors as the independent variables, a cooling model of urban green space in Changchun City was established through stepwise multiple regression analysis. The difference between stepwise regression and regression analysis is that the stepwise regression model will automatically identify the significant independent variables (X), and the non-significant X will be automatically moved out of the model. Common stepwise regression methods are the forward, backward, and stepwise methods, with the stepwise method being a merger of the forward and backward methods [46]. The stepwise method combines the advantages of forward stepwise regression and backward stepwise regression and can screen variables more flexibly and improve the accuracy and stability of the model.

3. Results

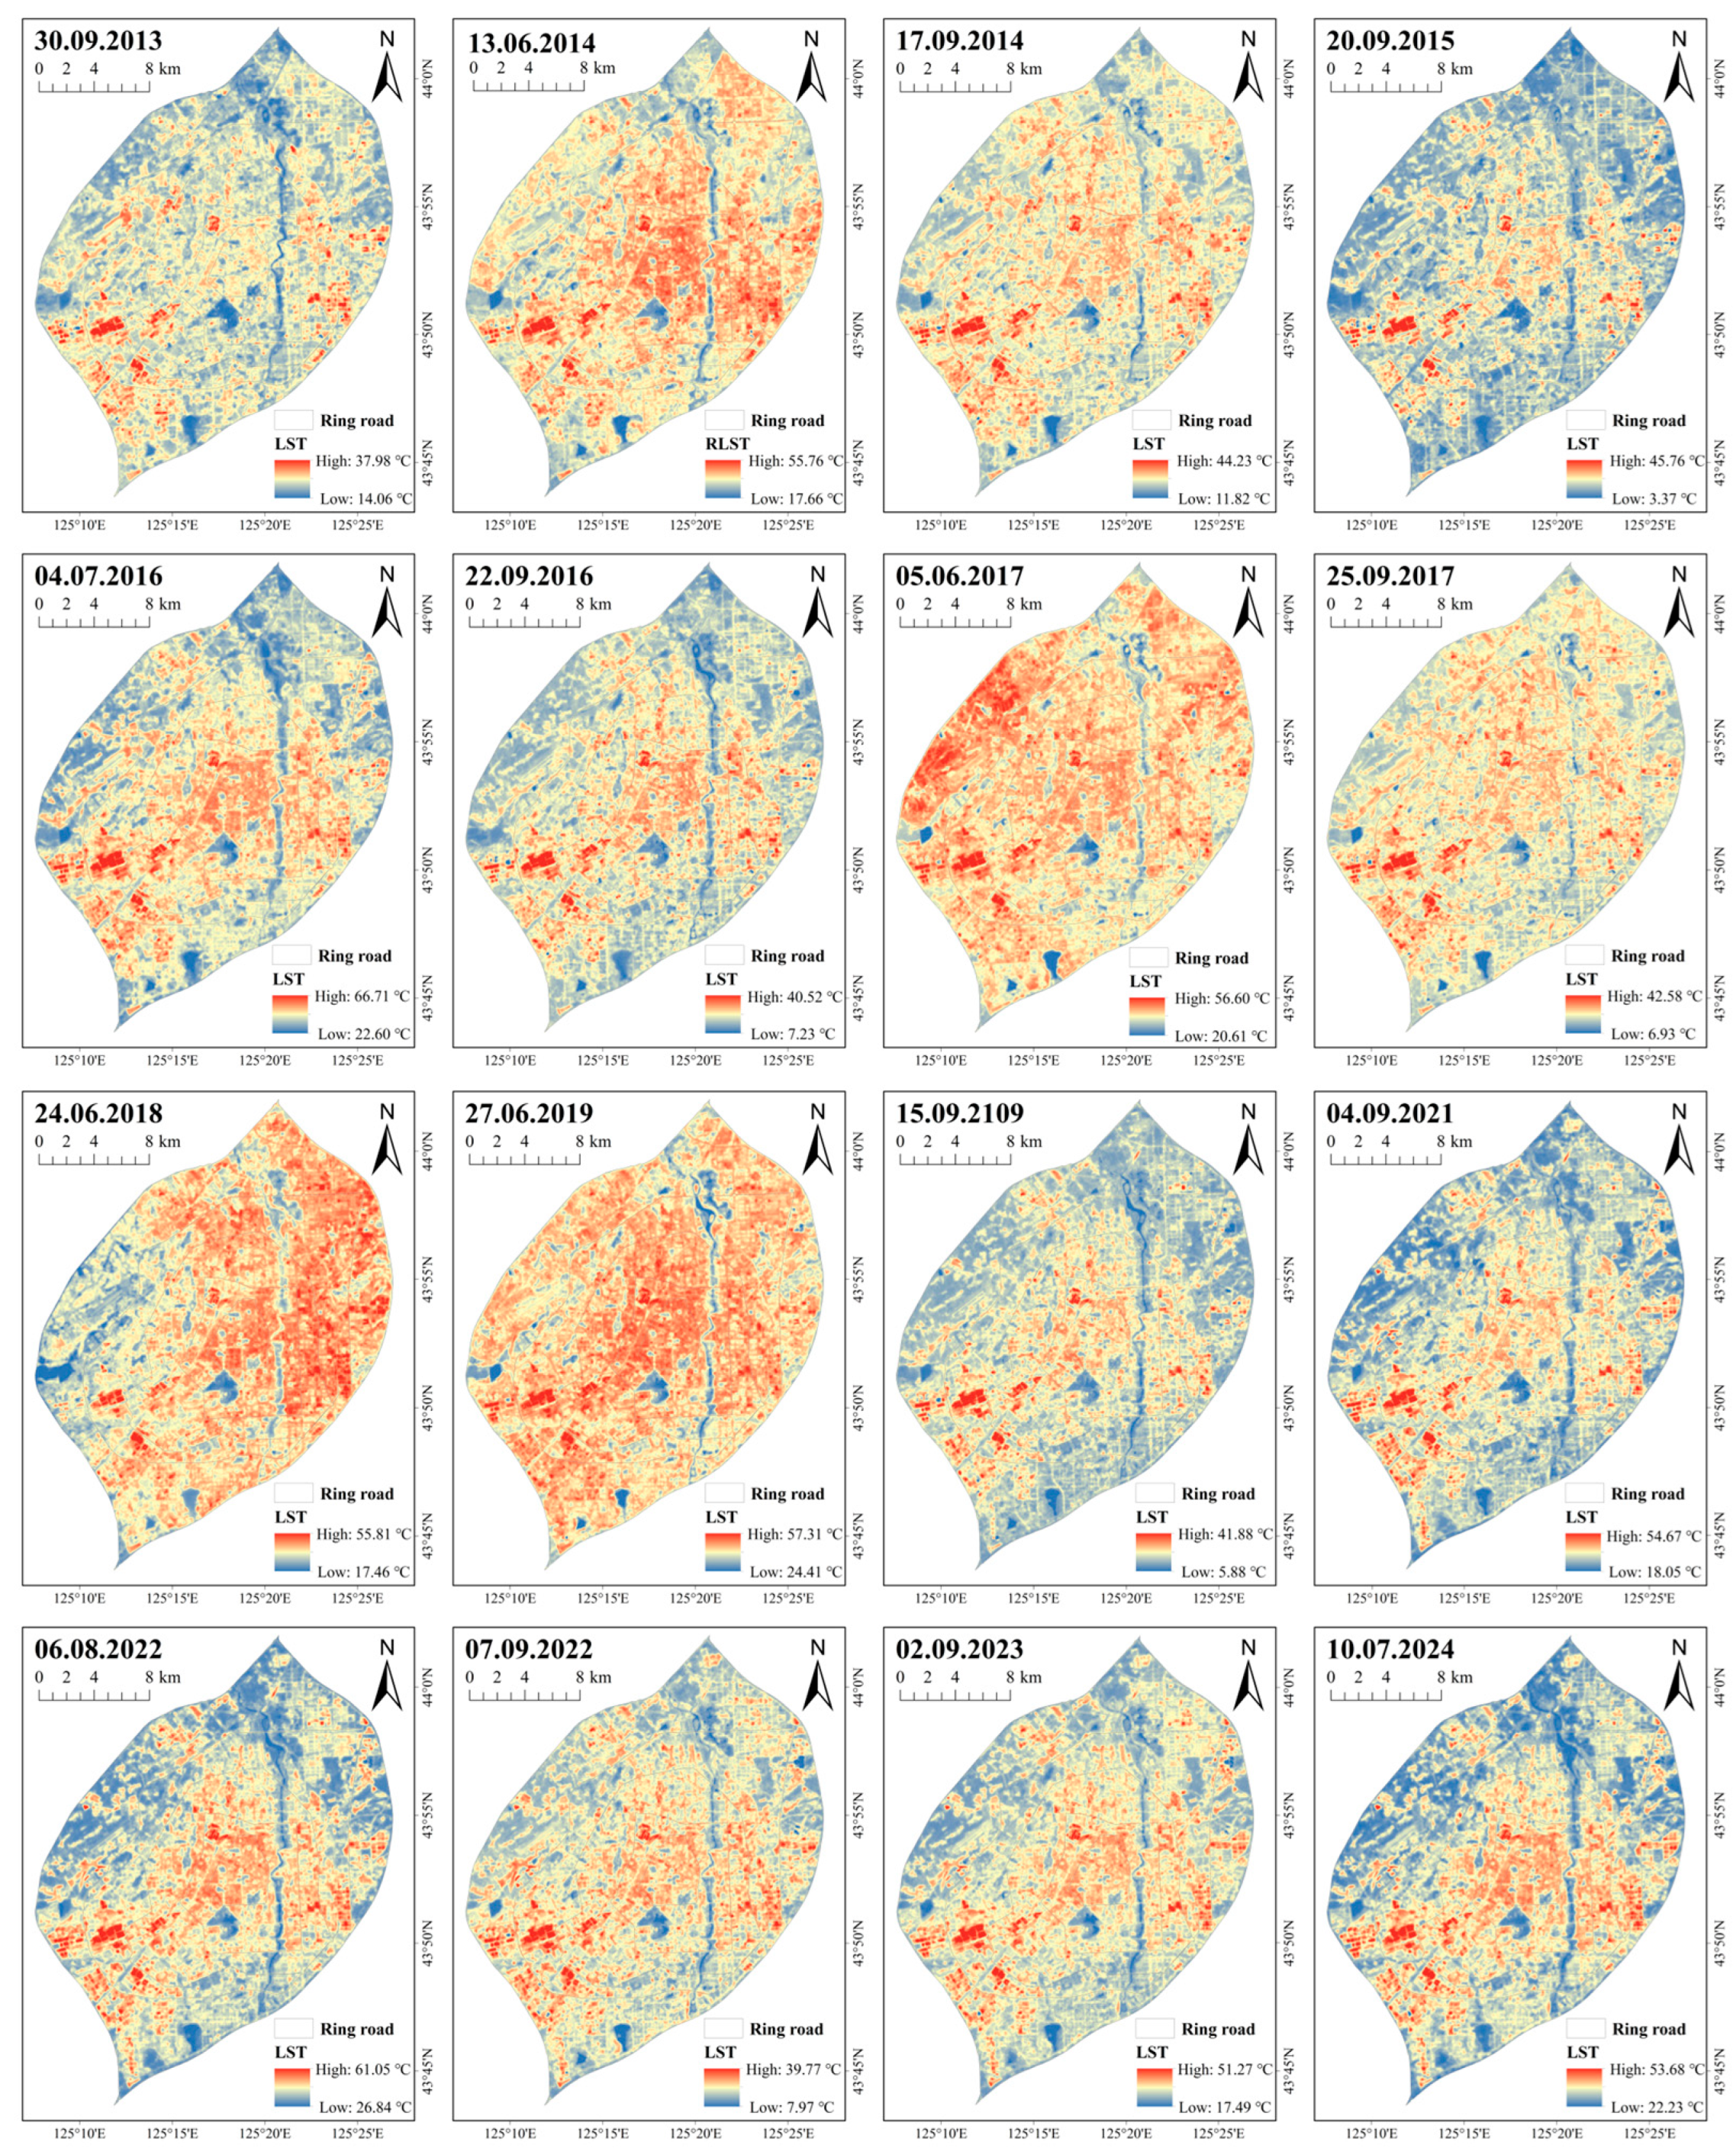
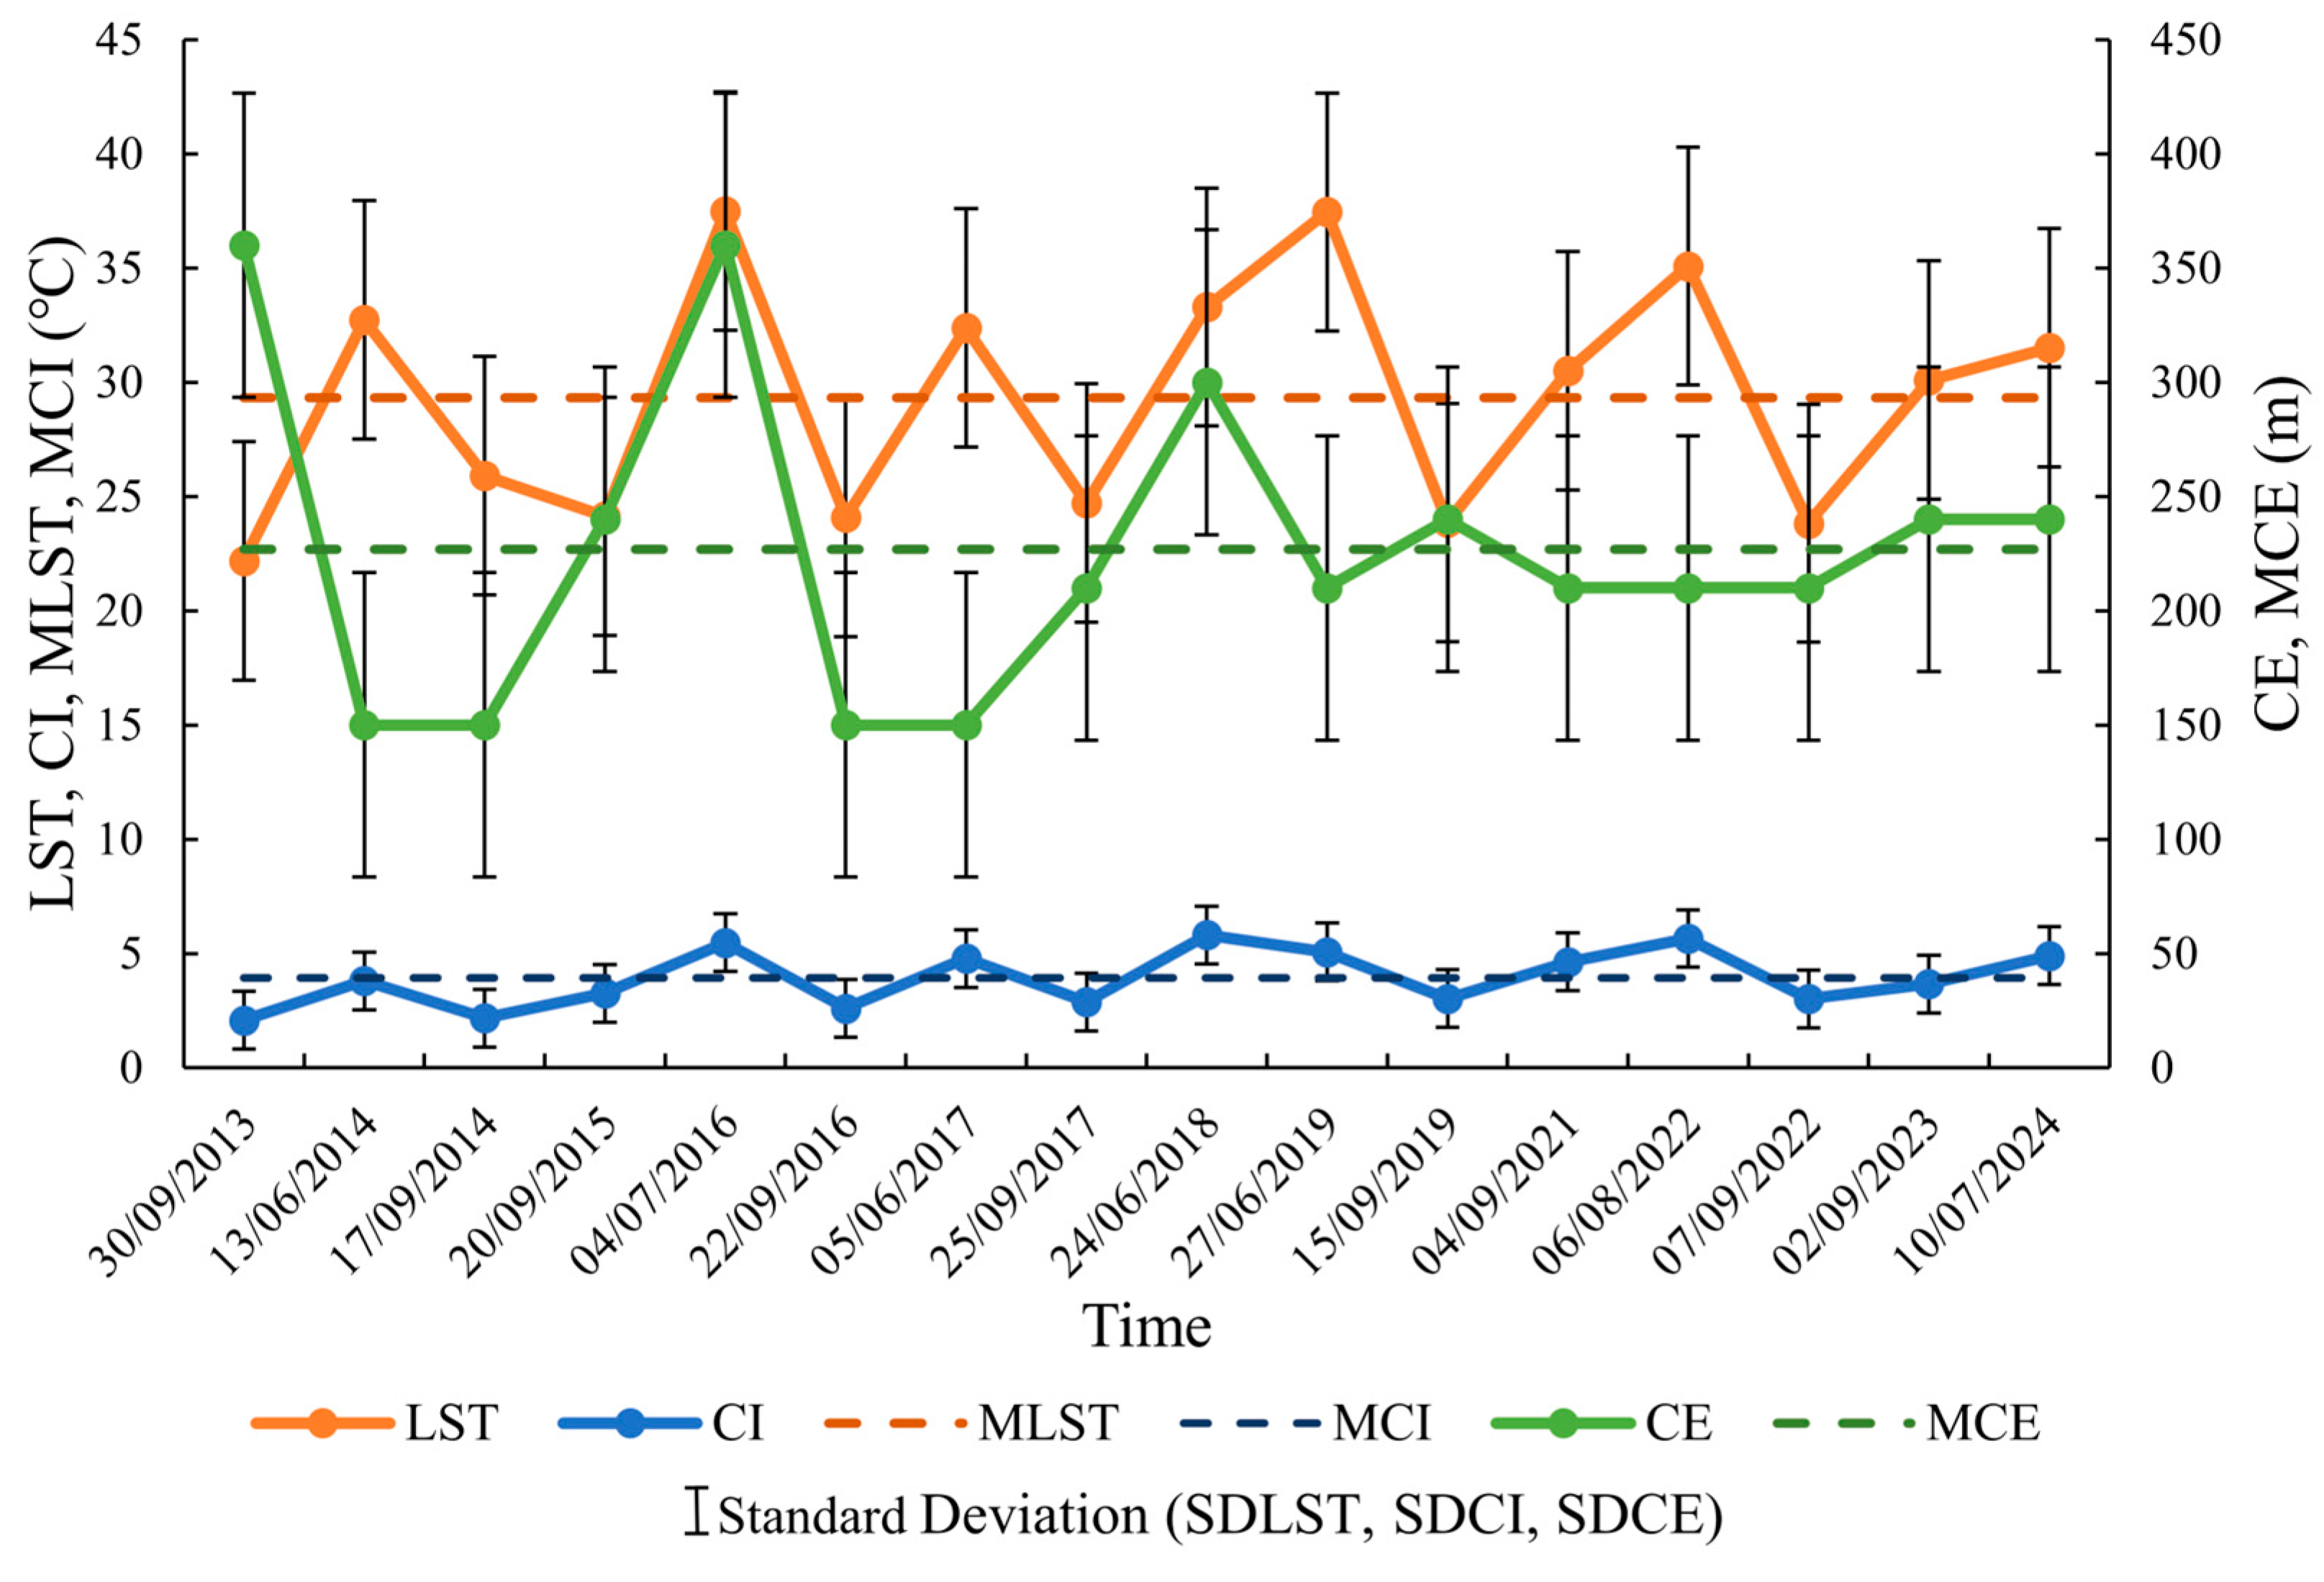
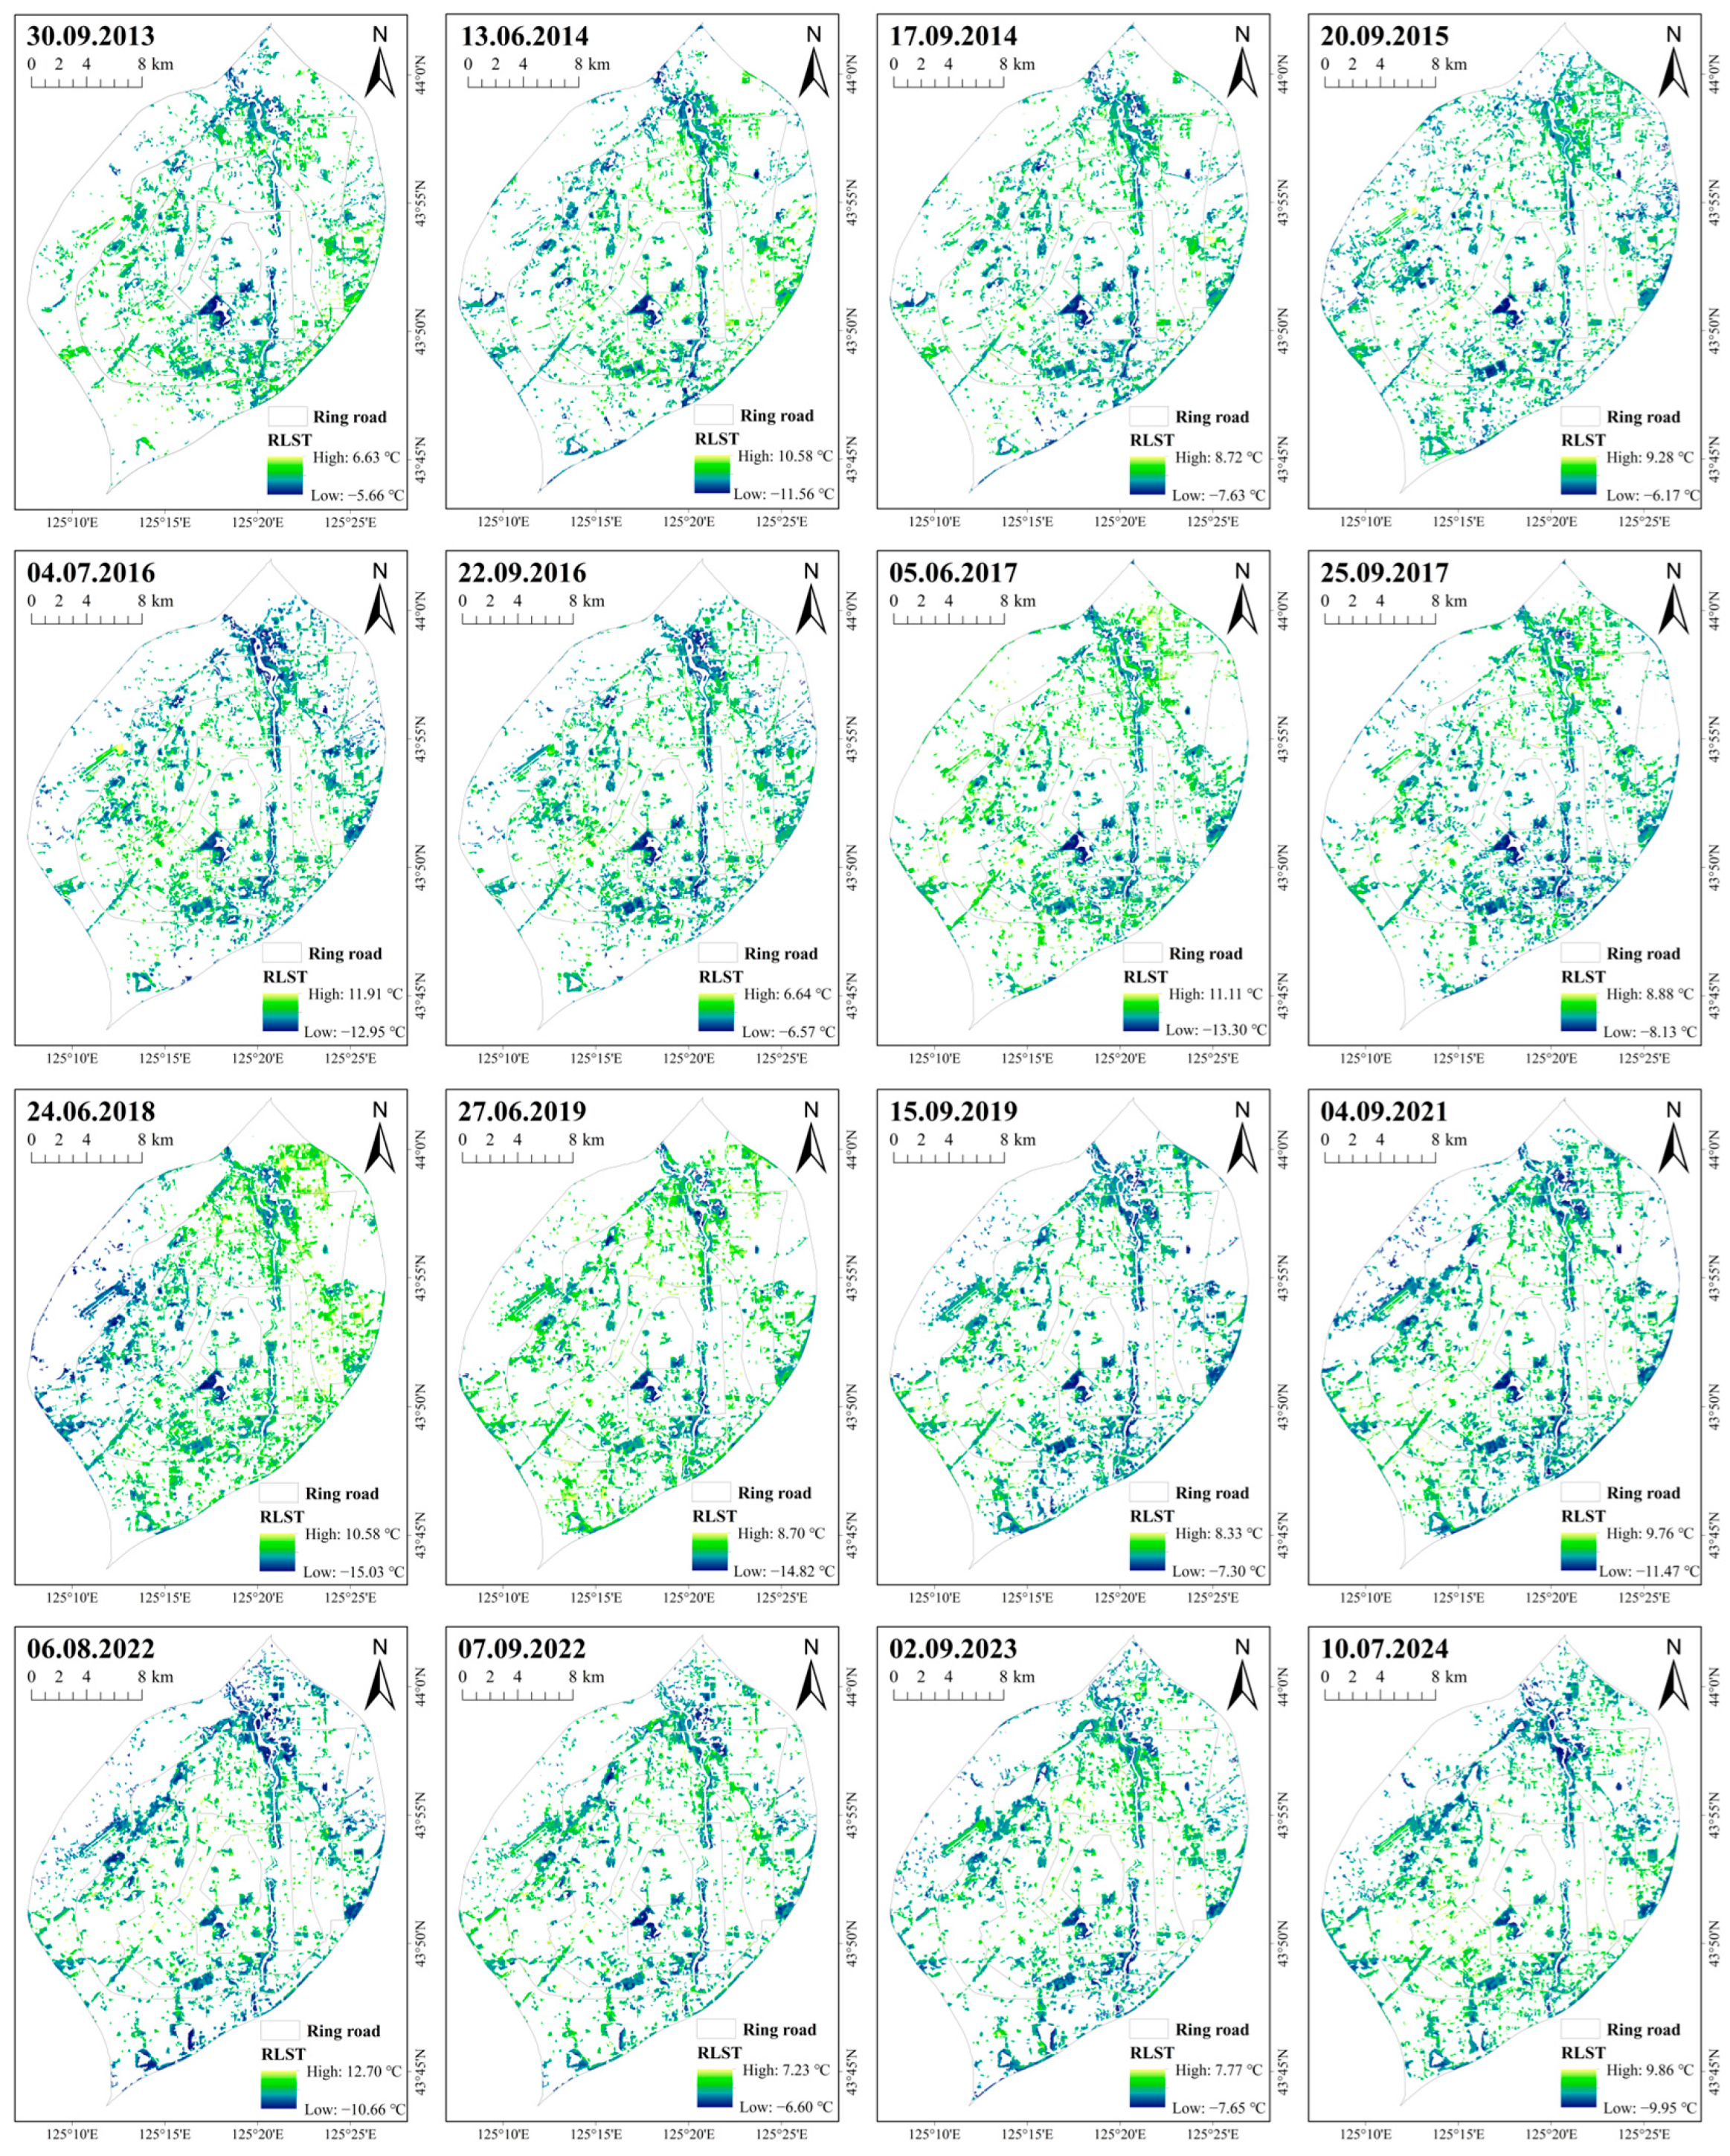
3.1. Quantification of the UGSCE and SUGSCE on the Regional Scale

The RLSTs of the green spaces using images taken over 16 periods are shown in Figure 8. The results of the statistical analysis show that the mean value of the RLST of the green space over the 16 images is −2.03 °C (where the mean RLST for each phase of the image is less than 0), with the minimum value of −3.56 °C occurring on 6 August 2022 and the maximum value of −0.94 °C occurring on 30 September 2013. The average RLSTs of the 16-period images are all less than 0, which indicates that urban green spaces in Changchun have a significant and stable cooling effect on the surrounding environment, which is consistent with previous studies [29]. The standard deviation is 0.75 °C; it is evident that the standard deviation exceeds 20% of the absolute value of the mean, indicating a substantial degree of volatility in the UGSCE across these 16 periods. This variability may be attributed to the collection of data from distinct months within the period from June to August. The results of the correlation analysis between the RLST and LST for the same period are shown in Table 3. More specifically, the analysis reveals a correlation coefficient of 0.872, which is statistically significant at the 0.01 level, thereby indicating a substantial positive correlation between the RLST and LST. In the linear regression analysis with the LST as the independent variable and the RLST as the dependent variable (Figure 9), the model passes the F-test (F = 44.475, p = 0.000 < 0.05); its equation is RLST = −0.108 × LST + 1.538, and its R2 value is 0.76, implying that the LST explains 76% of the reasons for the changes in the RLST. The regression coefficient of the LST value is −0.108 (t = −6.662, p = 0.000 < 0.01), implying that the LST will have a significant negative impact on the RLST. In summary, it can be seen that in June to September in Changchun City, when the LST is between 23.95 and 41.97 °C, the higher the LST, the lower the RLST value, the stronger the influence of the green space on the surrounding thermal environment, and the stronger the cooling effect of the green space.

3.2. Quantification of the UGSCE and SUGSCE on the Patch Scale

The descriptive statistics of all variables are displayed in Table 4 and Table 5. The 16-period mean Compound Annual Growth Rates of the overall mean LST, CI, and CE of the 35 green spaces are greater than 0, indicating that the cooling effect of the 35 green spaces has a small upward trend from 2013 to 2024, which is consistent with the results of this study on the regional scale. The 16-period mean values of the overall mean LST, CI, and CE are 30.57 °C, 4.18 °C, and 173.59 m, with standard deviations of 5.44 °C, 1.25 °C, and 15.42 m, respectively. The standard deviation of the average CI of the 35 green spaces accounted for the largest proportion of the mean value (greater than 20%), and the standard deviation of the average CE of the 35 green spaces accounted for the smallest proportion of the mean value. This indicates that the overall average CI fluctuates greatly, while the overall average CE is relatively stable.
The average MLST of the 35 green spaces from 2013 to 2024 is 30.57 °C, the average MCI is 4.18 °C, and the average MCE is 173.95 m. The stability and the cooling effect of the 35 green spaces vary; the standard deviation of the MLST accounts the most for the smallest proportion of the mean value, and the mean value of the SDLST is the smallest. The differences in the MLST among the 35 green spaces are not significant. The LSTs of the green spaces are less variable. The mean value of the SDCE is the largest, and the standard deviation of the SDCE and MCE accounts for the largest proportion of the mean value (both greater than 30%), which shows that the cooling range and stability of the 35 green spaces vary greatly. The maximum MLST occurs in green space No. 31, and the minimum value occurs in green space No. 16; the maximum values of the MCI and SDCI both occur in green space No. 16, and the minimum values occur in green space No. 23; the SDLST shows the same results. However, the SDLST was highest in green space No. 16 and lowest in green space No. 23. The SDCE was highest in green space No. 21 and lowest in green space No. 22. The MCE was highest in green space No. 32 and lowest in green space No. 39.

3.3. Identifying the Factors Influencing UGSCE and SUGSCE

Table 5 shows that the area (A), perimeter (P), shape index (LSI), and mean enhanced vegetation index (MEVI) of the 35 green space patches were 38.90 ha, 2.64 km, 17.2, and 0.35, respectively. The A varied between 3.06 and approximately 330.40 ha; the P varied between 0.79 and 8.55; the LSI varied between 1.23 and 137.69; and a few green spaces had low LSI values close to 1 and a shape close to a standard circle.
The correlation of the UGSCE and SUGSCE with potential factors can be seen in Figure 10. Among the four independent variables (A, P, LSI, MEVI), negative correlations with the MLST and SDLST were observed. In contrast, positive correlations with the MCI, MCE, and SDCI were identified for the A, P, and LSI, respectively. In contrast, there was no correlation between the SDCE and the A, P, LSI, and MEVI, totaling four potential factors.
To study the driving mechanisms of the UGSCE, four factors, the A, P, LSI, and MEVI, were used as independent variables, and the MLST, MCI, and MCE were used as dependent variables in a stepwise multiple regression analysis. The results are shown in Table 6. It can be summarized that the P and MEVI are the main factors influencing the MLST, and both of them have a significant negative influence on the MLST; the A is the main factor influencing the MCI, and the A has a significant positive influence on the MCI; the P is the main factor influencing the MCE, and the P has a significant positive influence on the MCE.
To study the driving mechanisms of the SUGSCE, four factors, the A, P, LSI, and MEVI, were used as independent variables, and the SDLST and SDCI were used as dependent variables in a stepwise multiple regression. The results are shown in Table 7. When the SDLST was used as the dependent variable for stepwise regression analysis, a total of two influencing factors (P and MEVI) remained in the model, with an R2 of 0.540, which means that the P and MEVI can explain 54.0% of the changes in the SDLST. When the SDCI was used as the dependent variable in the stepwise regression analysis, the A was the only influencing factor left in the model, and the R2 was 0.217, which means that the A can explain 21.7% of the change in the SDCI; the model formula is SDCI = 1.237 + 0.003×A. To summarize, the P and MEVI have the greatest influence on the SDLST, and they have significant negative effects on the SDLST. Additionally, the A is the main factor influencing the SDCI and has a significant positive influence.

4. Discussion

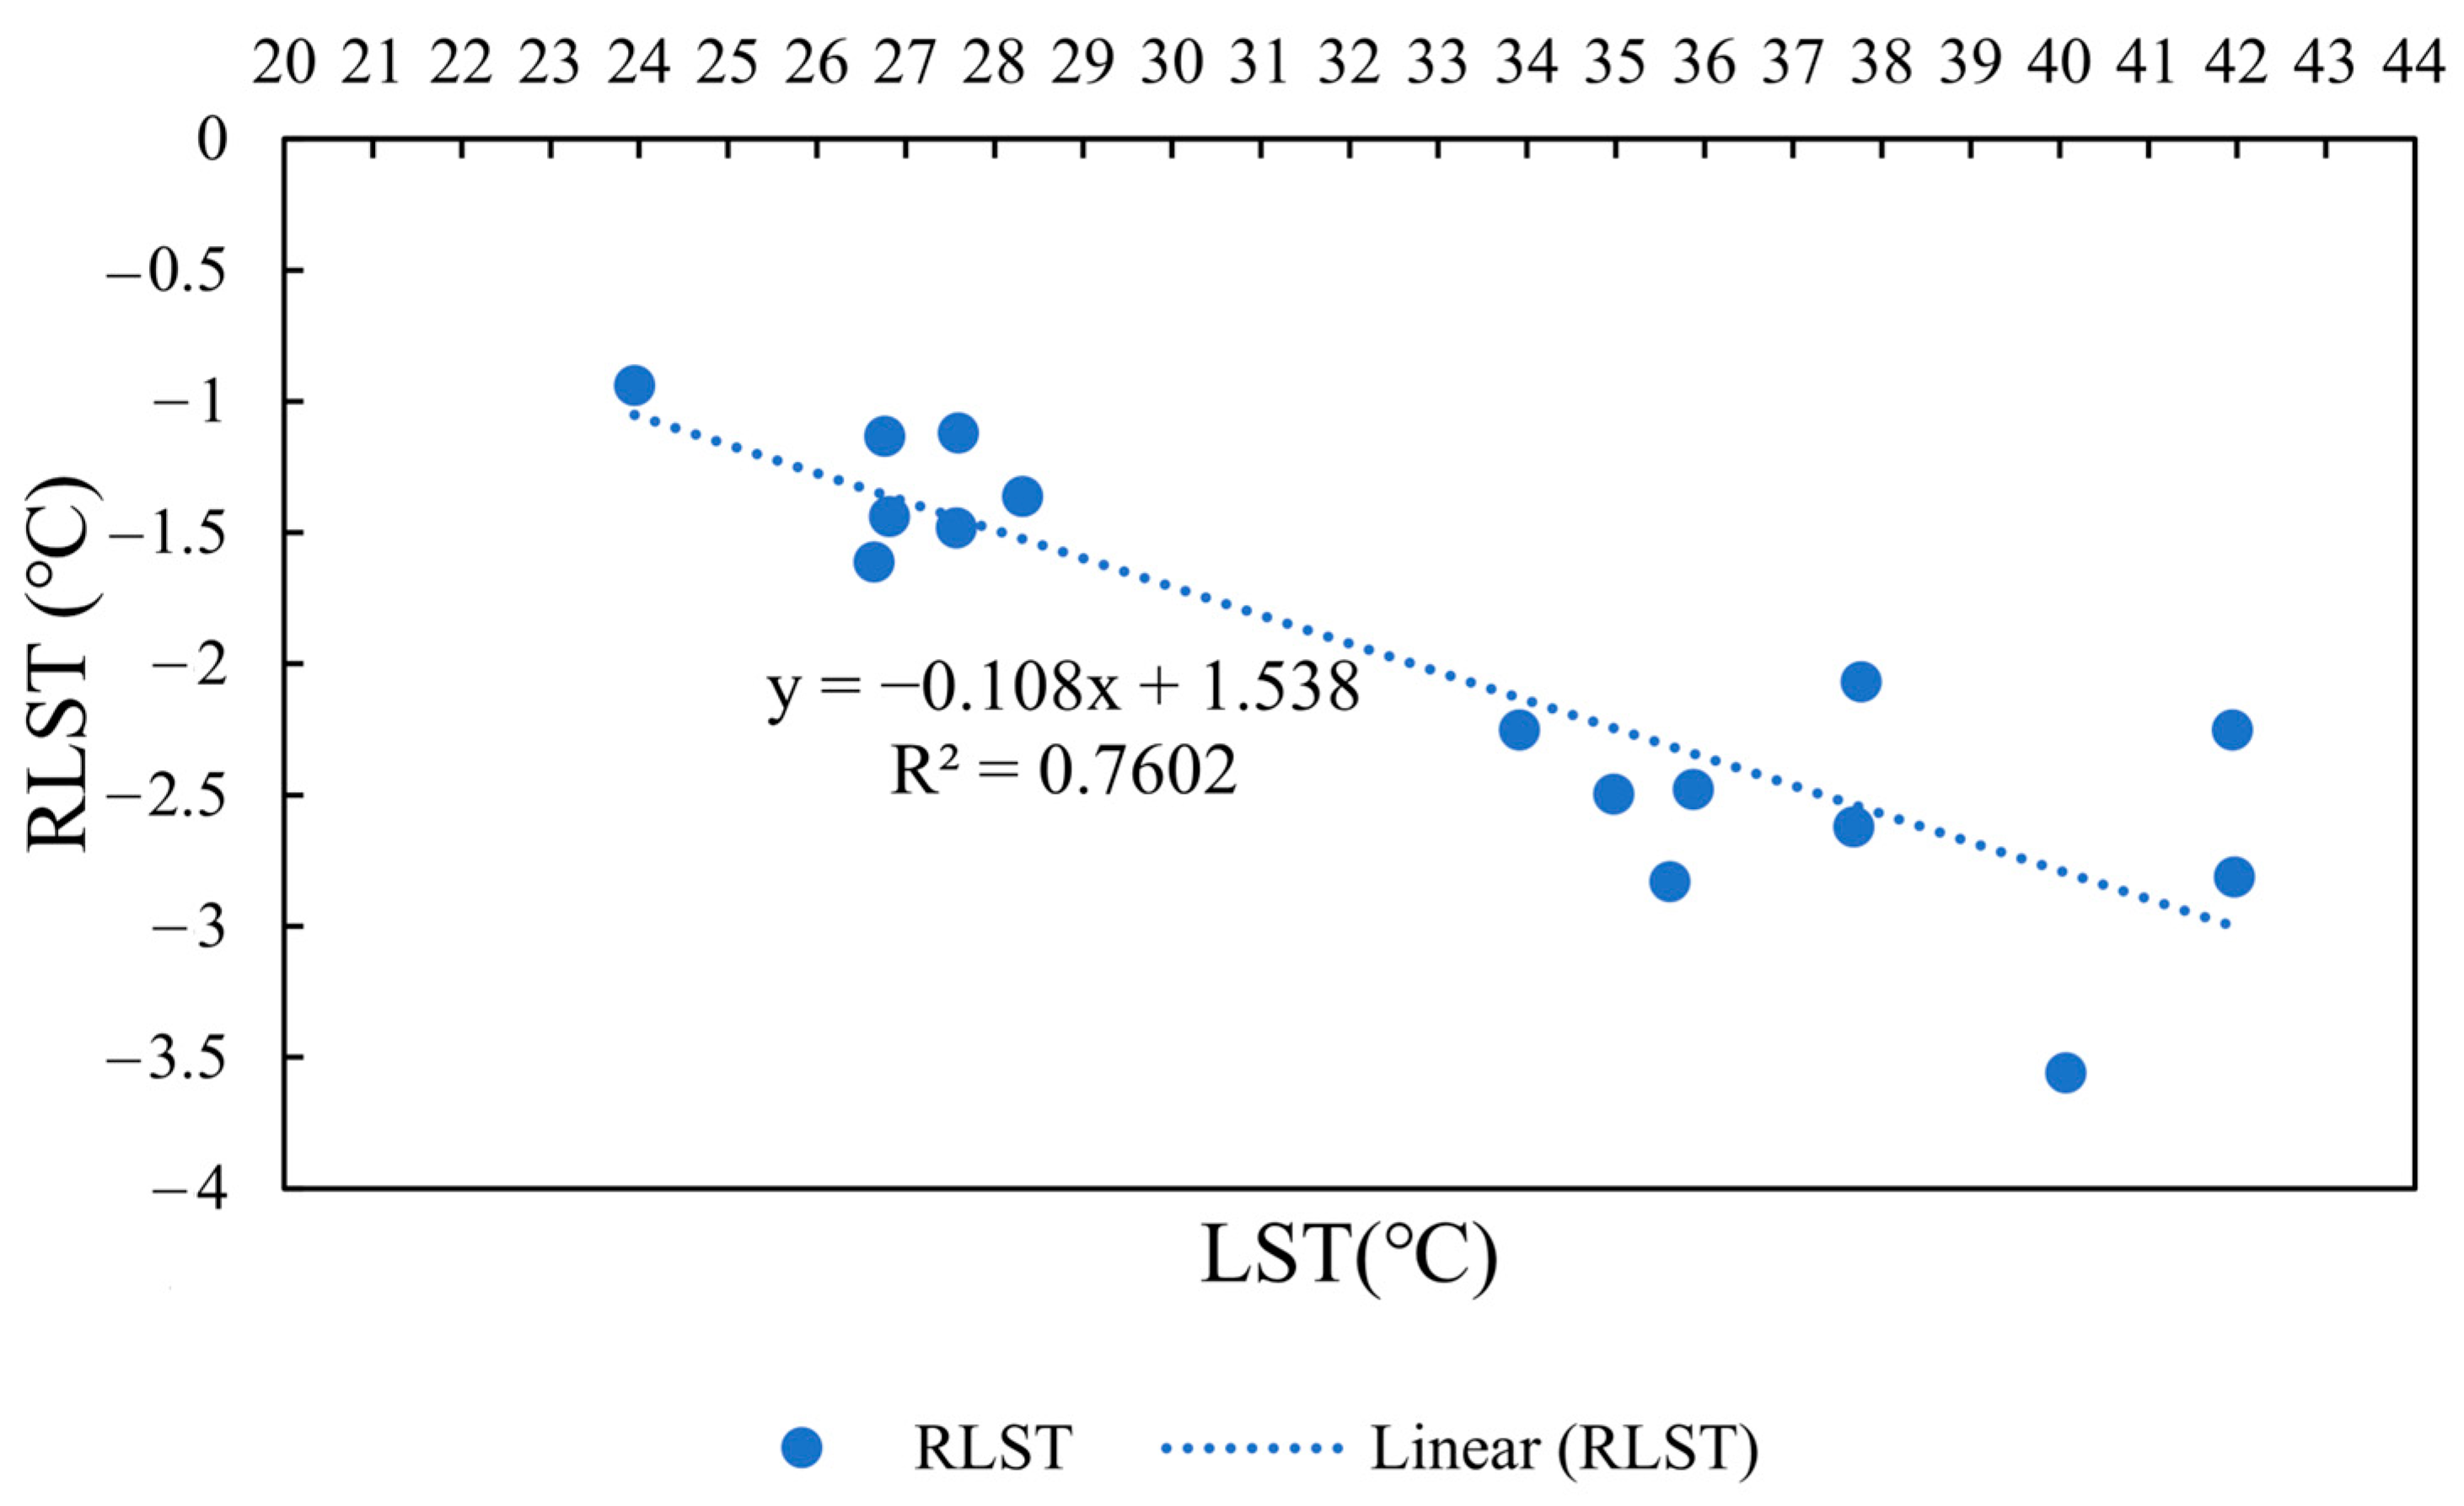
4.1. Stability of UGSCE Under Different Temperature Conditions

4.1.1. Regional Scale

The LST values were recorded within the range of 23.95 °C to 41.97 °C, and a modest upward trend in the LST was observed from 2013 to 2024. The range of the RLST is −3.56~−0.94 °C, and all values are less than 0. From 2013 to 2024, green space exhibited a pronounced cooling effect on the surrounding environment, with a concurrent decline in the RLST, albeit with greater volatility. The LST values range from 23.95 to 41.97 °C, indicating that a higher LST corresponds to a lower RLST, signifying a stronger cooling effect from green space. Plants in urban green spaces absorb heat through transpiration and photosynthesis to realize cooling, and soil and vegetation have a large specific heat capacity, warming slowly and storing heat to slow down the rise in ambient temperature. When in a high-temperature state, the temperature difference between the green space and the surrounding high-temperature area will further increase, which not only enhances the cooling effect of the green space but will also prompt air flow and the formation of local circulation, thus expanding the scope and effect of cooling. However, under extreme conditions, such as excessively high temperatures and persistent drought, the physiological activities of plants are affected, transpiration is weakened, and the cooling effect may be reduced. Therefore, on the regional scale, the cooling effect of urban green space is stronger when the temperature is higher within a certain range and can maintain a degree of stability in different thermal environments under global warming.

4.1.2. Patch Scale

The mean 16-period compound annual growth rates of the overall mean LST, CI, and CE of 35 green spaces had a value greater than 0. The overall mean LST and LST of green space showed a small upward trend from 2013 to 2024, along with a small upward trend in the UGSCE. Tan et al. found that the average cooling intensity of 647 parks in China had a small downward trend from 2000 to 2021, with 42.3% of suburban parks experiencing a decrease in cooling intensity and 39.5% experiencing an increase [9]. This may be related to changes in the environment surrounding some of the suburban parks; for example, an increase in the density of buildings or the building plot ratio of the surrounding environment may also reduce the cooling intensity of the parks [47]. In this study, green spaces with large changes in the surrounding environment were excluded from the sample selection, which resulted in an increase in the average cooling intensity from 2.29 °C in 2013 to 4.86 °C in 2024. The compound growth rate of the 16-period data was 0.06, showing a small upward trend overall. Analyzing the standard deviation of the data revealed that the mean CI fluctuated more, while the mean CE fluctuated less and was more stable at different temperatures relative to the CI and the LST of the patch.

4.2. Influencing Factors of UGSCE

The results of correlation analysis showed that the MEVI had a significant negative correlation with the MLST. The A, P, and LSI had a significant correlation with the MLST, MCI, and MCE; as the A, P, and LSI increased, the MLST decreased, and both the MCI and MCE increased. Plants reduce temperature through evapotranspiration and shading, and a larger area or higher vegetation density usually means more plants and more evapotranspiration and shading [35,41], which promotes stronger air convection to enhance the cooling effect. Thus, the higher the MEVI, the stronger the UGSCE. However, the area and the cooling effect are not simply linearly related, and the cooling effect levels off after the area reaches a certain level [35]. The green space perimeter mainly enhances the cooling effect by increasing the heat exchange area, promoting air microcirculation, strengthening the edge effect of vegetation, and enhancing landscape heterogeneity. The higher the LSI, the more complex edges of the urban green space patches, and a complex urban boundary is conducive to heat exchange between an urban green space and the surrounding environment. Furthermore, Du et al. showed that the LSI increases the cooling intensity of a green space [48]. In contrast, Yan et al.’s study on 316 urban green spaces in Beijing showed that the LSI elevates the LST and decreases the CI of green spaces, and different ranges of LSI values may lead to different conclusions [35]. A stepwise multiple regression analysis showed that the P and MEVI had the greatest influence on the MLST, the A had the greatest influence on the MCI, and the P had the greatest influence on the MCE.

4.3. Influencing Factors of SUGSCE

Correlation analysis indicated a notable negative correlation between the MEVI and SDLST. This implies that the SUGSCE is more robust under high-vegetation-density conditions. Additionally, the A, P, and LSI were found to have significant correlations with both the SDLST and SDCI. The SDLST decreased with increasing A, P, and LSI within a certain range. A large green space provides a more stable internal environment and reduces the interference of external factors on the internal temperature of the green space. When the P is larger, it can promote the uniform diffusion of heat, and the green space has a large contact area with the surrounding environment. The increase in the LSI means that the shape of the green space is more complex and the boundary zigzags more, which makes the different temperature regions of the green space intertwine with each other and influence each other and overall reduces the influence of the external environment on the LST and decreases the SDLST. However, the influence on the SDCI is different, and with an increase in the A, its contact area with the surrounding environment is larger and the temperature difference may be greater, resulting in changes in the gradient and range of heat exchange. The difference in heat exchange between different locations of the green space and the surrounding environment is more pronounced at different times, thus increasing the SDCI. When the P is longer, the range of influence on the surrounding environment is different, and this difference in the CI with the change in distance is cumulative at different times, causing an increase in the SDCI. The increase in the LSI increases the interface of the green space in contact with the surrounding environment, and the difference in heat exchange with the outside world is more pronounced at different locations, which may lead to an increase in the SDCI. The results also show that the A, P, LSI, and MEVI do not significantly affect the SDCE. Based on the results of this study, it is hypothesized that the SDCE may be related to land use changes around green space; however, land use change was considered as a control variable in this study, so it was not possible to explore its effect on the SDCE.
The results of the stepwise multiple regression analysis indicated that the P and MEVI had the greatest influence on the SDLST, and both could explain 54.0% of the variation in the SDLST; the A had the greatest influence on the SDCI and could explain 21.7% of the variation in the SDCI.

4.4. Planning Inspiration and Research Limitations

To improve the stability of the UGSCE while maintaining it, the following measures can be taken: (1) Increase the amount of vegetation in green spaces to improve vegetation density. Green spaces with a high vegetation density have more stable ecosystems of their own, and the cooling effect is more elastic and less disturbed by temperature changes, so increasing the vegetation density not only enhances the cooling effect but also improves the stability. (2) Existing green space areas should be maintained, and the spatial range should be extended. Research results show that the increase in green space in parks can not only enhance their cooling effect on the surrounding environment but also gradually increase the stability of this cooling. Therefore, urban planning should avoid excessive reductions in green space areas, so as to maintain a certain scale. At the same time, it is essential to pay attention to the spatial extensibility of green spaces and increase their circumference to benefit the stability of the cooling effect. At the urban planning stage, the scientific and rational layout of various types of land should be considered so that green space and urban construction land can be combined organically. For example, in the planning of new residential districts, a certain proportion of green land is reserved to create green landscapes within the district. It is also possible to make full use of the roofs and walls of buildings and other spaces for greening to increase the green area of the city without taking up additional land resources. For example, building sky gardens on the roofs of some large shopping malls not only beautifies the environment but also increases green space. At the same time, it is important to focus on the spatial extensibility of park green space and increase its circumference to benefit the cooling effect and its stability. (3) Planners should pay attention to the landscape patterns of green spaces and design them with reasonable shapes. There is a significant relationship between the complexity of green space boundaries (LSI) and the indicators of the UGSCE and SUGSCE. However, since other studies have shown that the effect of the LSI on the cooling effect varies depending on the range of values, and that a high LSI may have a negative effect on the SDCI (the larger the SDCI, the smaller the stability of the UGSCE), it is necessary to adjust the LSI according to the actual landscape pattern of the green space, for example, by avoiding overly complex patch designs that lead to instability in the cooling effect. It can be ensured that the cooling effect is not reduced while promoting heat exchange by moderately optimizing the shape of green space edges, amongst other measures, in order to maintain better cooling stability. (4) The blue–green spatial synergy between green spaces and water bodies should be emphasized. By virtue of their unique evaporation and heat capacity regulation effects, water bodies in cities can play a local cooling role complementary to coastal areas. Recently, the phenomenon of the urban thermal environment has become increasingly serious, and blue–green space plays a crucial role in urban cooling [49]. For example, the Yitong River is a crucial ecological corridor in Changchun that plays an indispensable role in regulating the urban climate. It effectively takes away the heat from the surrounding environment through the continuous evaporation of the river, bringing a significant cooling effect to Changchun. Moreover, an ecological park has been established nearby, and the rich vegetation in the park interacts with the river. The transpiration of the vegetation and the evaporation of the river water complement each other, greatly enhancing the cooling effect of the area and contributing to the optimization of the thermal environment in Changchun.
This study also has the following shortcomings and limitations, which are worthy of further reflection in follow-up research: (1) Data acquisition limitations. The Landsat 8/9 remote sensing image data used in this study only comprise 16-period images in summer and fall due to the limitations of the access period and data quality (e.g., high cloud cover). The use of other methods in future research can compensate for this shortcoming, and thus, the change in the UGSCE between different temperatures can be more accurately investigated. (2) The consideration of the influencing factors of the UGSCE and SUGSCE may be insufficient. In addition to the studied factors, there may be other potential factors affecting the UGSCE and SUGSCE. The plant species composition and external environmental factors of the green spaces, such as the surrounding water bodies, building density, and building plot ratio, are also worth studying.

5. Conclusions

Urban green space is of great significance for regulating urban temperature. Although it can be affected by extreme environments, it can produce a stable cooling effect in most cases, which is important for alleviating the urban heat island effect and improving the urban ecological environment. We analyzed the cooling effect of urban green space and its stability in Changchun on the regional and patch scales. We found that on the regional scale, there was a significant UGSCE in Changchun from 2013 to 2024, and the cooling effect is enhanced when the temperature increases within a certain range, although there are fluctuations. On the patch scale, the cooling effect showed a small upward trend from 2013 to 2024, and the CE’s stability was higher than the stability of the CI and the stability of the LST. The A, P, LSI, and MEVI were found to be important factors affecting the UGSCE and SUGSCE, especially the MEVI, high values of which increased the cooling effect and stability. The planning suggestions based on the results, such as increasing vegetation amount, maintaining green space area, rationally constructing green space forms, and focusing on blue–green space, can provide references for urban green space planning, which can help to enhance the ability of cities to cope with global warming and optimize the urban ecological environment. However, there are limitations to this study, such as limited data acquisition and the insufficient consideration of influencing factors, which can be improved with subsequent research.

Author Contributions

Conceptualization, H.Y. and Y.P.; methodology, H.Y. and Y.P.; software, H.Y.; validation, H.Y.; formal analysis, H.Y.; investigation, H.Y.; resources, Y.P.; data curation, H.Y.; writing—original draft preparation, H.Y.; writing—review and editing, H.Y. and Y.P.; visualization, H.Y.; supervision, Y.P.; project administration, Y.P.; funding acquisition, Y.P. All authors have read and agreed to the published version of the manuscript.

Funding

This research was funded by the Science and Technology Research Project of the Education Department of Jilin Province, grant number JJKH20230616KJ.

Institutional Review Board Statement

Not applicable.

Informed Consent Statement

Not applicable.

Data Availability Statement

Data are contained within this article.

Conflicts of Interest

The authors declare no conflicts of interest.

References

  1. Du, H.; Wang, D.; Wang, Y.; Zhao, X.; Qin, F.; Jiang, H.; Cai, Y. Influences of land cover types, meteorological conditions, anthropogenic heat and urban area on surface urban heat island in the Yangtze River Delta Urban Agglomeration. Sci. Total Environ. 2016, 571, 461–470. [Google Scholar] [CrossRef]
  2. Liu, X.; Huang, Y.; Xu, X.; Li, X.; Li, X.; Ciais, P.; Lin, P.; Gong, K.; Ziegler, A.D.; Chen, A.; et al. High-spatiotemporal-resolution mapping of global urban change from 1985 to 2015. Nat. Sustain. 2020, 3, 564–570. [Google Scholar] [CrossRef]
  3. Zittis, G.; Hadjinicolaou, P.; Fnais, M.; Lelieveld, J. Projected changes in heat wave characteristics in the eastern Mediterranean and the Middle East. Reg. Environ. Change 2016, 16, 1863–1876. [Google Scholar] [CrossRef]
  4. Hu, D.; Meng, Q.; Zhang, L.; Zhang, Y. Spatial quantitative analysis of the potential driving factors of land surface temperature in different “Centers” of polycentric cities: A case study in Tianjin, China. Sci. Total Environ. 2020, 706, 135244. [Google Scholar] [CrossRef] [PubMed]
  5. Meng, Q.; Gao, J.; Zhang, L.; Hu, X.; Qian, J.; Jancsó, T. Coupled cooling effects between urban parks and surrounding building morphologies based on the microclimate evaluation framework integrating remote sensing data. Sustain. Cities Soc. 2024, 102, 105235. [Google Scholar] [CrossRef]
  6. Aminipouri, M.; Knudby, A.J.; Krayenhoff, E.S.; Zickfeld, K.; Middel, A. Modelling the impact of increased street tree cover on mean radiant temperature across Vancouver’s local climate zones. Urban For. Urban Green. 2019, 39, 9–17. [Google Scholar] [CrossRef]
  7. Ballester, J.; Quijal-Zamorano, M.; Méndez Turrubiates, R.F.; Pegenaute, F.; Herrmann, F.R.; Robine, J.M.; Basagaña, X.; Tonne, C.; Antó, J.M.; Achebak, H. Heat-related mortality in Europe during the summer of 2022. Nat. Med. 2023, 29, 1857–1866. [Google Scholar] [CrossRef]
  8. Iungman, T.; Cirach, M.; Marando, F.; Barboza, E.P.; Khomenko, S.; Masselot, P.; Quijal-Zamorano, M.; Mueller, N.; Gasparrini, A.; Urquiza, J.; et al. Cooling cities through urban green infrastructure: A health impact assessment of European cities. Lancet 2023, 401, 577–589. [Google Scholar] [CrossRef]
  9. Tan, W.; Cai, M.; Sun, Y.; Chen, T. From land-based to people-based: Spatiotemporal cooling effects of peri-urban parks and their driving factors in China. Landsc. Urban Plan. 2025, 254, 105243. [Google Scholar] [CrossRef]
  10. Beele, E.; Aerts, R.; Reyniers, M.; Somers, B. Spatial configuration of green space matters: Associations between urban land cover and air temperature. Landsc. Urban Plan. 2024, 249, 105121. [Google Scholar] [CrossRef]
  11. Liu, H.; Huang, B.; Gao, S.; Wang, J.; Yang, C.; Li, R. Impacts of the evolving urban development on intra-urban surface thermal environment: Evidence from 323 Chinese cities. Sci. Total Environ. 2021, 771, 144810. [Google Scholar] [CrossRef] [PubMed]
  12. Venter, S.Z.; Krog, H.N.; Barton, N.D. Linking green infrastructure to urban heat and human health risk mitigation in Oslo, Norway. Sci. Total Environ. 2020, 709, 136193. [Google Scholar] [CrossRef]
  13. He, B.J.; Wang, J.; Liu, H.; Ulpiani, G. Localized synergies between heat waves and urban heat islands: Implications on human thermal comfort and urban heat management. Environ. Res. 2021, 193, 110584. [Google Scholar] [CrossRef]
  14. Dugord, P.A.; Lauf, S.; Schuster, C.; Kleinschmit, B. Land use patterns, temperature distribution, and potential heat stress risk—The case study Berlin, Germany. Comput. Environ. Urban Syst. 2014, 48, 86–98. [Google Scholar] [CrossRef]
  15. Chakraborty, T.; Hsu, A.; Manya, D.; Sheriff, G. A spatially explicit surface urban heat island database for the United States: Characterization, uncertainties, and possible applications. ISPRS J. Photogramm. Remote Sens. 2020, 168, 74–88. [Google Scholar] [CrossRef]
  16. Xu, Y.; Yang, J.; Zheng, Y.; Li, W. Impacts of two-dimensional and three-dimensional urban morphology on urban thermal environments in high-density cities: A case study of Hong Kong. Build. Environ. 2024, 252, 111249. [Google Scholar] [CrossRef]
  17. Marando, F.; Heris, M.P.; Zulian, G.; Udías, A.; Mentaschi, L.; Chrysoulakis, N.; Parastatidis, D.; Maes, J. Urban heat island mitigation by green infrastructure in European Functional Urban Areas. Sustain. Cities Soc. 2022, 77, 103564. [Google Scholar] [CrossRef]
  18. Drake, J.E.; Tjoelker, M.G.; Vårhammar, A.; Medlyn, B.E.; Reich, P.B.; Leigh, A.; Pfautsch, S.; Blackman, C.J.; López, R.; Aspinwall, M.J.; et al. Trees tolerate an extreme heatwave via sustained transpirational cooling and increased leaf thermal tolerance. Glob. Change Biol. 2018, 24, 2390–2402. [Google Scholar] [CrossRef]
  19. Ibsen, P.C.; Santiago, L.S.; Shiflett, S.A.; Chandler, M.; Jenerette, G.D. Irrigated urban trees exhibit greater functional trait plasticity compared to natural stands. Biol. Lett. 2023, 19, 20220448. [Google Scholar] [CrossRef]
  20. Peng, J.; Dan, Y.; Yu, X.; Xu, D.; Yang, Z.; Wang, Q. Response of urban green space cooling effect to urbanization in the Three Ring Road area of Changsha City. Sustain. Cities Soc. 2024, 109, 105534. [Google Scholar] [CrossRef]
  21. Li, Y.; Svenning, C.J.; Zhou, W.; Zhu, K.; Abrams, J.F.; Lenton, T.M.; Ripple, W.J.; Yu, Z.; Teng, S.N.; Dunn, R.R.; et al. Green spaces provide substantial but unequal urban cooling globally. Nat. Commun. 2024, 15, 7108. [Google Scholar] [CrossRef]
  22. Zhang, Y.; Ge, J.; Wang, S.; Dong, C. Optimizing urban green space configurations for enhanced heat island mitigation: A geographically weighted machine learning approach. Sustain. Cities Soc. 2025, 119, 106087. [Google Scholar] [CrossRef]
  23. Liu, F.; Liu, J.; Zhang, Y.; Hong, S.; Fu, W.; Wang, M.; Dong, J. Construction of a cold island network for the urban heat island effect mitigation. Sci. Total Environ. 2024, 915, 169950. [Google Scholar] [CrossRef] [PubMed]
  24. Algretawee, H.; Rayburg, S.; Neave, M. Estimating the effect of park proximity to the central of Melbourne city on Urban Heat Island (UHI) relative to Land Surface Temperature (LST). Ecol. Eng. 2019, 138, 374–390. [Google Scholar] [CrossRef]
  25. Zhou, Y.; Zhao, H.; Mao, S.; Zhang, G.; Jin, Y.; Luo, Y.; Huo, W.; Pan, Z.; An, P.; Lun, F. Studies on urban park cooling effects and their driving factors in China: Considering 276 cities under different climate zones. Build. Environ. 2022, 222, 109441. [Google Scholar] [CrossRef]
  26. Zhou, Y.; Luo, Y.; Yi, X.; Lun, F.; Hu, Q.; Huang, N.; Wen, G.; Zhou, H.; Hu, X. Exploring the influence of local urban heat features on park cooling effects: Insights from Chinese cities. Build. Environ. 2024, 262, 111782. [Google Scholar] [CrossRef]
  27. Yu, Q.B.; Cao, L.J.; Li, Z.; Wang, C.C.; Zhang, Y.B.; Zhu, Y.N.; Wang, L.L. Multi-scale Temporal Variation Characteristics of Extreme Temperature in Changchun during 1909−2021 and Its Relationship with Large-Scale Climate Indices. Clim. Environ. Stud. 2023, 28, 437–449. [Google Scholar]
  28. Feng, Z.X.; Wang, S.J.; Jin, S.H.; Yang, J. Effects of urban morphology and wind conditions on land surface temperature in Changchun. Acta Geogr. Sin. 2019, 74, 902–911. [Google Scholar]
  29. Yang, C. The effect of the urban spatial structure on the spatio-temporal patterns of the urban thermal environment. Acta Geod. Cartogr. Sin. 2022, 51, 788. [Google Scholar] [CrossRef]
  30. Yang, M.; Nie, W.; Wu, R.; Yan, H.; Tian, S.; Wang, K.; Shi, L.; Cheng, X.; Ji, T.; Bao, Z. Towards more equitable cooling services of urban parks: Linking cooling effect, accessibility and attractiveness. J. Environ. Manag. 2024, 370, 122475. [Google Scholar] [CrossRef]
  31. Cook, M.J. Atmospheric Compensation for a Landsat Land Surface Temperature Product. Ph.D. Thesis, Rochester Institute of Technology, Rochester, NY, USA, 2014. Available online: http://scholarworks.rit.edu/theses/8513 (accessed on 18 March 2024).
  32. Sun, R.; Chen, L. Effects of green space dynamics on urban heat islands: Mitigation and diversification. Ecosyst. Serv. 2017, 23, 38–46. [Google Scholar] [CrossRef]
  33. Cai, Y.; Chen, Y.; Tong, C. Spatiotemporal evolution of urban green space and its impact on the urban thermal environment based on remote sensing data: A case study of Fuzhou City, China. Urban For. Urban Green. 2019, 41, 333–343. [Google Scholar] [CrossRef]
  34. Yu, Z.; Yao, Y.; Yang, G.; Wang, X.; Vejre, H. Spatiotemporal patterns and characteristics of remotely sensed region heat islands during the rapid urbanization (1995–2015) of Southern China. Sci. Total Environ. 2019, 674, 242–254. [Google Scholar] [CrossRef]
  35. Yan, L.; Jia, W.; Zhao, S. The Cooling Effect of Urban Green Spaces in Metacities: A Case Study of Beijing, China’s Capital. Remote Sens. 2021, 13, 4601. [Google Scholar] [CrossRef]
  36. Altman, D.G.; Bland, J.M. Standard deviations and standard errors. BMJ 2005, 331, 903. [Google Scholar] [CrossRef] [PubMed]
  37. Riemann, L.B.; Lininger, R.M. Principles of Statistics. Clin. Sports Med. 2018, 37, 375–386. [Google Scholar] [CrossRef] [PubMed]
  38. Gerace, A.; Montanaro, M. Derivation and validation of the stray light correction algorithm for the thermal infrared sensor onboard Landsat 8. Remote Sens. Environ. 2017, 191, 246–257. [Google Scholar] [CrossRef]
  39. Yang, C.; He, X.; Yu, L.; Yang, J.; Yan, F.; Bu, K.; Chang, L.; Zhang, S. The Cooling Effect of Urban Parks and Its Monthly Variations in a Snow Climate City. Remote Sens. 2017, 9, 1066. [Google Scholar] [CrossRef]
  40. Wang, L.; Jia, J.; Lu, Y.; Jing, Z.W.; Yao, Y.L. Dynamic Response of Green Space Configuration and Cooling Efficiency in Changchun City. Chin. Gard. 2022, 38, 44–49. [Google Scholar] [CrossRef]
  41. Liao, W.; Guldmann, J.M.; Hu, L.; Cao, Q.; Gan, D.; Li, X. Linking urban park cool island effects to the landscape patterns inside and outside the park: A simultaneous equation modeling approach. Landsc. Urban Plan. 2023, 232, 104681. [Google Scholar] [CrossRef]
  42. Li, X.; Zhou, W. Optimizing urban greenspace spatial pattern to mitigate urban heat island effects: Extending understanding from local to the city scale. Urban For. Urban Green. 2019, 41, 255–263. [Google Scholar] [CrossRef]
  43. Li, X.; Zhou, W.; Ouyang, Z.; Xu, W.; Zheng, H. Spatial pattern of greenspace affects land surface temperature: Evidence from the heavily urbanized Beijing metropolitan area, China. Landsc. Ecol. 2012, 27, 887–898. [Google Scholar] [CrossRef]
  44. Liu, H.Q.; Huete, A. A feedback based modification of the NDVI to minimize canopy background and atmospheric noise. IEEE Trans. Geosci. Remote Sens. 1995, 33, 457–465. [Google Scholar] [CrossRef]
  45. Peng, Y.; He, G.J.; Zhang, Z.M.; Yin, R.Y. Landsat Spectral Index Products over Qinghai-Xizang Plateau. China Scientific Data, pp. 1–8. Available online: https://kns-cnki-net.webvpn.ybu.edu.cn/kcms/detail/11.6035.N.20241031.1720.002.html (accessed on 28 January 2025).
  46. Weisberg, S. Applied Linear Regression, 3rd ed.; John Wiley & Sons, Inc.: Hoboken, NJ, USA, 2005. [Google Scholar]
  47. Zhang, Q.; Zhou, D.; Xu, D.; Rogora, A. Correlation between cooling effect of green space and surrounding urban spatial form: Evidence from 36 urban green spaces. Build. Environ. 2022, 222, 109375. [Google Scholar] [CrossRef]
  48. Du, H.; Cai, W.; Xu, Y.; Wang, Z.; Wang, Y.; Cai, Y. Quantifying the cool island effects of urban green spaces using remote sensing Data. Urban For. Urban Green. 2017, 27, 24–31. [Google Scholar] [CrossRef]
  49. Lu, Q.; Qi, W.; Yang, D.; Zhang, M. The influence of internal spatial coupling characteristics of blue-green space on cooling benefit in metropolitan areas: Evidence form Hangzhou, China. Environ. Sustain. Indic. 2025, 25, 100558. [Google Scholar] [CrossRef]
Figure 1. The location of the study area and the sample green spaces in the center of Changchun.
Sustainability 17 02590 g001
Figure 2. The research framework of our study.
Sustainability 17 02590 g002
Figure 3. The distribution of remote sensing imagery by month.
Sustainability 17 02590 g003
Figure 4. LST in the study area, 2013–2024.
Sustainability 17 02590 g004
Figure 5. Time-varying curve of LST.
Sustainability 17 02590 g005
Figure 6. (a) Multi-ring buffer in green space No. 1. (b) Surface temperature changes within the multi-ring buffer in green space No. 1.
Sustainability 17 02590 g006
Figure 7. Changes in cooling effect and quantitative metrics for UGSCE and SUGSCE in green space 1 over 16 periods.
Sustainability 17 02590 g007
Figure 8. RLST in the study area, 2013–2024.
Sustainability 17 02590 g008
Figure 9. Linear regression analysis of LST and RLST.
Sustainability 17 02590 g009
Figure 10. Pearson correlation heat map of potential factors with UGSCE and SUGSCE.
Sustainability 17 02590 g010
Table 1. Quantitative indicators for the UGSCE and SUGSCE.
Quantitative IndicatorAbbreviation
UGSCE
Mean LSTs for green space phase 16MLST
Mean CIs for green space phase 16MCI
Mean CEs for green space phase 16MCE
SUGSCE
Standard deviation of LST for green space phase 16SDLST
Standard deviation of CI for green space phase 16SDCI
Standard deviation of CE for green space phase 16SDCE
Table 2. Potential factors included in this study.
FactorAbbreviationFormulaDescription
Area of green spaceA-The area of each green space.
Perimeter of green spaceP-The perimeter of each green space.
Landscape shape
index
LSI L S I = P 2 π A A standardized measure of edge density adjusting for the size of green space and a standard circle. P and A refer to the perimeter and area of each green space, separately [35].
Mean enhanced vegetation index (EVI) of green spaceMEVI E V I = G × ( N I R R E D ) ( N I R + C 1 × R E D C 2 × B L U E + L ) G = 2.5 , C 1 = 6 , C 2 = 7.5 , L = 1 M E V I = i = 1 16 E V I i 16 EVI is based on the normalized difference vegetation index, which includes background adjustment parameters and atmospheric correction parameters to reduce background and atmospheric disturbances [44,45]. The mean EVI was calculated using the data from the 16th phase of the green space.
Table 3. Pearson correlation of LST and RLST.
RLST
LST−0.872 ***
*** p < 0.01.
Table 4. Descriptive analysis of UGSCE and SUGSCE on the patch scale.
NameSample Size Minimum ValueMaximum ValueMean ValueStandard DeviationStandard Errors
MLST3527.4133.1430.571.330.22
MCI351.836.854.181.160.2
MCE35110.63301.88173.9556.019.5
SDLST354.686.325.480.430.07
SDCI350.472.241.350.380.06
SDCE357.5131.6851.5538.56.5
Table 5. Descriptive analysis of potential factors.
NameSample SizeMinimum ValueMaximum ValueMean ValueStandard DeviationStandard Errors
A353.06330.4038.9060.5710.24
P350.798.552.641.730.29
LSI351.23137.6917.2025.954.39
MEVI350.260.450.350.050.01
Table 6. Stepwise multiple regression results of UGSCE and its influencing factors.
Quantitative Indicator for UGSCEMLSTMCIMCE
Influencing FactorsA 0.007 **
P−0.507 *** 14.354 ***
LSI
MEVI−9.612 ***
R20.5500.1380.196
Regression modelMLST = 35.239 − 0.507 × P − 9.612×MEVIMCI = 3.898 + 0.007 × AMCE = 136.076 + 14.354 × P
** p < 0.05 *** p < 0.01.
Table 7. Stepwise multiple regression results of SUGSCE and its influencing factors.
Quantitative Indicator for SUGSCESDLSTSDCI
Influencing FactorsA 0.003 ***
P−0.159 ***
LSI
MEVI−3.213 ***
R20.5400.217
Regression modelSDLST = 7.009 − 0.159 × P − 3.213 × MEVISDCI = 1.237 + 0.003 × A
*** p < 0.01.
Disclaimer/Publisher’s Note: The statements, opinions and data contained in all publications are solely those of the individual author(s) and contributor(s) and not of MDPI and/or the editor(s). MDPI and/or the editor(s) disclaim responsibility for any injury to people or property resulting from any ideas, methods, instructions or products referred to in the content.

