Article

Numerical Investigation of the Opto-Electric and Thermal Performance of a Newly Enhanced Double V-Trough Low Concentration Photovoltaic System for Sustainable Solar Energy Utilization

Mechanical and Energy Engineering Department, Imam Abdulrahman Bin Faisal University, Dammam 31441, Saudi Arabia
*
Author to whom correspondence should be addressed.
Sustainability 2025, 17(6), 2537; https://doi.org/10.3390/su17062537
Submission received: 8 February 2025 / Revised: 5 March 2025 / Accepted: 6 March 2025 / Published: 13 March 2025

Abstract

:
The global energy demand is experiencing a rapid surge, necessitating a heightened focus on renewable energy sources for a sustainable future. Among these sources, solar energy has emerged as a promising candidate; however, it often suffers from intermittent and unreliability issues. In light of these challenges, implementing low concentrating photovoltaic (LCPV) systems presents a potential solution for enhancing solar energy utilization and improving efficiency. In the present work, a numerical investigation of the opto-thermoelectric performance of different types of V-trough-based concentrators is performed. A new Enhanced Double V-trough Concentrator (EDVC) design is proposed using COMSOL Multiphysics simulations and tested to enhance the overall efficiencies of such technology, contributing to more reliable and cost-effective solar energy harvesting. This advancement aims to support the transition toward sustainable and scalable photovoltaic solutions. The overall performance of the EDVC is compared against the existing V-trough designs, i.e., the conventional V-trough, double V-trough, and pyramidal concentrators. The numerically obtained findings show that the EDVC can achieve the highest optical efficiency and optical concentration ratio of 89% and 4.77 suns, respectively. Moreover, the short-circuit current and output power of the EDVC are higher than those of conventional designs without concentration by 488% and 450%, respectively, despite an open-circuit voltage drop of 11%.

1. Introduction

Concentrating photovoltaic (CPV) technology has recently crossed the threshold of markets as a back-up utility-scale option for solar-to-electricity power generation plants. The CPV industry has strived to compete with crystalline silicon (c-Si) PV prices, with a faster trend in development than had ever been expected in comparison with other solar technologies. The peak electrical efficiency of CPV modules under the Concentrator Standard Test Conditions (CSTCs) are breaking the records of all other existing solar technologies, especially those of traditional flat plates. The main principle of CPV technology is the employment of cheap optical devices to concentrate the sun’s rays onto reduced receiving areas made by more expensive semiconductors. This cost-efficient concentrating optics promotes a drop in the Levelized Cost of Electricity (LCOE) and permits the use of high-efficient solar cells [1,2,3,4,5]. In recent years, progress in this last area has been promoted by the implementation of several supporting strategies [6,7,8,9,10,11,12,13,14,15,16].
Concentrated PV systems have been used due to their lower cost of energy generation while increasing the efficiency of PV systems by using inexpensive reflectors [17]. Utilizing the finite volume method, the impact of the tilt angle on the opto-thermal and electrical performance of a Compound Parabolic Concentrating Photovoltaic (CPC-PV) system were numerically evaluated [18]. A Fresnel lens-based LCPV system with a plano-concave lens and reflective surfaces was examined in [19]. When the geometric concentration ratio is less than ten (10×), it is referred to as a low concentrating photovoltaic system, or LCPV. Such concentration systems present an attractive option for a large number of applications. The three main components of a low concentrating photovoltaic system are the primary optics to collect sunlight, the thermal or electric receiver, and the heat sink. Based on the optical design of the primary optics, LCPVs can be divided into either reflective (Figure 1) or refractive LCPV designs (Figure 2). The secondary optical elements (known as Cassegrain) can be further considered in the design to homogenize and enhance light uniformity over the solar cells for current mismatch mitigation.
Among the different CPV types, low concentration photovoltaic (LCPV) systems are characterized by planar reflecting walls, ensuring optical concentration ratios below 10×. Different design aspects were considered by Benecke et al. [20] to experimentally investigate the optical and electrical performance of an LCPV module. The expected theoretical optical concentration ratio of this design was 6.02 suns; however, only an experimental concentration ratio of 4.53 suns was achieved. The faceted reflector’s optical losses and errors during construction were responsible for the prototype’s failure to meet the required concentration levels. Ağbulut et al. [21] experimentally investigated four different-sized layers for a pyramidal V-trough concentrator: a single-layer, double-layer, triple-layer, and quadruple-layer photovoltaic system. The sun’s radiation was shown to be more concentrated in the design that was made of double layers. The output power of the photovoltaic power modules increased as the concentration increased. Nevertheless, the photovoltaic module efficiency fell as the PV module temperature increased. Even though its calculated output power was 2.5 times (12.5 W) as much under the same test conditions, the PV module efficiency was expected to drop by 8%. Likewise, the average PV module efficiency for the double-layer application was about 7%, but the average module output power was the greatest for this layer. The results show that the usage of layers increases the power output up to a certain threshold. With a double-layer application, the PV system’s power production was enhanced by up to 16%. Li et al. [22] showed that Asymmetric Compound Parabolic Concentrating (ACPC) systems performed better in locations with predominantly diffuse solar radiation. Elsheniti et al. [23] reported that integrating Phase Change Materials (PCMs) effectively regulates the operating temperature of photovoltaic panels, leading to improved electrical efficiency and reduced material degradation rates.
In comparison to conventional flat-plate PV systems, LCPV panels produce more specific energy. Parupudi et al. [24] studied V-trough optical concentrators with post-truncation, Compound Parabolic Concentrating (CPC), and Asymmetric Compound Parabolic Concentrating (ACPC) systems for geometric concentration ratios of 1.40×, 1.46×, and 1.53×, respectively. The ACPC generated 32.5% more specific energy than the flat PV panels, followed by the CPC and V-Trough at 21.0% and 5.3%, respectively. To meet buildings’ energy demands, an ACPC-based LCPV panel needs an installation capacity of about 37 kWp, whereas a flat PV panel requires 49.0 kWp. The study found that an ACPC-based LCPV can run effectively in regions where the diffuse factor of solar radiation is significant, such as the United Kingdom. Also, according to the payback time estimation, an ACPC-based LCPV had the shortest payback duration of 5.4 years, compared to 6.14 years for flat PV panels.
The tradeoff between a high concentration ratio and a wider acceptance angle is always present when designing LCPV systems. To achieve optimal performance, concentrating systems and cells must be designed appropriately. Modeling the optical path of the sun’s rays, considering the optical characteristics and the geometry of the optical devices using ray-tracing techniques to analyze the concentrated flux distribution on the PV cells, is compulsory and essential to accurately design and optimize the overall system performance. Ranga et al. [25] experimentally studied different LCPV designs using COMSOL Multiphysics software. The study examined the impact of the incidence angle and the truncation levels using V-reflectors, Compound Parabolic Concentrators (CPCs), and Asymmetric Compound Parabolic Concentrators (ACPCs). The ACPC panels with m-Si solar cells produced 177 kWh/m2 with a payback time of 9.7 years, while the flat m-Si PV panels produced 101 kWh/m2 with a longer payback time of 16 years. Muhammad et al. [26] aimed to develop a mathematical model via MATLAB (R2019a) to estimate the power–voltage (P-V) and current–voltage (I-V) characteristics of a passive CPV. Muhammad et al. came up with a design of a CPV identified as the rotationally asymmetrical dielectric internally reflecting concentrator (RADTIRC). This design has an acceptance angle of ±40°, and the angular properties of the RADTIRC were simulated using MATLAB from −50° to 50° with a stepwise angle of 5°. The incidence angle range (±50 degrees) was picked to demonstrate that the RADTIRC can collect solar rays within its acceptance angle of ±40° degrees. The value of the optoelectronic gain (Copto-e) must be included in the mathematical model and verified through experiments. When compared to the experiments, the simulation model was proven to be capable of predicting the RADTIRC’s P-V and I-V characteristics, as well as its optical response. The maximum error recorded for the short-circuit current, the open-circuit voltage, the maximum power, the Fill Factor, and the Copto-e were 2.1229%, 5.3913%, 9.9681%, 4.4231%, and 0%, respectively. Ustaoglu et al. [27] developed a compound hyperbolic concentrator-trumpet photovoltaic–thermal system (CHCT-PVT) to improve the electrical efficiency by lowering the reflector length. The CHCT-PVT system was compared to non-imaging concentrators, such as a V-trough-PVT (VT-PVT) and Compound Parabolic Concentrator-PVT (CPC-PVT). To determine the energy flux, a 2D-ray-tracing study was performed. Both the cell temperature and solar radiation intensity were considered in the development of the algorithm to evaluate the electrical performance. The outcomes demonstrated that a CHC-PVT system can produce about the same electrical power as CPC and V-trough systems, even though the CHC needs nearly half the size of the V-trough or CPC for a similar concentration. The CHC system reached the highest electrical efficiency. PVs with a CPC, V-trough, or CHC trumpet have electrical efficiencies of 18.44%, 18.51%, and 18.59%, respectively. The power output of CHCT-PVT systems is 42.9% greater than that of CPC-PVT, and 58.97% higher than that of V-TPVT systems. With the help of a segregation interface proposed by Taniguchi et al. [28], it is possible to build high-performance light-element-based thermoelectric films by controlling the strain and atomic differences through ultrathin layers. Basset et al. [29] proposed a new silicon-based, batch-processed MEMS that does not require an electrode layer to gather and transform vibrational energy into electrical energy.
In this paper, four different LCPV designs are presented, which are the conventional V-trough concentrator (CVC), double V-trough concentrator (DVC), pyramidal concentrator, and Enhanced Double V-trough Concentrator (EDVC). The main object of this research is to model the entire behavior of each system by coupling the optical, thermal, and electrical governing equations into one combined module. The developed model is unique and has never been applied to such an application (LCPV) and purpose. Furthermore, the main purpose of this study is to promote a new LCPV design, i.e., the EDVC, which has broken through the dominance of the existing v-trough-based concentrators.

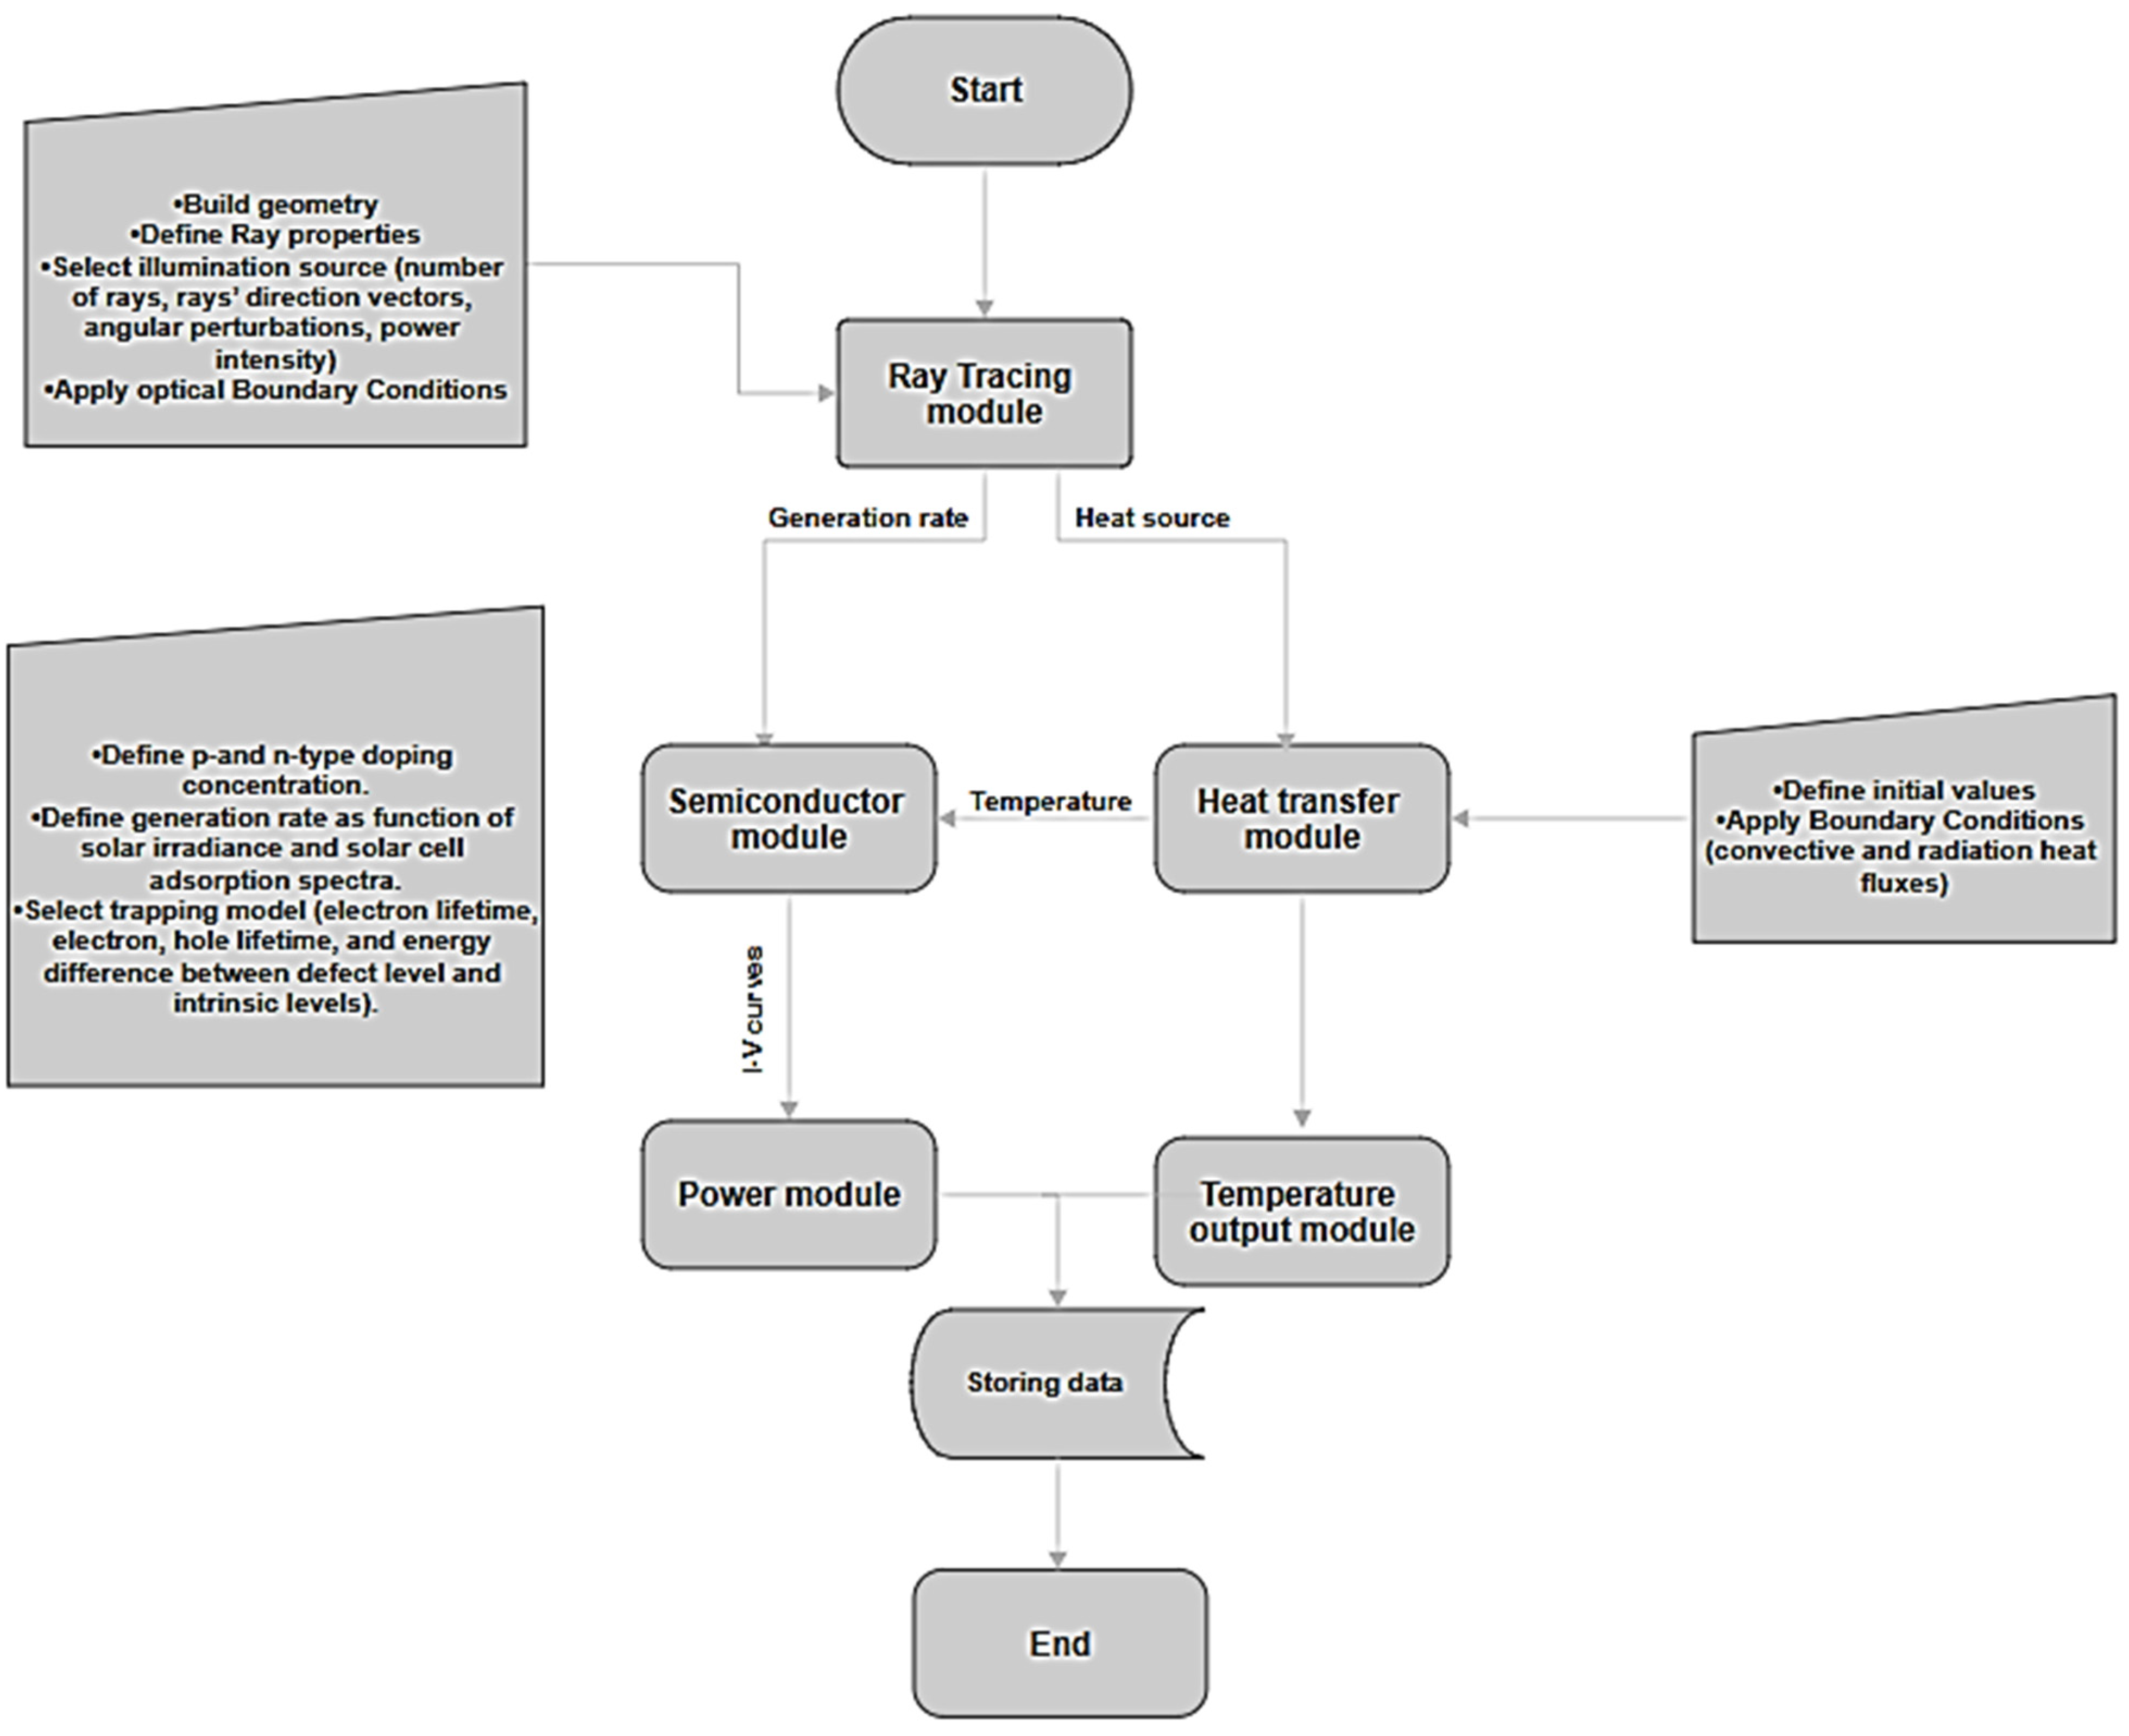
2. Numerical Modeling

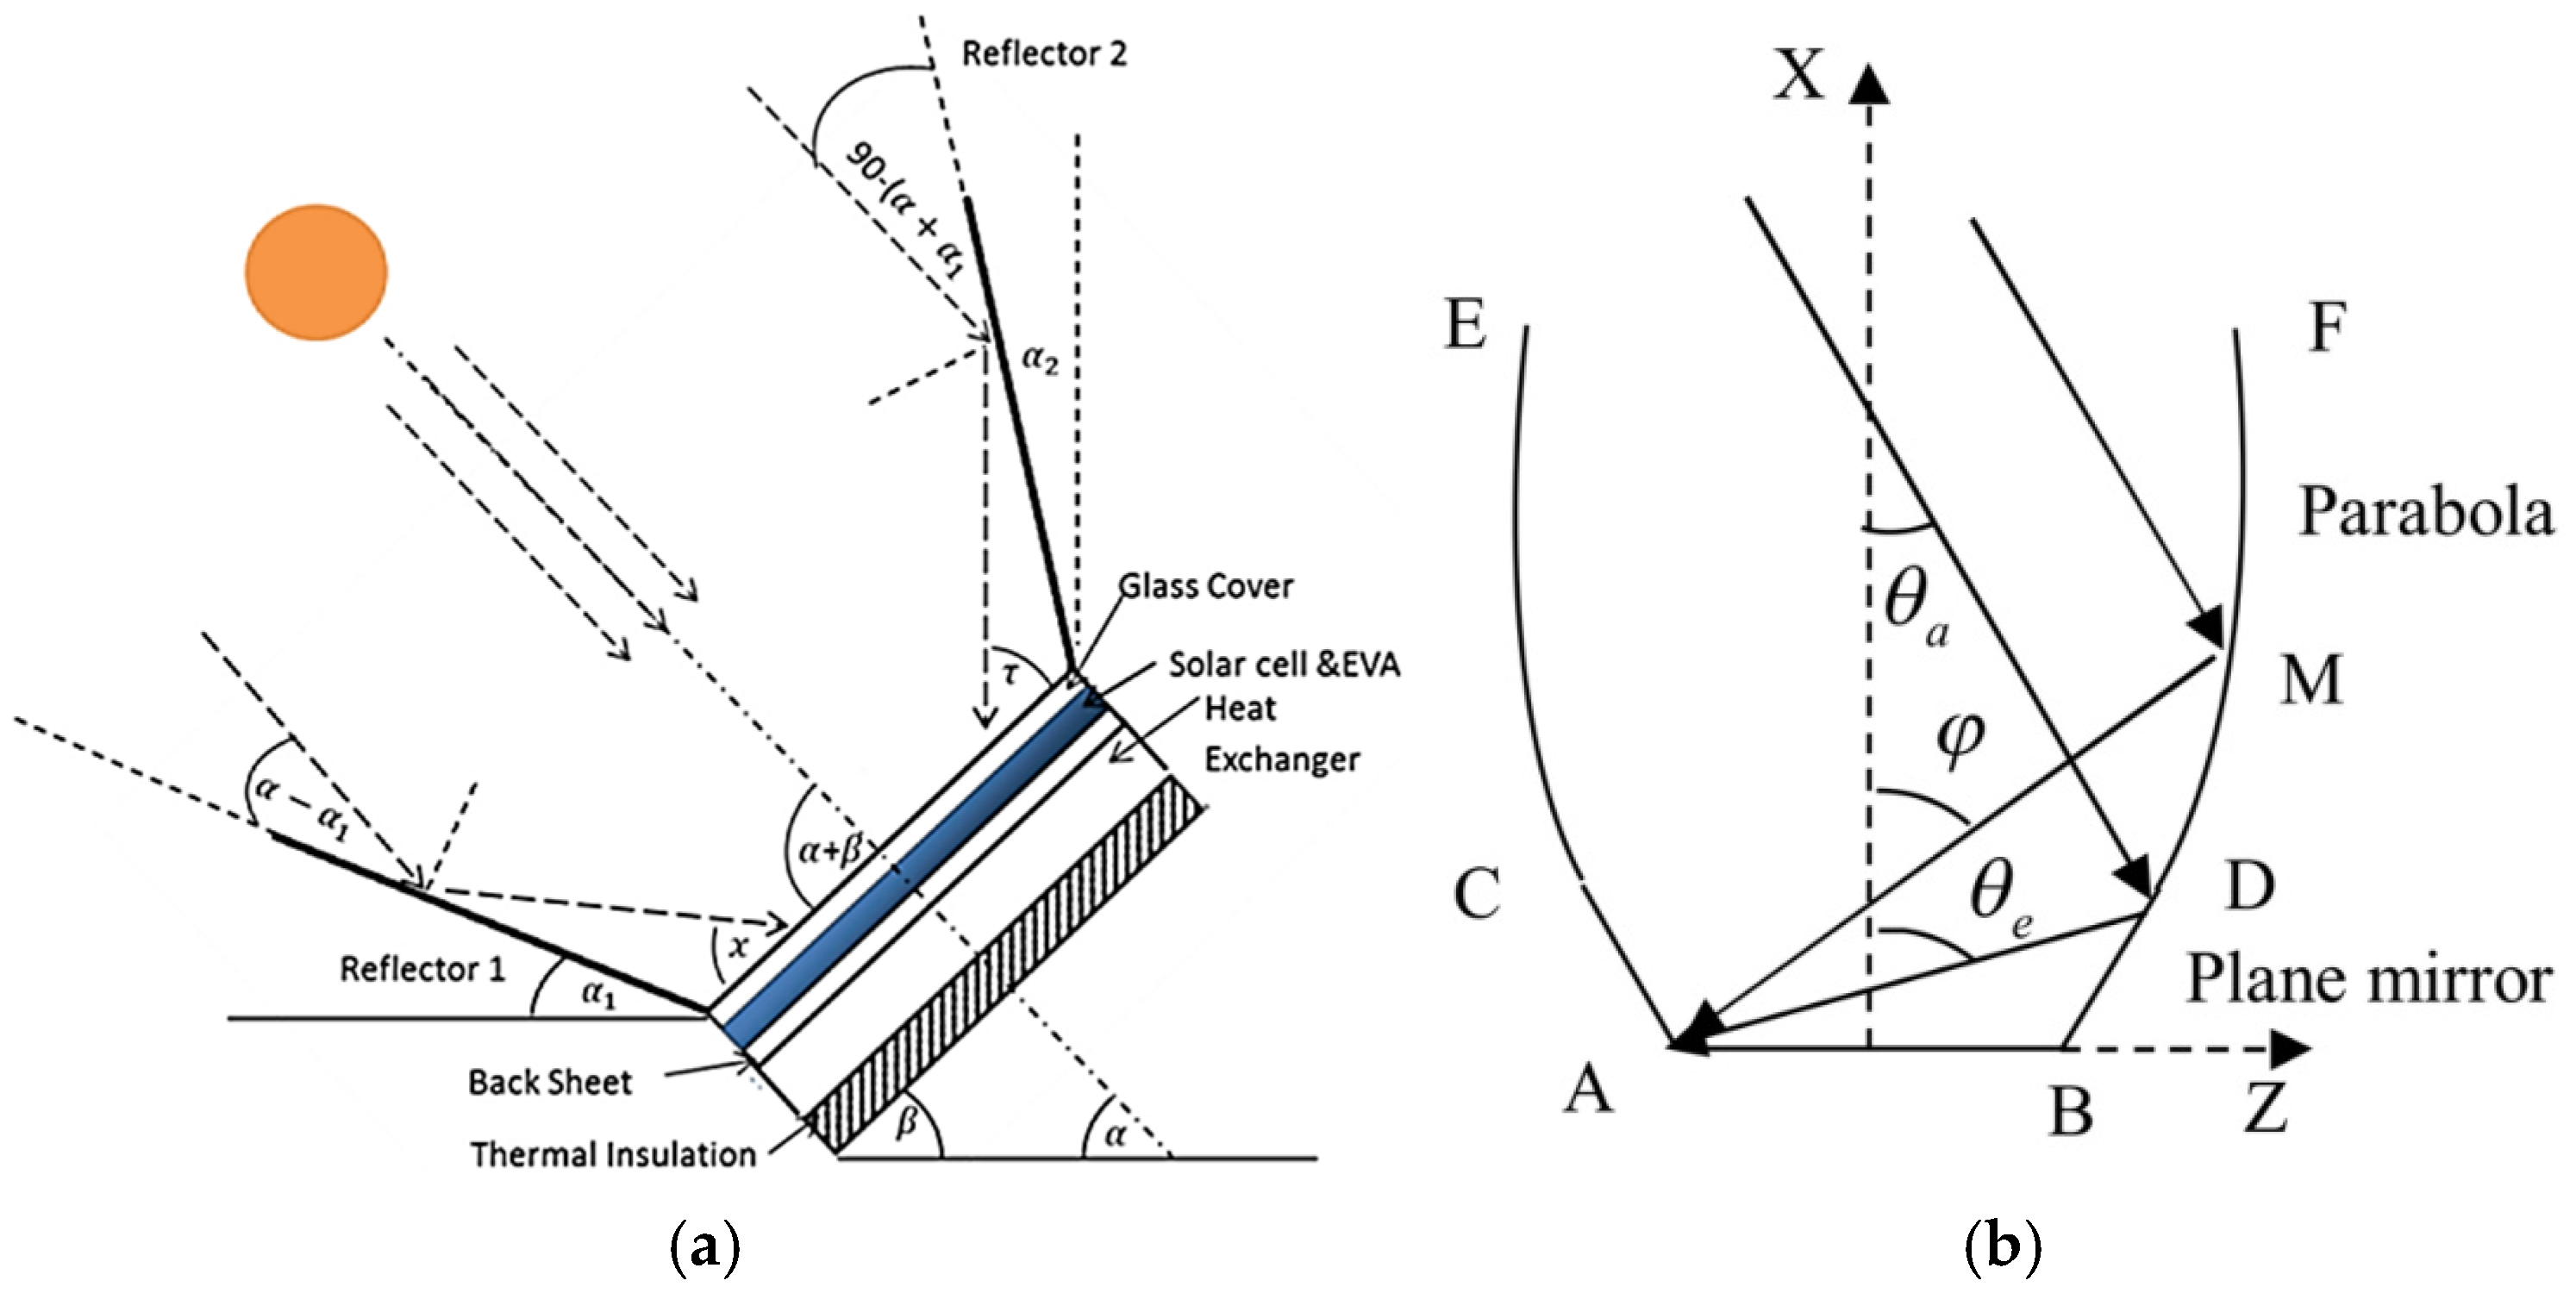
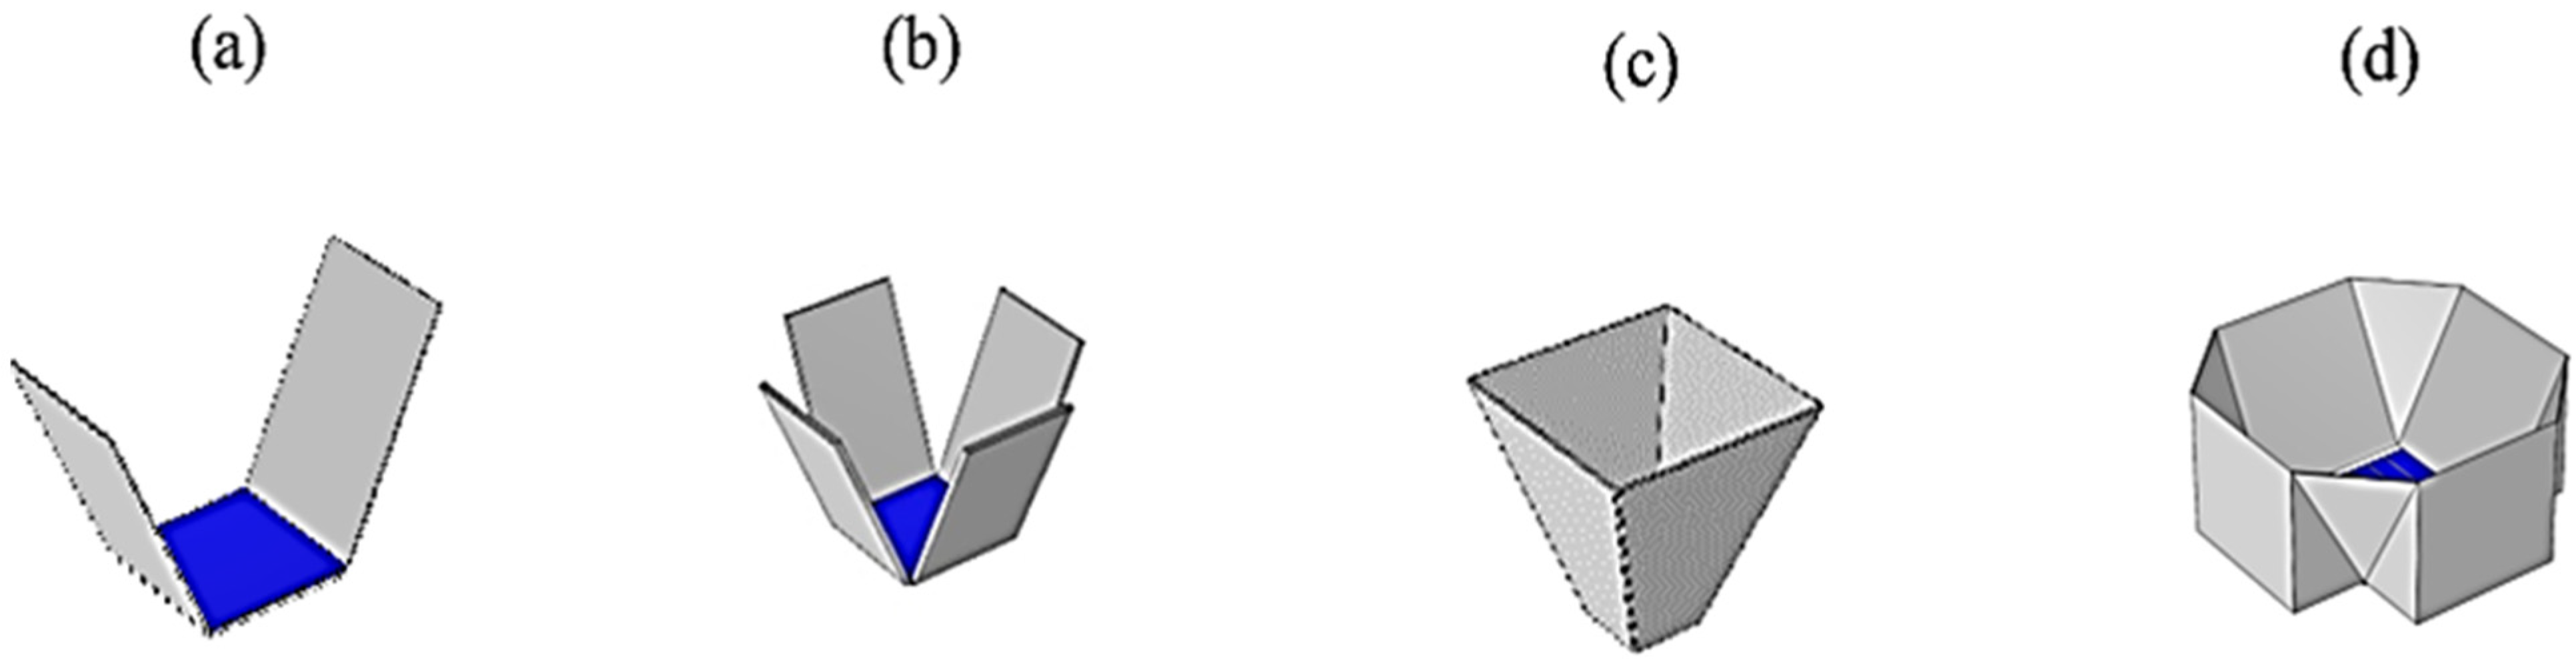
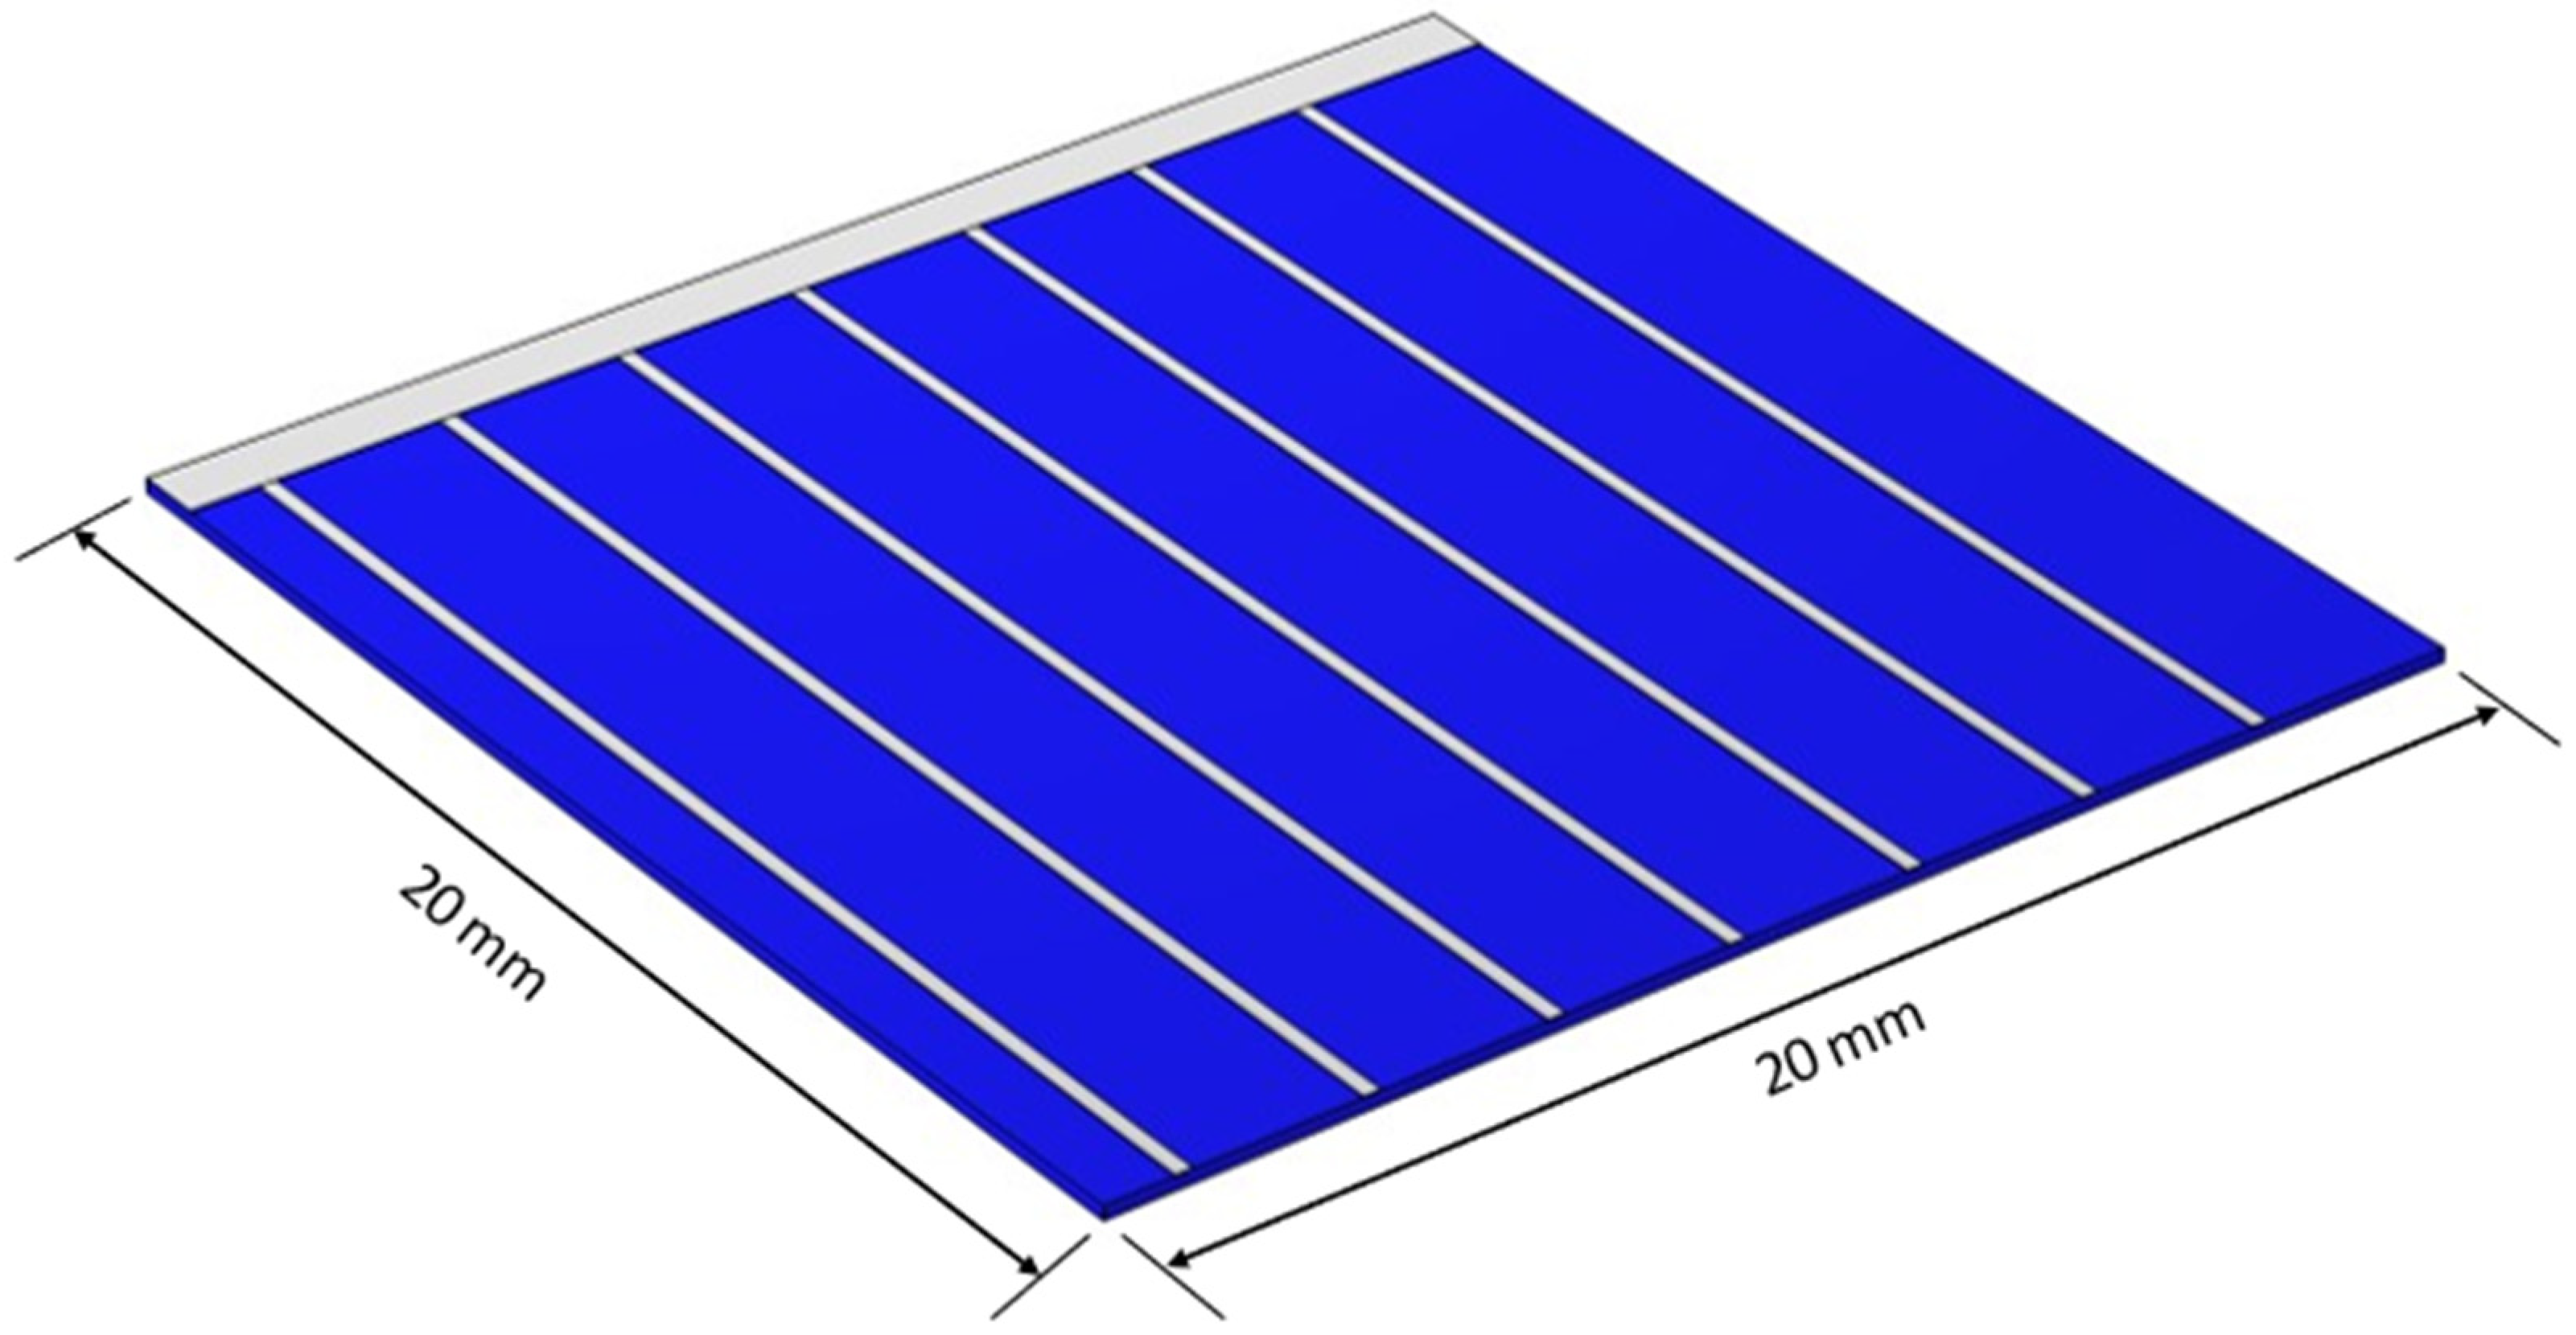
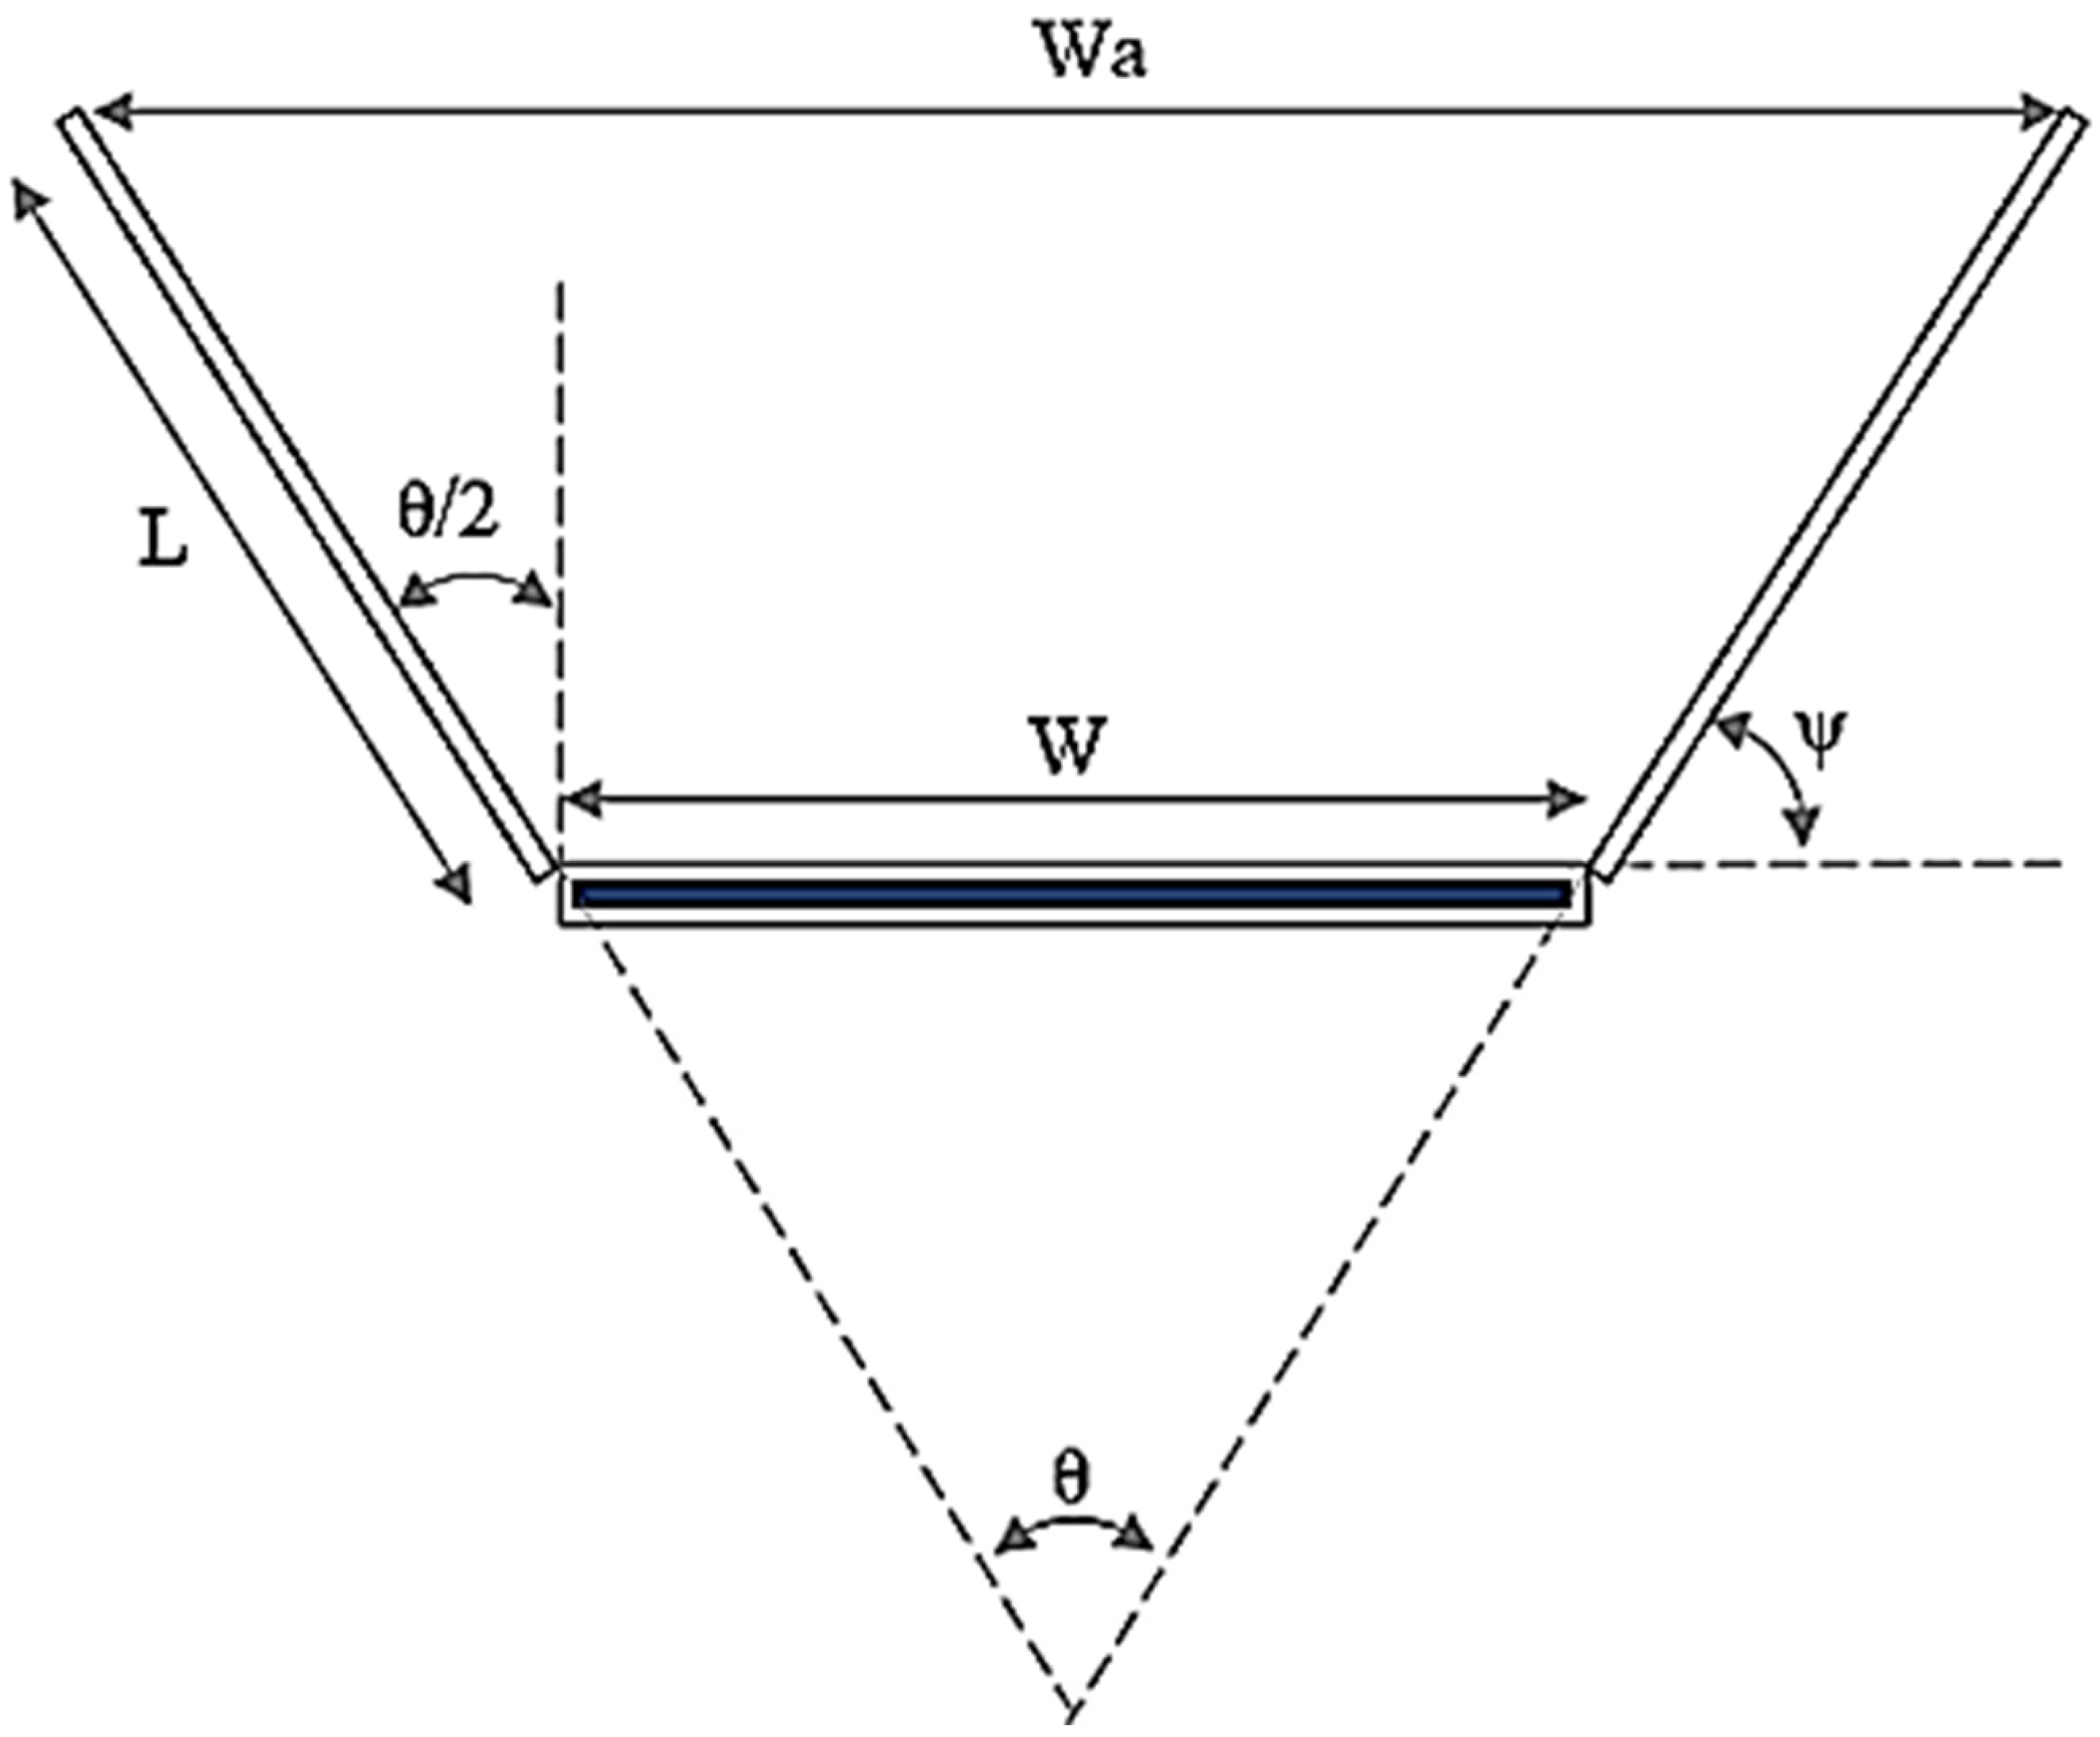
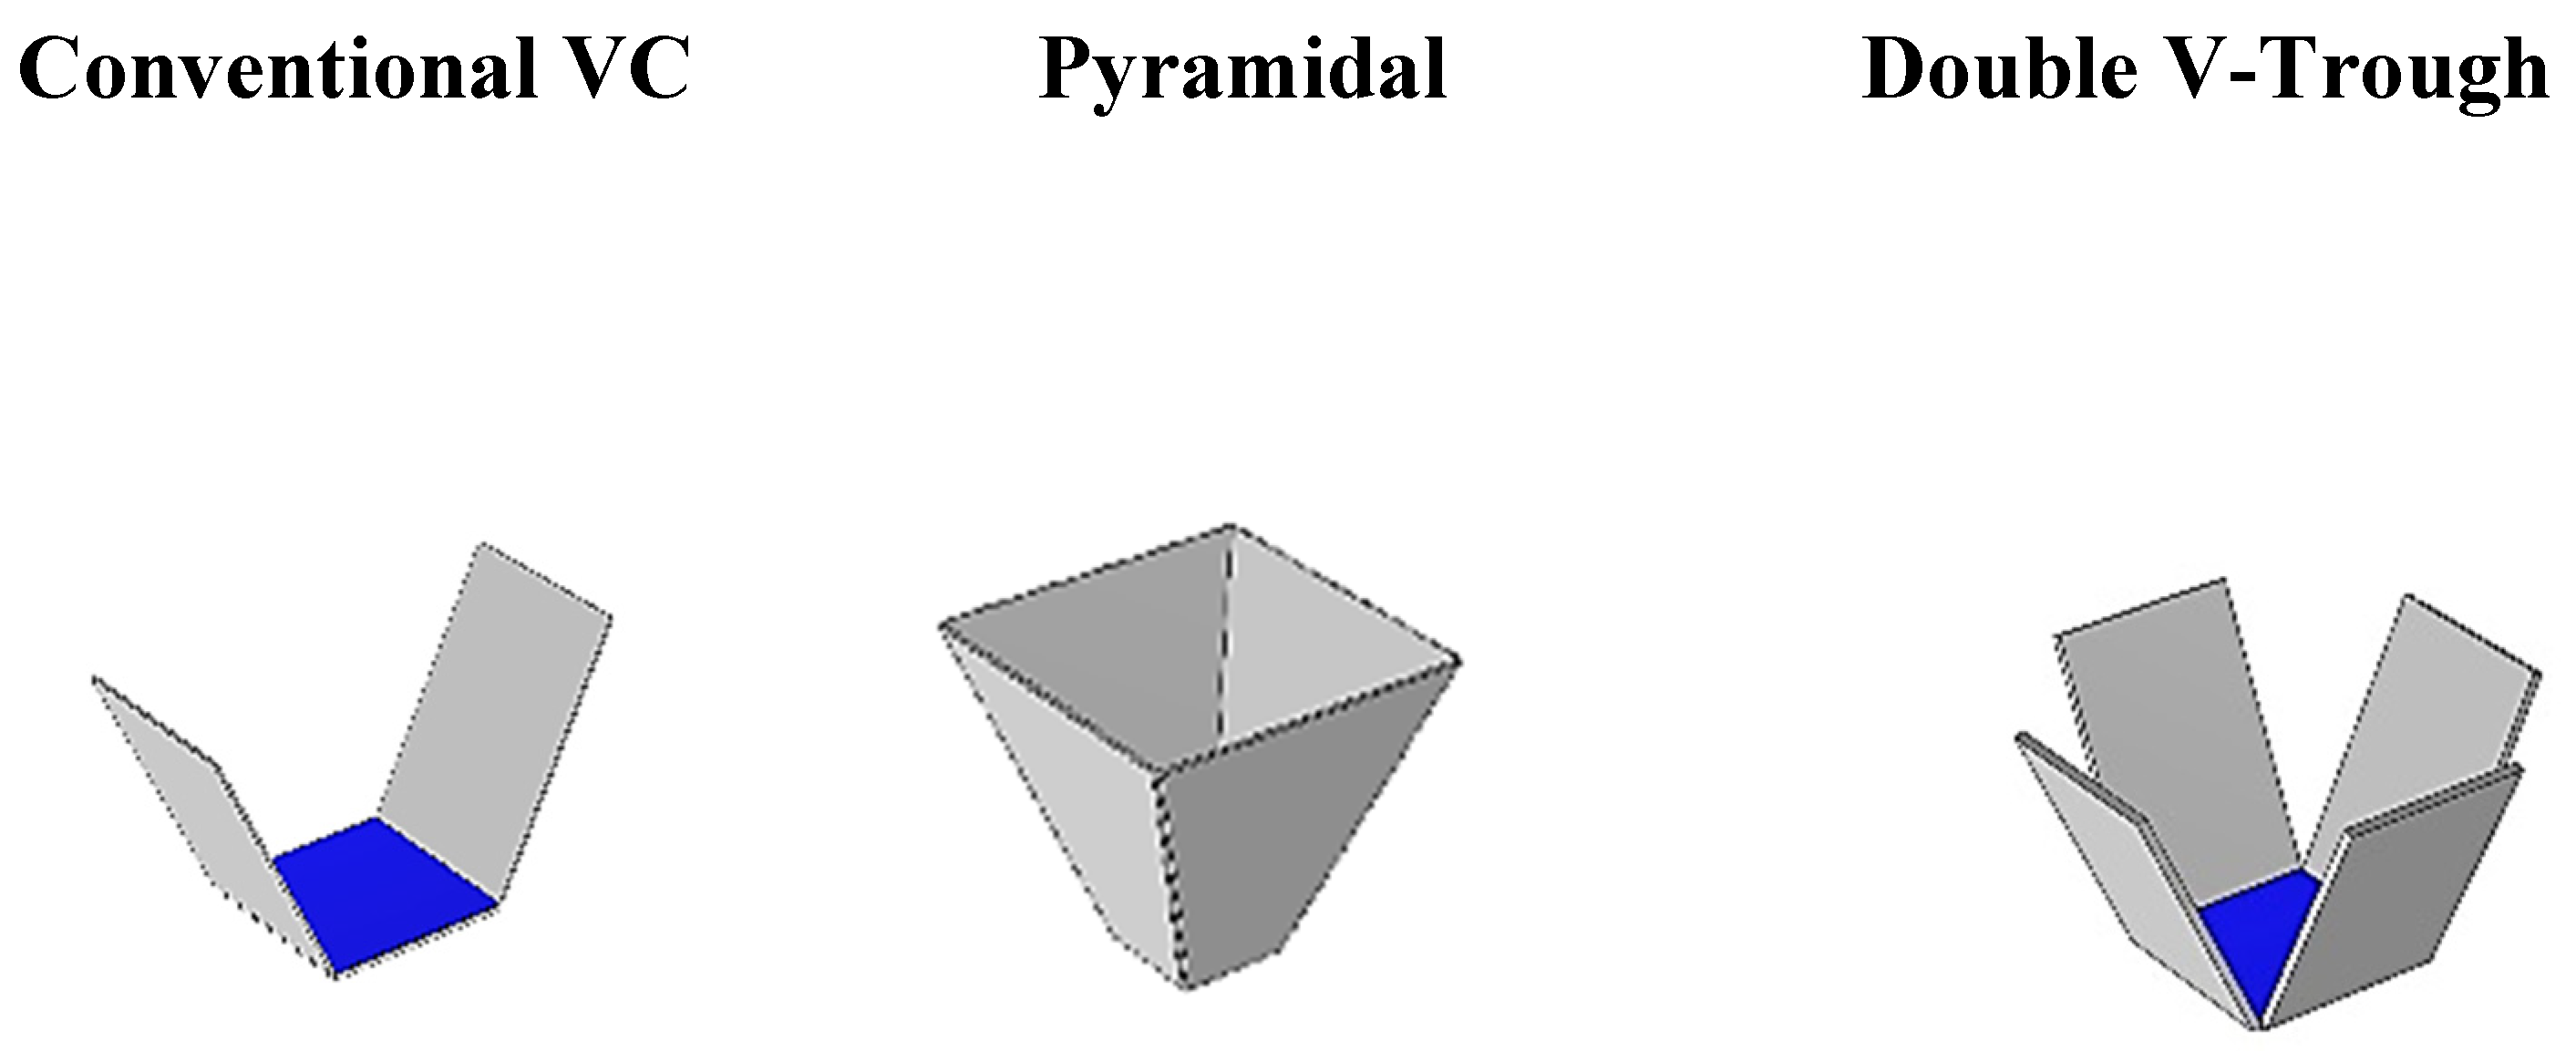
2.1. Geometric Modeling

Figure 3 depicts sketches of the four investigated LCPV designs, which are the conventional V-trough concentrator (CVC), double V-trough (DVC), pyramidal concentrator, and Enhanced Double V-trough (EDVC).
The flat-plate receiver is composed of an m-Si solar cell. It consists of different layers. The back sheet, at the outermost rear layer, is based on polymer material Ethylene Vinyl Acetate (Eva), which is used as an encapsulant material; the silicon cell (m-Si) and low-iron glass, which are set in the top layer, are used to ensure the PV cell stability in front of UV exposure. Figure 4 shows the silicon PV cell dimensions. The cell has a 20 × 20 mm surface area and a 0.2 mm thickness. The busbar and fingers are thick, at 0.015 mm. The seven fingers are separated by 2.66 mm.
The main dimensions and properties of the different materials of the V-trough PV model are listed in Table 1.
Table 1’s thermal conductivity values are indicative of inherent material characteristics. Although heat dissipation is influenced by thickness, the values mentioned are typical for the specified layers and correspond to realistic V-trough PV systems.
The four designs were developed based on the fundamental equations of V-trough concentrators explained by Hollands [30]. These LCPVs were designed by considering the DNI to ensure that the direct rays that hit the left top point of the reflector reach the right end of the receiver using the image method [30]. The PV panel width and the reflector’s opening angles define its effective length. Indeed, since the usable length is equal to the reflector’s width, the entire incoming sunlight may be reflected onto the receiver area. Therefore, the useful reflector length is calculated using a trigonometric relationship [31], expressed by Equation (1):
L W = C o s ϴ S i n ( ϴ 2 )
where L is the reflector length, W is the width of the PV panel, and ϴ is the reflector tilt angle. A simple scheme of a V-trough concentrator is shown in Figure 5.
Table 2 lists the geometrical parameters of each design at three tilt angles.
The concentration ratio is measured by dividing the local sun power intensity ( Q p ) over the DNI. It is expressed as follows:
C r o p t = l o c a l   s u n   p o w e r   i n t e n s i t y   ( Q p ) D N I
Using COMSOL Multiphysics, a bidirectional study based on the coupling of the “heat transfer in solids” to the “geometrical optics module” will be explained, and the governing equations of the heat transfer will be mentioned. Furthermore, for the semiconductor’s electrical characteristics, the Shockley–Read–Hall recombination process, along with the main equation for the photo-generation rate, will be stated.
A set of coupled first-order differential equations is used for modeling the ray-tracing propagation in COMSOL Multiphysics version 5.2:
d k d t = ω q
d q d t = ω k
where k (rad/m) is the wave vector, t (s) is time, ω (rad/s) is the angular frequency, and q (m) is the vector of the ray position. In a case study of an isotropic medium, the frequency is related to the wave vector by the following equation:
ω = c | k | n ( q )
where c = 2.99 × 10⁸ m/s is the speed of light in a vacuum and n is the refractive index.

2.2. Heat Transfer Model

The ray heat source is used to calculate the fraction of energy heat being dissipated as heat within a solar cell. Thus, the absorbed rays will affect the receiver temperature due to the ray’s power being absorbed by the receiver.
The main equations used in the heat transfer model are the following:
ρ C p T t α p p t = · q + φ + Q
σ is the stress tensor, and it is expressed as the following:
σ = p I + μ V + V T 2 3 μ μ B · V I
where μ and μ B are, respectively, the dynamic viscosity (shear friction losses) and the bulk viscosity (compressibility losses).
φ refers to heat viscous dissipation term, which is formulated as function of the velocity vector:
φ = τ V : V
and Q and q are, respectively, the heat source term and the conduction heat transfer.
The conduction heat transfer is governed by Fourier’s Law:
q = k T
The term of heat source, Q , refers to the amount of the fraction of deposited ray power that is converted into generated heat on the solar cells, and it is expressed as the following:
Q = 1 A i   Q j
where A i is the inlet aperture area and Q i is the sum of rays’ amount of transferring power ( W a t t s ) onto a surface area.

2.3. Solar Cell Model

For the first time, a three-dimensional (3D) simulation of a ray-tracing optical module is coupled to the semiconductor model, which in turn is coupled to a heat transfer model distribution in Si-solar cells. The solar cell is modeled as a 3D silicon p-n junction with carrier generation and Shockley–Read–Hall recombination. The p-n junction is formed by p-doping the front surface of an n-type Si wafer. The uniform bulk n-doping is assumed to be 1 × 1016 cm−3. The front surface p-doping is assumed to have a peak concentration of 1 × 10 16   c m 13 , and a Gaussian drop-off with a junction depth of 0.25 μm. Instead, for simplicity, a user-defined spatially dependent variable is created for the generation rate, using an integral expression involving the solar irradiance and silicon absorption spectra. In addition, the trap-assisted recombination model is selected to set the electron and hole recombination rates, as the solar cell is made from an indirect band-gap single layer of semiconductor material (silicon) under low electric fields. Under normal operating conditions, photo-generated carriers are swept to each side of the depletion region of the p-n junction. A small forward bias voltage is applied to extract the electrical power, given by the product of the photocurrent and the applied voltage.
Semiconductor physics is used to determine the electrical performance of the Enhanced Double V-trough Concentrator. The semiconductor interface resolves the drift–diffusion equations for the holes and electrons, as well as Poisson’s equation for the electric potential. The semiconductor model, which is the default domain feature, adds these equations to the domain and solves for the electric potential as well as dependent variables related to the concentrations of holes and electrons. Poisson’s equation takes the following form:
· Ɛ r V = q p n + N d + N a
where V and Ɛr are the electric field and the relative permittivity, respectively.
The current continuity equations are given by
n t = 1 q J n U n
n t = 1 q J p U p
where J n and J p are the electron and hole current density, respectively. U n = R n , i G n , i is the net electron recombination rate from all generation ( G n , i ) and recombination mechanisms ( R n , i ). Similarly, U p is the net hole recombination rate from all generation ( G p , i ) and recombination mechanisms ( R p , i ). Note that, in most circumstances, U n = U p . The trap-assisted recombination model is selected to set the electron and hole recombination rates, as the solar cell is made from an indirect band-gap single layer of semiconductor material (silicon) under low electric fields. For a steady-state Shockley–Read–Hall recombination model, a continuous density of trap states at energies within the band gap is specified. Degrees of freedom are added to the equation system to represent the occupancy of traps at a particular energy. The Shockley–Read–Hall recombination rate is defined as
R n = R p = n p n i , m o d 2 τ p n + n 1   τ n p + p 1
Where:   n i , m o d = γ n γ p N c 0 N ϑ 0   e x p E g E g 2 V t h
n 1 = γ n N c 0 N ϑ 0 e x p E g E g 2 V t h e x p E t V t h
p 1 = γ p γ p N c 0 N ϑ 0 e x p E g E g 2 V t h e x p E t V t h
where γ n and γ p are the electron and hole degeneracy factors; N c 0 and N ϑ 0 are the effective densities of states for the conduction and valence bands; E g is the band gap; E g is the band-gap narrowing energies scaled by the electron charge; q · V t h = K B T q , where K B is Boltzmann’s constant and T is the temperature. The parameters τ n and τ p are carrier lifetime, and E t is the trap energy level scaled by the electron charge.
A flowchart diagram of the computational methodology is depicted in Figure 6.

2.4. Assumptions

Some assumptions are taken into consideration, which are the following:
    i.
Direct normal irradiance of 1000 W/m2.
   ii.
The maximum sun disc angle is assumed to be 4.65 mrad.
  iii.
The number of released rays is set to 100,000 rays per release.
  iv.
Absorption coefficient of 0 and 0.3 for ideal case and real case, respectively.
   v.
Air density is kept at 1 kg/m3.
  vi.
Wind velocity is set to 1 m/s.
 vii.
Ambient temperature of 25 °C.
viii.
Absolute pressure is kept at 1 a.m.
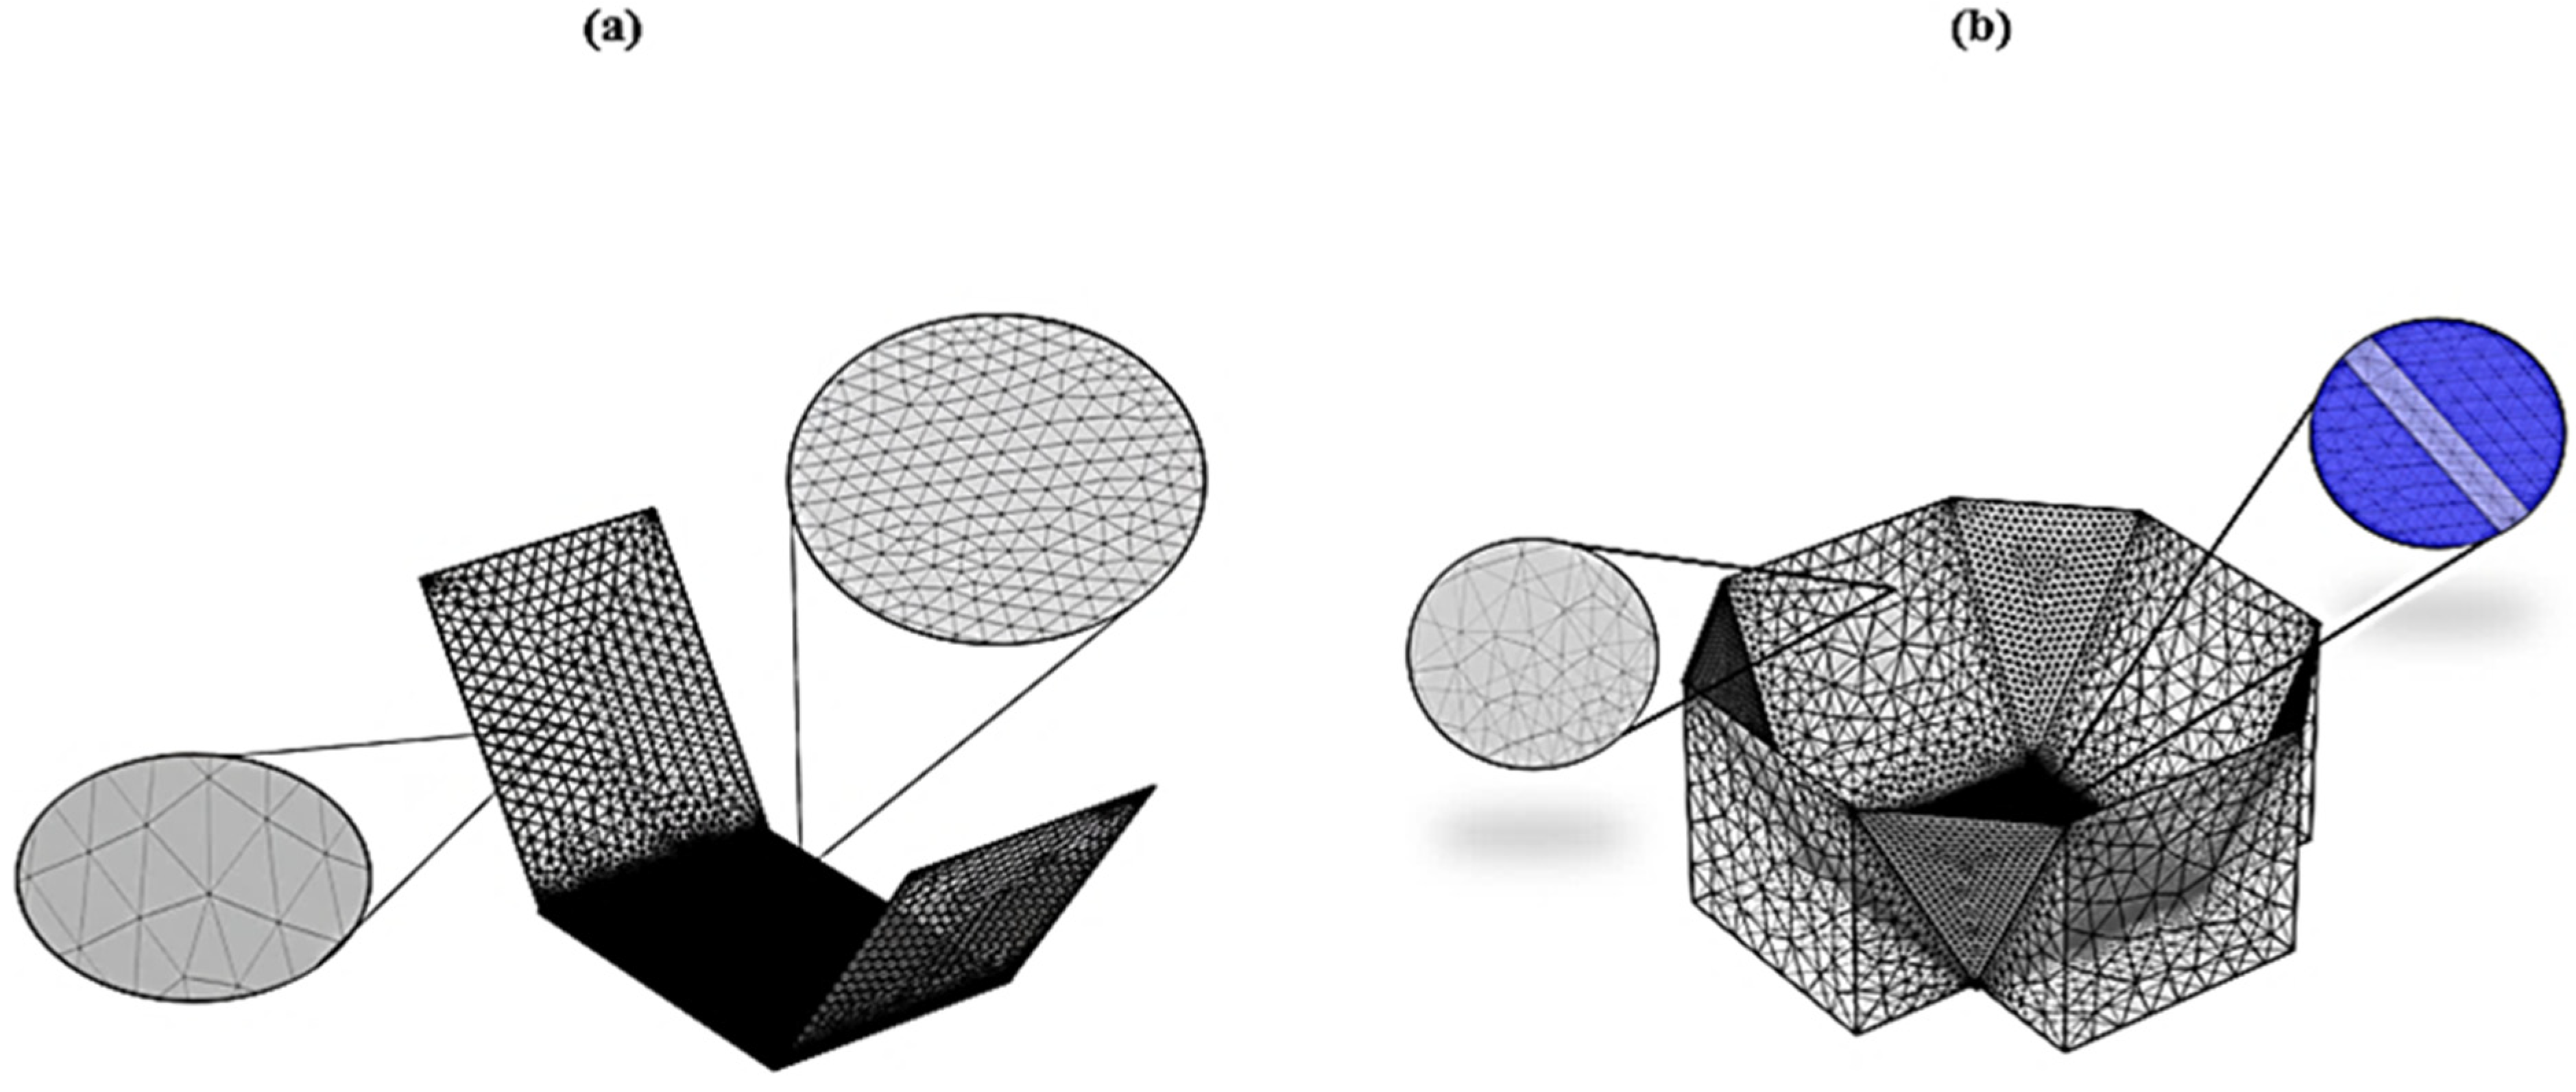
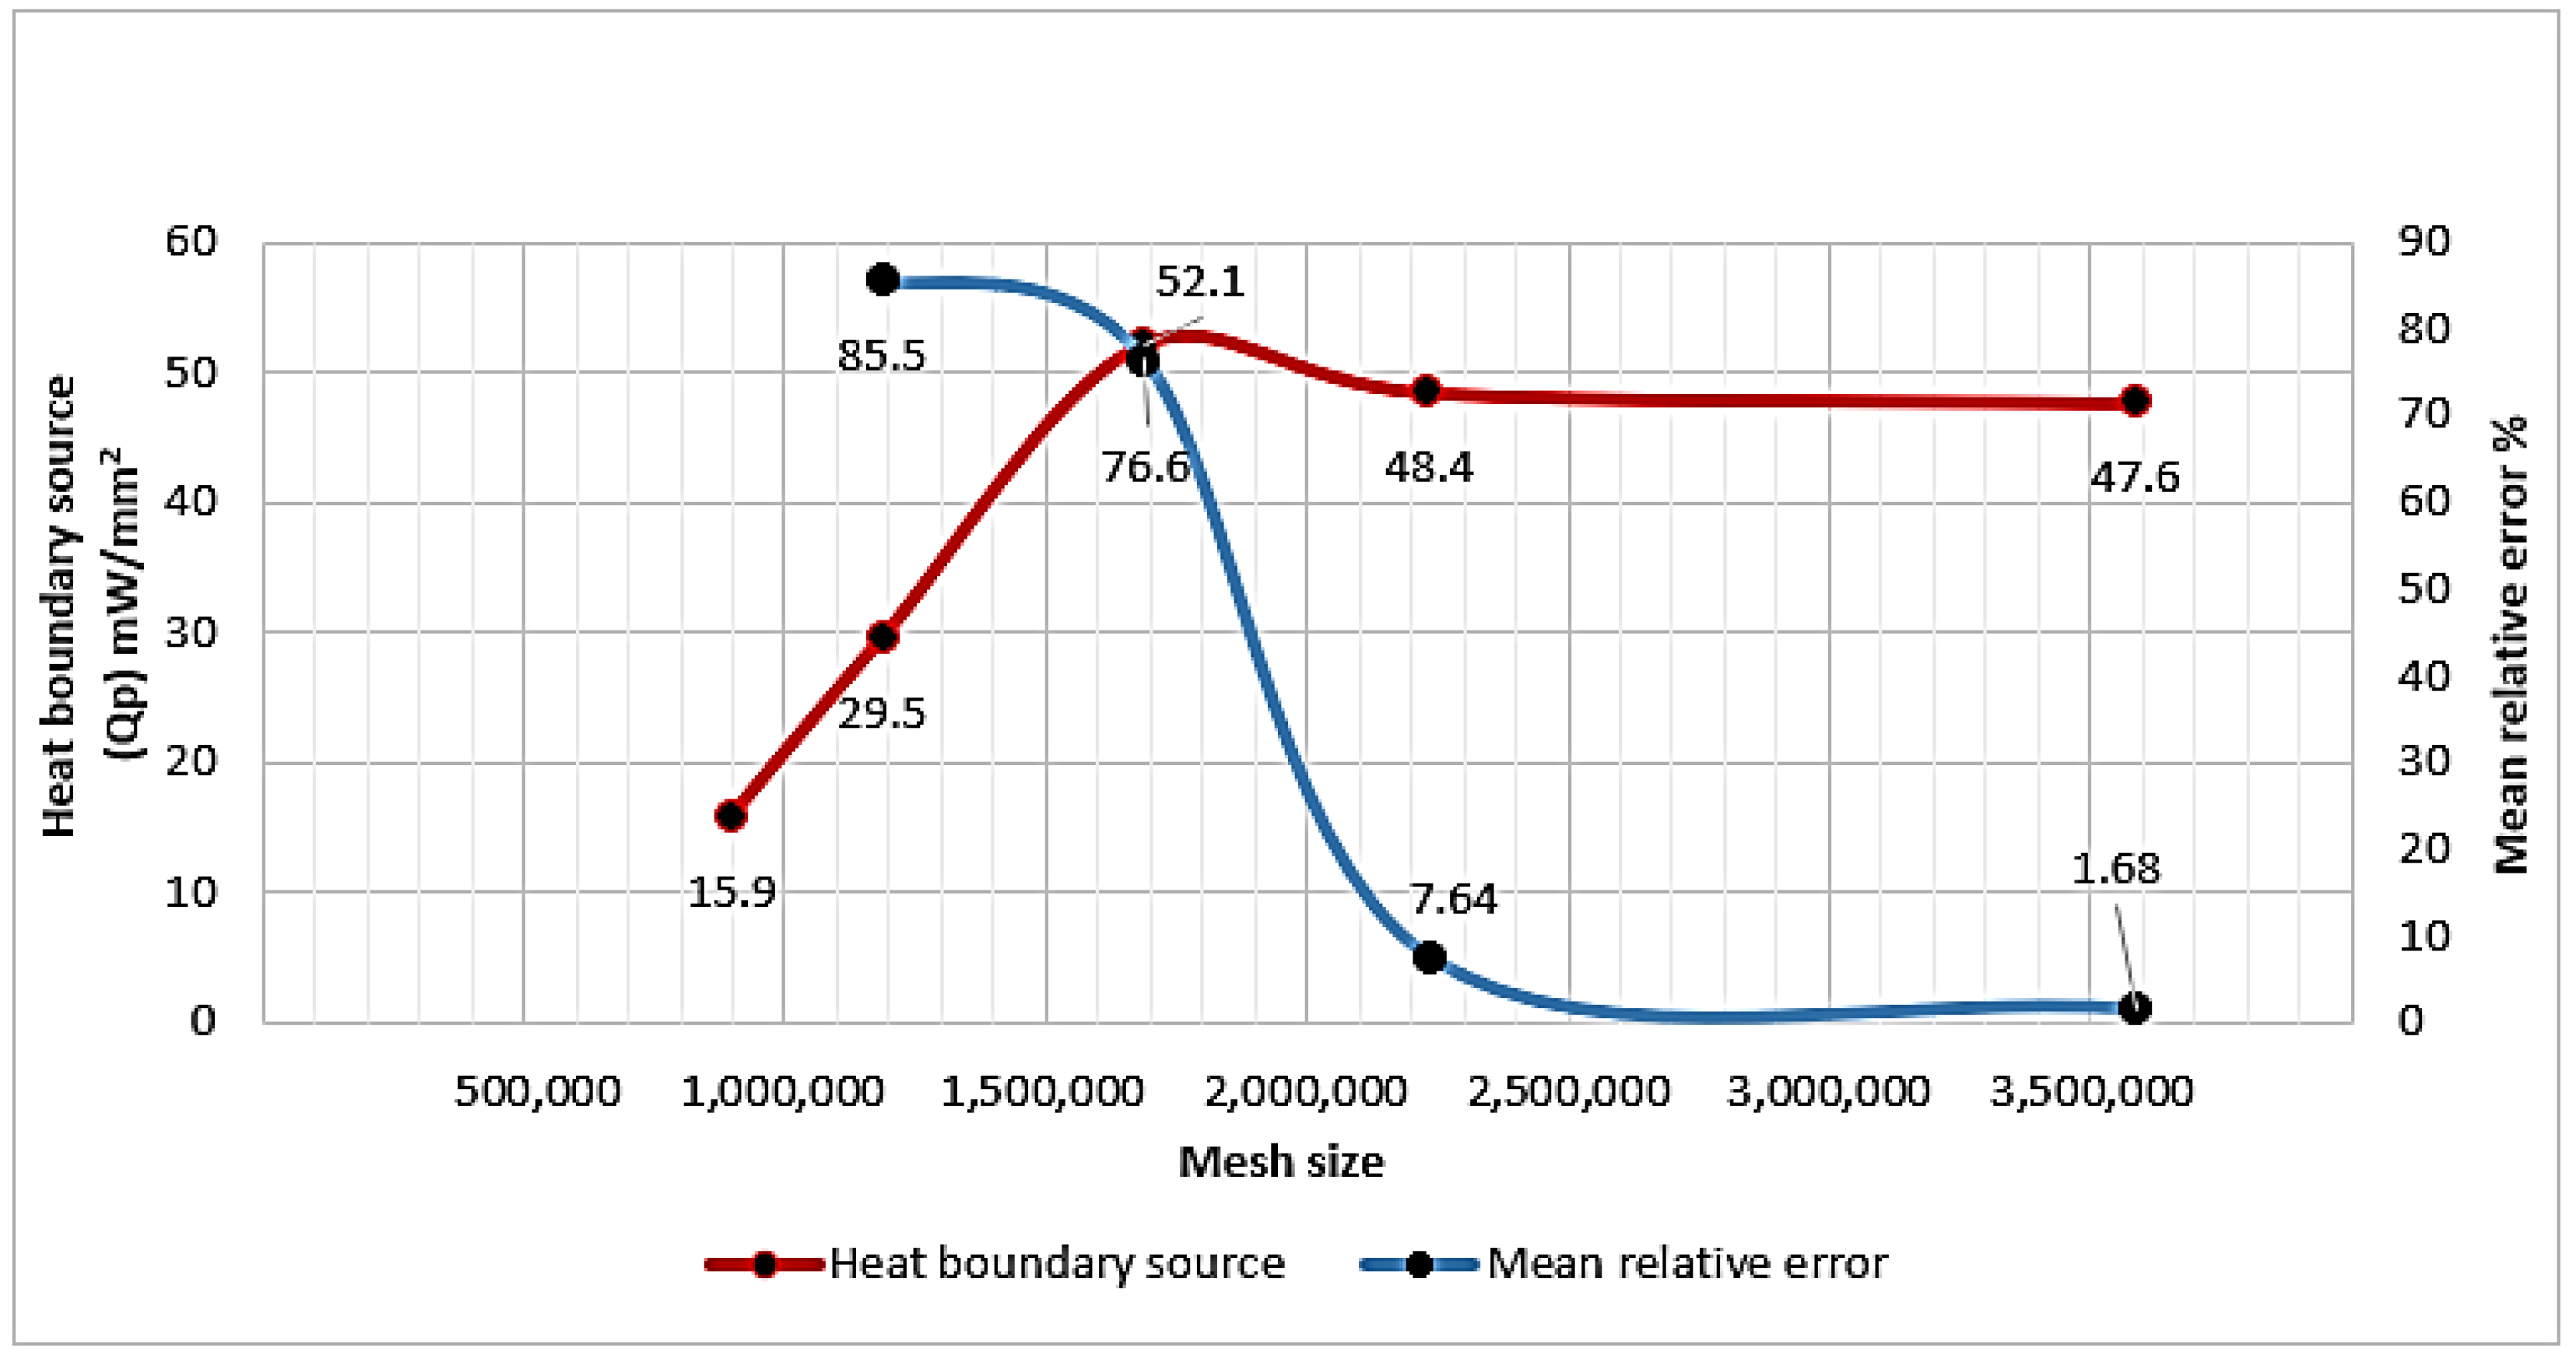
2.5. Generated Mesh

The size of the generated mesh is one of the most challenging criteria for global and convergent numerical solutions. This is because the mesh size can affect the accuracy of the numerical outcomes and the required computational time of the developed models. COMSOL software uses one of the best numerical techniques for computing and solving the mesh density analysis. The numerical schemes are based on Finite Element Analysis (FEA). Figure 7 illustrates the generated mesh of the V-trough and EDV concentrators. Different mesh qualities are represented by different colors in Figure 7b.
To run a mesh sensitivity analysis, the first step is to increase the mesh resolution by selecting smaller mesh sizes and running simulations. Then, compare, for each mesh size, the actual solution value with its closed predecessor. The optimal mesh is selected when the mean relative error of the numerical solution between two mesh sizes is below the convergence criterion, which is set to 2%. The relative mean error is the following:
R E = Q p ( j ) Q p ( j 1 ) Q p ( j 1 )
where Q p ( j ) and Q p ( j 1 ) are, respectively, the heat boundary source within the cell domain for the jth mesh size and its closed predecessor jth − 1 mesh. Figure 8 displays the trending variation in the heat boundary source and the relative mean error versus the receiver mesh size. As shown in Figure 8, as the number of mesh elements increases, starting from the coarser (693,367 elements) to the customized extra-fine grid size (4783.895), the relative mean error decreases till it reaches the minimum value of 1.68%, at which point the numerical model is judged as converged.

3. Results and Analysis

3.1. Optical Model Validation

For a reflector length of 35 mm, Figure 9a shows a maximum heat boundary source (focused rays’ power intensity) of 2.07 mW/mm2, while the ray path pattern shows overlapped reflected rays (Figure 9b). Therefore, the extra length of the reflector will cost more without an effective contribution to the concentrated solar densities. Using Equation (3), the useful length of the reflector was determined. After the truncation of 19.79 mm from the reflector length, the new reflector has a useful length of only 15.21 mm. As shown in Figure 10a, the obtained heat boundary increased to become 2.08 mW/mm2, and the rays were more uniformly integrated over the receiver, as shown in Figure 10b. The same approach was considered and applied to find out the useful length at different tilt angles.
The optical model’s validation was accomplished with the same conditions (geometry, material proprieties, and boundary conditions) as stated by AL-Najideen [32]. Figure 11 shows the different V-trough concentrator designs validated using COMSOL Multiphysics. The pyramidal concentrator was designed to achieve higher geometrical concentration ratios. However, the reflected solar rays from the corners did not reach the receiver. Therefore, the corners were removed from the pyramidal concentrator, and a double V-trough concentrator (DVC) was developed. Even though the DVC has a lower aperture area, it has a higher optical efficiency.
In fact, different V-Trough designs were simulated using COMSOL Multiphysics to meet similar outcomes in terms of the optical efficiencies. In this study, we used an m-Si solar cell of 10 mm × 10 mm and four different tilt angles for every design. Table 3 shows the design parameters of the different tested solar concentrators.
Table 4 summarizes all the validation results for each model.
As shown in Table 3, the pyramidal concentrator design has a geometrical concentration ratio of 9.36× and an experimental concentration ratio of 4.7 suns, giving an optical efficiency of 50.2%. However, one can observe that the optical efficiency of the pyramidal concentrator design is lower than that of the conventional V-trough. As seen in Table 4, removing the four corners of the pyramidal design yields an increase in the optical efficiency by 38.6%, reaching 88.81%.
Figure 12 shows the local sun power intensity distribution of the conventional V-trough concentrator at a tilt angle of 65° and a height of 15.21 mm. This configuration results in geometrical and optical concentration ratios of 2.29× and 2.08 suns, respectively, which differ from the referenced model that achieved an optical concentration ratio of 2.07 suns. According to the results tabulated in Table 4, the absolute mean relative error between the results obtained by our model and those obtained experimentally by Al-Najideen et al. [32] did not exceed 2% in the worst case.
For the pyramidal concentrator, the design is characterized by a tilt angle of 71° and a height of 31.64 mm (see Figure 13). The results show a geometrical concentration ratio of 9.37× and an optical concentration ratio of 4.63 suns. The optical efficiency was found to be 49.41%, and the absolute mean relative error compared to [32] was around 1.57%.
Using a reflector tilt angle of 65°, the local sun power intensity distribution of the double V-trough concentrator is shown in Figure 14, with a geometrical concentration ratio of 3.16× and optical efficiency of 88.5%. The optical efficiency of the validated paper was 88.8%, with geometrical and experimental concentration ratios of 3.57× and 3.17 suns, respectively, which almost matches our results.

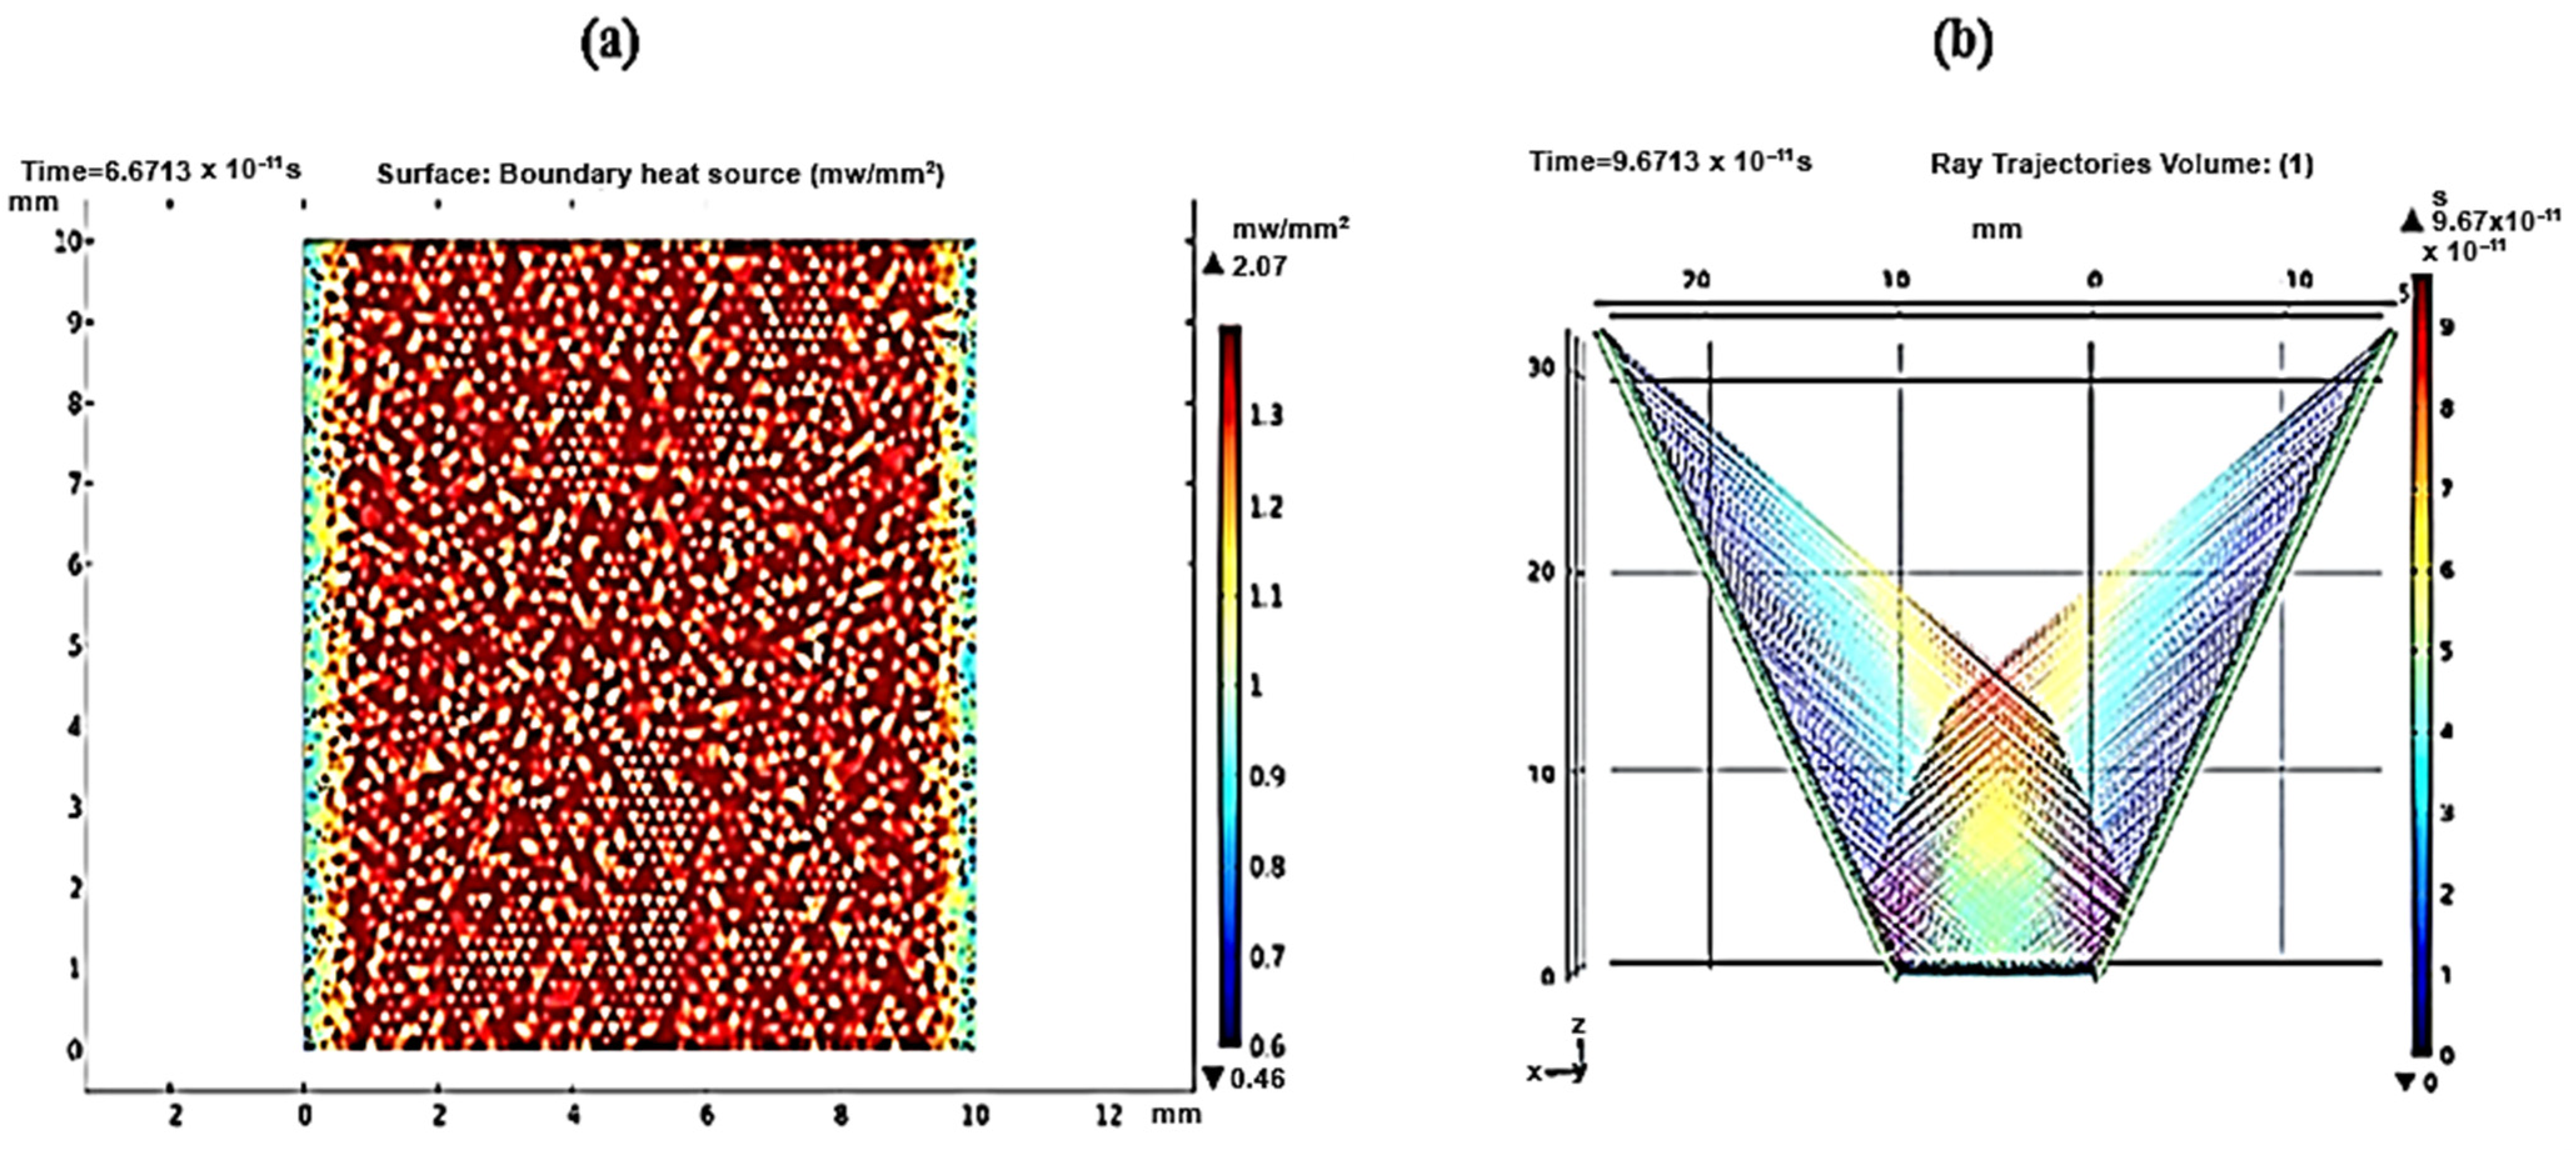
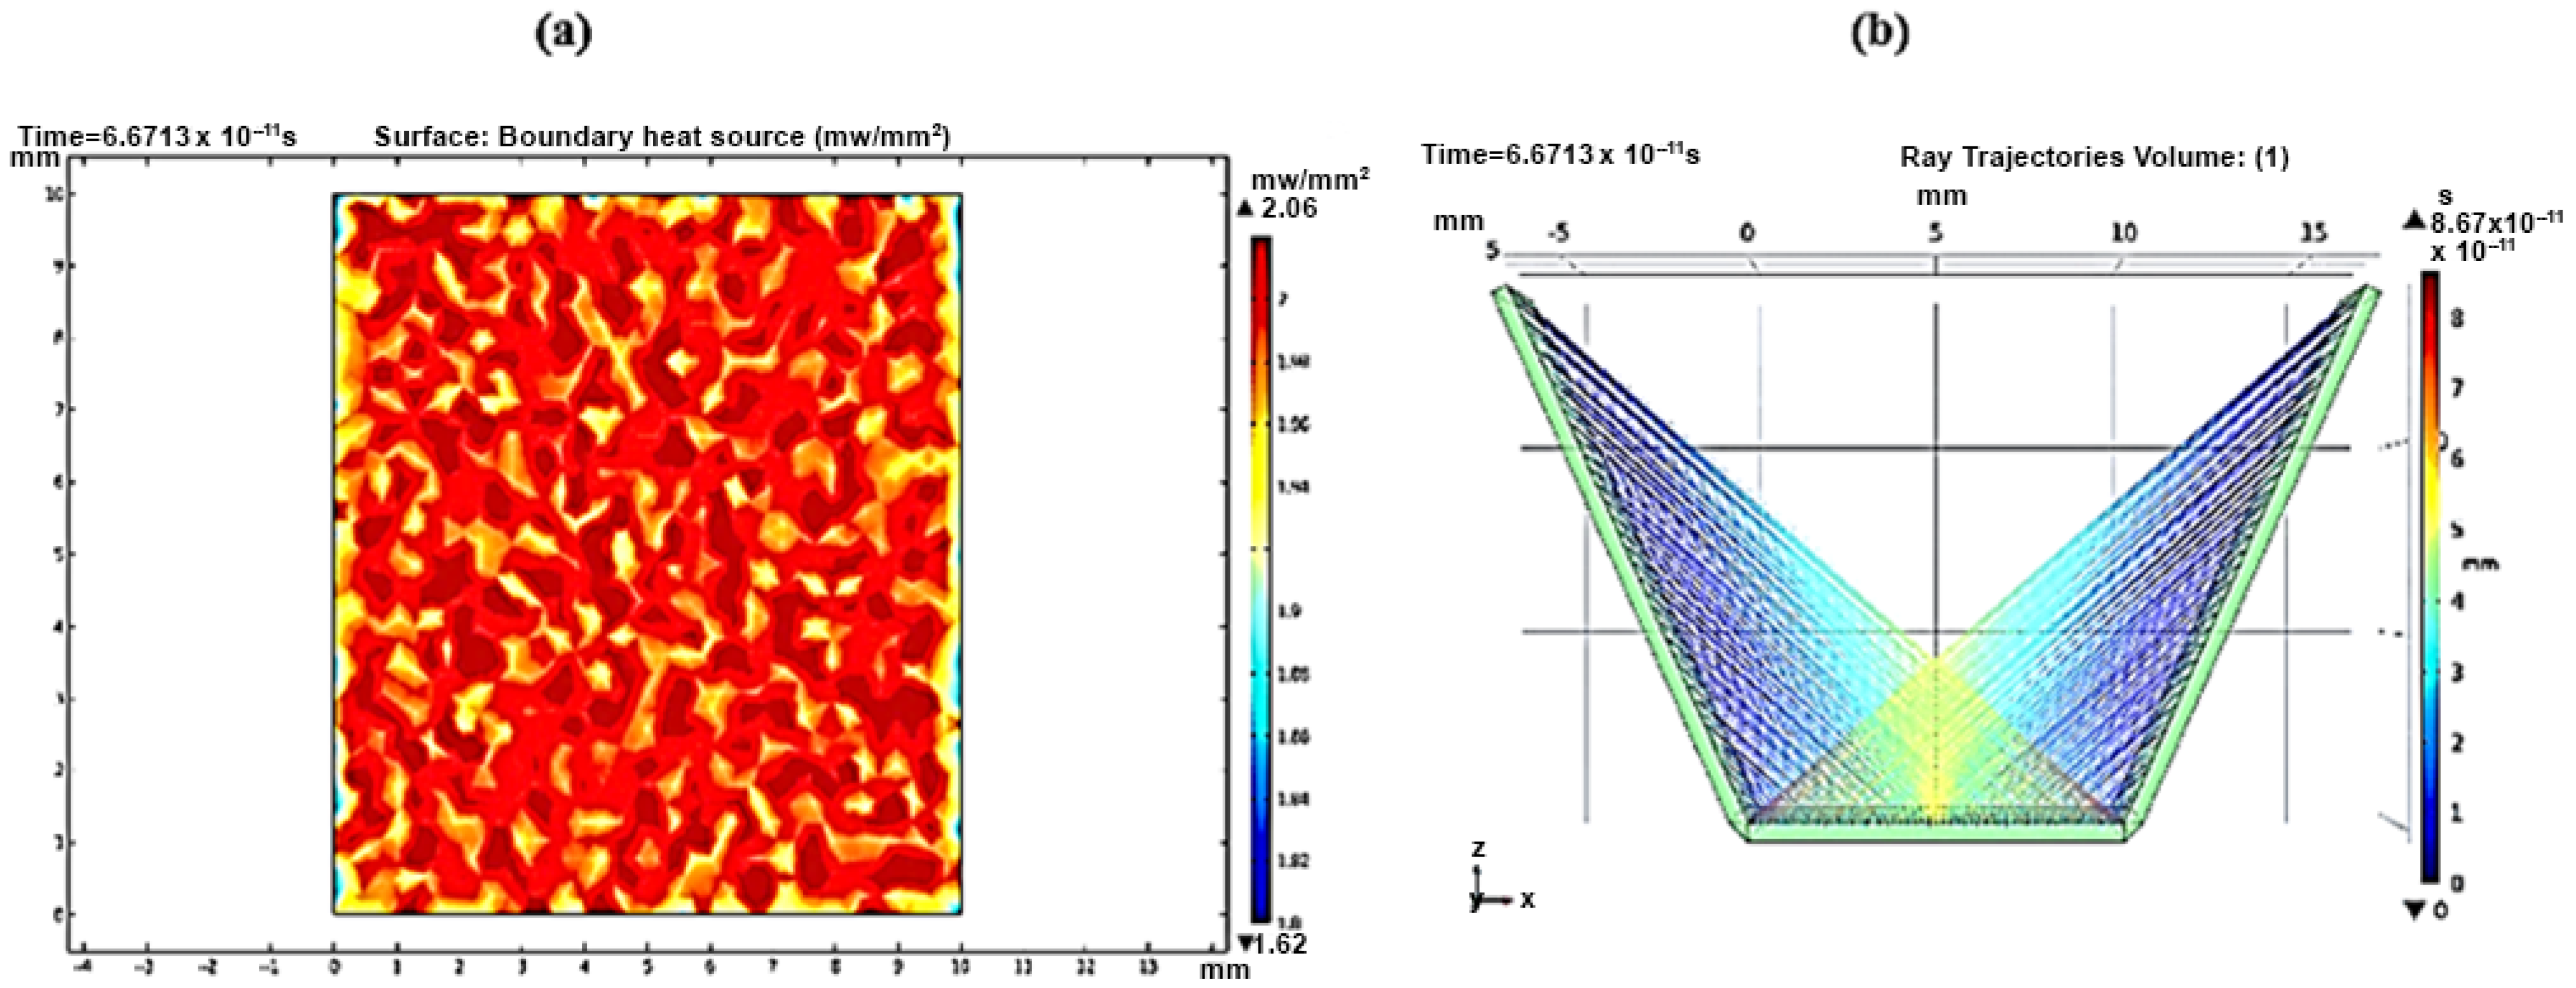
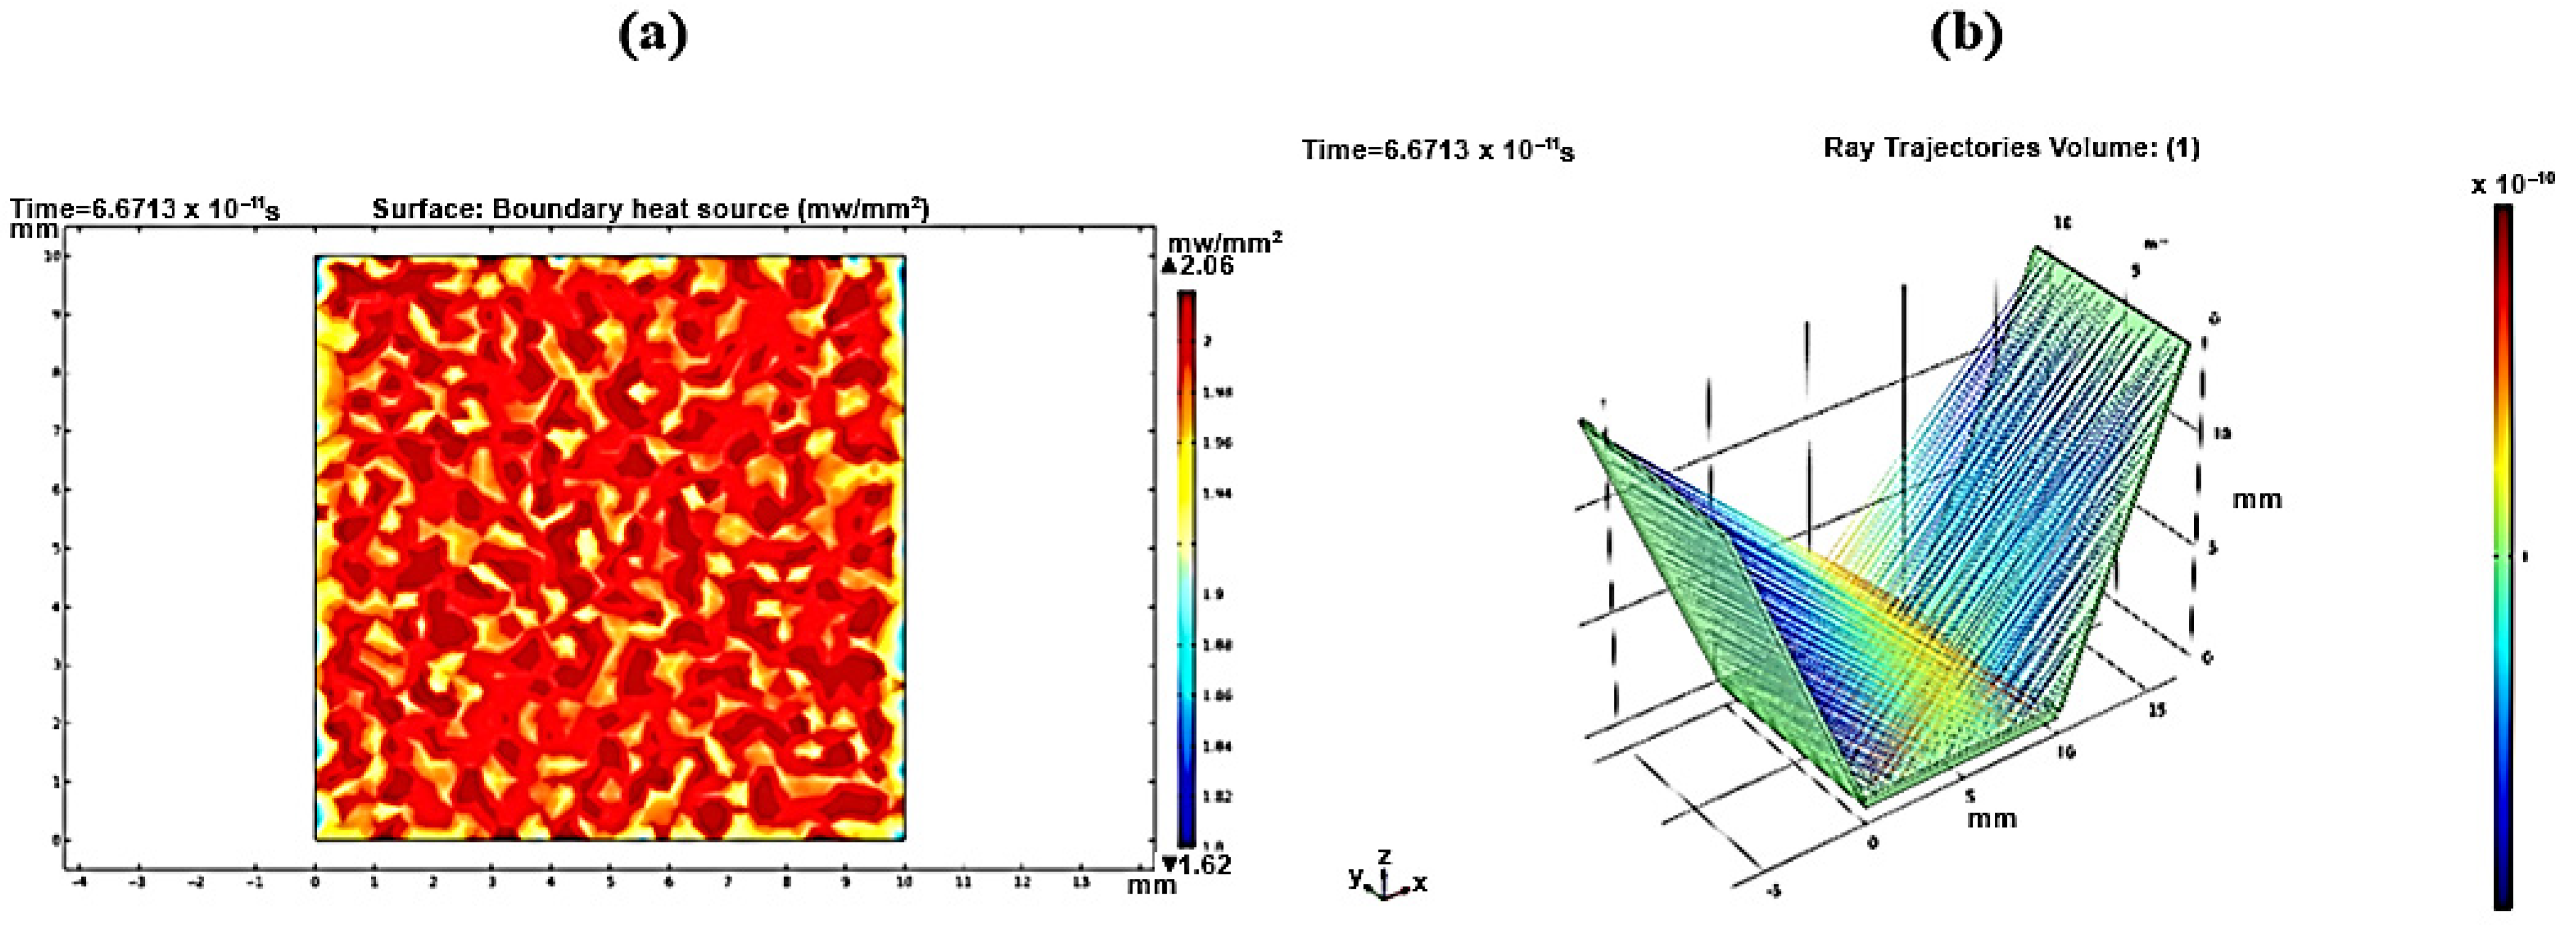
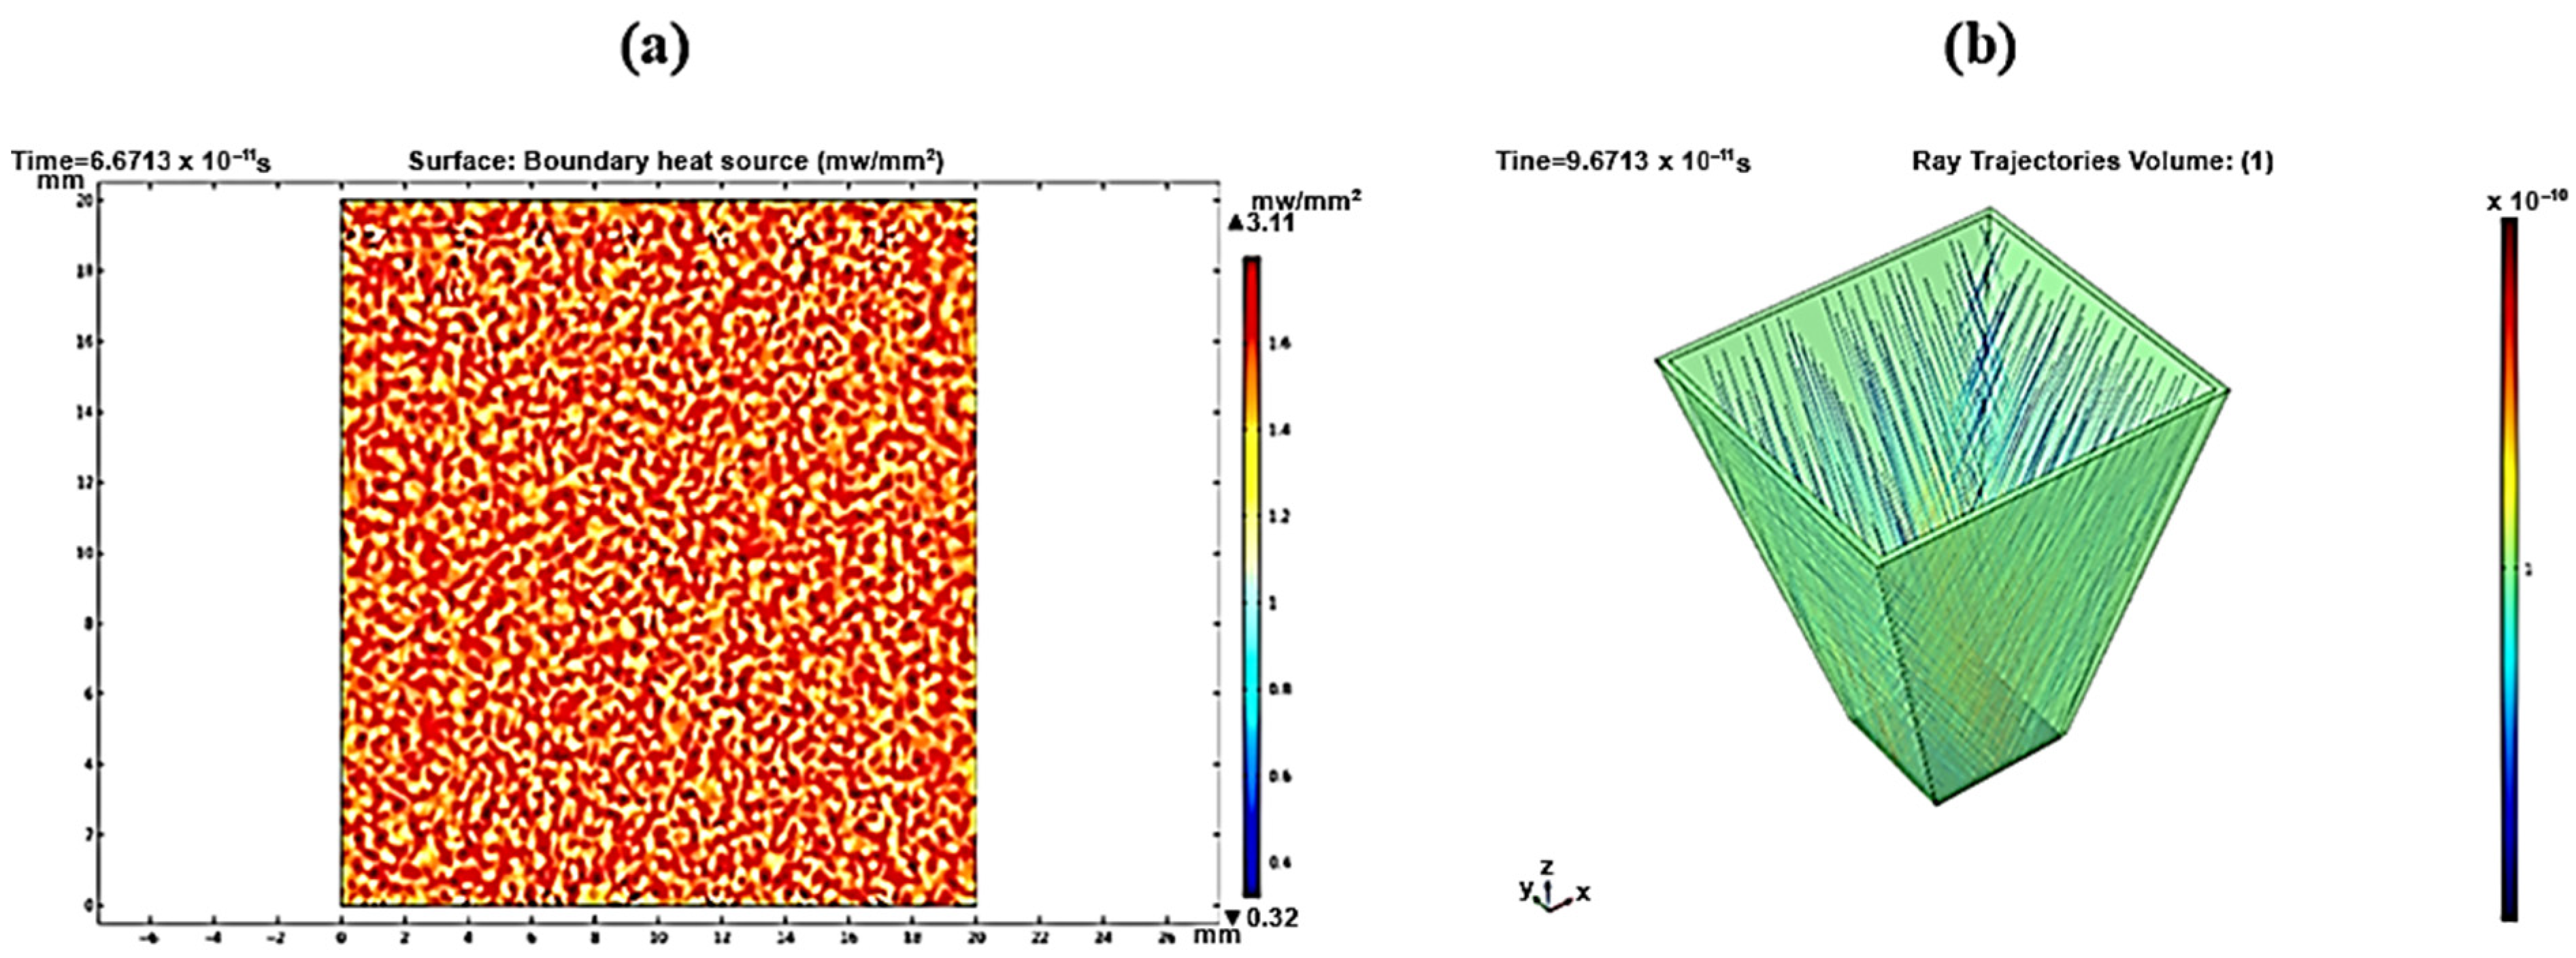
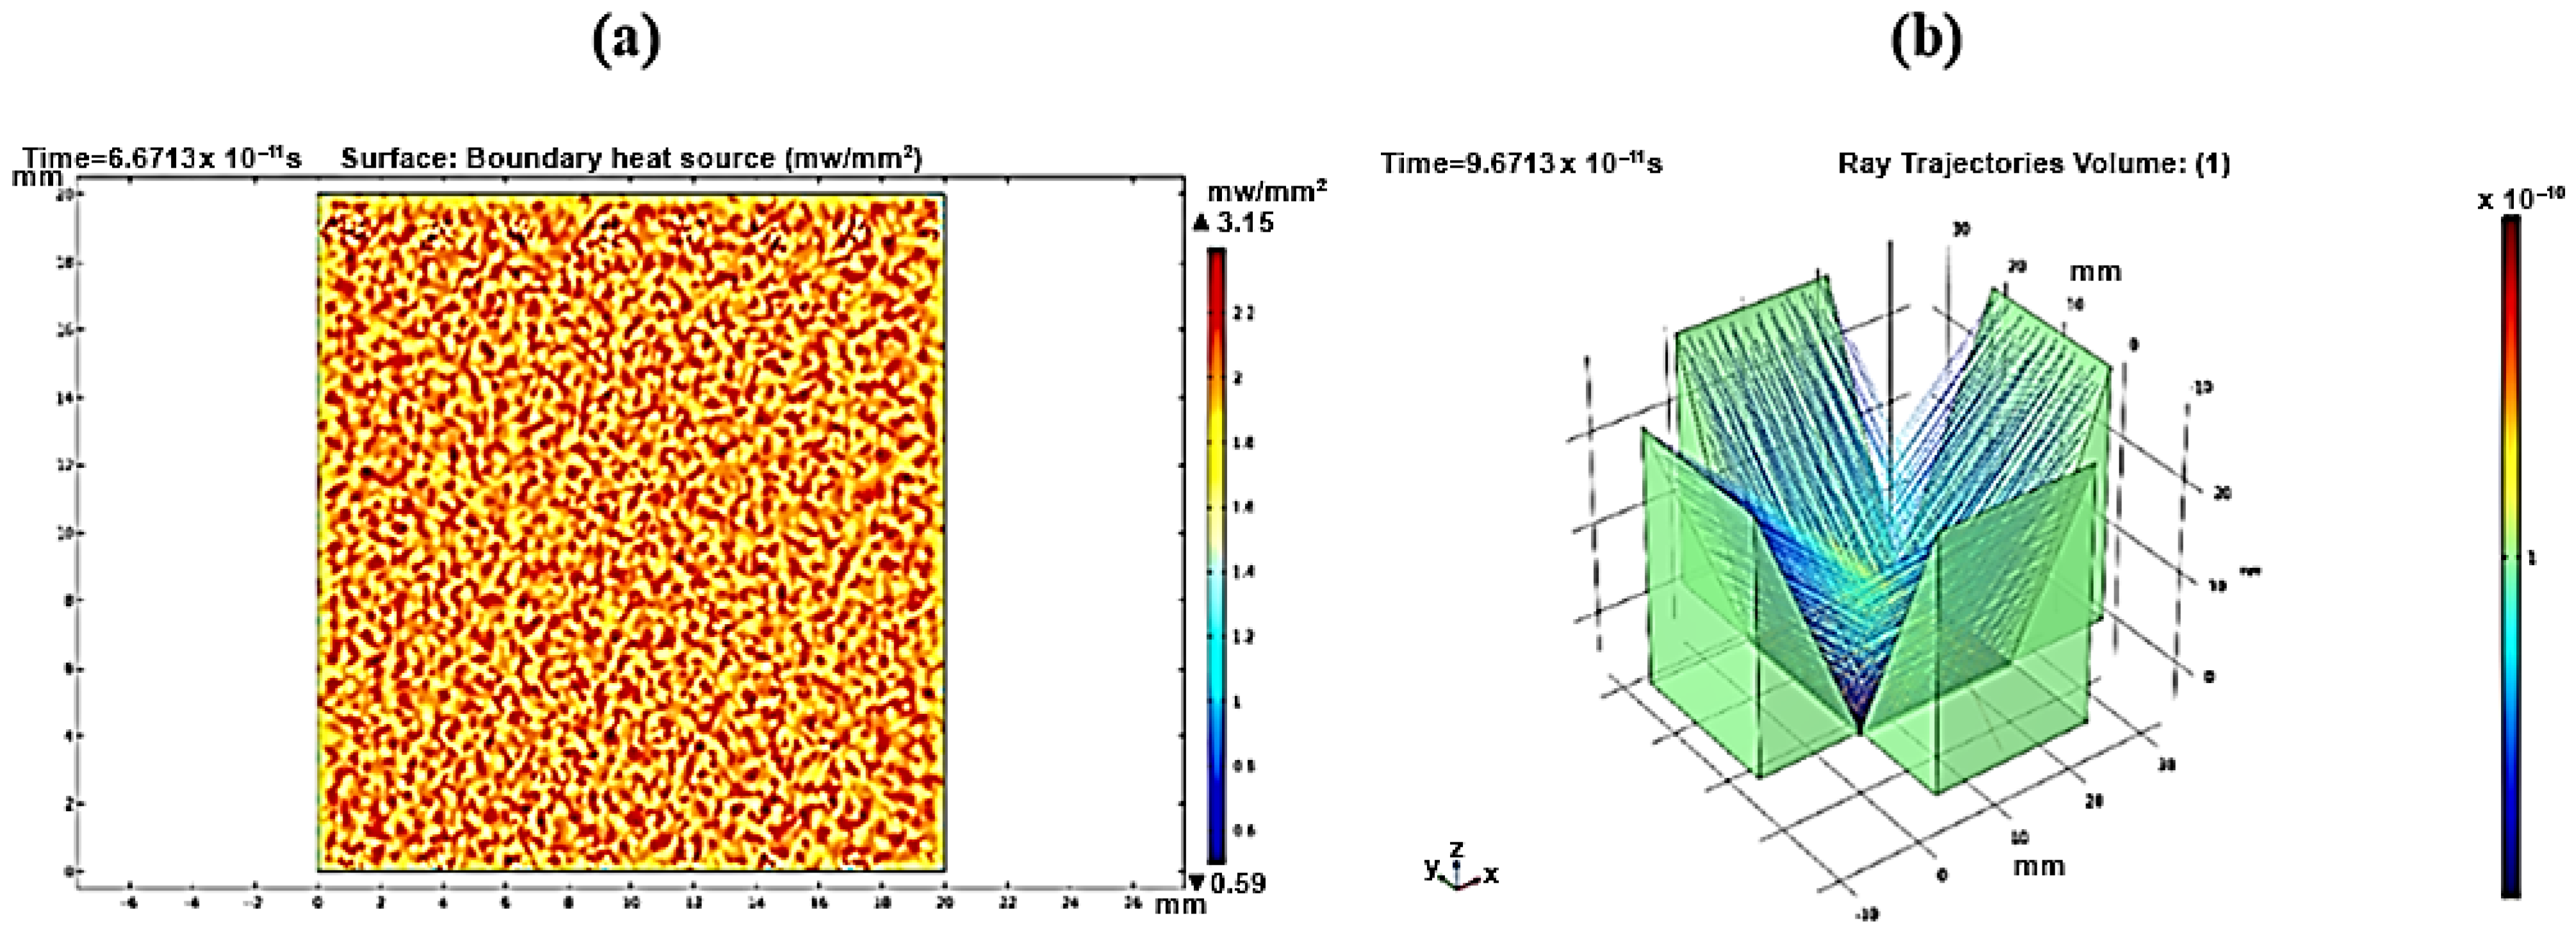
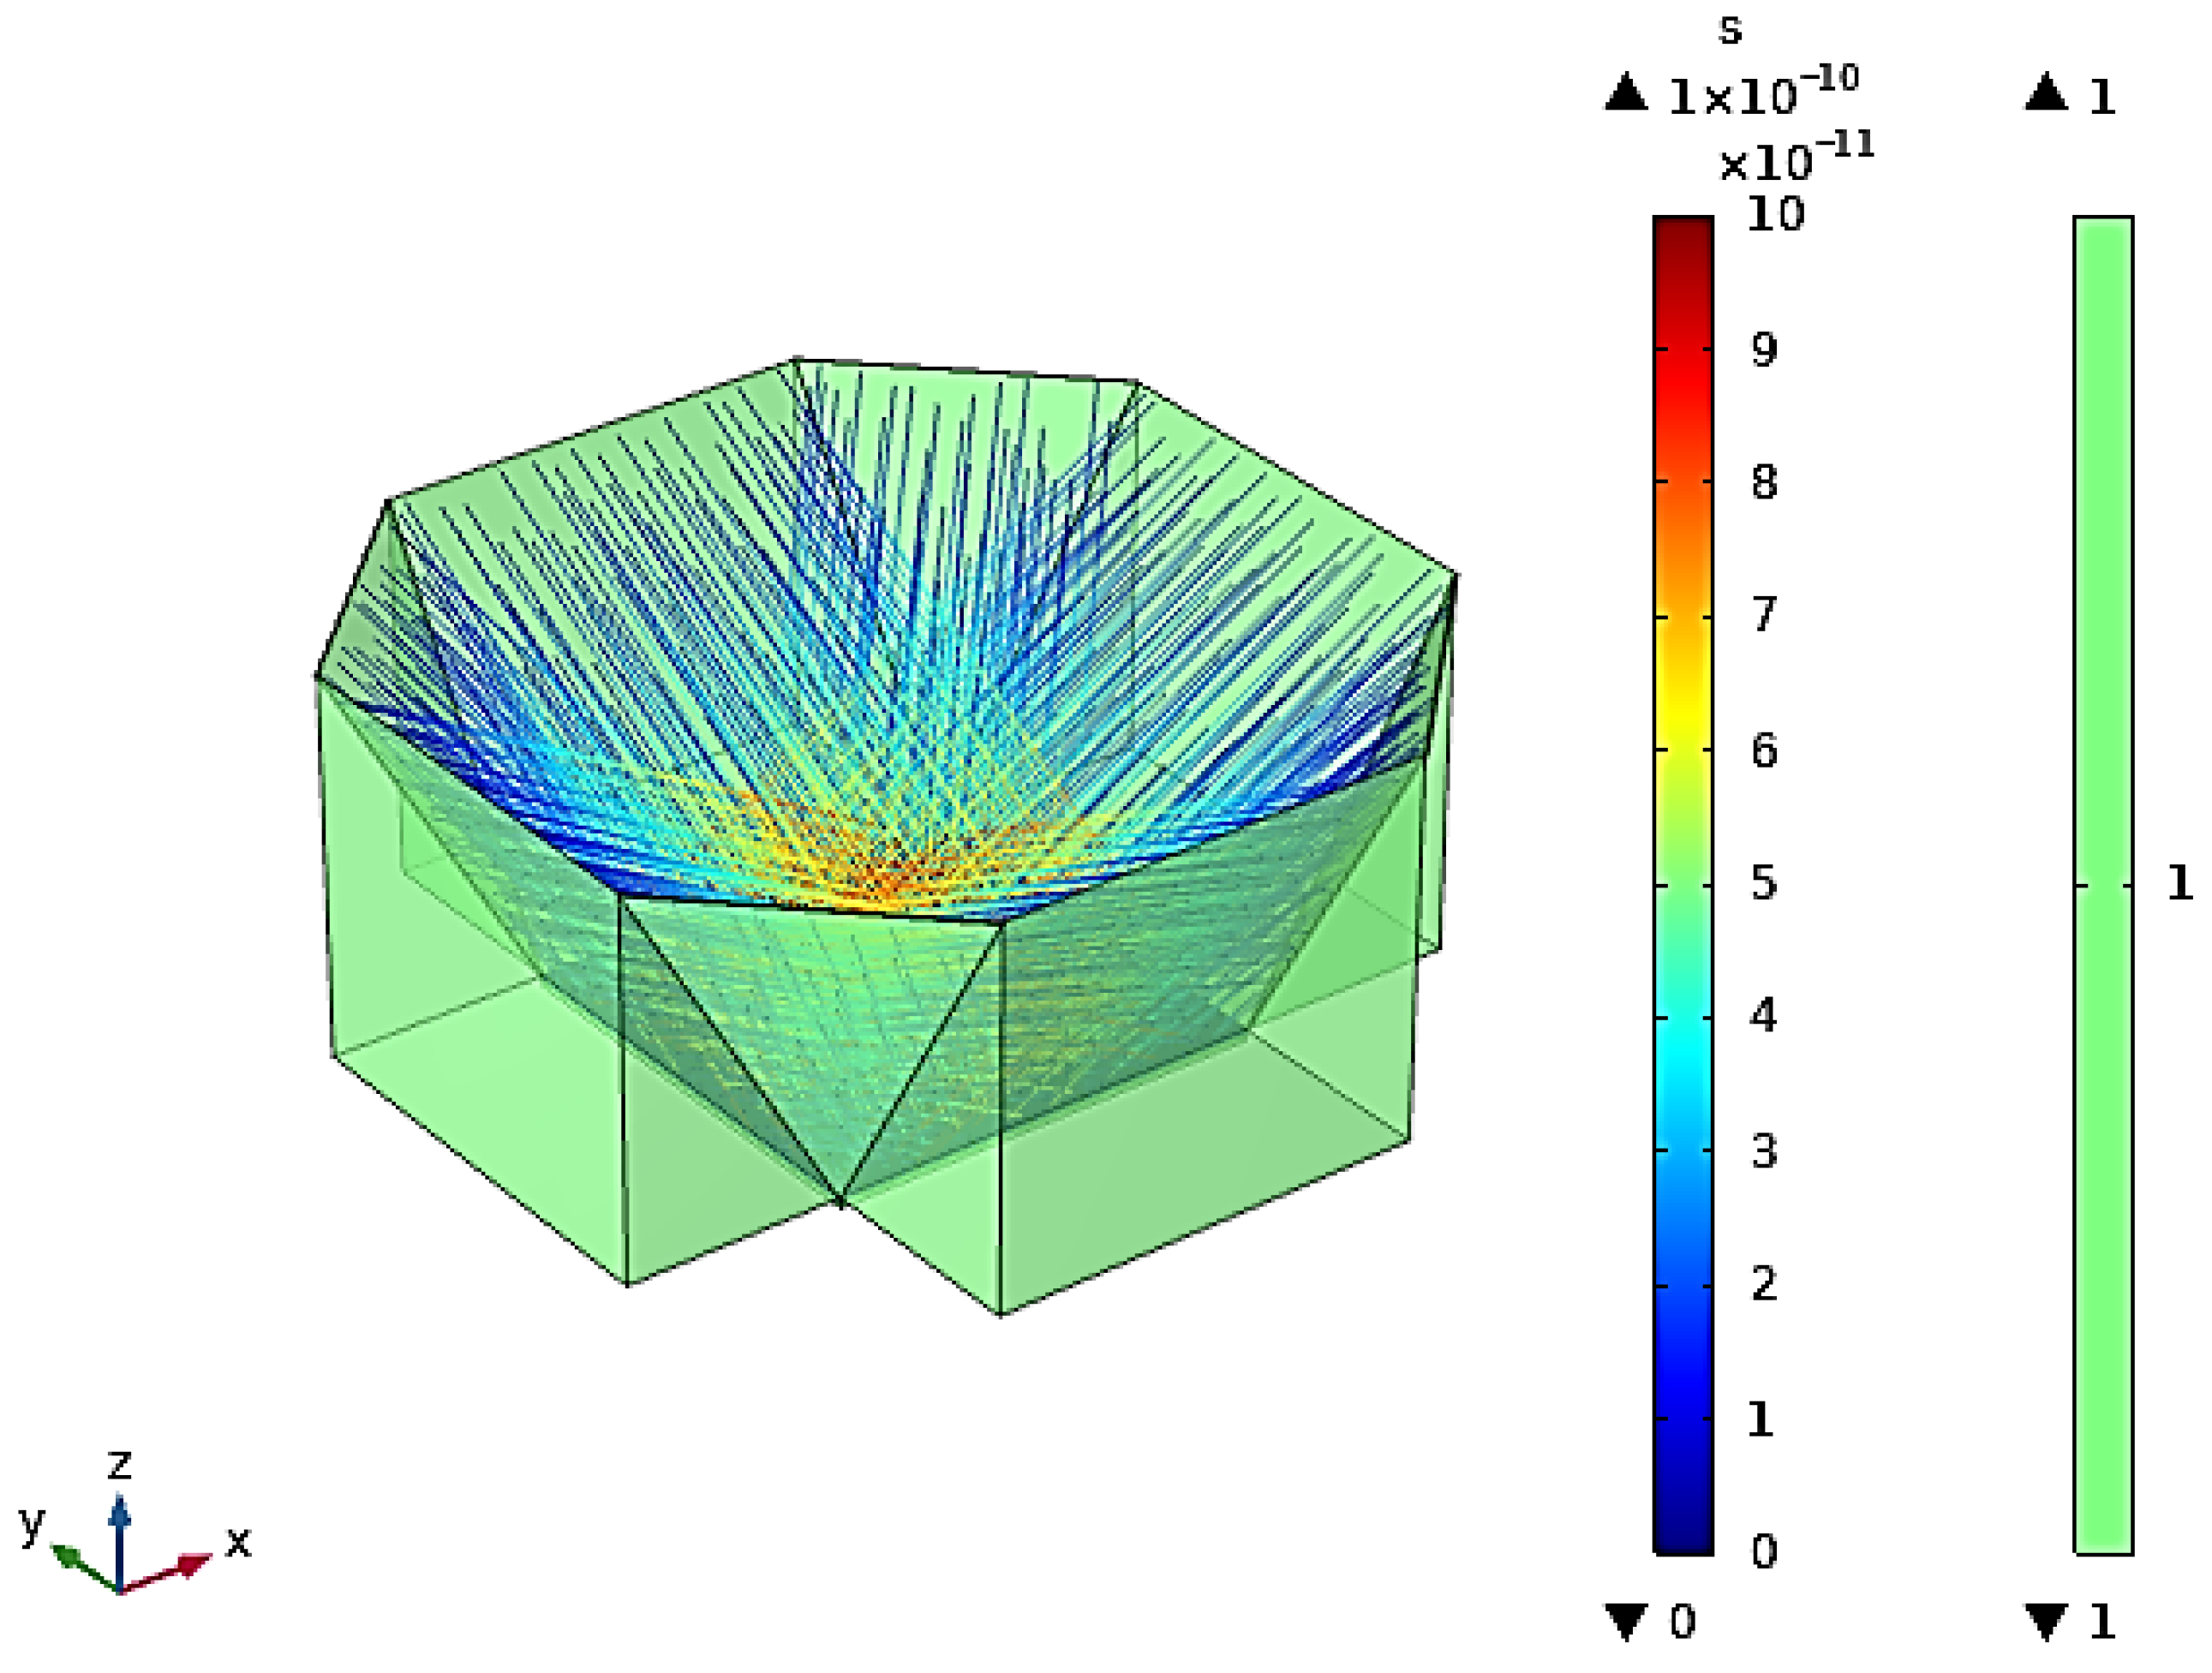
3.2. Ray Trajectories

The ray path from the lighted surface (the rays’ source) on the cell of the EDVC to the PV is shown in Figure 15. The ray distribution shows uniform distribution over the cell.

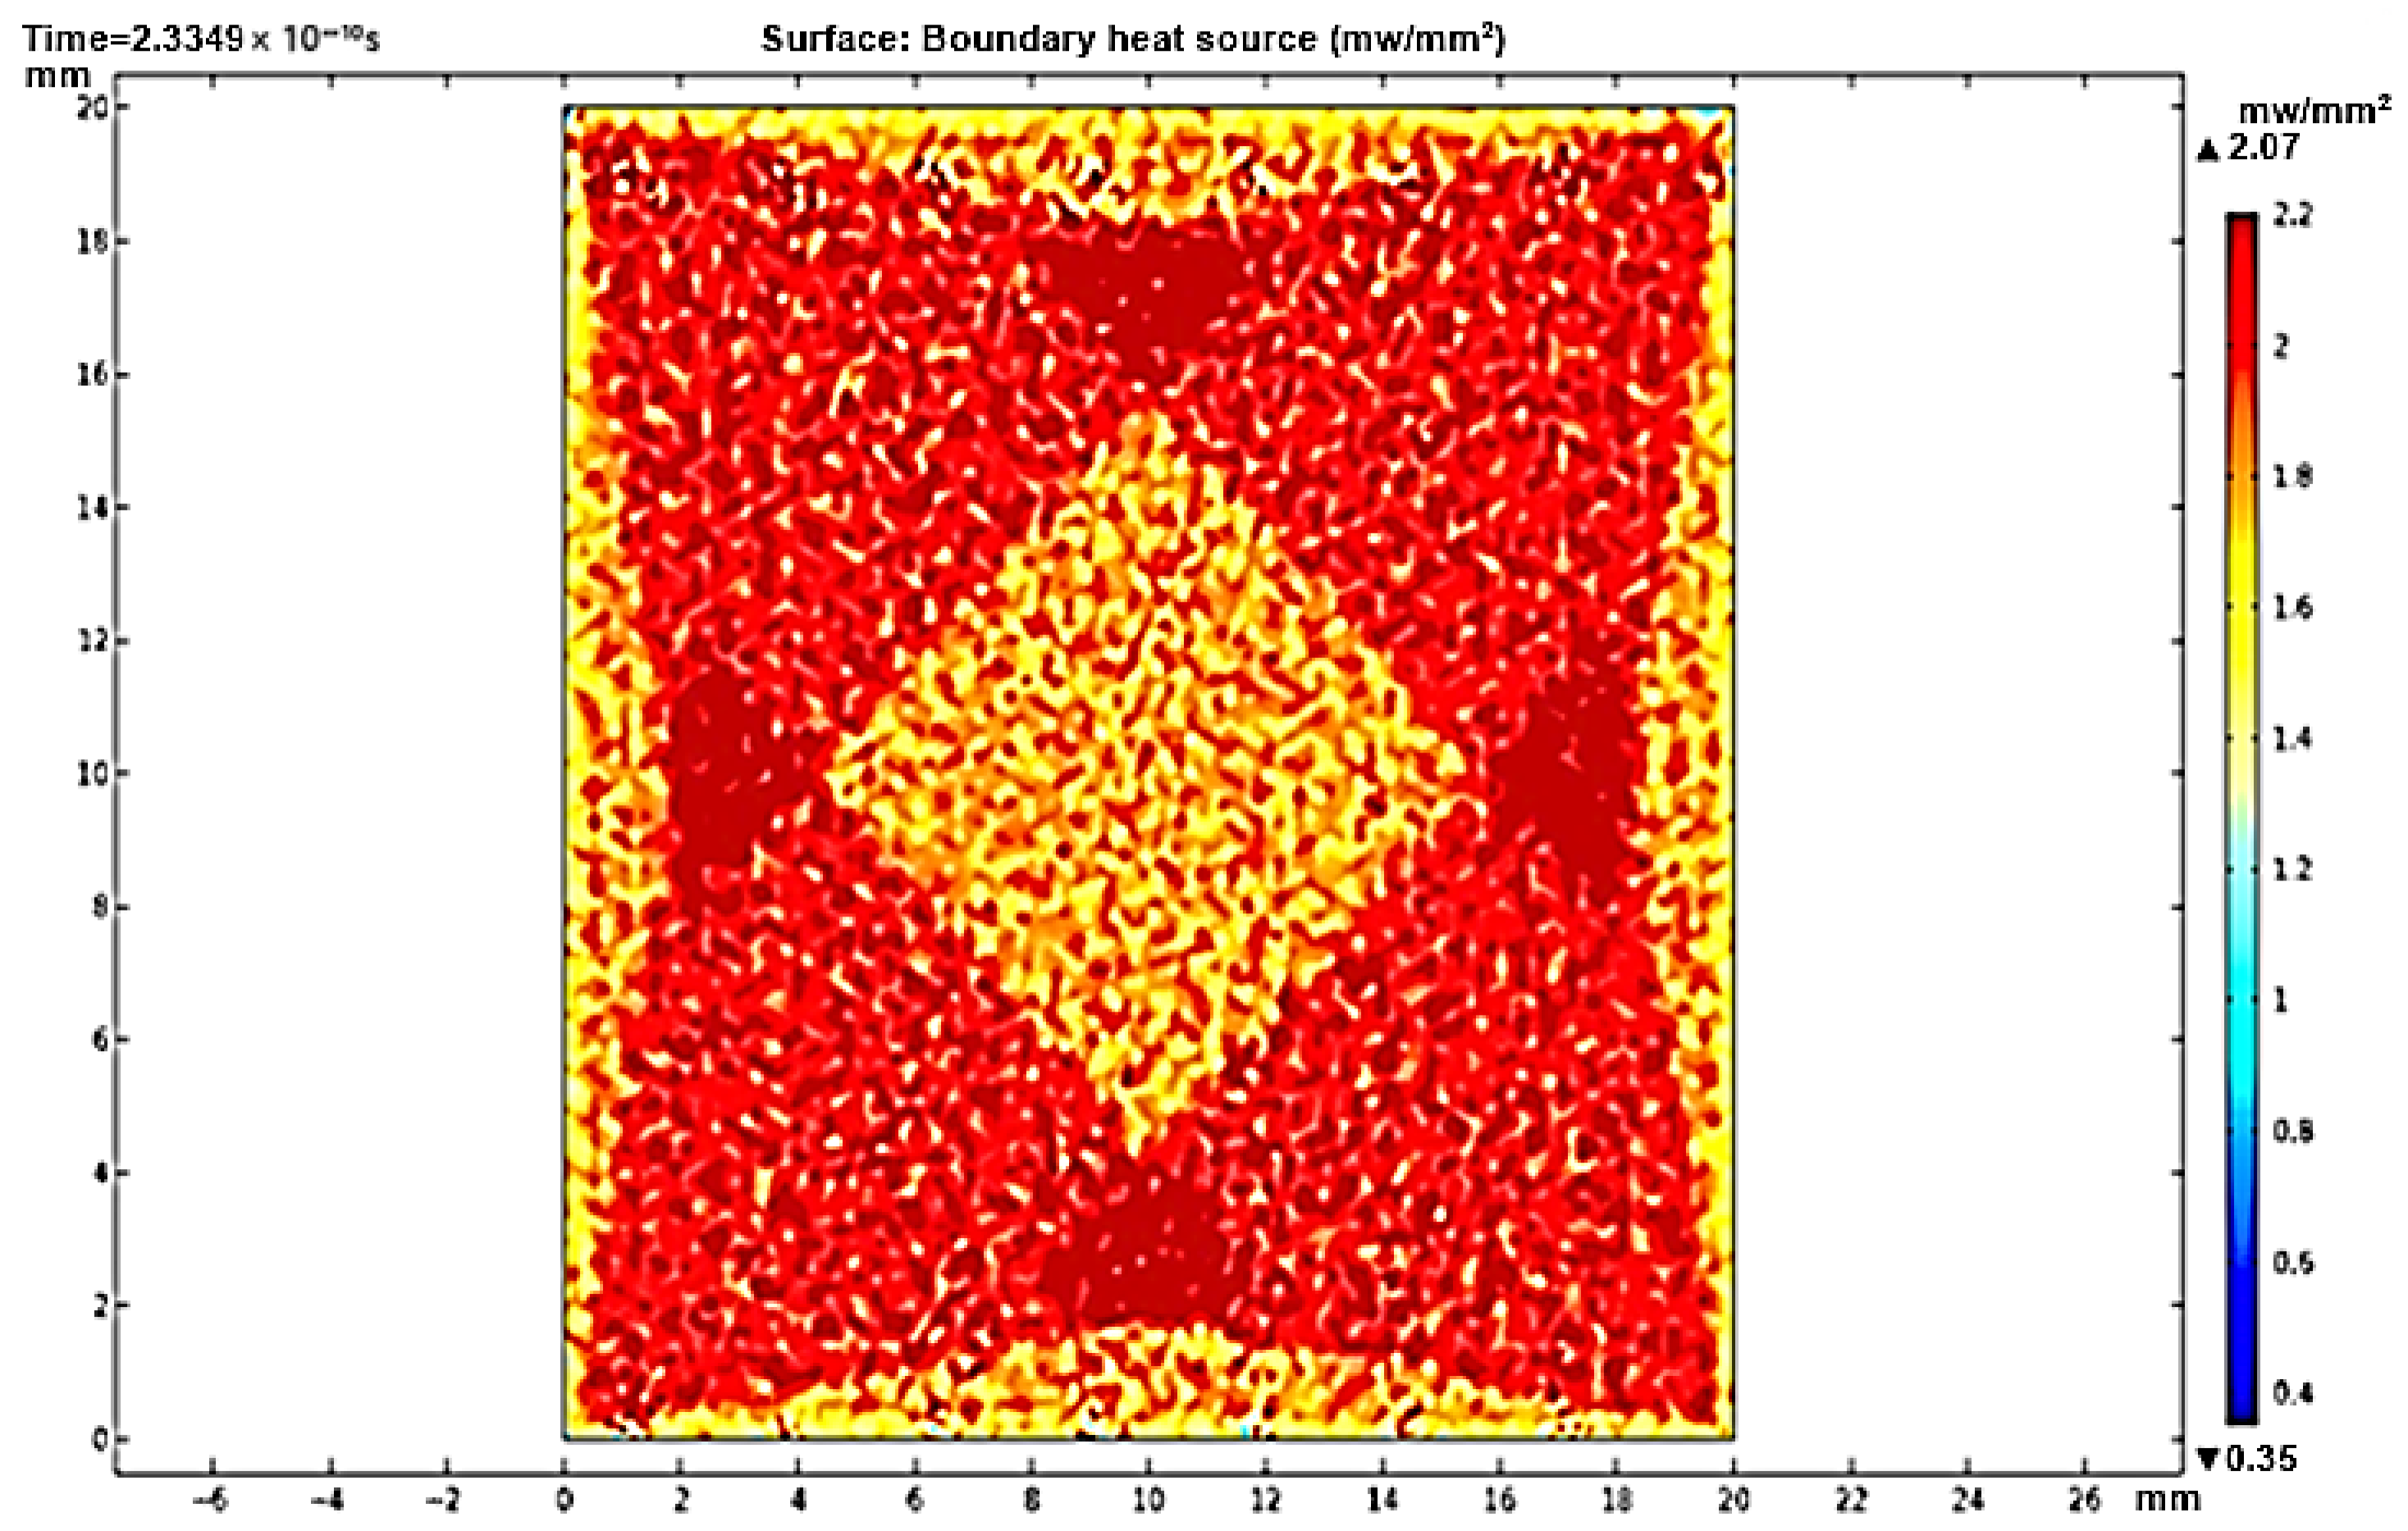
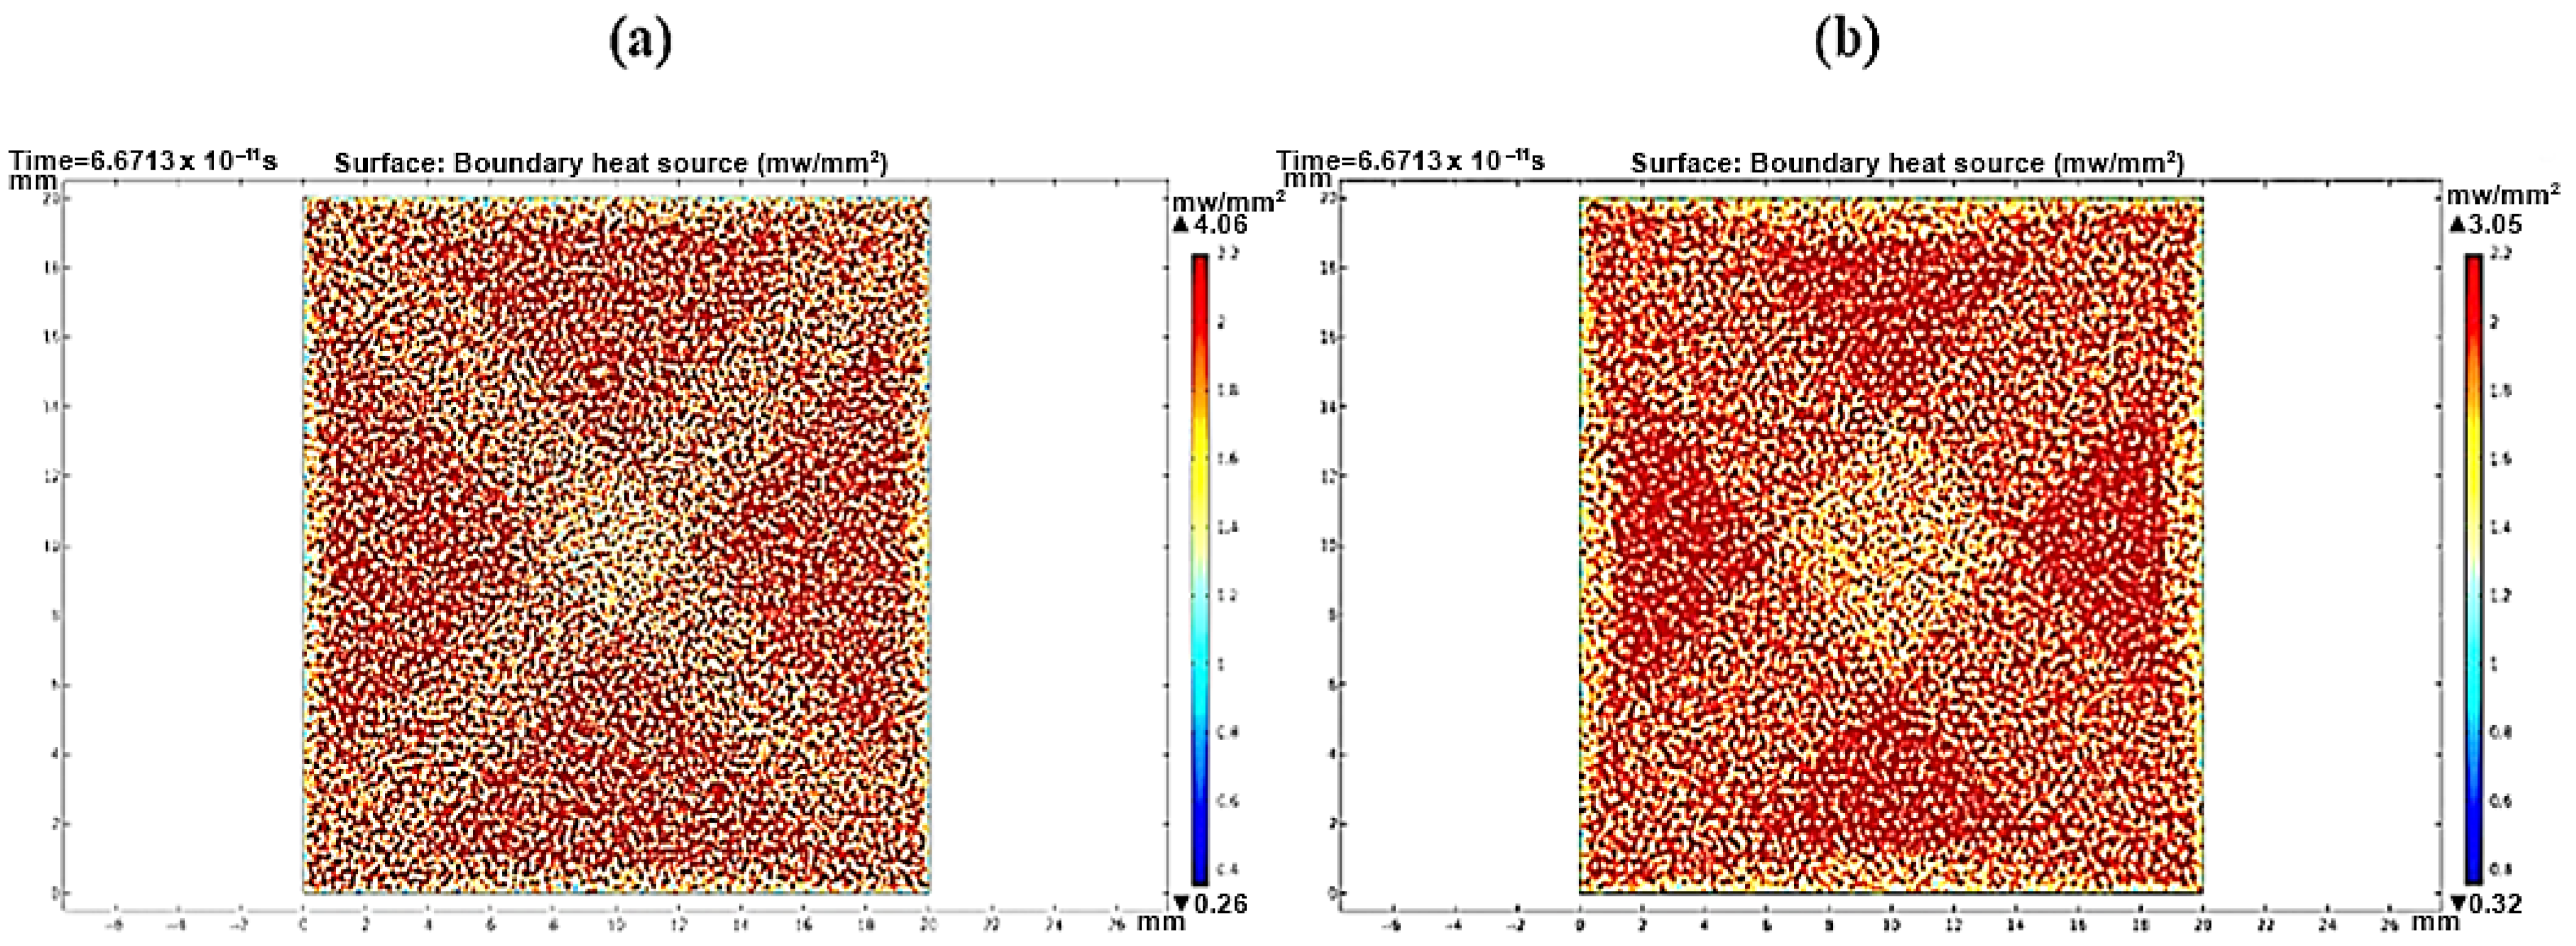
3.3. Local Sun Power Intensity Distribution

Figure 16 depicts the local sun power intensity distribution across the receiver surface. One can notice the uniform distribution of the solar density. The maximum achieved local sun power intensity was 3.21 mW/mm2.
Figure 17 depicts the impact of increasing the reflector tilt angle from 65° to 70°. The increase in the aperture area at 70° results in a decrease in the local sun power intensity from 3.86 mW/mm2 to 4.66 mW/mm2.

3.4. Optical Concentration Ratio and Optical Efficiency Analysis

In this section, the reflector’s absorptivity is assumed to be ideal. As shown in Table 5, the optical concentration ratios at reflector tilt angles of 60°, 65°, and 70° are 3.21 suns, 3.86 suns, and 4.66 suns, respectively. The tilt angle of 70° yields the highest optical concentration ratios and optical efficiencies.

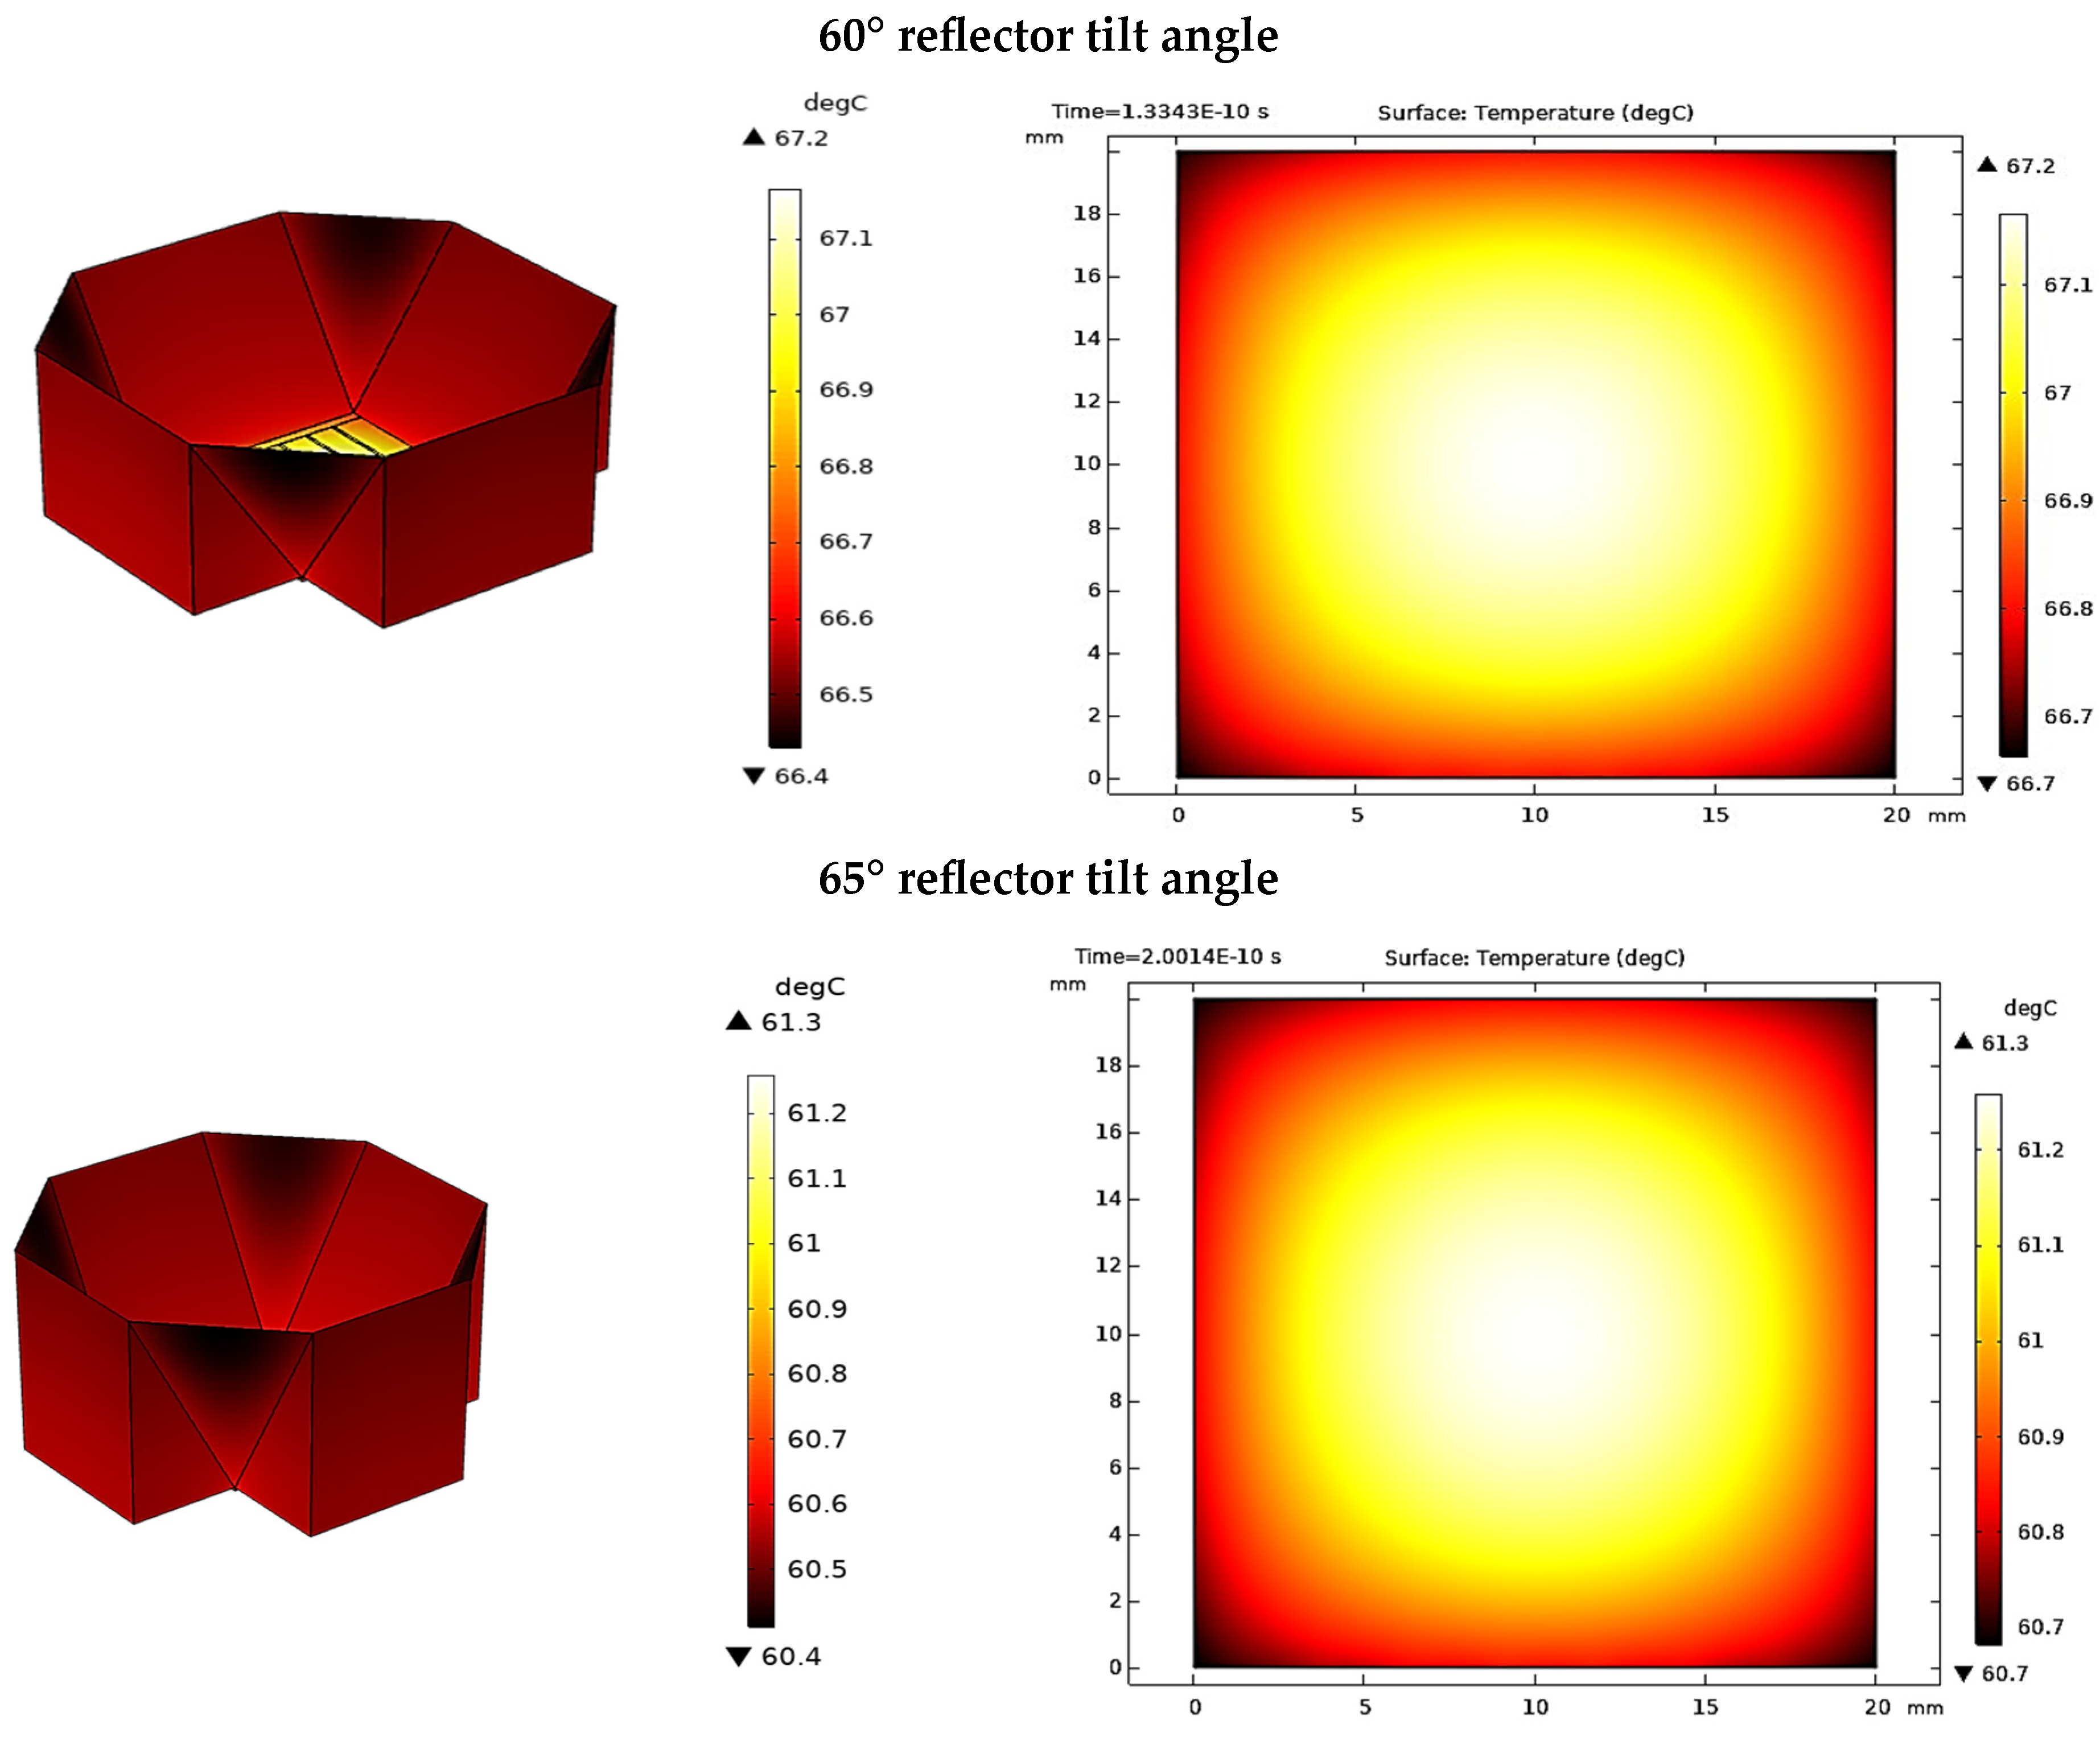
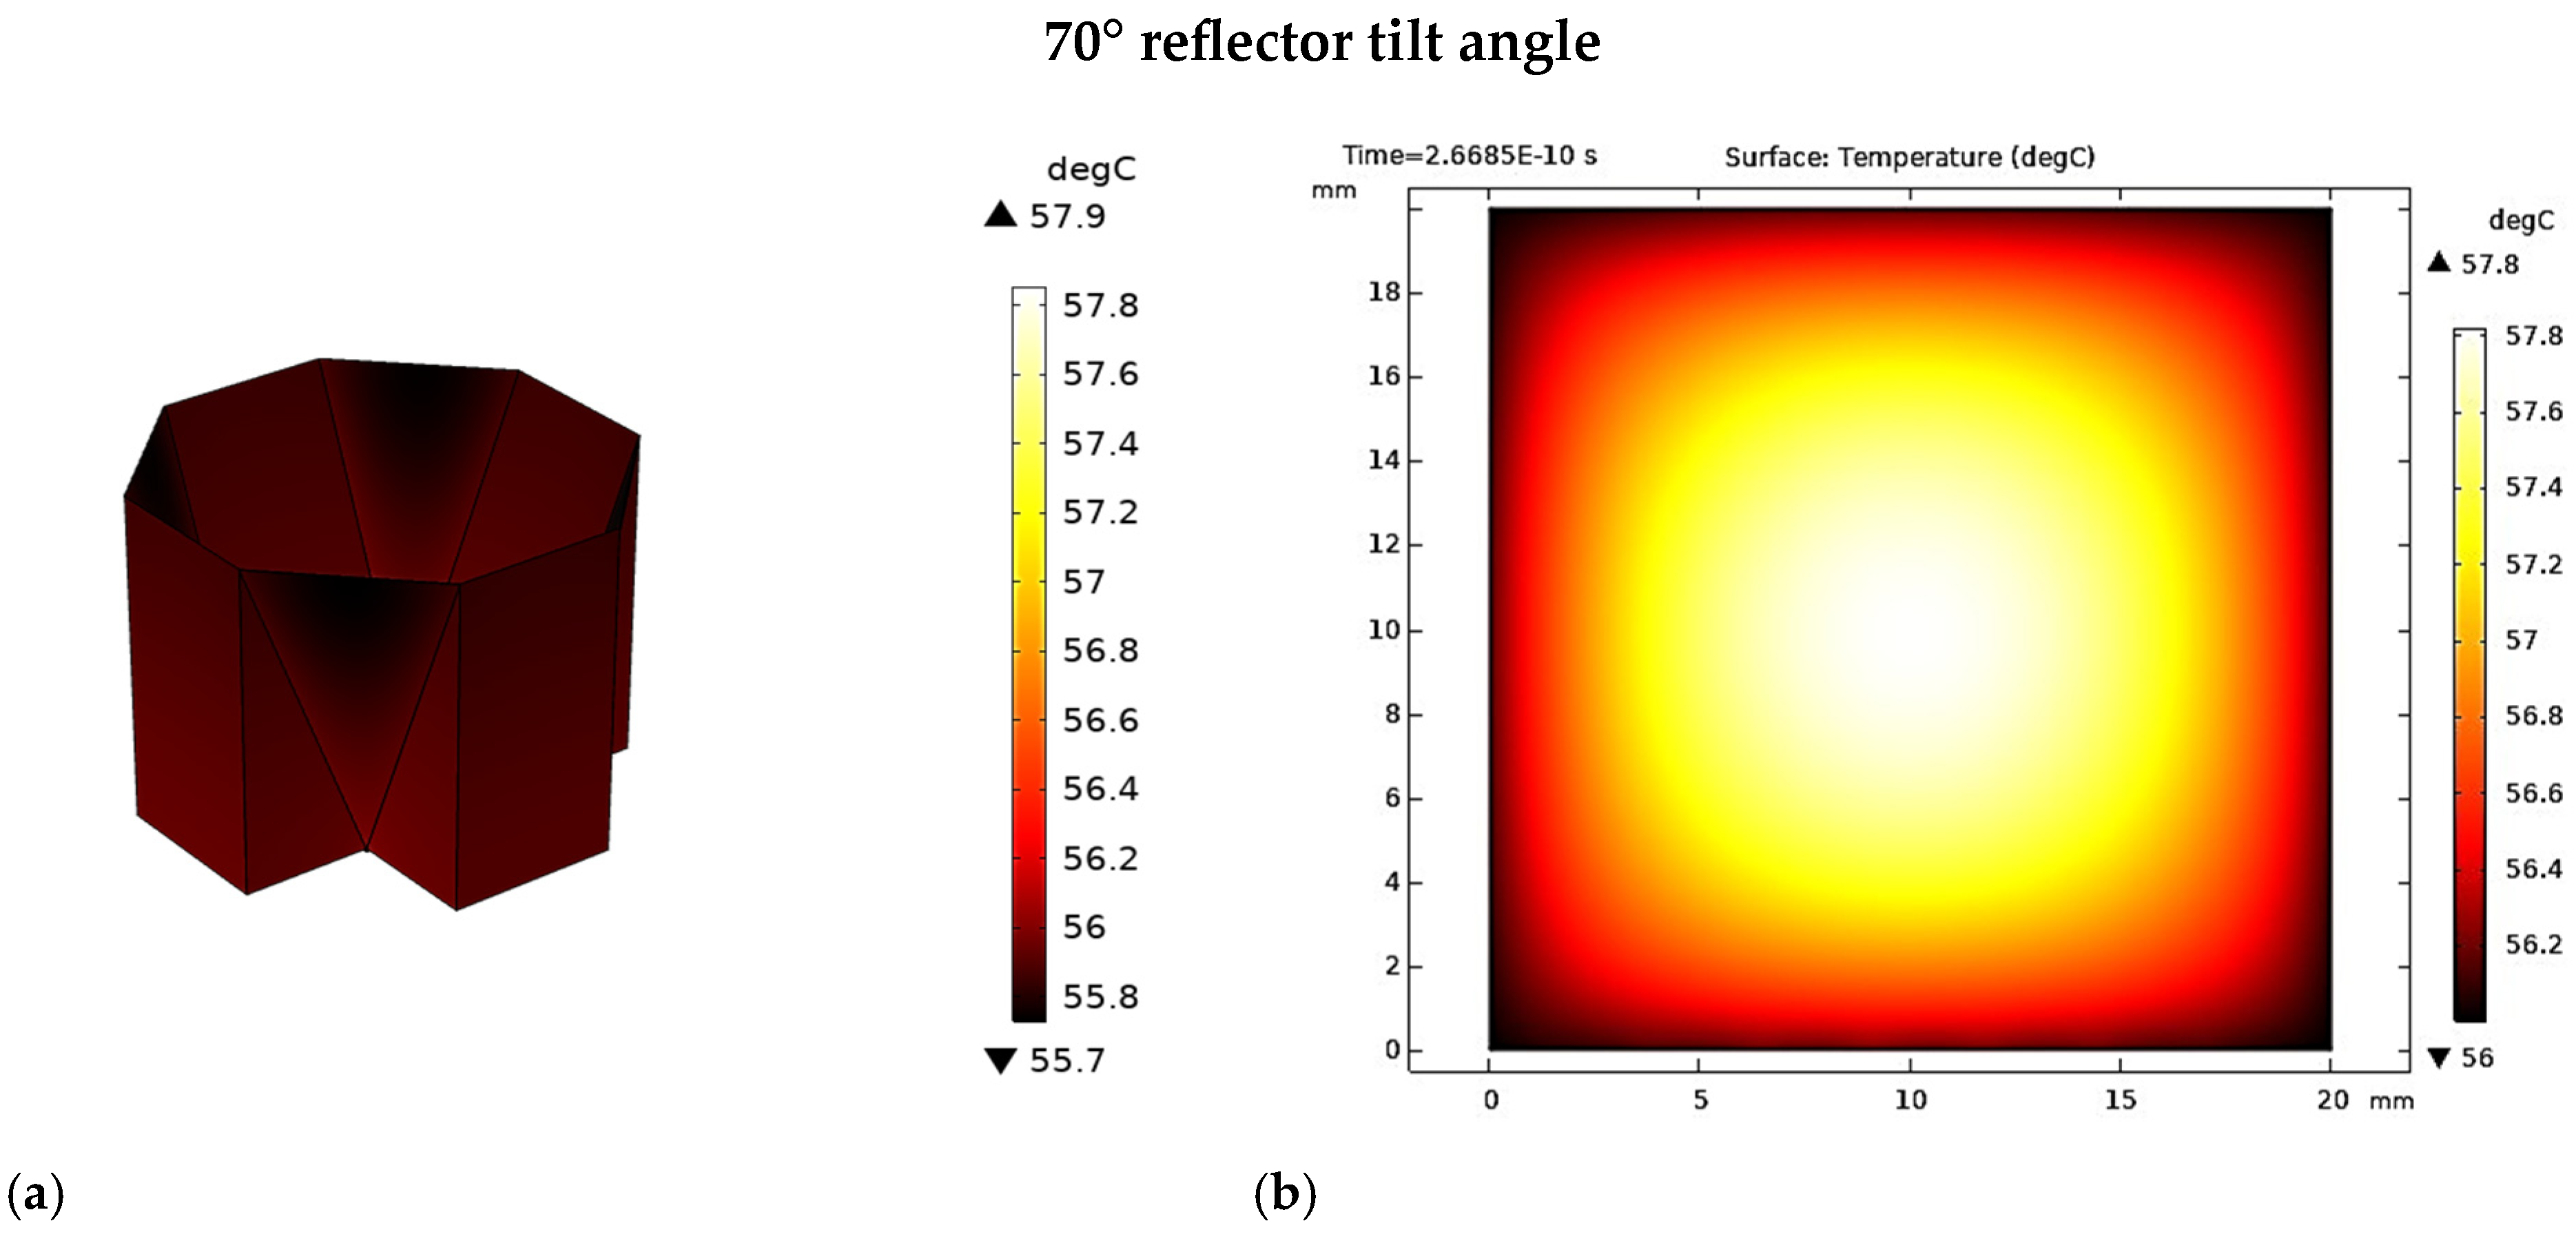
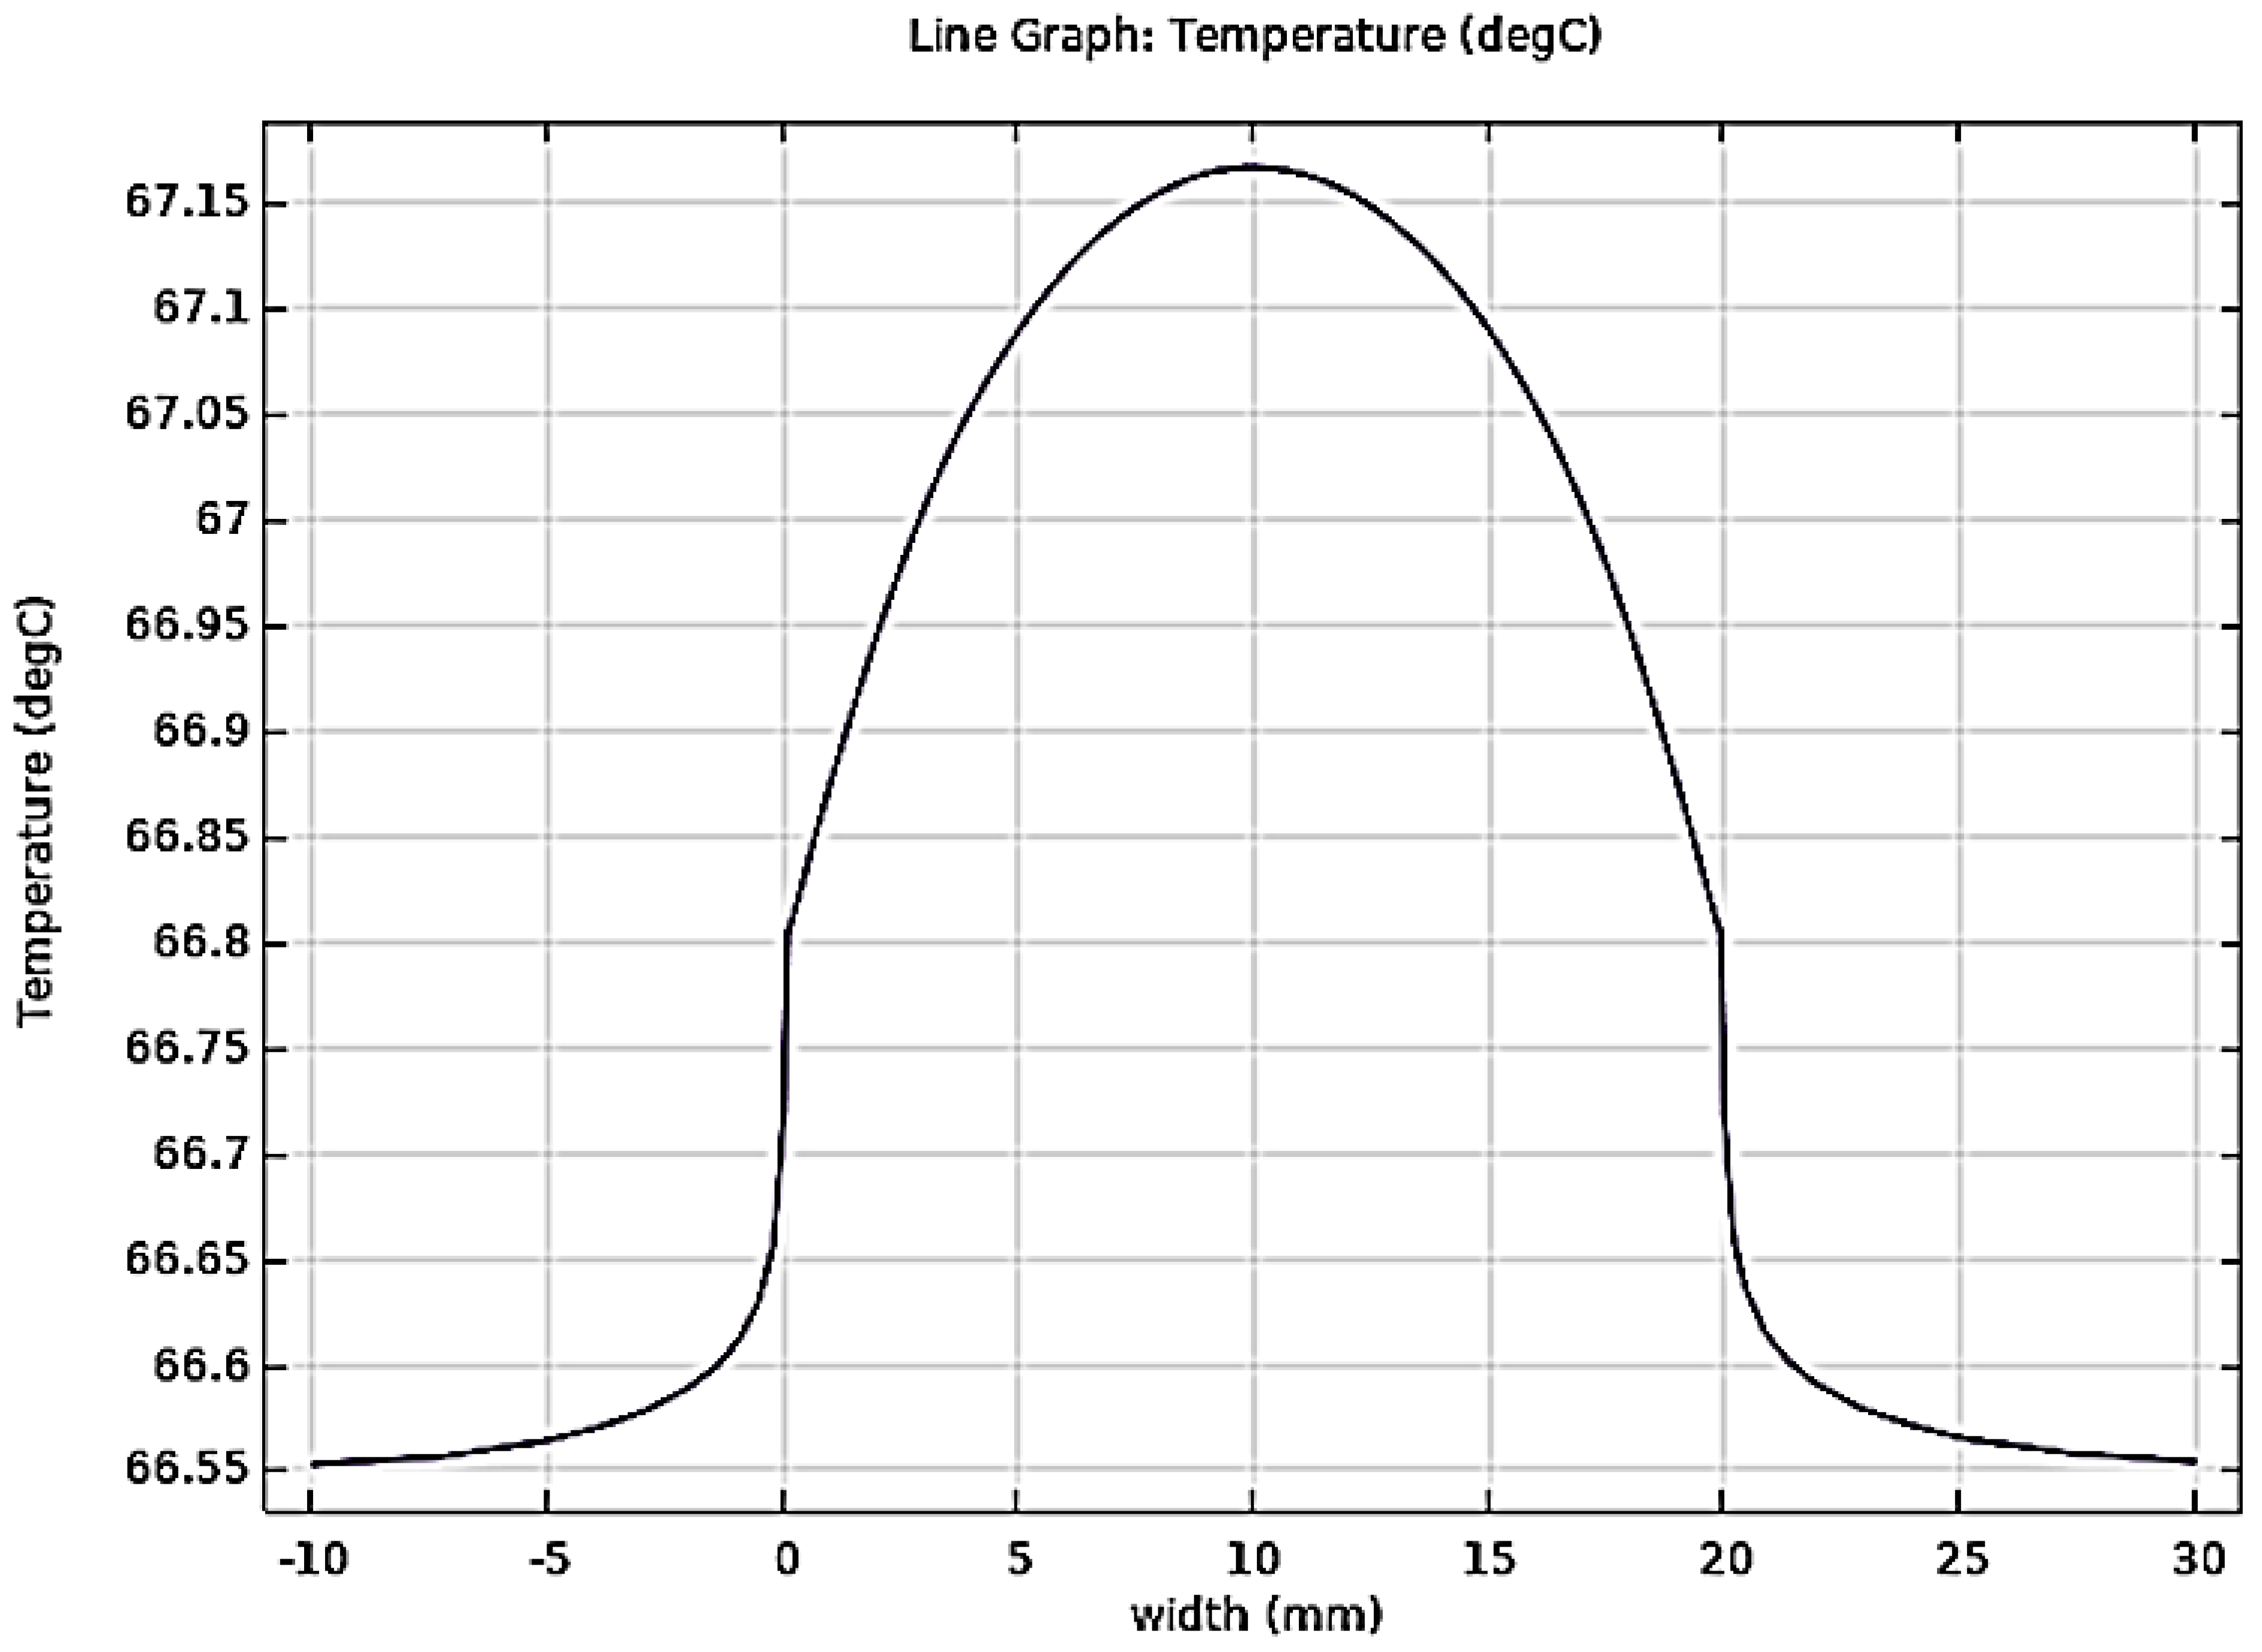
3.5. Heat Transfer Analysis

The results show a promising outcome by coupling both optical and thermal physics using COMSOL Multiphysics. One can observe that the maximum temperature occurs at the center of the cell due to the maximum local sun power intensity; however, moving towards the edges, the temperature decreases, since fewer rays are being reflected at those locations. For the EDVC at a tilt angle of 60°, the maximum temperature of the cell reaches 67.2 °C, which is reasonable for such a V-trough design. Figure 18 shows the temperature distribution across the model and the m-Si solar cell for the EDVC, respectively, at tilt angles of 60°, 65°, and 70°. It is clear from the figures that when the reflector tilt angle increases, the maximum cell temperature drops.
Figure 19 shows the temperature profile along the width of the EDVC. The lowest temperature is at the endpoints, and the maximum temperature is 67.2 °C at the center of the solar cell, due to the largest number of rays being reflected at the center.

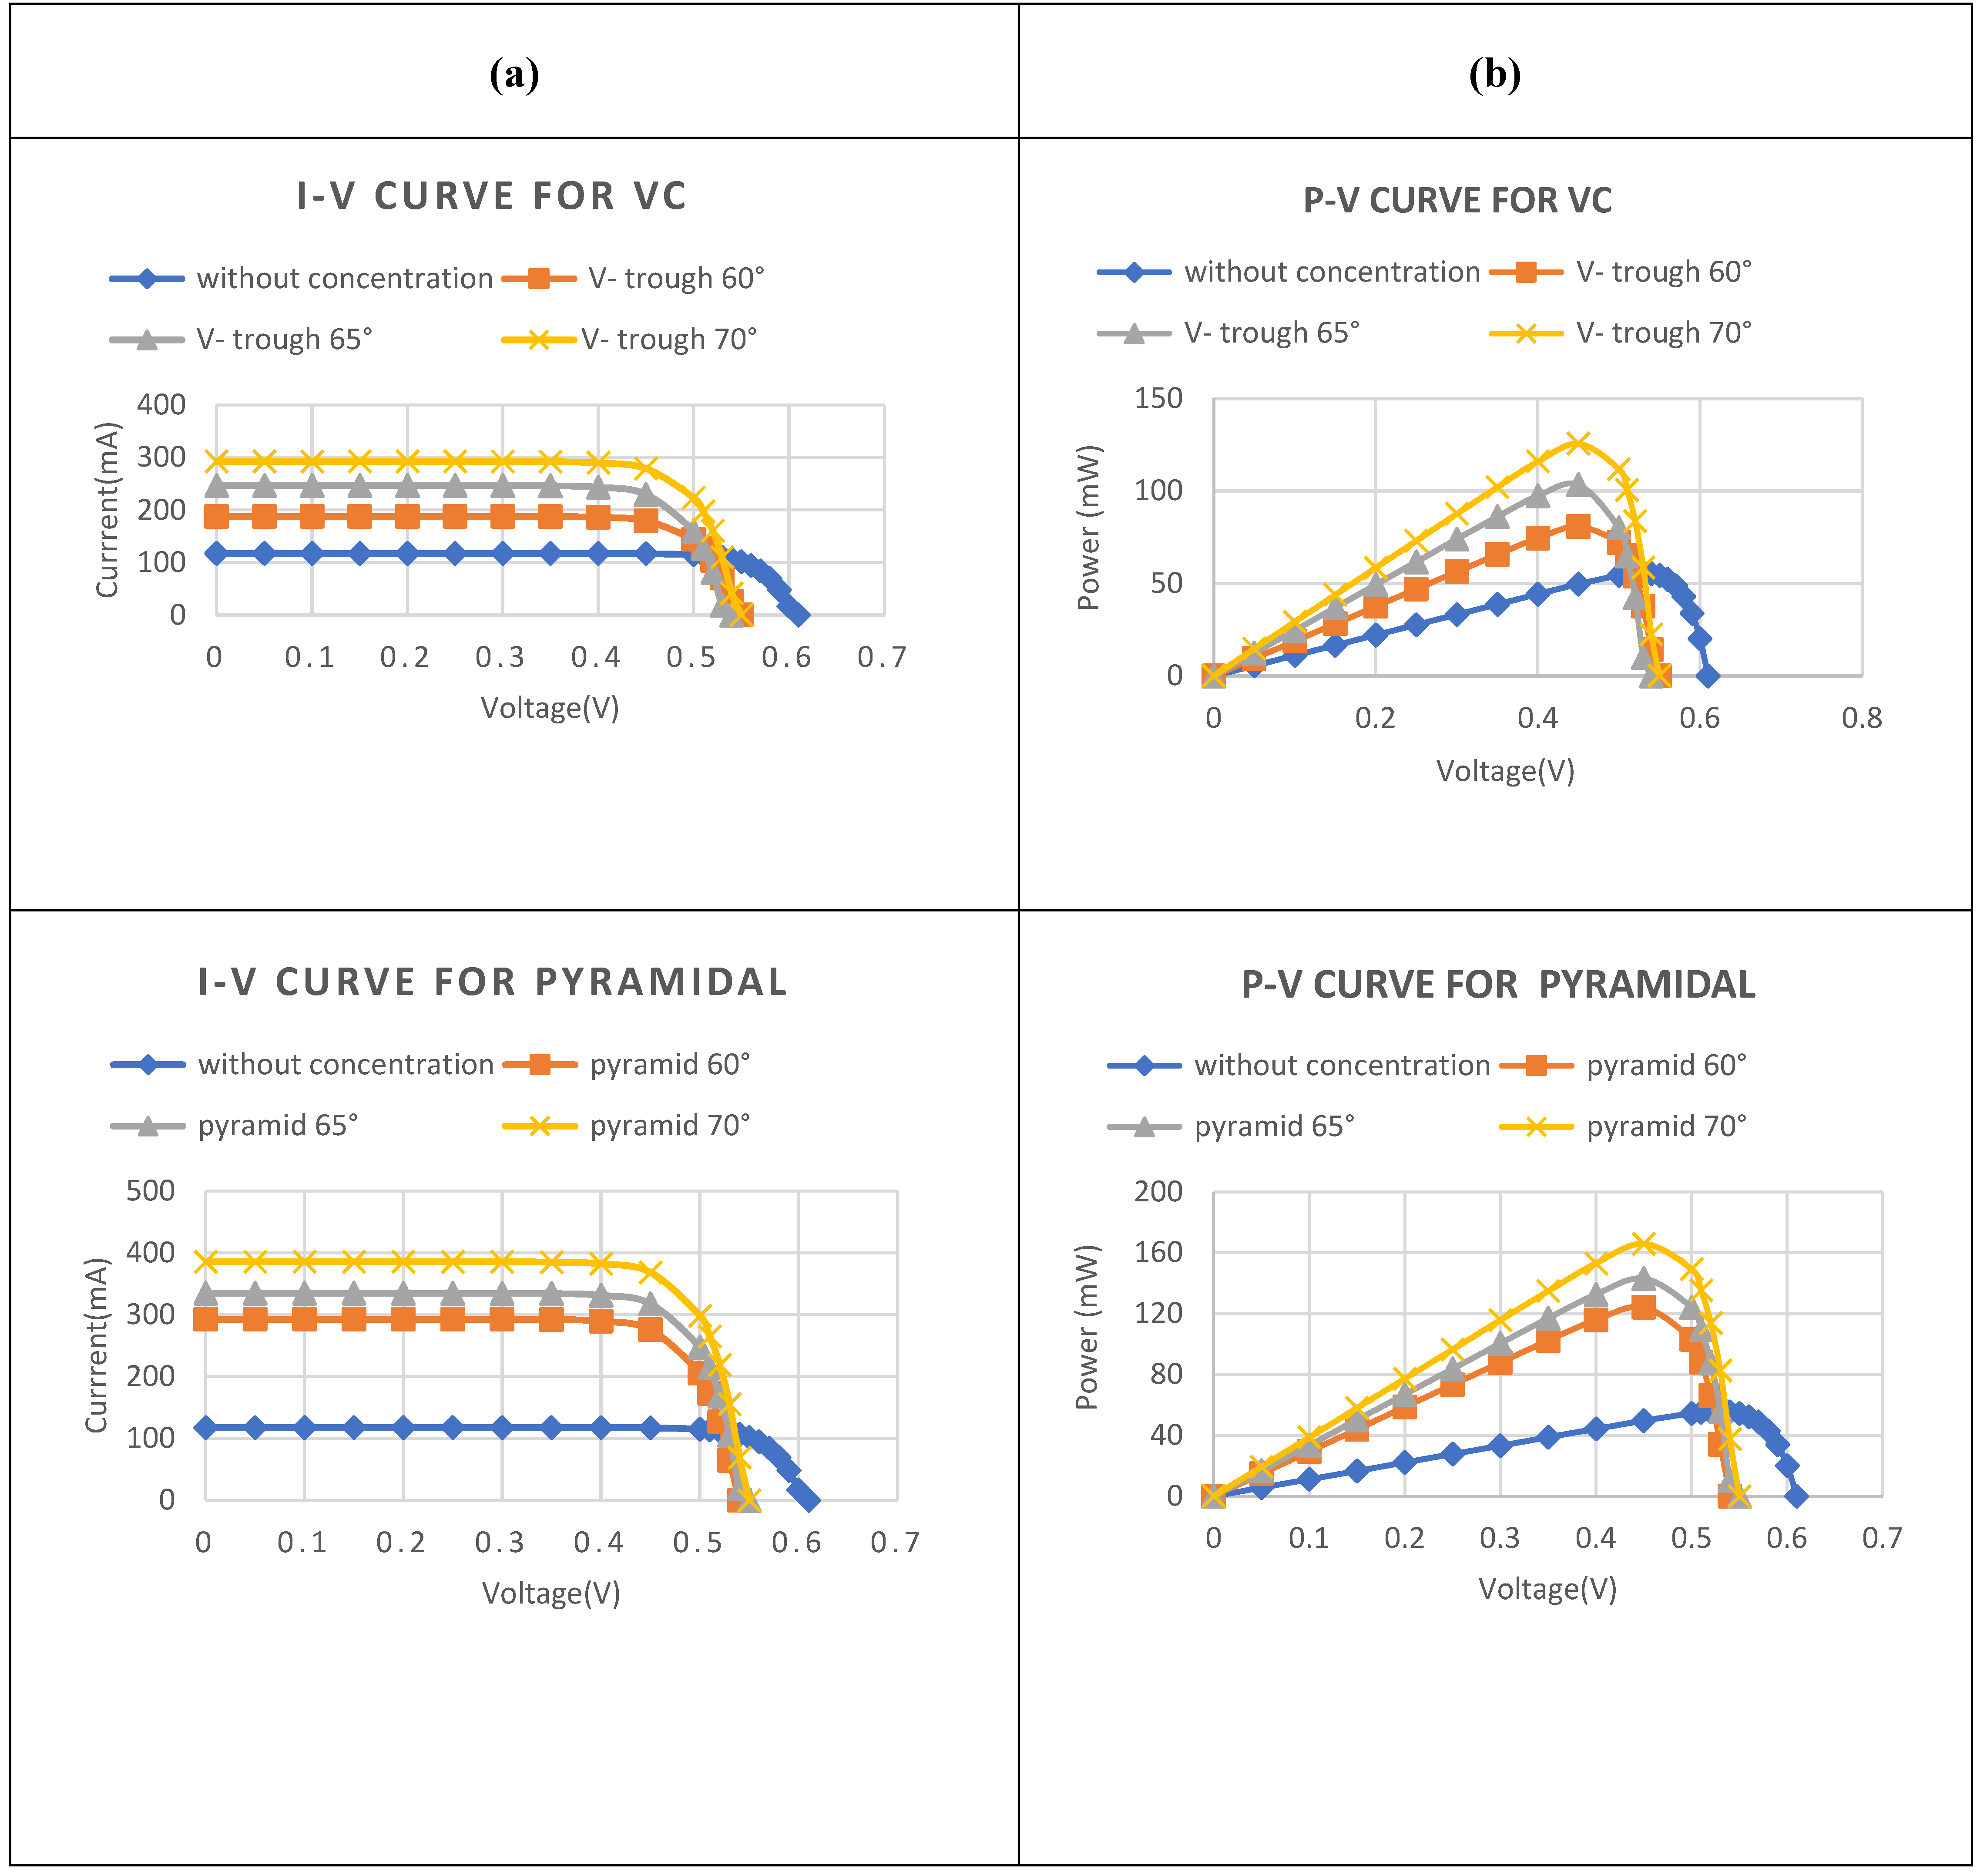
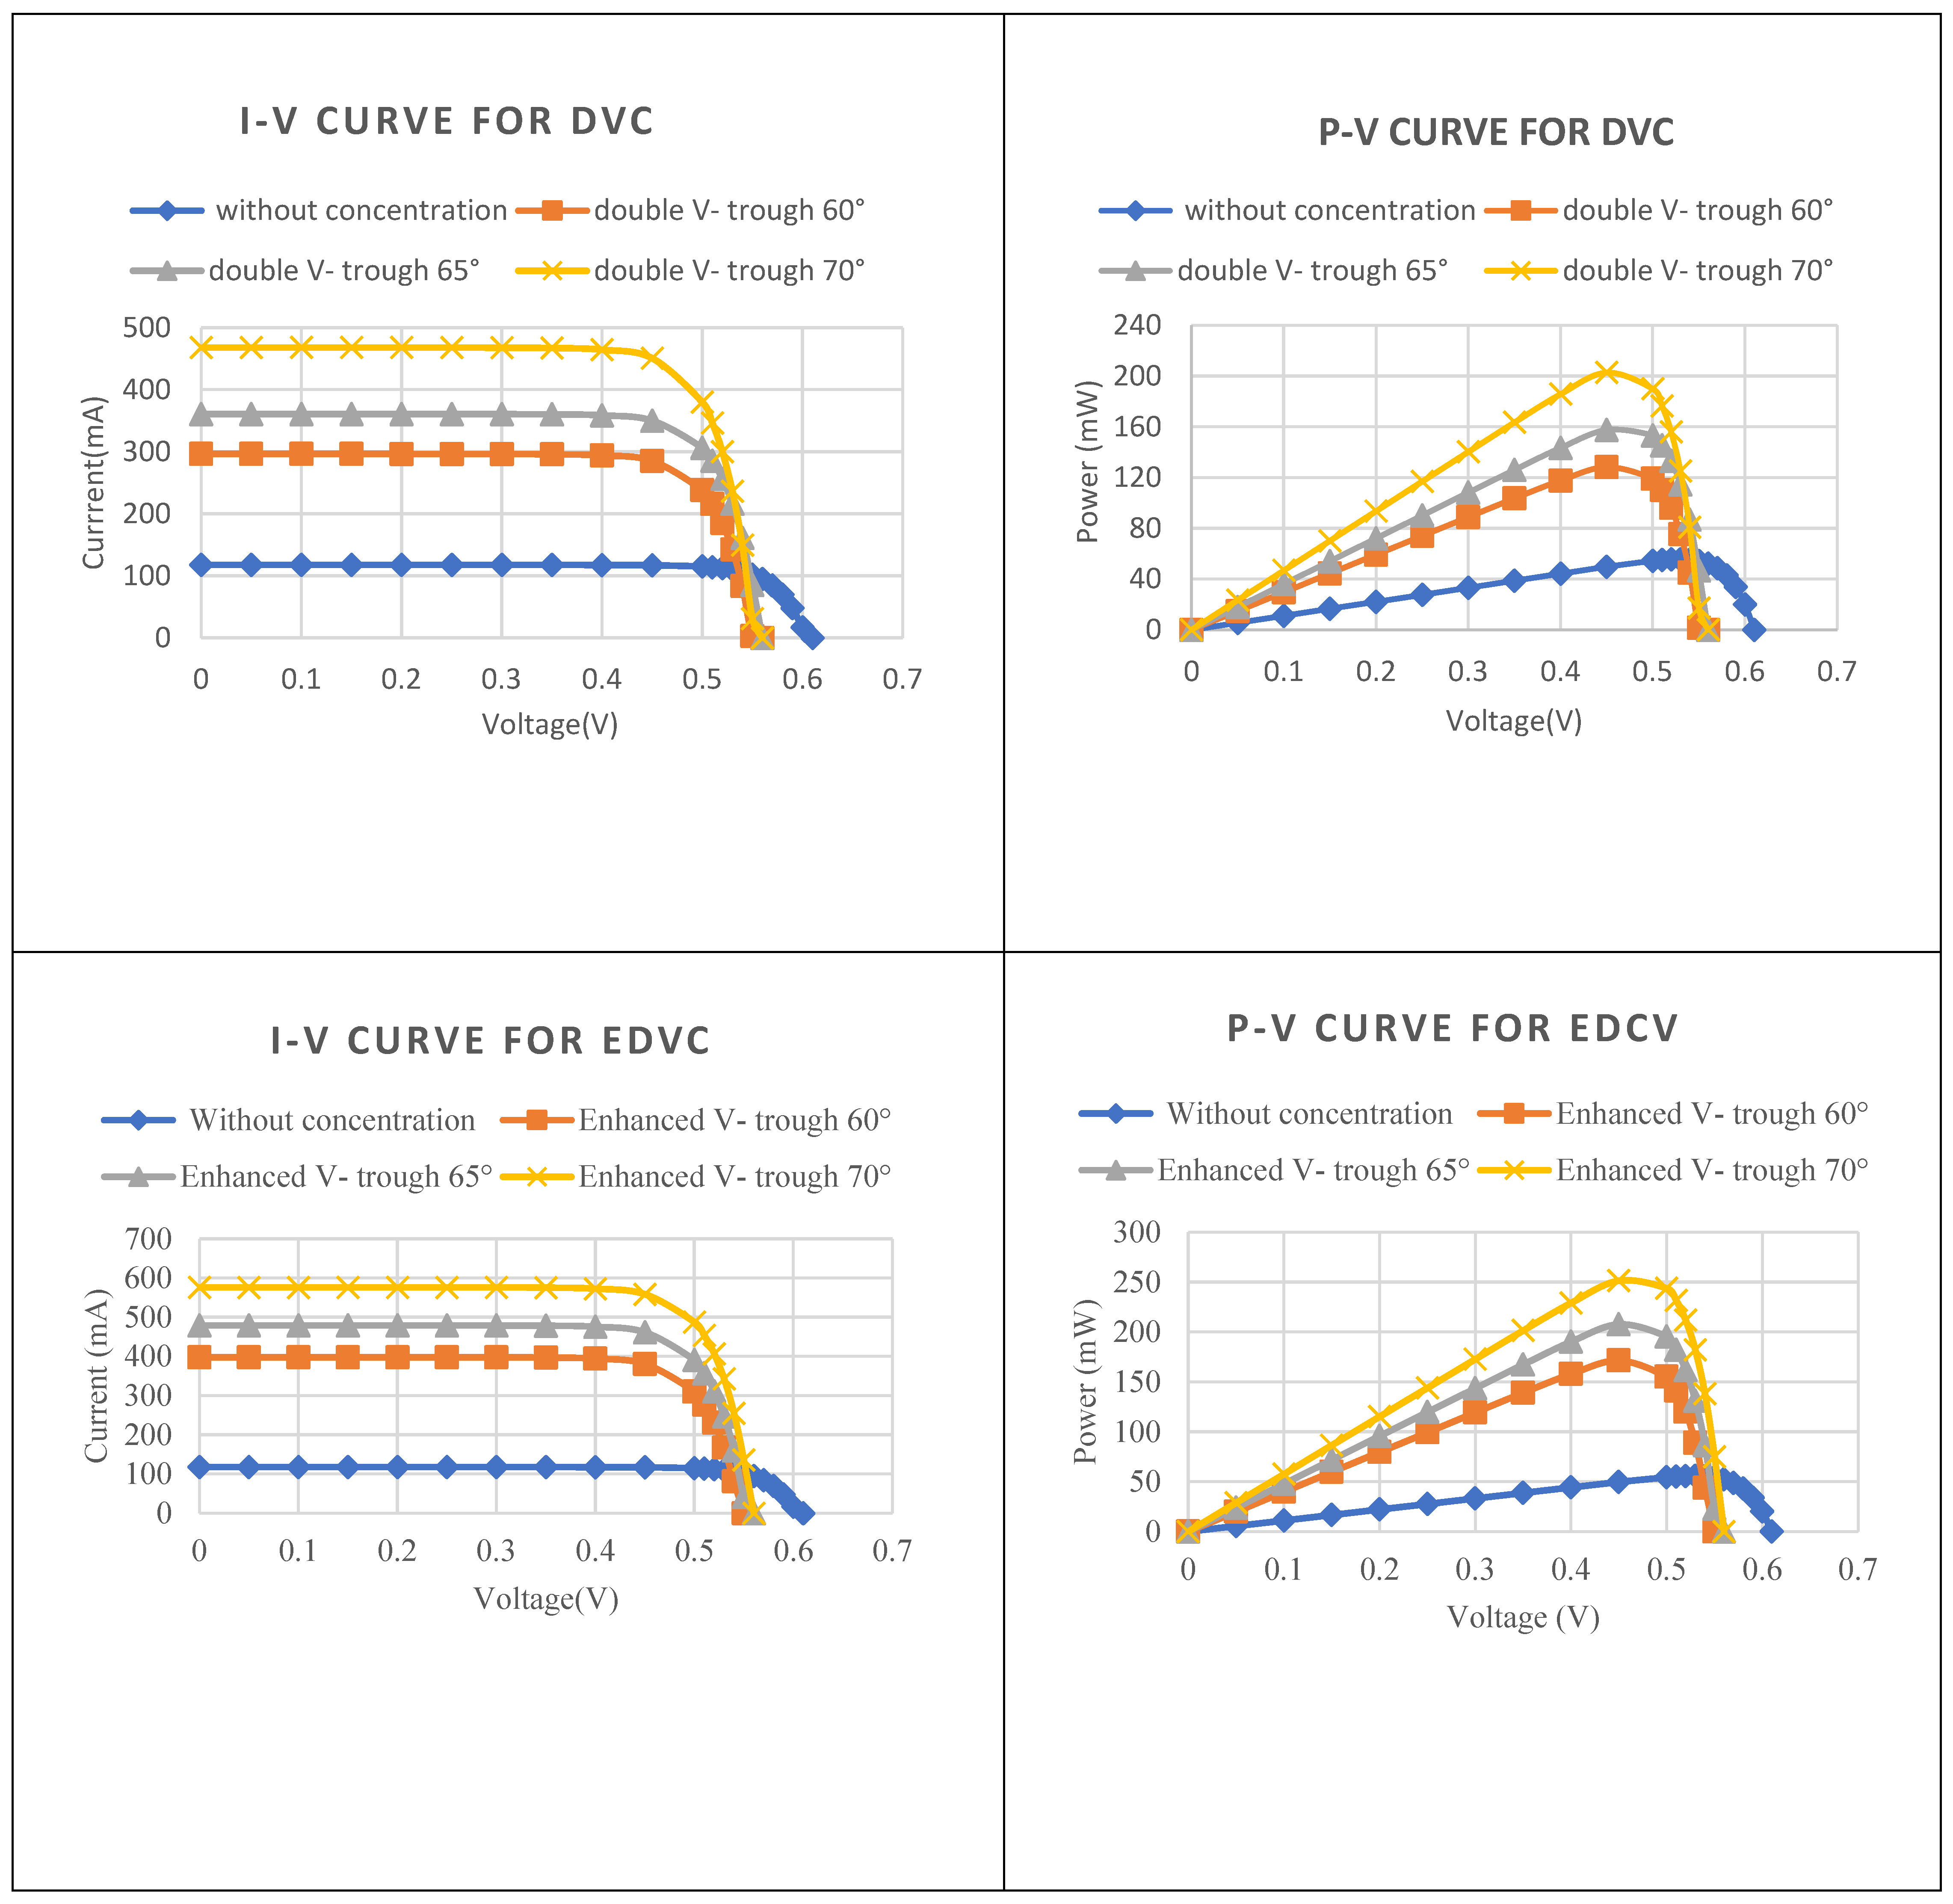
3.6. Electrical Analysis

The Finite-Element Method (FEM) is applied to solve Poisson’s equation based on semiconductor physics. In addition, optical ray tracing is coupled to the semiconductor module by applying the direct spectral irradiance for different wavelengths, and the photo-generation rate equation is used to estimate the current–voltage curve (I-V curve) and the power–voltage (P-V curve) features, considering the temperature of the models that will affect the photoelectric voltage.
Figure 20 demonstrates the I-V and the P-V curves of the PV cell without concentration, and with the conventional V-trough concentrator (CVC), pyramidal, double V-trough (DVC), and the Enhanced Double V-trough Concentrator (EDVC) at different reflector tilt angles (60–70°). A tilt angle of 70° yields the maximum photoelectric current due to the increase in the aperture area. The short-circuit current of the m-Si solar cell without concentration reaches 118 mA, with an open-circuit voltage of 0.61 V. Implementing the CVC, pyramidal, DVC, and the EDVC at a tilt angle of 70°, the maximum short-circuit current increases to 292.4 mA, 385.9 mA, 467.88 mA, and 576 mA, respectively. The short-circuit current of the EDVC at 70° is almost five times that of the one without concentration. In addition, the maximum power of the CVC, pyramidal, DVC, and EDVC at 70° is 125.5 mW, 166 mW, 202.7 mW, and 251.5 mW, respectively. The voltage drops between the cell with and without concentration do not exceed 11%, due to the increase in the temperature of the modules.
The double V-trough design utilizes reflectors on all sides of the cell, which allows for higher geometric concentration ratios as compared to the conventional V-trough design. The Enhanced Double V-trough Collector is a newly proposed LCPV design resulting from this research, which is an optimized double V-trough that is designed to increase the aperture area and reduce the shading effect of the interface corners between the reflecting boundaries of the double V-trough. LCPV-based V-trough systems are often designed without either azimuthal or zenithal trackers. Unlike traditional LCPV systems, CPCs suffer from the non-uniformity of the irradiation that is concentrated on solar cells, resulting in electric mismatch, which affects their electrical performance, such as the open-circuit voltage, short-circuit current, and ultimately, the Fill Factor. To ensure a wider range of incidence angles, the AGILE design can record the highest effective optical concentration ratio, but in terms of manufacturability, the AGILE design is more costly and demanding. Thus, the EDVC can be considered as the optimal passive LCPV thanks to its simple geometry, cost-effectiveness, and good acceptance angle.

4. Conclusions

In this research, a new design of a V-trough-based concentrator is proposed. This design is termed the Enhanced V-trough Concentrator (EDVC). The main outcomes of the present paper are the following:
  • The present research establishes a complete numerical methodology for modeling, simulating, and evaluating the electric and opto-thermal behavior of the different configurations of V-trough-based low concentrating photovoltaic systems. These systems have the advantage of working in passive modes and ensuring uniform illumination distribution over cells without the risk of high thermal strains that may be applied to the entire system, and especially to the primary optics.
  • The developed optical model is validated, and the ray-tracing module shows a high precision compared to the literature.
  • The Enhanced Double V-trough design shows its superiority over all the existing designs. At an optimum tilt angle of 70°, this new design recorded the highest optical concentration ratio of 4.77 suns, with an optical efficiency of 89%.
  • The short-circuit current of the Enhanced Double V-trough increased by 488% and had a drop of 11% compared to the design without concentration.
  • The output power of the Enhanced Double V-trough recorded a spike of 452% compared to the design without concentration.

Author Contributions

Conceptualization, T.M. and S.A.; methodology, T.M. and S.A.; software, T.M. and S.A.; validation, T.M. and S.A.; formal analysis, T.M. and S.A.; investigation, T.M. and S.A.; resources, T.M. and S.A.; data curation, T.M. and S.A.; writing—original draft preparation, T.M.; writing—review and editing, T.M. and S.A.; visualization, T.M. and S.A.; supervision, T.M.; project administration, T.M. and S.A.; funding acquisition, T.M. All authors have read and agreed to the published version of the manuscript.

Funding

This research received no external funding.

Institutional Review Board Statement

Not applicable.

Informed Consent Statement

Not applicable.

Data Availability Statement

The data supporting this study’s findings are available from the corresponding author upon reasonable request.

Acknowledgments

The authors would like to acknowledge the support provided by Imam Abdulrahman Bin Faisal University (IAU), Dammam, Saudi Arabia and to the Engineers Mohammed Alaftan, Abdullah Alabdulwahed, Majed Qasim, and Abdulaziz Alshahrani for their assistance.

Conflicts of Interest

The authors declare no conflicts of interest.

References

  1. Hamid, S.A.; Othman, M.Y.; Sopian, K.; Zaidi, S.H. An overview of photovoltaic thermal combination (PV/T combi) technology. Renew. Sustain. Energy Rev. 2014, 38, 212–222. [Google Scholar] [CrossRef]
  2. El Alimi, S.; Maatallah, T.; Ben Nasrallah, S. Break-even analysis and optimization of a stand-alone hybrid system with battery storage for residential load consumption—A case study. Renew. Sustain. Energy Rev. 2014, 37, 408–423. [Google Scholar] [CrossRef]
  3. Date, A.; Date, A.; Dixon, C.; Akbarzadeh, A. Progress of thermoelectric power generation systems: Prospect for small to medium scale power generation. Renew. Sustain. Energy Rev. 2014, 33, 371–381. [Google Scholar] [CrossRef]
  4. Byrne, J.; Taminiau, J.; Kurdgelashvili, L.; Kim, K.N. A review of the solar city concept and methods to assess rooftop solar electric potential, with an illustrative application to the city of Seoul. Renew. Sustain. Energy Rev. 2015, 41, 830–844. [Google Scholar] [CrossRef]
  5. Kumar, A.; Baredar, P.; Qureshi, U. Historical and recent development of photovoltaic thermal (PVT) technologies. Renew. Sustain. Energy Rev. 2015, 42, 1428–1436. [Google Scholar] [CrossRef]
  6. Tang, R.; Liu, X. Optical performance and design optimization of V-trough concentrators for photovoltaic applications. Sol. Energy 2011, 85, 2154–2166. [Google Scholar] [CrossRef]
  7. Tyagi, V.; Kaushik, S.; Tyagi, S. Advancement in solar photovoltaic/thermal (PV/T) hybrid collector technology. Renew. Sustain. Energy Rev. 2012, 16, 1383–1398. [Google Scholar] [CrossRef]
  8. Daghigh, R.; Ruslan, M.; Sopian, K. Advances in liquid based photovoltaic/thermal (PV/T) collectors. Renew. Sustain. Energy Rev. 2011, 15, 4156–4170. [Google Scholar] [CrossRef]
  9. Zondag, H. Flat-plate PV-Thermal collectors and systems: A review. Renew. Sustain. Energy Rev. 2008, 12, 891–959. [Google Scholar] [CrossRef]
  10. Hasan, M.A.; Sumathy, K. Photovoltaic thermal module concepts and their performance analysis: A review. Renew. Sustain. Energy Rev. 2010, 14, 1845–1859. [Google Scholar] [CrossRef]
  11. Zhang, X.; Zhao, X.; Smith, S.; Xu, J.; Yu, X. Review of R&D progress and practical application of the solar photovoltaic/thermal (PV/T) technologies. Renew. Sustain. Energy Rev. 2012, 16, 599–617. [Google Scholar]
  12. Chemisana, D. Building integrated concentrating photovoltaics: A review. Renew. Sustain. Energy Rev. 2011, 15, 603–611. [Google Scholar] [CrossRef]
  13. Zahedi, A. Review of modelling details in relation to low-concentration solar concentrating photovoltaic. Renew. Sustain. Energy Rev. 2011, 15, 1609–1614. [Google Scholar] [CrossRef]
  14. Vivar, M.; Clarke, M.; Pye, J.; Everett, V. A review of standards for hybrid CPV-thermal systems. Renew. Sustain. Energy Rev. 2011, 16, 443–448. [Google Scholar] [CrossRef]
  15. Singh, B.; Othman, M.Y. A review on photovoltaic thermal collectors. J. Renew. Sustain. Energy 2009, 1, 062702. [Google Scholar] [CrossRef]
  16. Chong, K.-K.; Lau, S.-L.; Yew, T.-K.; Tan, P.C.-L. Design and development in optics of concentrator photovoltaic system. Renew. Sustain. Energy Rev. 2013, 19, 598–612. [Google Scholar] [CrossRef]
  17. Bahaidarah, H.M.; Tanweer, B.; Gandhidasan, P.; Rehman, S. A Combined Optical, Thermal and Electrical Performance Study of a V-Trough PV System—Experimental and Analytical Investigations. Energies 2015, 8, 2803–2827. [Google Scholar] [CrossRef]
  18. Xu, S.-J.; Wu, S.-Y.; Xiao, L.; Chen, Z.-L. Performance Assessment of Compound Parabolic Concentrating Photovoltaic System Based on Optical-Thermal-Electrical-Environmental Coupling. Energy 2023, 284, 129241. [Google Scholar] [CrossRef]
  19. Orynbassar, S.; Almen, D.; Mekhilef, S.; Kapparova, A.; Dosymbetova, G.; Nurgaliyev, M.; Saymbetov, A.; Ibraimov, M.; Kuttybay, N.; Yershov, E.; et al. Minimum Solar Tracking System for a Fresnel Lens-Based LCPV. Renew. Energy 2024, 237, 121607. [Google Scholar] [CrossRef]
  20. Benecke, M.; Van Dyk, E.; Vorster, F. Optical design of low concentrator photovoltaic modules. J. Energy S. Afr. 2013, 24, 46–50. [Google Scholar] [CrossRef]
  21. Ağbulut, Ü.; Gürel, A.E.; Ergün, A.; Ceylan, İ. Performance assessment of a V-trough photovoltaic system and prediction of power output with different machine learning algorithms. J. Clean. Prod. 2020, 268, 122–269. [Google Scholar] [CrossRef]
  22. Li, G.; Hua, Q.; Sun, L.; Khosravi, A.; Pabon, J.J.G. Thermodynamic Modeling and Optimization of Hybrid Linear Concentrating Photovoltaic and Mechanically Pumped Two-Phase Loop System. Appl. Energy 2022, 333, 120547. [Google Scholar] [CrossRef]
  23. Elsheniti, M.B.; Zaheer, S.; Zeitoun, O.; Alshehri, H.; AlRabiah, A.; Almutairi, Z. Experimental Evaluation of a Solar Low-Concentration Photovoltaic/Thermal System Combined with a Phase-Change Material Cooling Technique. Appl. Sci. 2022, 13, 25. [Google Scholar] [CrossRef]
  24. Parupudi, R.V.; Singh, H.; Kolokotroni, M.; Tavares, J. Long term performance analysis of low concentrating photovoltaic (LCPV) systems for building retrofit. Appl. Energy 2021, 300, 117412. [Google Scholar] [CrossRef]
  25. Parupudi, R.V.; Singh, H.; Kolokotroni, M. Low Concentrating Photovoltaics (LCPV) for buildings and their performance analyses. Appl. Energy 2020, 279, 115839. [Google Scholar] [CrossRef]
  26. Muhammad-Sukki, F.; Farooq, H.; Abu-Bakar, S.H.; Ardila-Rey, J.A.; Sellami, N.; Kilpatrick, C.; Muhtazaruddin, M.N.; Bani, N.A.; Zulkipli, M. Mathematical Modelling of a Static Concentrating Photovoltaic: Simulation and Experimental Validation. Appl. Sci. 2021, 11, 3894. [Google Scholar] [CrossRef]
  27. Ustaoglu, A.; Ozbey, U.; Torlaklı, H. Numerical investigation of concentrating photovoltaic/thermal (CPV/T) system using compound hyperbolic –trumpet, V-trough and compound parabolic concentrators. Renew. Energy 2020, 152, 1192–1208. [Google Scholar] [CrossRef]
  28. Taniguchi, T.; Ishibe, T.; Naruse, N.; Mera, Y.; Alam, M.; Sawano, K.; Nakamura, Y. High Thermoelectric Power Factor Realization in Si-Rich SiGe/Si Superlattices by Super-Controlled Interfaces. ACS Appl. Mater. Interfaces 2020, 12, 25428–25434. [Google Scholar] [CrossRef]
  29. Basset, P.; Galayko, D.; Paracha, A.M.; Marty, F.; Dudka, A.; Bourouina, T. A Batch-Fabricated and Electret-Free Silicon Electrostatic Vibration Energy Harvester. J. Micromech. Microeng. 2009, 19, 115025. [Google Scholar] [CrossRef]
  30. Hollands, K. A concentrator for thin-film solar cells. Sol. Energy 1971, 13, 149–163. [Google Scholar] [CrossRef]
  31. Amanlou, Y.; Hashjin, T.T.; Ghobadian, B.; Najafi, G.; Mamat, R. A comprehensive review of Uniform Solar Illumination at Low Concentration Photovoltaic (LCPV) Systems. Renew. Sustain. Energy Rev. 2016, 60, 1430–1441. [Google Scholar] [CrossRef]
  32. Al-Najideen, M.; Al-Shidhani, M.; Min, G. Optimum design of V-trough solar concentrator for photovoltaic applications. In Proceedings of the 15th International Conference on Concentrator Photovoltaic Systems (CPV-15), Fes, Morocco, 25–27 March 2019. [Google Scholar]
Figure 1. Reflective LCPV design: (a) V-trough LCPV [17] and (b) Compound Parabolic LCPV [18].
Sustainability 17 02537 g001
Figure 2. Refractive LCPV design: axially graded indexed lenses LCPV.
Sustainability 17 02537 g002
Figure 3. (a) Conventional, (b) double V-trough, (c) pyramidal, and (d) Enhanced V-trough.
Sustainability 17 02537 g003
Figure 4. m-Si PV cell dimensions.
Sustainability 17 02537 g004
Figure 5. Geometrical dimensions and properties of a v-trough concentrator.
Sustainability 17 02537 g005
Figure 6. Flowchart of the computational process.
Sustainability 17 02537 g006
Figure 7. Generated mesh of V-trough (a) and EDVC (b).
Sustainability 17 02537 g007
Figure 8. Boundary heat source vs. mesh size.
Sustainability 17 02537 g008
Figure 9. (a) Local sun power intensity distribution and (b) ray trajectories before truncation.
Sustainability 17 02537 g009
Figure 10. Local sun power intensity distribution (a) and ray trajectories (b) after truncation.
Sustainability 17 02537 g010
Figure 11. Different designs of V-trough concentrators [32].
Sustainability 17 02537 g011
Figure 12. Local sun power intensity distribution (a) and ray trajectories (b) for the conventional V-trough.
Sustainability 17 02537 g012
Figure 13. Local sun power intensity distribution (a) and ray trajectories (b) for the pyramidal concentrator.
Sustainability 17 02537 g013
Figure 14. Local sun power intensity distribution (a) and ray trajectories (b) for the double V-trough concentrator.
Sustainability 17 02537 g014
Figure 15. Ray trajectories of EDVC.
Sustainability 17 02537 g015
Figure 16. Local sun power intensity distribution for the EDVC at a tilt angle of 60°.
Sustainability 17 02537 g016
Figure 17. Sun power intensity distribution for the EDVC at a tilt angle of (a) 65° and (b) 70°.
Sustainability 17 02537 g017
Figure 18. Three-dimensional distribution of the temperature over the EDVC (a) and the temperature contour map of the silicon cell (b).
Sustainability 17 02537 g018aSustainability 17 02537 g018b
Figure 19. Temperature profile across the EDVC concentrator system on an x–z cut plane.
Sustainability 17 02537 g019
Figure 20. (a) I-V curve and (b) P-V curve for CVC, pyramidal, DVC, and EDVC with different angles.
Sustainability 17 02537 g020aSustainability 17 02537 g020b
Table 1. The dimensions and thermo-optical properties of the V-trough PV model.
LayerMaterialDimensions (mm)Thickness (mm)Thermal
Conductivity (W/mk)
Density (kg/m3)Real
Refractive
Index
Imaginary
Refractive
Index
CellSilicon20 × 200.213023303.7237.59 × 10−3
BusbarAluminum33 × 20.015202.427191.19787.617
ReflectorAluminum20 × 202202.427191.19787.617
Table 2. Geometrical parameters of the based-v-trough concentrators.
ψ L W Geometrical   Concentration   Ratio   ( C r g )
CVCDVCPyramidalEDVC
60°13.5×
65°1.5212.29×3.57×5.22×4.39×
70°2.242.56×4.06×6.41×5.23×
Table 3. Design parameters of the conventional V-trough concentrator (CVC), pyramidal concentrator, and double V-trough concentrator (DVC).
ψ L W Geometrical   Concentration   Ratio   ( C r g )
CVCPyramidalDVC
60°1
65°1.5212.29×5.22×3.57×
68°2.0132.51×6.29×4.02×
71°3.1643.06×9.36×5.12×
Table 4. Validation results, in terms of optical efficiency, for different V-trough concentrator designs.
Types [31] Validation
Optical   Efficiency   ( η o ) (%) Optical   Efficiency   ( η o ) (%) Absolute Mean Relative Error (%)
V-trough0.3690.890.44
Pyramidal1.5749.4150.2
Double V-trough0.01188.888.81
Table 5. Optical concentration ratios and efficiencies of the EDVC.
Tilt Angle [%]Geometrical Cr [x]Optical Cr [suns]Optical Efficiency [%]
603.53.2191.7%
654.393.8687.9%
705.234.6689.1%
Disclaimer/Publisher’s Note: The statements, opinions and data contained in all publications are solely those of the individual author(s) and contributor(s) and not of MDPI and/or the editor(s). MDPI and/or the editor(s) disclaim responsibility for any injury to people or property resulting from any ideas, methods, instructions or products referred to in the content.

