Article

Advancing Sustainable Concrete Using Biochar: Experimental and Modelling Study for Mechanical Strength Evaluation

by
Waqas Ahmad
1,*,
Venkata Satya Sai Chandra Sekhar Veeraghantla
1 and
Aimee Byrne
2,*
1
Department of Civil, Structural and Environmental Engineering, School of Transport and Civil Engineering, Technological University Dublin, D01 K822 Dublin, Ireland
2
Office of the Vice President for Sustainability, Technological University Dublin, Grangegorman Campus, Clock Tower CT101, Grangegorman, D07 XT95 Dublin, Ireland
*
Authors to whom correspondence should be addressed.
Sustainability 2025, 17(6), 2516; https://doi.org/10.3390/su17062516
Submission received: 13 February 2025 / Revised: 4 March 2025 / Accepted: 11 March 2025 / Published: 13 March 2025
(This article belongs to the Section Green Building)

Abstract

:
Innovative and creative solutions are needed to reduce the substantial carbon footprint of the concrete industry using low-carbon materials. Biochar has been recognised as an environmentally efficient material for concrete production. Also, it is required to build interpretable predictive models to advance modelling-based mix design optimisation. This study uses biochar as a cement substitute in concrete and assesses the mechanical strength using lab tests followed by predictive modelling approaches. Two types of biochar derived from olive pits and wood were used in 2.5 and 5 wt.% of cement. Cubes, cylinders, and beams were cast to test biochar concrete’s compressive, tensile, and flexural strength. The test data were used to develop and validate prediction models for the compressive strength (CS) using linear regression and gene expression programming (GEP) techniques. Moreover, SHapley Additive exPlanation (SHAP) analysis was performed to evaluate the influence of parameters on the CS. The results showed that olive pit biochar was more effective in enhancing the concrete strength than wood biochar due to the reduced particle size. The optimal replacement levels for olive pit biochar were 2.5 wt.% for the CS and 5 wt.% for the split tensile and flexural strength. The GEP model effectively captured the non-linear behaviour of biochar concrete and was more accurate than the linear regression model for the CS. The approach adopted in this study can be used to optimise mix design formulations for biochar concrete. These findings highlight the potential of biochar as a sustainable and effective cement substitute, contributing to the development of greener concrete with improved mechanical performance. Integrating biochar into concrete production can significantly lower the industry’s carbon footprint, promoting environmentally responsible construction practices while maintaining structural integrity.

1. Introduction

The increasing human population and its activities have resulted in numerous harmful environmental effects. Climate action is a key Sustainable Development Goal (SDG) highlighted by the United Nations. Carbon sequestration as a means of reducing global emissions has been emphasised by all nations as requiring attention in the forthcoming decades [1]. CO2 is the primary component of greenhouse gases (GHGs), with its releases predominantly stemming from human-caused activity [2]. It is a critical component influencing global climate change, necessitating immediate and significant measures. Even though industries associated with mineral-derived construction materials have improved their manufacturing processes, reducing CO2 release continues to be a challenge [3]. Problems will persist unless these challenges are resolved through the implementation of multifaceted strategies. One of these critical areas is the transition to alternative construction materials that have low carbon footprints, as this can considerably reduce the effects of climate change [4,5,6].
The Intergovernmental Panel on Climate Change (IPCC) has reported that the use of biochar is a promising and safe approach for promoting carbon neutrality [7]. A single tonne of biochar has the potential to capture 2.0–2.6 tonnes of CO2 [8]. Carbon can be stabilised and stored after biochar is produced through the pyrolysis of diverse waste biomass, including rice straw, food waste, wood, sludge, and manure, in the presence of a restricted oxygen supply [9,10,11,12,13]. Biochar is primarily used in the agricultural sector [14]. Nevertheless, it is challenging for biochar to exhibit its maximum ability in densely populated regions with restricted farmland. Additionally, concerns regarding soil contamination may arise with respect to certain biochar that has been pyrolysed from contaminated waste [15]. It is essential to explore new sectors to expand and diversify the large-scale application of biochar.
Significant efforts are being made to decarbonise cement-based composites in the building industry. Concrete is one of the most prolific construction materials because of its affordability and durability in structural applications. The manufacture of 1 tonne of Portland cement generates 0.98 tonnes of CO2 from fuel combustion and calcination [16], accounting for roughly 6–7% of total world CO2 releases [17,18]. Innovations and creative solutions are essential to decrease the significant carbon footprint of the concrete sector by using low-carbon materials [7,19]. Biochar has been identified as an eco-efficient material for concrete manufacturing, potentially enhancing its mechanical strength [20]. Biochar has been used to substitute cement at varying weight proportions in concrete, where it remains stable. This results in reduced embodied carbon of the concrete mix and the greater carbon sequestering capability of the final concrete product [21,22,23]. The formulation of biochar-modified concrete must reconcile environmental advantages with mechanical properties. Compressive, flexural, and tensile strengths are fundamental mechanical properties that are crucial metrics for assessing the performance of concrete. The literature indicates that the optimum percentage of biochar for concrete strength is highly dependent on other details of the mix design. Qin et al. [24] indicated that using biochar concrete exhibited superior compressive and tensile strengths compared to normal concrete when less than 6.5 wt.% of cement was substituted with biochar. Sirico et al. [25] discovered that the compressive strength (CS) of concrete slightly increases with 2 wt.% biochar as a cement substitute, while 5 wt.% biochar caused a decrease in the CS. However, the flexural strength (FS) of concrete increased at both 2 and 5 wt.% biochar substitution levels with 2 wt.% biochar yielding the maximum FS. The integration of biochar enhances the strength of concrete by filling its pores and increasing compactness [24]. Also, the reinforcing impact was significant when a smaller quantity of cement was substituted with biochar [26]. An increased substitution of biochar for cement enhances carbon sequestration in concrete but has a detrimental impact on the material’s strength [23].
The development and refinement of prediction models for the material’s properties are reducing the effort and time required for testing. The intrinsic behaviour of concrete may not be accurately predicted by conventional regression analysis because of the non-linear behaviour of concrete [27]. Machine learning (ML)-based methods are among the advanced prediction techniques used for developing prediction models. Various ML models, including neural networks, gene expression programming (GEP), support vector regression, random forest, and decision trees, have been effectively employed to predict material properties [28,29]. GEP is a valuable multiphysics model as it disregards previously established relationships during the model development process [30,31]. It has the potential to provide a mathematical formula for predicting behaviour that can be implemented in real-world scenarios [32,33,34]. In contrast to neural networks, GEP offers numerous benefits. There is a lack of practical utility in the discussion of artificial neural network (ANN) algorithms as they are incapable of establishing a functional relationship or framework. GEP, on the other hand, generates output in the form of an expression tree that can be decoded to determine a mathematical relationship. The provision of dependable models is a testament to the novelty of GEP’s unique capability of establishing frameworks [35]. This attribute improves the precision of GEP’s future predictions. Neural networks are classified as black box algorithms due to their limitations, which restrict their practical application. GEP, as a consequence, is a viable alternative to these methods, superseding other approaches in addressing technical and complex problems [36,37,38]. Some ML methods have been used previously to estimate the properties of biochar concrete [39,40,41]; however, no study was found in the literature that developed interpretable ML models that yield model equations for future predictions using experimental test findings.
Despite the growing emphasis on reducing the carbon footprint of the concrete industry, the integration of low-carbon materials such as biochar remains underexplored in terms of its mechanical performance and predictive modelling applications. While previous studies have investigated the use of biochar in cementitious composites, a comprehensive understanding of how different biochar sources (e.g., olive pits versus wood) influence the mechanical properties of concrete is still lacking. Additionally, traditional experimental methods for mix design optimisation are time-consuming and costly, necessitating the development of efficient, interpretable predictive models. Existing models often fail to capture complex, non-linear relationships governing the compressive strength of biochar concrete, limiting their practical utility in material design. In this study, experimental testing was performed using olive pit and wood-derived biochar at 2.5 and 5 wt.% as cement substitutes in concrete to examine the compressive, tensile, and flexural strengths. Thereafter, the test findings were used to develop linear regression and MEP prediction models for the CS of biochar concrete. The purpose was to compare the performance of both models based on predictability performance. The reason for choosing the GEP ML technique is because it provides complex mathematical expressions that are expected to interpret the real non-linear nature of concrete compared to the linear regression technique. The developed prediction models were assessed via performance indicators like the coefficient of determination (R2) and error analysis. The impact of input parameters on the model outcomes was studied using SHapley Additive exPlanation (SHAP) analysis. This study is limited to developing prediction models for the CS only as it is the crucial concrete property, and various mechanical and durability characteristics are directly or indirectly associated with the CS of concrete [42]. Also, the correlation of FS and split tensile strength (STS) with the CS of biochar concrete was studied. The prediction models resulting from this research are expected to be used for CS predictions of biochar concrete, thereby advancing modelling-based mix design optimisation.

2. Research Methods

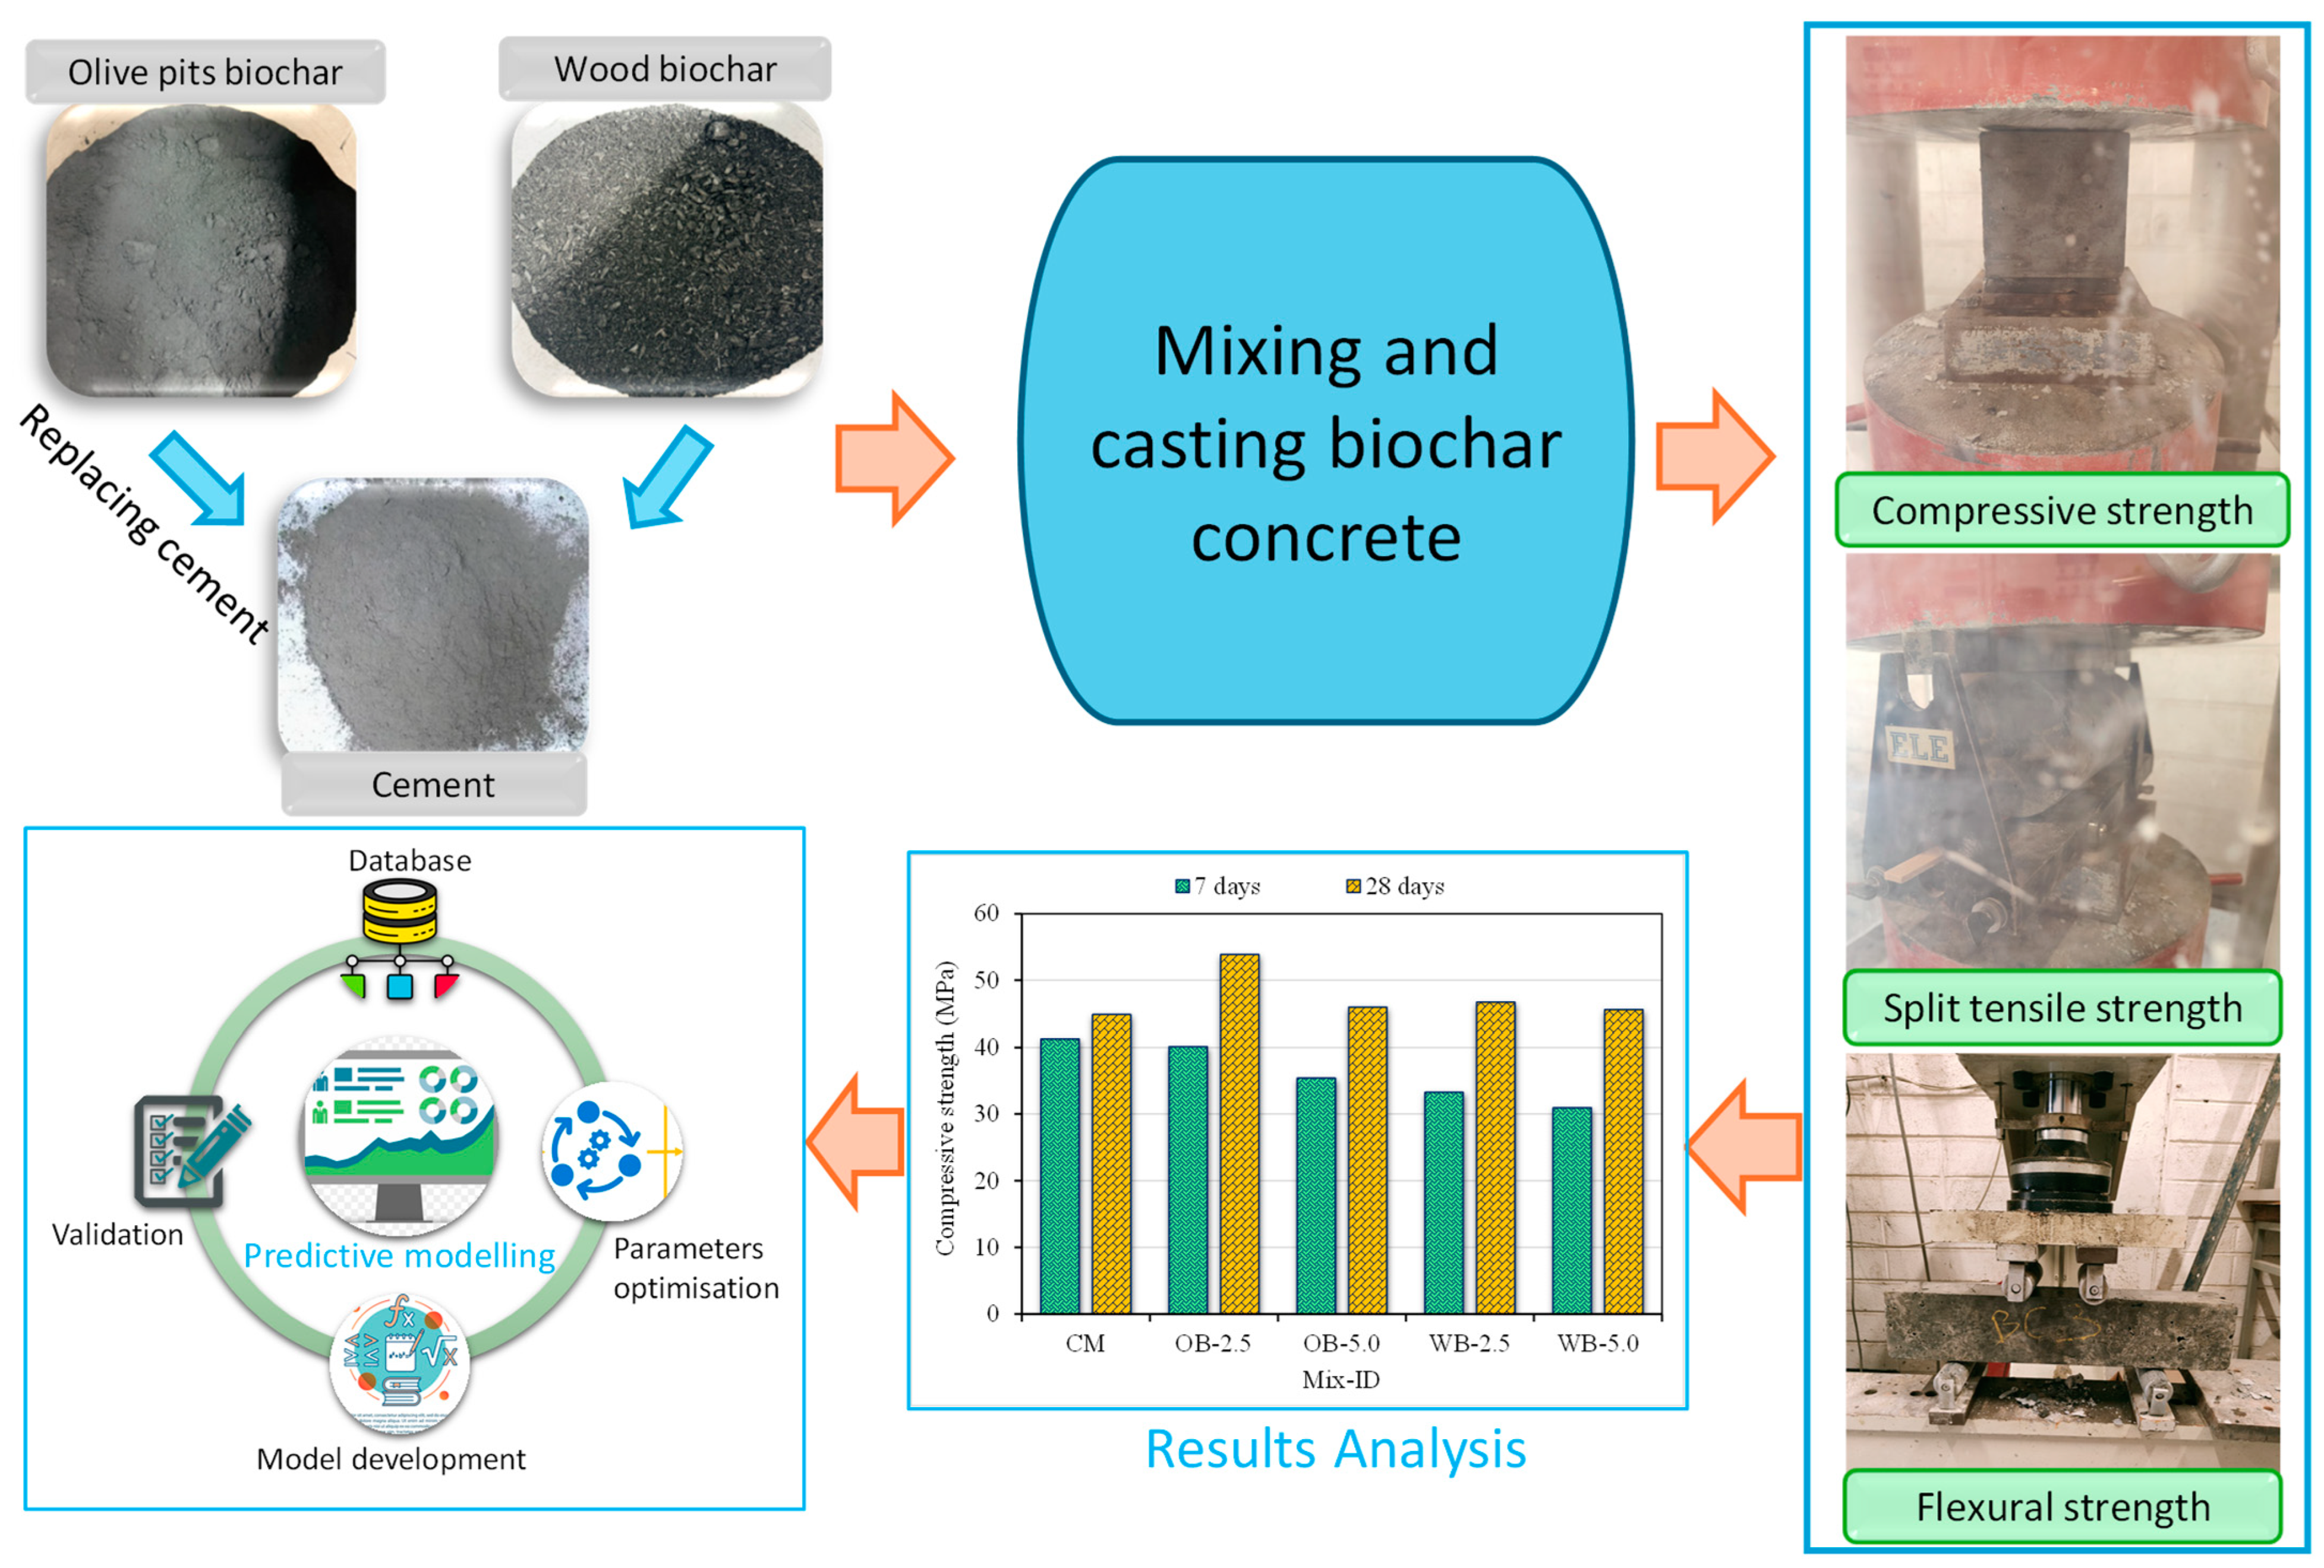
2.1. Experimental Study

Cement was procured from Irish Cement “CEM I 42.5 R Portland Cement, EN 197-1”. Biochar was acquired from Germany, of which the particle size of olive pit biochar was D90 < 35 μm and that of wood biochar was D90 < 125 μm, indicating comparatively coarser particles of wood biochar. Biochar was used to replace cement by weight in proportions of 2.5% and 5.0% to prepare biochar concrete mix. Locally available fine and coarse aggregates were used. The mix design for the control mix (CM) and biochar concrete are provided in Table 1. The water-to-binder ratio was kept at 0.47 to achieve a slump between 60 and 180 mm. All the ingredients were put into a mechanical mixer and mixed for around five minutes. Additionally, 100 mm cubes for the CS, 100 mm cylinders with 200 heights for STS, and 100 × 100 × 500 mm beams for FS were cast. After casting, specimens were kept in moulds for 24 h at room temperature and then demoulded. All the specimens were kept in water for 7 and 28 days of curing before testing. Five mix proportions were chosen for the experimental programme, and three samples for each mix were cast to test at 7 and 28 days.
The concrete CS test was conducted in compliance with I.S. EN 12390-3:2019 [43] using a standard cube specimen. The test was conducted using a compression testing machine in accordance with I.S. EN 12390-4:2019 [44] at a constant loading rate. The STS test on concrete was conducted as per I.S. EN 12390-6:2023 [45]. The STS was evaluated using an indirect testing approach, wherein a standard cylindrical specimen was subjected to a horizontal compressive load, resulting in tensile failure. The collapse manifested as a vertical fracture along its diameter. The FS test was conducted conforming to I.S. EN 12390-5:2019 [46]. In this test, the FS of concrete was evaluated by measuring its bending capability under load until failure occurred. The four-point bend test configuration had two roller supports and two rollers for applying load. The procedure requires positioning beam specimens within the testing apparatus, ensuring that the longitudinal axis is perpendicular to the rollers. The failure load of beam specimens is ascertained by applying a continuous load. Equations (1)–(3) were used to calculate CS, STS, and FS, respectively.
C S = F A c
S T S = 2 F π L d
F S = F l d 1 d 2 2
where
  • F = maximum load in N.
  • A c = cross-sectional area of the contact specimen in mm2 (10,000 mm2 in this study).
  • L = height of the cylinder specimen in mm (200 mm in this study).
  • d = diameter of the cylinder specimen in mm (100 mm in this study).
  • l = distance between the support rollers in mm (300 mm in this study).
  • d 1 and d 2 = cross-sectional dimensions of beams (100 mm in this study).

2.2. Modelling Study

A set of input variables is necessary for developing prediction models for a desired outcome [47]. The ML model may exhibit inferior performance if a constant value or input with less variation is used in the dataset [48]. The experimental data were employed to calculate the CS of biochar concrete. The data were arranged in a comma-separated values (CSV) file with each parameter in columns and output in the last column. The modelling techniques involved cement quantity, biochar quantity, and curing days as input features, with CS serving as the output. Two techniques, including linear regression and GEP, were used for modelling. Linear regression yields a linear model equation, while the GEP can yield a complex model equation for more accurate prediction. This modelling study was performed to assess the predictability of both models for the CS of biochar concrete. The impact of input parameters on the model outcomes was studied using SHAP analysis. A flow diagram of the research strategy followed for experiment and modelling is provided in Figure 1.

2.2.1. Model Development with GEP

Spyder tool (version: 5.5.1) from Anaconda Navigator (freely accessible) was used to develop the GEP model using Python code. The gplearn library was exploited to build a symbolic model for predicting the CS of biochar concrete. Mathematical functions, including addition, multiplication, subtraction, square root, and division, were defined and incorporated into the model to enhance its predictive capabilities. The input data were preprocessed using standard scaling, and a random train/test split of 20 points for training and 10 points for testing was applied. The symbolic regressor was trained with a population size of 1000 and 8 generations, using an extensive function set and a parsimony coefficient to balance model complexity and accuracy. Performance evaluation included K-fold cross-validation (5-fold) to compute the mean squared error (MSE), which was further validated on test data. The use of 5-fold cross-validation was based on prior studies [49,50]. Results, including the predicted versus experimental results for both training and test sets and the final generated equation, were exported for further analysis. This approach demonstrated the utility of GEP in deriving interpretable, data-driven equations with high predictive accuracy for engineering materials. The list of hyperparameters based on the trial-and-error method used during GEP modelling is provided in Table 2.

2.2.2. Models’ Validation Strategy

The statistical parameters R2, MAE, root mean square error (RMSE), scatter index (SI), mean absolute percentage error (MAPE), and the objective function (OBJ) were used to assess the efficacy of the prediction models generated. The R2 value of the model’s predicted result reflects its accuracy and quantifies the degree of deviation between the model results and the test values [51]. A numerical value of R2 near zero signifies a greater degree of divergence, whereas a value close to one implies less divergence. The developed model’s predictability was also measured by statistical errors (MAPE, RMSE, MAE), OBJ, and SI, with lower values indicating a higher precision [52]. The statistical valuation of the exactness of prediction models was conducted using Equations (4)–(6) from [53,54] and Equations (7) and (8) from [55]. A similar approach to ML model validation has been used by researchers in prior studies [52,56].
M A P E = 100 % n i = 1 n | P i E i | E i ,
R M S E = P i E i 2 n ,
M A E = 1 n i = 1 n | P i E i | ,
S I = R M S E y
O B J = R M S E + M A E R 2 + 1
where n = data points (numbers), P i   = predicted model result, E i = experimental result, and y   = mean of predicted results.

2.2.3. SHAP Analysis Method

SHAP analysis, developed by Lundberg and Lee [57], is a comprehensive method for understanding ML-based modelling. The Shapley value is a number used to demonstrate the relative contribution and impact of input variables in yielding the final outcome. The approach closely resembles parametric analysis, wherein other variables remain constant while one variable is altered to see its impact on the target feature [58]. This section examines the significance of each variable in the findings of biochar concrete CS values, thereby explaining the influence of input variables on the CS. A SHAP summary plot is generated to visualise feature importance, aiding in understanding the factors influencing CS and their relative significance in the predictive model.

3. Results and Discussion

3.1. Experimental Results

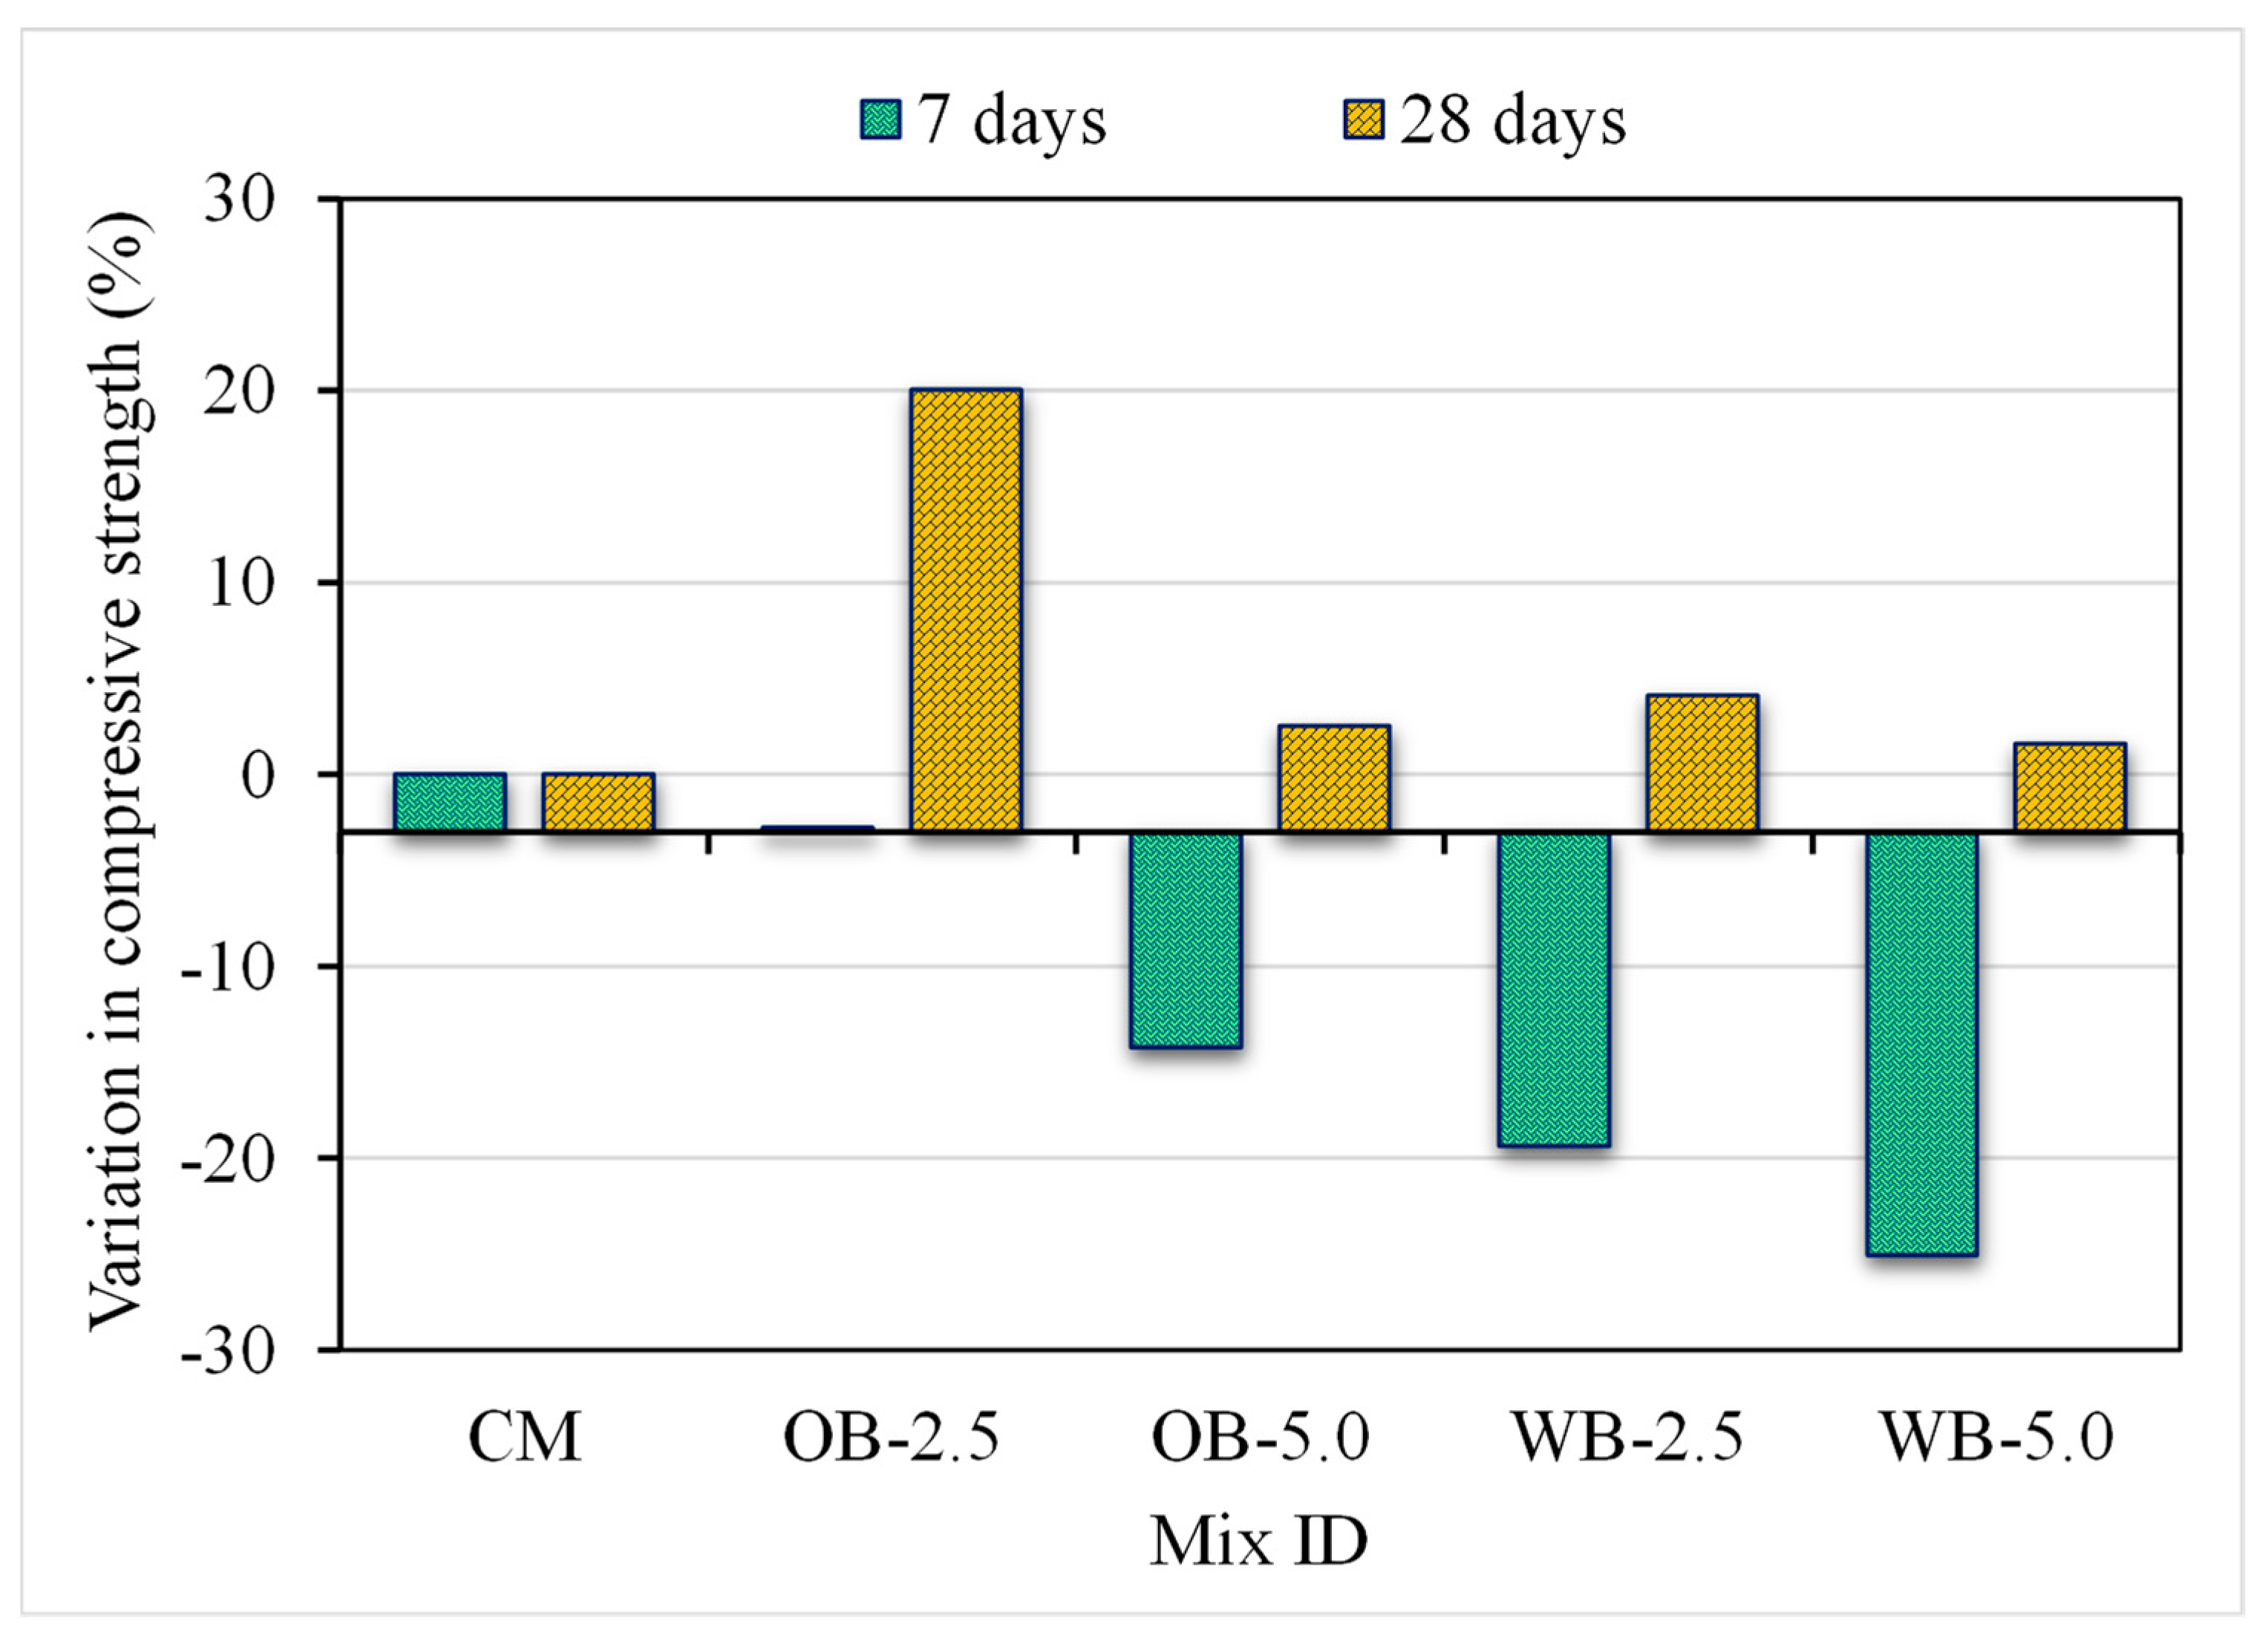
3.1.1. Compressive Strength

The CS results after 7 and 28 days of curing are shown in Figure 2. Figure 3 was generated to illustrate the percentage variation in CS with respect to the CM for biochar concrete specimens. At the age of 7 days, the CM achieved a maximum CS of 41.27 MPa, while the CS was decreased notably by around 2.8%, 14.0%, 19.4%, and 25.0% in the OB-2.5, OB-5.0, WB-2.5, and WB-5.0 mixes compared to the CM at 7 days. At the age of 28 days, the OB-2.5 mix (2.5 wt.% olive pit biochar) achieved the maximum CS of 53.87 MPa with around 20.1% increase in the CS in comparison with the CM (CS = 44.88 MPa). The OB-2.5 mix exhibited an increased CS gain of 34.3% compared to its 7-day CS. Other biochar concretes, OB-5.0, WB-2.5, and WB-5.0, had an increase in CS of 2.5%, 4.1%, and 1.6% with respect to the CM. The outcomes showed that the incorporation of 2.5 wt.% olive pit biochar was more effective in increasing the CS of concrete. Though the use of wood biochar did not indicate a substantial impact, a gain in CS of around 40.3% in WB-2.5 and 47.5% in WB-5.0 compared to their 7-day CS is a noteworthy gain. The higher strength gain in concrete at 28 days compared to 7 days with wood biochar was also noted by Sirico et al. [25].
The higher replacements of 5% olive pit biochar in the OB-5.0 mix led to a reduction in CS by around 14.6% when compared to OB-2.5. A similar pattern was found in wood biochar concrete with 5 wt.% content in the WB-5.0 mix, resulting in a drop in the CS by 2.4% compared to the WB-2.5 mix. These findings clearly indicated a decrease in CS when the ratio of biochar was increased and are aligned with the previous studies [25,59,60]. A key reason for the lower CS at 7 days is that biochar can delay early hydration. Its porous structure may absorb some of the mixing water, reducing the amount immediately available for cement hydration in the first few days. However, over time, the absorbed water can be gradually released (internal curing), and the filler effect of finer biochar particles becomes more pronounced, leading to improved CS gains at a later age [61]. Compared to the wood biochar concrete, olive pit biochar concrete exhibited increased CS due to the finer particle size of olive pit biochar (D90 < 35 μm) compared to the wood biochar (D90 < 120 μm). Finer particles can efficiently occupy the voids between cement particles and produce a more compact concrete mixture, hence improving its strength [62]. Therefore, a finer particle size biochar in lower replacement levels around 2.5 wt.% of cement was found to achieve the maximum CS of biochar concrete in this study.

3.1.2. Split Tensile Strength

The results of STS for all mixes are shown in Figure 4, and the percentage variation in STS of biochar concrete compared to the CS is illustrated in Figure 5. At the age of 7 days, the OB-2.5 mix achieved the maximum STS of 3.87 MPa, which was slightly higher than the CM with 3.72 MPa. The other biochar concrete mixes did not show meaningful improvements. The STS of OB-5.0 was the same as the CM, and decreases in the STS of around 4.3% and 15.2% were observed in the WB-2.5 and WB-5.0 mixes compared to the CM. At the age of 28 days, the highest STS of 4.68 MPa was noted in the OB-5.0 mix with about a 7.8% rise in the STS than the CM, and an increased STS gain of 24.8% was found compared to its 7 days STS. The OB-2.5 mix showed an increase in STS of around 1.3% over the CM with a strength gain of 13.4% over its 7-day STS. Likewise, an increase in STS at 28 days compared to 7 days for biochar concrete is also noted in previous studies [20,24]. Lower STS values were observed in wood biochar concrete mixes, with declines in the STS of 16.6% and 6.9% in the WB-2.5 and WB-5.0 mixes when compared to the CM. These findings showed that the use of olive pit biochar at 5 wt.% of cement increased 28 days STS while 2.5 wt.% olive pit biochar yielded better STS at 7 days. Another important observation was an increase in STS when the ratio of biochar increased from 2.5 to 5 wt.%. An improvement in STS of about 11.9% in wood biochar and 6.6% in olive pit biochar was noted. However, mixes containing wood biochar exhibited lower STS values compared to olive pit biochar mixes and the CM due to higher particle size, as discussed in the previous section.

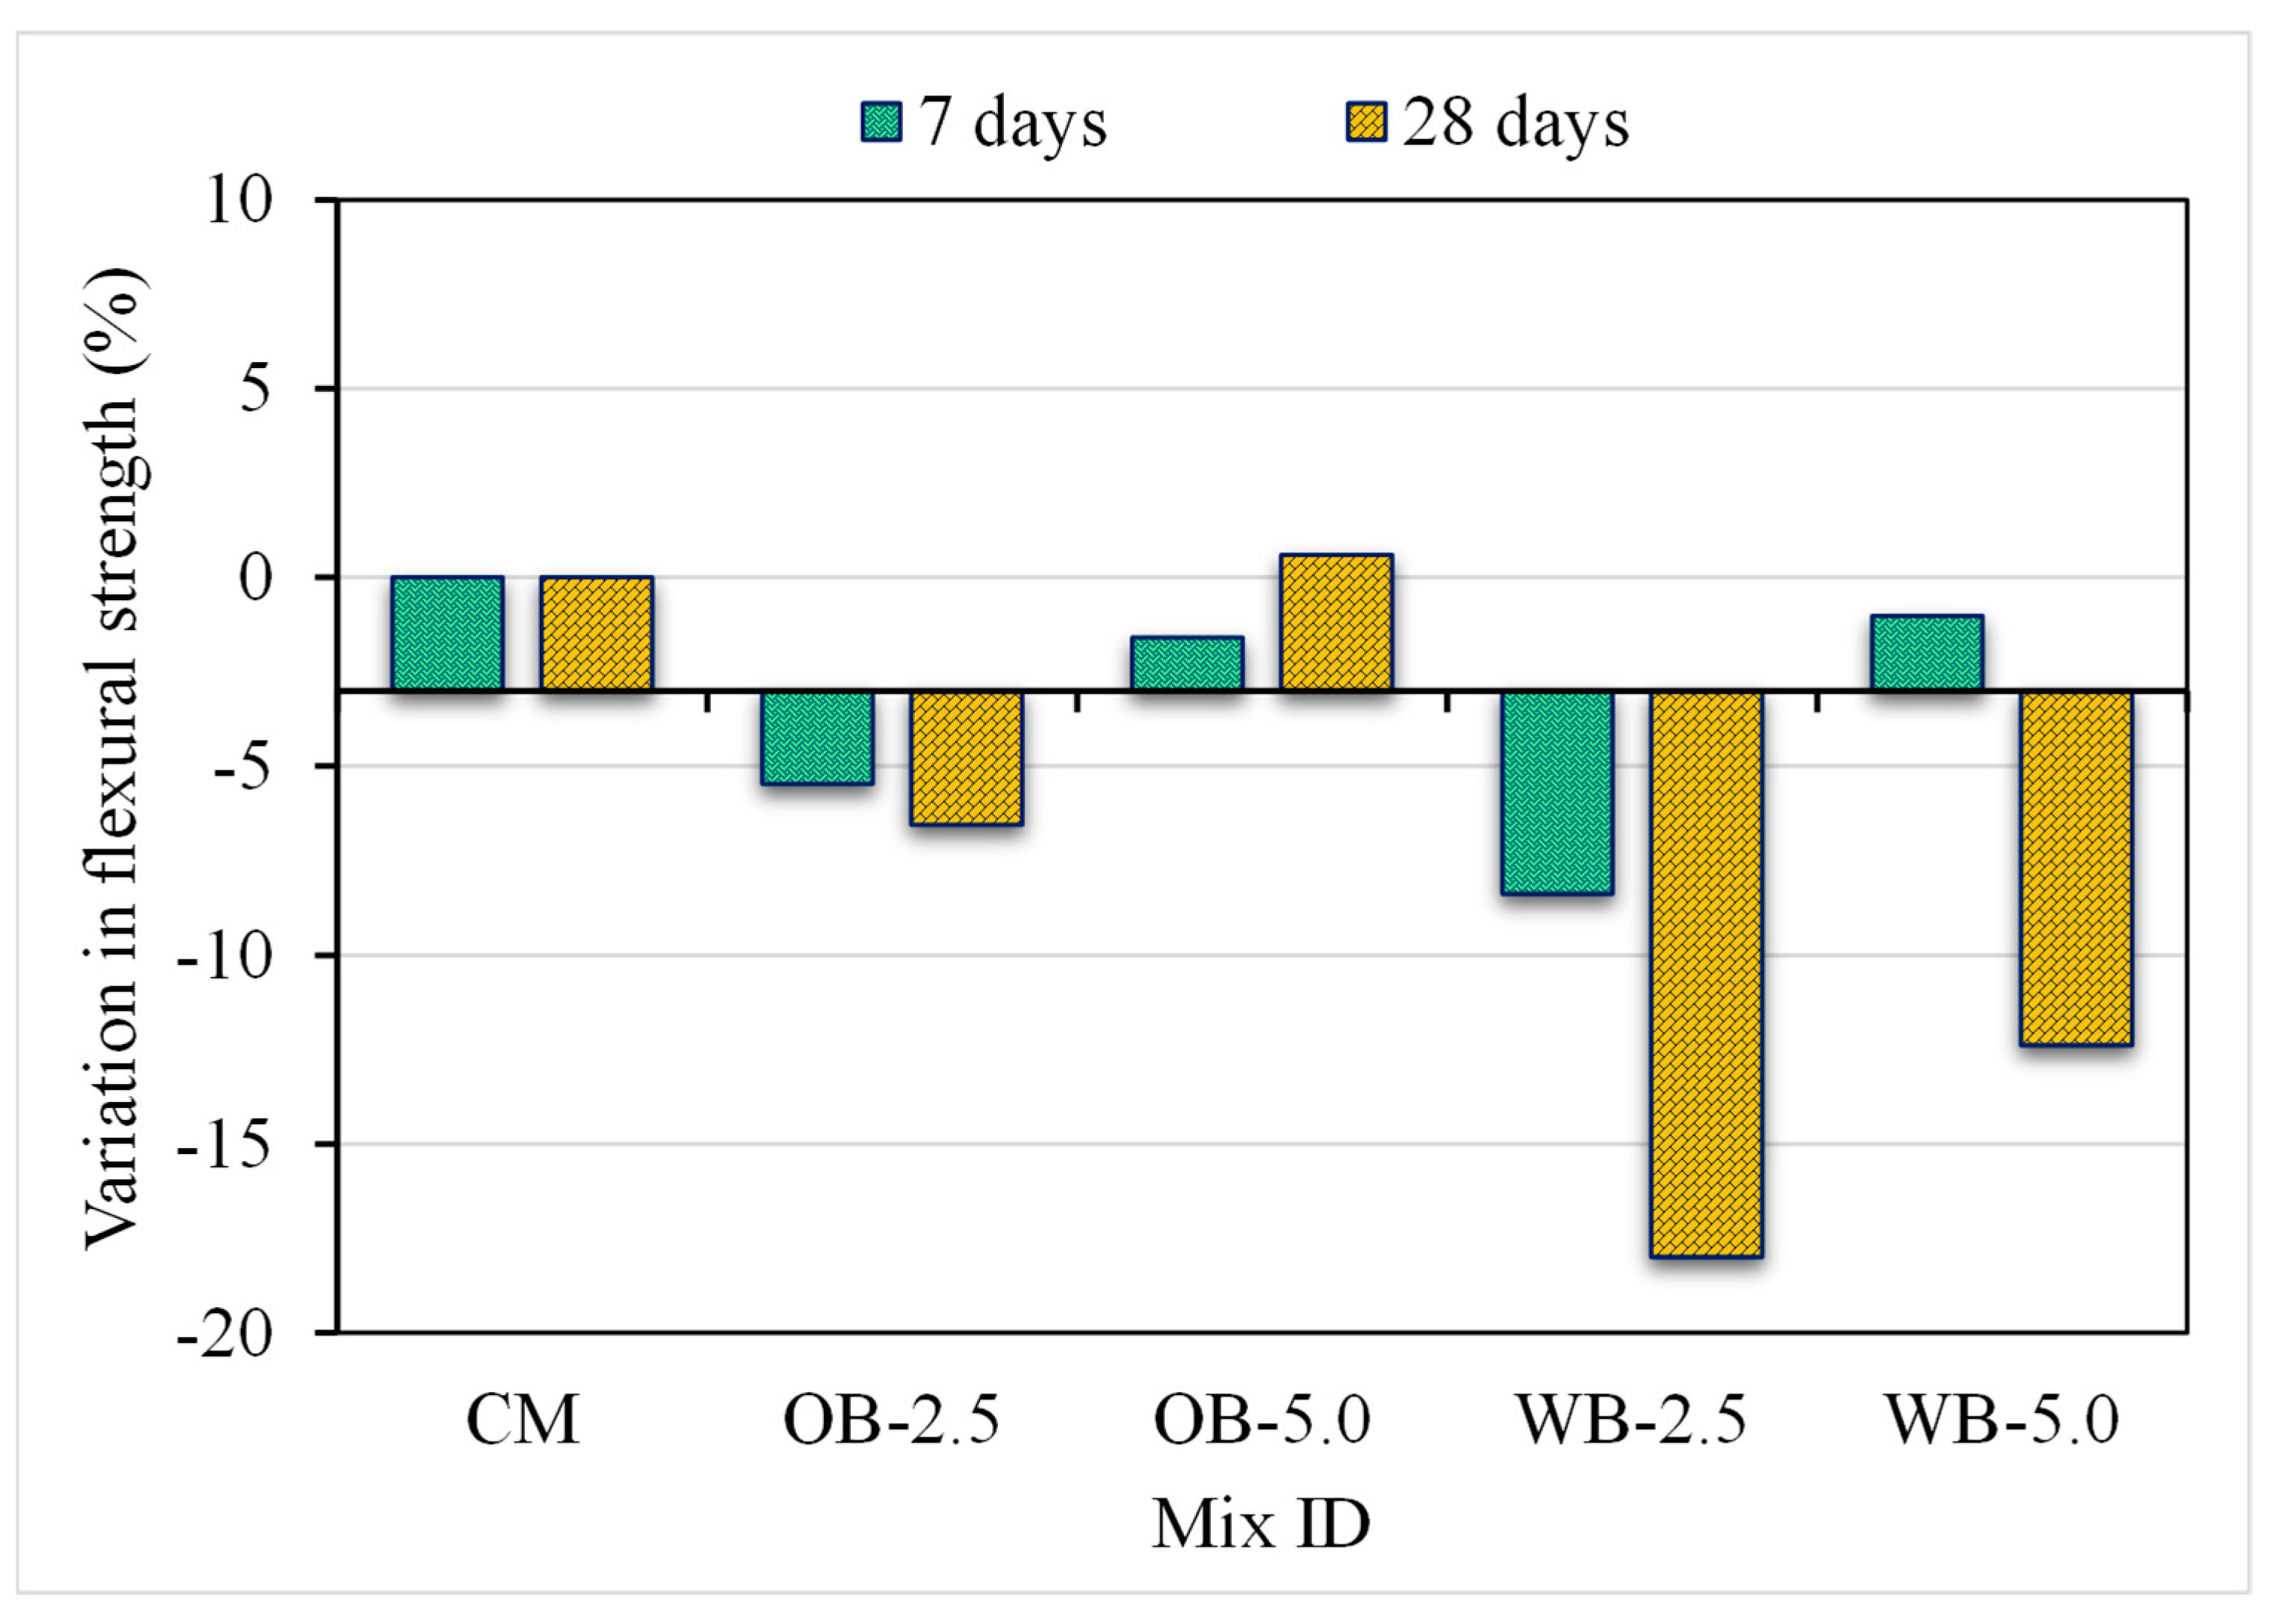
3.1.3. Flexural Strength

Figure 6 displays the results of the FS of biochar concrete at two testing ages, whereas Figure 7 depicts the variation in percentage for the FS compared to the CM. At the age of 7 days, the maximum FS of 5.27 MPa was noted in the CM, whereas the FS was reduced by around 5.5%, 1.6%, 8.4%, and 1.1% in the OB-2.5, OB-5.0, WB-2.5, and OB-5.0 mixes, respectively. At 28 days, the maximum FS of 6.26 MPa was noted in the OB-5.0 mix, which is nearly the same as the CM in which 6.23 MPa FS was achieved. The other mixes showed a lower FS by 6.6% in OB-2.5, 18.0% in WB-2.5, and 12.4% in WB-5.0 compared to the CM at 28 days. The gain in STS compared to 7 days STS was more prominent in specimens containing olive pit biochar, resulting in around a 16.9% rise in OB-2.5 and 20.9% in OB-5.0, and less prominent in specimens containing wood biochar, resulting in about a 5.8% increase in WB-2.5 and 4.8% in WB-5.0. It can be interpreted from these findings that the use of 5 wt.% olive pit biochar improved the FS of concrete at 28 days, whereas a 2.5 wt.% content of the same biochar led to diminished FS. The results of Jia et al. [61] also showed a reduction in FS than the CM when 2% municipal solid waste biochar was used as a cement replacement in concrete, while 3% biochar samples had a higher FS than the CM.

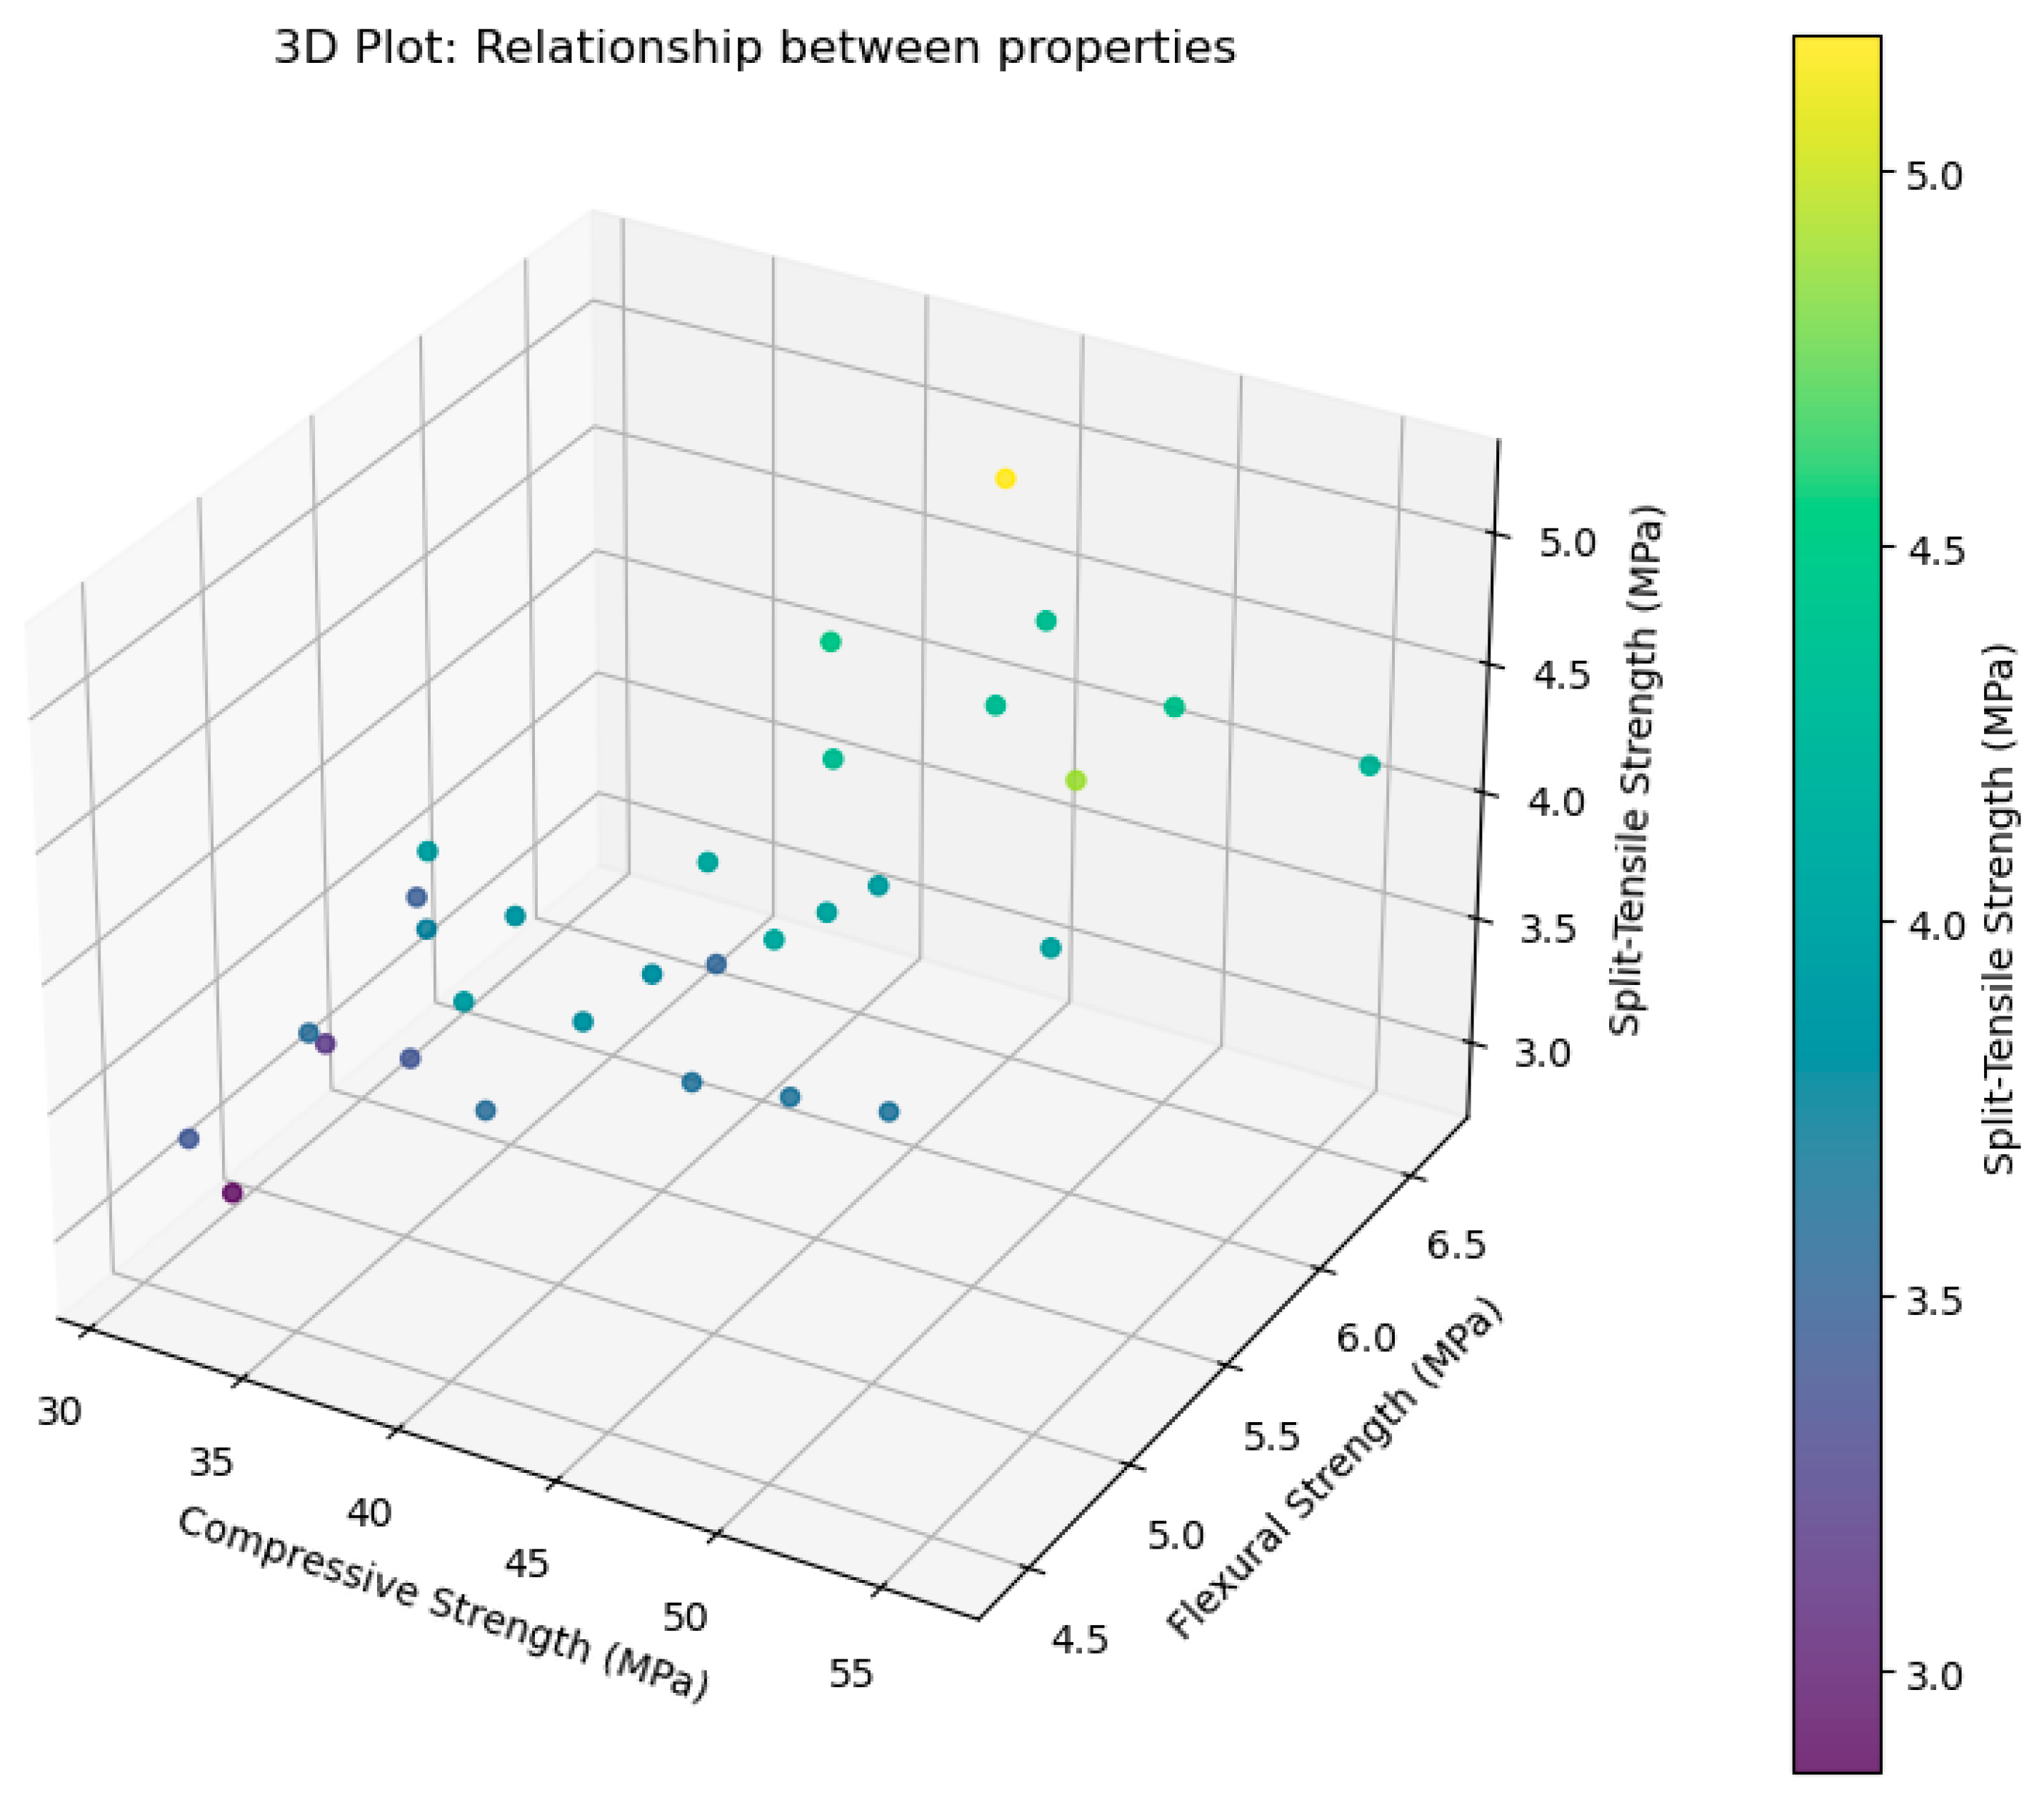
3.1.4. Relationship Between Mechanical Strengths

The 3D scatter plot in Figure 8 illustrates the relationships between the CS (X-axis), STS (Y-axis), and FS (Z-axis) of the material, with a colour gradient representing variations in FS. Data points demonstrate a positive correlation, indicating that increases in CS and STS are generally associated with higher FS. The colour gradient, ranging from dark to light, highlights the distribution of FS values across the dataset, providing a clear visualisation of how this property depends on the other two. This plot aids in understanding the interdependencies of these mechanical properties and their combined influence on material performance.
The 3D scatter plot in Figure 9 illustrates a similar relationship between properties with STS as a dependent variable. The plot shows a positive correlation, where higher CS and FS correspond to higher STS, although some variability is observed at higher values. Compared to the previous plot (Figure 8), where FS was the dependent variable, this plot exhibits more clustering and minor deviations, suggesting STS may depend on additional factors or have a slightly non-linear relationship. The previous plot showed a smoother trend, indicating FS is more directly influenced by CS and STS. Both plots confirm the interdependence of these properties, with FS serving as a composite property while STS reflects variations in the material’s ability to handle combined loads. Figure 8 and Figure 9 exhibit the strong interdependence of mechanical strengths in biochar concrete, emphasising the need to consider all three properties for holistic material performance evaluation. While FS appears to follow a more predictable relationship with CS and STS, STS exhibits some variability, requiring further analysis to understand its dependencies fully. These insights are crucial for optimising material formulations for structural applications, ensuring durability and resilience in real-world conditions.

3.2. Modelling Results

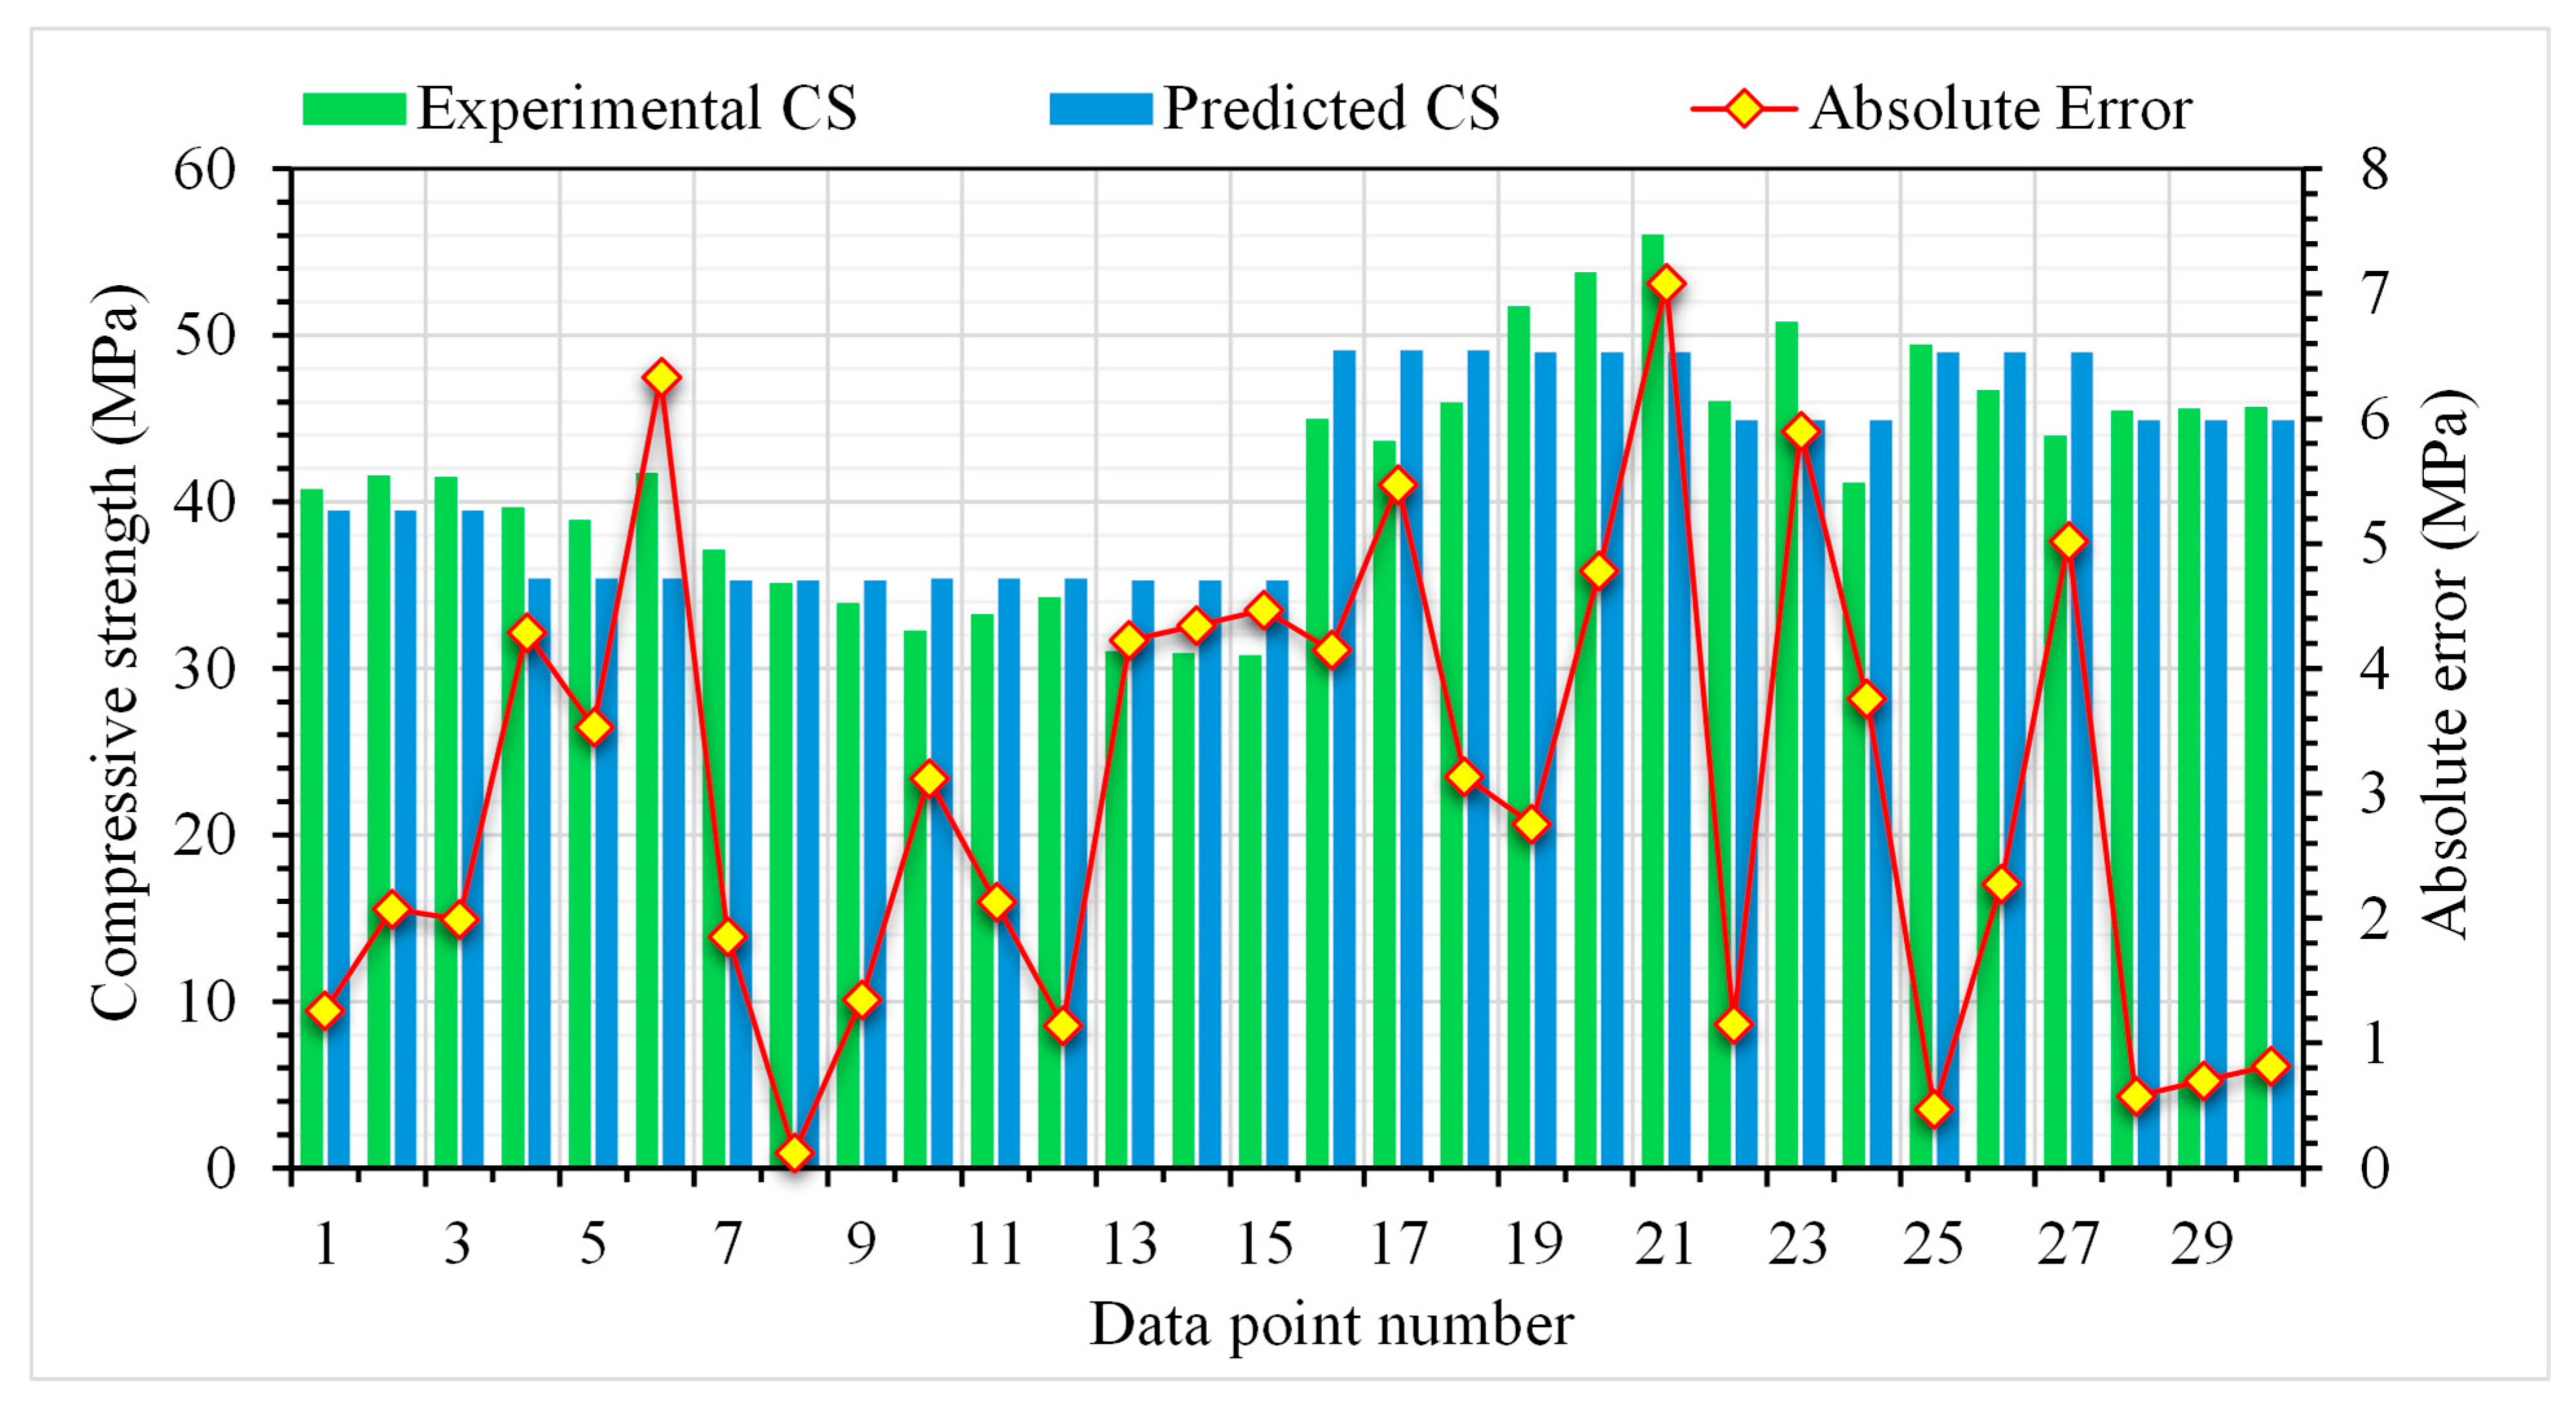
3.2.1. Linear Regression CS Model
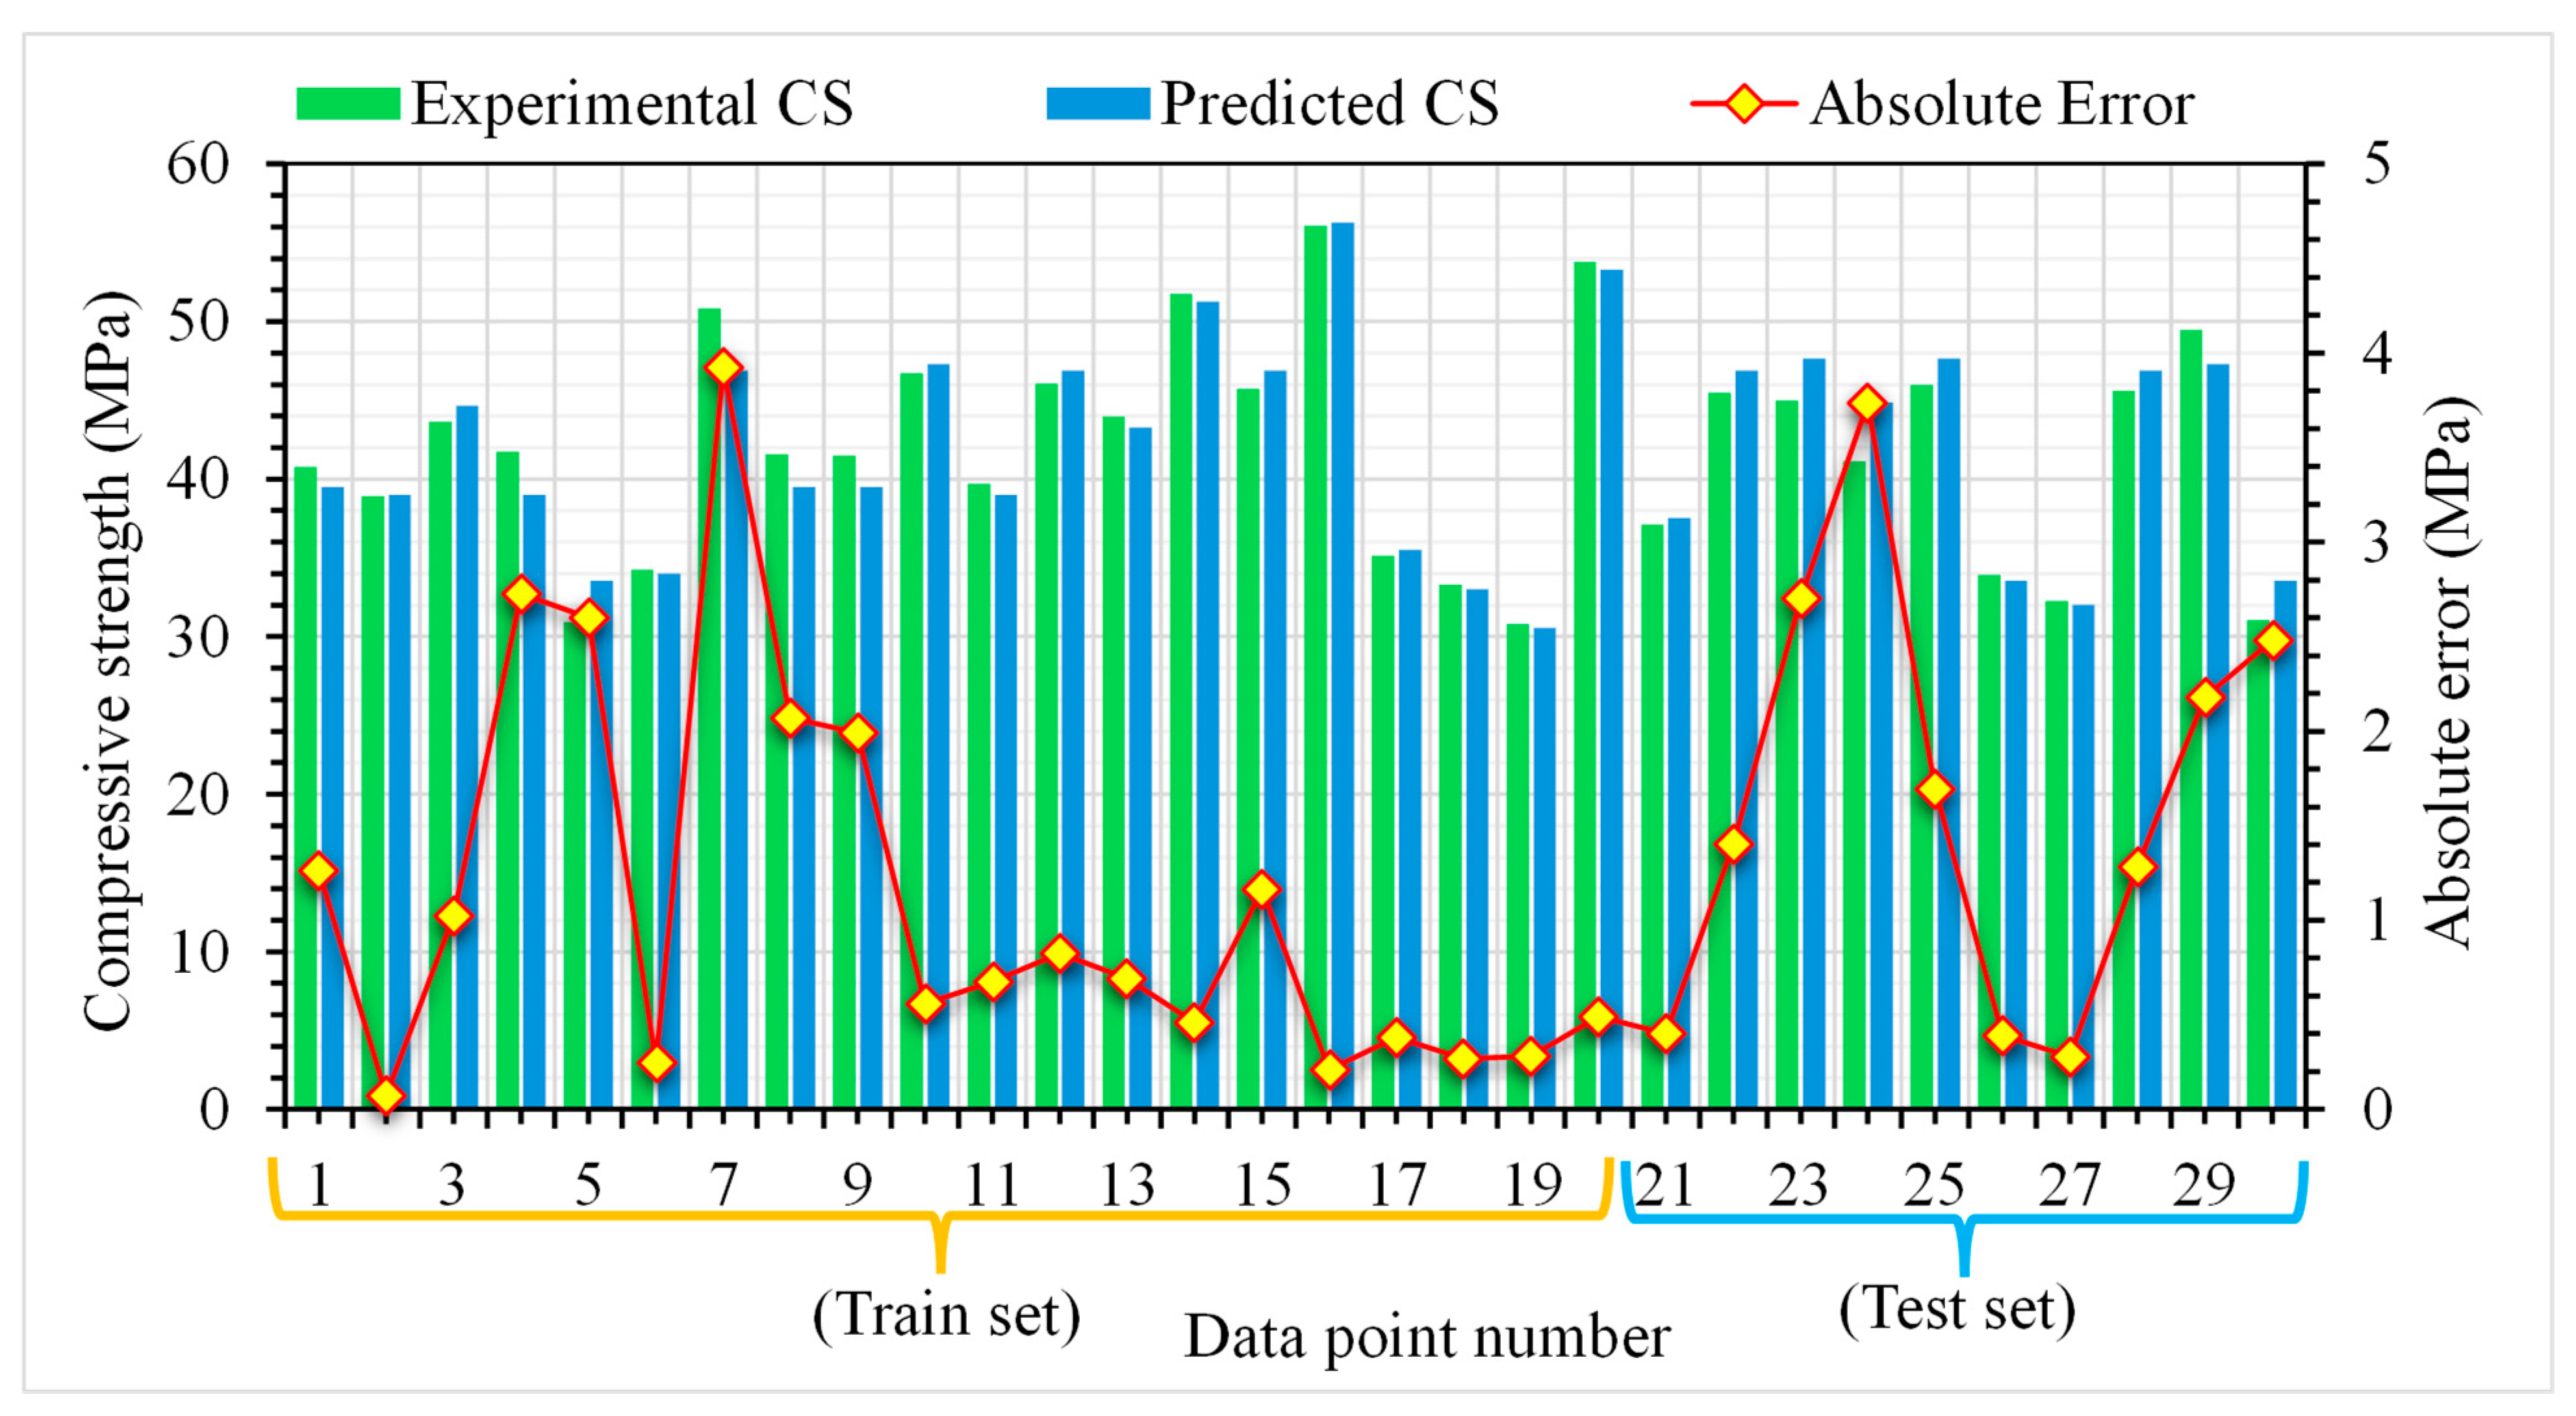
The linear regression model for the CS of biochar concrete was developed using three variables, including cement, biochar, and curing time, as the other variables (water, coarse and fine aggregate) in the experimental setup were constant for all mixes. The model’s mathematical expression is provided in Equation (9), which can be used for the calculation of CS. Further evaluation of the model was performed for its predictability performance by plotting the experimental and predicted outcomes, as displayed in Figure 10. The closer the data points are to the diagonal line (y = x), the higher the predictive precision, implying that the model correctly shows the inherent relationships among the input variables. The R2 value of 0.73 implies a moderate degree of accuracy for the linear regression model for the CS of biochar concrete. It is evident that the behaviour of concrete in compression is not linear; therefore, linear equations are unable to predict its real nature. Figure 11 was generated to plot the experimental model predicted (shown in vertical bars with values on the primary axis) and the absolute error (shown in line with values on the secondary axis) between the experimental and predicted results. The absolute errors were from 0.124 MPa to 7.08 MPa, with an average value of 3.0 MPa. The distribution of absolute errors was 5 values below 1.0 MPa, 10 between 1.0 and 3.0 MPa, and 15 above 3.0 MPa. These values further confirm the moderate level of accuracy for the linear regression model in estimating the CS of biochar concrete.
C S p = 46.70 + 0.176   C 0.165   B + 0.553   C T
where C S p is the predicted CS from the regression model in MPa, C is the quantity of cement in kg/m3, B is the quantity of biochar in kg/m3, and C T is the curing time in days.

3.2.2. GEP CS Model

In order to more accurately interpret the non-linear nature of biochar concrete in compression, a GEP model with additional mathematical functions was developed, as shown in Equation (10). The GEP equation encapsulates both linear and non-linear terms, which may include polynomial relationships, interactions between variables, or other mathematical functions that reflect the influence of each factor (cement, biochar, and curing time) on the predicted CS. By balancing simplicity and accuracy, the GEP equation offers a valuable expression for mix design and curing optimisation in biochar concrete production. The relationship between the experimental CS and GEP-derived predicted CS was plotted and displayed in Figure 12. As the GEP technique splits data in training and testing, both results are shown in the figure. This data splitting, in combination with the K-fold method, resulted in a model with a higher level of precision. The R2 value of 0.96 for the training set and 0.93 for the test set confirms the better accuracy of the GEP model, as the data points are close to diagonal lines. The dispersal of the experimental GEP model’s predicted and absolute error values for both the train and test set are shown in Figure 13. The absolute errors were from 0.07 MPa to 3.92 MPa, with an average value of 1.28 MPa. The distribution of absolute errors was 15 values below 1.0 MPa, 13 between 1.0 and 3.0 MPa, and only 2 above 3.0 MPa. These error values further confirm the superior level of accuracy for the GEP model in calculating the CS of biochar concrete.
C S p   M P a = C T + 0.670 C T + C T 2 + B + C + C T   + C 0.103
where C S p is the predicted CS from the GEP model in MPa, C is the quantity of cement in kg/m3, B is the quantity of biochar in kg/m3, and C T is the curing time in days.
The GEP prediction model for the CS of biochar concrete may be used for computations employing the input variables from the present investigation. This model is confined to using cement, biochar, and curing age as inputs and will not operate if fewer or additional variables are employed. Additionally, attention needs to be paid to the consistency of units, as altering the units of input variables will impact the models’ results. Consequently, the constructed model is suitable for future applications, but it possesses limitations. The implementation of these predictive models will obviate the necessity for repetitive laboratory testing in biochar concrete mix design optimisation.

3.2.3. Models’ Comparison with Validation Metrics

The statistical performance indicators in Table 3 validate and compare the precision of the linear regression model and the GEP model for estimating the CS of biochar concrete. These matrices were calculated using the test set results. The GEP model demonstrates superior performance across all metrics, achieving a higher R2 value (0.932) compared to the linear regression model (0.735), indicating a better fit and ability to explain data variance. It also has a lower MAE (1.794 vs. 3.009) and RMSE (2.079 vs. 3.551), reflecting greater accuracy and reduced prediction errors. The GEP model’s lower MAPE (4.30% vs. 7.30%) highlights its robustness across varying scales, while its OBJ of 2.005 vs. 3.781 and SI of 0.051 vs. 0.085 confirm its reliability and stability. These results establish the GEP model as a more effective approach for capturing complex non-linear relationships in CS prediction compared to the linear regression model. Although the data points used for modelling were considerably fewer in number, the model outcomes and validation metrics confirmed the suitability of these techniques. This might be due to the generation of the dataset from the experimental setup where testing conditions were constant for all specimens.

3.2.4. SHAP Analysis Results

The intent of the SHAP analysis was to calculate the influence of input parameters on ML model outcome, i.e., the CS of biochar concrete. The SHAP tree explainer was implemented on experimental data to provide a comprehensive representation of the collective influence of input features and localised SHAP. The results of the SHAP analysis are depicted in Figure 14. The plot illustrates the evaluation of individual input factors across a range of shades, with the SHAP value on the X-axis representing the influence of each input. The curing time was identified as the primary factor that influenced the CS of biochar concrete, demonstrating a significant positive correlation, as red dots on the positive side are shown in the plot. This is proportional to experimental findings, as strength gain was greater at the age of 28 days than at 7 days. Regarding the impact of biochar content, SHAP values in Figure 14 indicate a more negative effect on the CS, which indicates that higher biochar quantity in the mix can cause a decrease in CS. Some positive Shapley values for biochar content are also identified, implying a favourable influence on the CS at certain levels. The SHAP results also indicate a more positive correlation between the CS and the quantity of cement in the mix. This suggests that the higher the cement quantity in the mix, the more CS is increased. The present study’s findings were determined by the input types and data points that were employed in the SHAP analysis. There is a potential for obtaining more accurate relationships by expanding the range of input parameters in the database, which can be performed in future studies.

4. Conclusions

In this study, olive pit and wood biochar are used as cement substrates with 2.5 and 5 wt.% in concrete. Compressive strength (CS), split tensile strength (STS), and flexural strength (FS) tests were carried out on 7 and 28 days. The test data were arranged to develop linear regression and gene expression programming (GEP) prediction models for the CS of biochar concrete. SHapley Additive exPlanation (SHAP) analysis was performed to study the impact of inputs on the target outcome. The following are the conclusions of this research:
  • At 7 days of testing, the CS, STS, and FS of biochar concrete were mostly lower than the control mix (CM), but at 28 days of testing, a significant strength gain was observed. This might be due to the water-absorbing nature of biochar delaying cement hydration, but by 28 days, the slow release of this absorbed water (internal curing) and the filler effect of finer biochar particles can enhance overall strength.
  • Olive pit biochar of 2.5 wt.% increased the CS by approximately 20% compared to the CM at 28 days, whereas 2.5 wt.% wood biochar increased the 28-day CS by around 4% due to relatively larger particles compared to olive pit biochar. The finer particles of olive pits result in a more compact matrix, thereby resulting in an increased CS. However, the 5 wt.% biochar (both olive pits and wood) caused a decrease in CS but was comparable to the CM.
  • The maximum STS and FS were noted at 5 wt.% olive pit biochar. There was an increase in the STS of around 8% compared to the CM, and FS was like the CM with olive pit biochar of 5 wt.% at 28 days. Wood biochar concrete mixes showed a reduced STS of around 16.6% and 6.8% and FS of around 18% and 14.4% compared to the CM at 28 days with 2.5 and 5 wt.% biochar, respectively.
  • The optimal biochar replacement percentage is highly dependent on the biochar source and particle size, and its incorporation affects CS, STS, and FS differently, indicating that not all strength characteristics examined in this study respond equally to biochar addition.
  • The linear regression model with R2 of 0.73 for the CS of biochar concrete showed moderate accuracy, while the GEP model effectively captured the non-linear behaviour of biochar concrete, achieving a higher R2 of 0.93 and lower error values. This indicates a superior predictive capability of GEP for CS, reflecting the complex interaction among cement, biochar, and curing time. This approach has been provisionally shown to be acceptable for small data sizes used in this study; however, further research on multiple datasets is required before this can be stated definitively.
  • SHAP analysis showed that curing time exerts a more positive influence on CS, aligning with experimental findings of higher strength at later ages. While biochar content generally demonstrated a negative impact, certain levels showed favourable effects. Higher cement content correlated positively with CS, emphasising the need for balanced mix proportions.
The outcomes highlight that biochar can effectively enhance later-age strength in concrete, especially when the finer-grained olive pit biochar is used at lower replacement levels. The GEP model can be used to calculate the CS of biochar concrete with higher accuracy using the input variables employed in the current study with similar units. The application of these predictive models will allow for more targeted and predictable laboratory testing in the optimisation of biochar concrete mix design. The future implementation of biochar in concrete requires scaling up production, standardisation, and long-term durability assessments to ensure consistency and reliability. Further research may focus on using higher biochar contents, economic feasibility, and carbon sequestration potential to promote its adoption in sustainable construction.

Author Contributions

Conceptualisation, W.A. and A.B.; methodology, W.A. and V.S.S.C.S.V.; software, W.A.; validation, W.A. and A.B.; formal analysis, W.A.; investigation, V.S.S.C.S.V.; resources, A.B.; data curation, V.S.S.C.S.V.; writing—original draft preparation, W.A.; writing—review and editing, A.B.; visualisation, V.S.S.C.S.V.; supervision, A.B.; project administration, A.B.; funding acquisition, A.B. All authors have read and agreed to the published version of the manuscript.

Funding

This research is internally funded by the TU Dublin Researcher Scholarship Award (RA-2022).

Institutional Review Board Statement

Not applicable.

Informed Consent Statement

Not applicable.

Data Availability Statement

The original contributions presented in this study are included in the article. Further inquiries can be directed to the corresponding author.

Acknowledgments

The authors acknowledge Technological University Dublin for supporting this study.

Conflicts of Interest

The authors declare no conflicts of interest.

References

  1. Senadheera, S.S.; Gupta, S.; Kua, H.W.; Hou, D.; Kim, S.; Tsang, D.C.W.; Ok, Y.S. Application of biochar in concrete—A review. Cem. Concr. Compos. 2023, 143, 105204. [Google Scholar] [CrossRef]
  2. Semieniuk, G.; Yakovenko, V.M. Historical evolution of global inequality in carbon emissions and footprints versus redistributive scenarios. J. Clean. Prod. 2020, 264, 121420. [Google Scholar] [CrossRef]
  3. Churkina, G.; Organschi, A.; Reyer, C.P.O.; Ruff, A.; Vinke, K.; Liu, Z.; Reck, B.K.; Graedel, T.E.; Schellnhuber, H.J. Buildings as a global carbon sink. Nat. Sustain. 2020, 3, 269–276. [Google Scholar] [CrossRef]
  4. Rose, D.; Shirzad, S. Innovations in Green Concrete: Combining Metakaolin and Arundo Grass Biochar for Enhanced Sustainability. Sustainability 2024, 16, 11219. [Google Scholar] [CrossRef]
  5. Mosaberpanah, M.A.; Olabimtan, S.B.; Balkis, A.P.; Rabiu, B.O.; Oluwole, B.O.; Ajuonuma, C.S. Effect of Biochar and Sewage Sludge Ash as Partial Replacement for Cement in Cementitious Composites: Mechanical, and Durability Properties. Sustainability 2024, 16, 1522. [Google Scholar] [CrossRef]
  6. Winters, D.; Boakye, K.; Simske, S. Toward carbon-neutral concrete through biochar–cement–calcium carbonate composites: A critical review. Sustainability 2022, 14, 4633. [Google Scholar] [CrossRef]
  7. Chen, L.; Zhang, Y.; Wang, L.; Ruan, S.; Chen, J.; Li, H.; Yang, J.; Mechtcherine, V.; Tsang, D.C.W. Biochar-augmented carbon-negative concrete. Chem. Eng. J. 2022, 431, 133946. [Google Scholar] [CrossRef]
  8. Azzi, E.S.; Karltun, E.; Sundberg, C. Prospective life cycle assessment of large-scale biochar production and use for negative emissions in Stockholm. Environ. Sci. Technol. 2019, 53, 8466–8476. [Google Scholar] [CrossRef]
  9. Sun, Y.; Xiong, X.; He, M.; Xu, Z.; Hou, D.; Zhang, W.; Ok, Y.S.; Rinklebe, J.; Wang, L.; Tsang, D.C.W. Roles of biochar-derived dissolved organic matter in soil amendment and environmental remediation: A critical review. Chem. Eng. J. 2021, 424, 130387. [Google Scholar] [CrossRef]
  10. Shaheen, S.M.; Niazi, N.K.; Hassan, N.E.E.; Bibi, I.; Wang, H.; Tsang, D.C.W.; Ok, Y.S.; Bolan, N.; Rinklebe, J. Wood-based biochar for the removal of potentially toxic elements in water and wastewater: A critical review. Int. Mater. Rev. 2019, 64, 216–247. [Google Scholar] [CrossRef]
  11. Liu, Y.; Sun, Y.; Wan, Z.; Jing, F.; Li, Z.; Chen, J.; Tsang, D.C.W. Tailored design of food waste hydrochar for efficient adsorption and catalytic degradation of refractory organic contaminant. J. Clean. Prod. 2021, 310, 127482. [Google Scholar] [CrossRef]
  12. Vincevica-Gaile, Z.; Zhylina, M.; Shishkin, A.; Ansone-Bertina, L.; Klavins, L.; Arbidans, L.; Dobkevica, L.; Zekker, I.; Klavins, M. Selected residual biomass valorization into pellets as a circular economy-supported end-of-waste. Clean. Mater. 2025, 15, 100295. [Google Scholar] [CrossRef]
  13. Katish, M.; Allen, S.; Squires, A.; Ferrandiz-Mas, V. Experimental study of phase change material (PCM) biochar composite for net-zero built environment applications. Clean. Mater. 2024, 14, 100274. [Google Scholar] [CrossRef]
  14. Chanda, R.; Jahid, T.; Karmokar, A.; Hossain, B.; Moktadir, M.; Islam, M.S.; Aich, N.; Biswas, B.K. Functionalized biochar from vegetable waste for phosphorus removal from aqueous solution and its potential use as a slow-release fertilizer. Clean. Mater. 2025, 15, 100287. [Google Scholar] [CrossRef]
  15. Liu, Y.; Dai, Q.; Jin, X.; Dong, X.; Peng, J.; Wu, M.; Liang, N.; Pan, B.; Xing, B. Negative impacts of biochars on urease activity: High pH, heavy metals, polycyclic aromatic hydrocarbons, or free radicals? Environ. Sci. Technol. 2018, 52, 12740–12747. [Google Scholar] [CrossRef]
  16. Lin, X.; Li, W.; Guo, Y.; Dong, W.; Castel, A.; Wang, K. Biochar-cement concrete toward decarbonisation and sustainability for construction: Characteristic, performance and perspective. J. Clean. Prod. 2023, 419, 138219. [Google Scholar] [CrossRef]
  17. Wu, T.; Ng, S.T.; Chen, J. Deciphering the CO2 emissions and emission intensity of cement sector in China through decomposition analysis. J. Clean. Prod. 2022, 352, 131627. [Google Scholar] [CrossRef]
  18. Galusnyak, S.C.; Petrescu, L.; Cormos, C.-C. Environmental impact assessment of post-combustion CO2 capture technologies applied to cement production plants. J. Environ. Manag. 2022, 320, 115908. [Google Scholar] [CrossRef]
  19. Chen, X.; Li, J.; Xue, Q.; Huang, X.; Liu, L.; Poon, C.S. Sludge biochar as a green additive in cement-based composites: Mechanical properties and hydration kinetics. Constr. Build. Mater. 2020, 262, 120723. [Google Scholar] [CrossRef]
  20. Akhtar, A.; Sarmah, A.K. Novel biochar-concrete composites: Manufacturing, characterization and evaluation of the mechanical properties. Sci. Total Environ. 2018, 616–617, 408–416. [Google Scholar] [CrossRef]
  21. Creamer, A.E.; Gao, B.; Zhang, M. Carbon dioxide capture using biochar produced from sugarcane bagasse and hickory wood. Chem. Eng. J. 2014, 249, 174–179. [Google Scholar] [CrossRef]
  22. Liu, R.; Xiao, H.; Guan, S.; Zhang, J.; Yao, D. Technology and method for applying biochar in building materials to evidently improve the carbon capture ability. J. Clean. Prod. 2020, 273, 123154. [Google Scholar] [CrossRef]
  23. Praneeth, S.; Guo, R.; Wang, T.; Dubey, B.K.; Sarmah, A.K. Accelerated carbonation of biochar reinforced cement-fly ash composites: Enhancing and sequestering CO2 in building materials. Constr. Build. Mater. 2020, 244, 118363. [Google Scholar] [CrossRef]
  24. Qin, Y.; Pang, X.; Tan, K.; Bao, T. Evaluation of pervious concrete performance with pulverized biochar as cement replacement. Cem. Concr. Compos. 2021, 119, 104022. [Google Scholar] [CrossRef]
  25. Sirico, A.; Belletti, B.; Bernardi, P.; Malcevschi, A.; Pagliari, F.; Fornoni, P.; Moretti, E. Effects of biochar addition on long-term behavior of concrete. Theor. Appl. Fract. Mech. 2022, 122, 103626. [Google Scholar] [CrossRef]
  26. Restuccia, L.; Ferro, G.A. Influence of filler size on the mechanical properties of cement-based composites. Fatigue Fract. Eng. Mater. Struct. 2018, 41, 797–805. [Google Scholar] [CrossRef]
  27. Cao, M.; Mao, Y.; Khan, M.; Si, W.; Shen, S. Different testing methods for assessing the synthetic fiber distribution in cement-based composites. Constr. Build. Mater. 2018, 184, 128–142. [Google Scholar] [CrossRef]
  28. Ben Chaabene, W.; Flah, M.; Nehdi, M.L. Machine learning prediction of mechanical properties of concrete: Critical review. Constr. Build. Mater. 2020, 260, 119889. [Google Scholar] [CrossRef]
  29. Nematzadeh, M.; Shahmansouri, A.A.; Fakoor, M. Post-fire compressive strength of recycled PET aggregate concrete reinforced with steel fibers: Optimization and prediction via RSM and GEP. Constr. Build. Mater. 2020, 252, 119057. [Google Scholar] [CrossRef]
  30. Gandomi, A.H.; Babanajad, S.K.; Alavi, A.H.; Farnam, Y. Novel approach to strength modeling of concrete under triaxial compression. J. Mater. Civ. Eng. 2012, 24, 1132–1143. [Google Scholar] [CrossRef]
  31. Gandomi, A.H.; Yun, G.J.; Alavi, A.H. An evolutionary approach for modeling of shear strength of RC deep beams. Mater. Struct. 2013, 46, 2109–2119. [Google Scholar] [CrossRef]
  32. Tian, Q.; Lu, Y.; Zhou, J.; Song, S.; Yang, L.; Cheng, T.; Huang, J. Supplementary cementitious materials-based concrete porosity estimation using modeling approaches: A comparative study of GEP and MEP. Rev. Adv. Mater. Sci. 2024, 63, 20230189. [Google Scholar] [CrossRef]
  33. Tian, Q.; Lu, Y.; Zhou, J.; Song, S.; Yang, L.; Cheng, T.; Huang, J. Compressive strength of waste-derived cementitious composites using machine learning. Rev. Adv. Mater. Sci. 2024, 63, 20240008. [Google Scholar] [CrossRef]
  34. Tian, Q.; Lu, Y.; Zhou, J.; Song, S.; Yang, L.; Cheng, T.; Huang, J. Exploring the viability of AI-aided genetic algorithms in estimating the crack repair rate of self-healing concrete. Rev. Adv. Mater. Sci. 2024, 63, 20230179. [Google Scholar] [CrossRef]
  35. Jalal, F.E.; Xu, Y.; Iqbal, M.; Javed, M.F.; Jamhiri, B. Predictive modeling of swell-strength of expansive soils using artificial intelligence approaches: ANN, ANFIS and GEP. J. Environ. Manag. 2021, 289, 112420. [Google Scholar] [CrossRef]
  36. Kashem, A.; Karim, R.; Malo, S.C.; Das, P.; Datta, S.D.; Alharthai, M. Hybrid data-driven approaches to predicting the compressive strength of ultra-high-performance concrete using SHAP and PDP analyses. Case Stud. Constr. Mater. 2024, 20, e02991. [Google Scholar] [CrossRef]
  37. Karim, R.; Islam, M.H.; Datta, S.D.; Kashem, A. Synergistic effects of supplementary cementitious materials and compressive strength prediction of concrete using machine learning algorithms with SHAP and PDP analyses. Case Stud. Constr. Mater. 2024, 20, e02828. [Google Scholar] [CrossRef]
  38. Kashem, A.; Karim, R.; Das, P.; Datta, S.D.; Alharthai, M. Compressive strength prediction of sustainable concrete incorporating rice husk ash (RHA) using hybrid machine learning algorithms and parametric analyses. Case Stud. Constr. Mater. 2024, 20, e03030. [Google Scholar] [CrossRef]
  39. Habibur Rahman Sobuz, M.; Khan, M.H.; Kawsarul Islam Kabbo, M.; Alhamami, A.H.; Aditto, F.S.; Saziduzzaman Sajib, M.; Johnson Alengaram, U.; Mansour, W.; Hasan, N.M.S.; Datta, S.D.; et al. Assessment of mechanical properties with machine learning modeling and durability, and microstructural characteristics of a biochar-cement mortar composite. Constr. Build. Mater. 2024, 411, 134281. [Google Scholar] [CrossRef]
  40. Chen, Y.; Zou, Z.; Jin, X.; Wang, J.; Tan, K. Biochar-enhanced concrete mixes: Pioneering multi-objective optimization. J. Build. Eng. 2024, 88, 109263. [Google Scholar] [CrossRef]
  41. Boudermine, H.; Boumaaza, M.; Belaadi, A.; Bourchak, M.; Bencheikh, M. Performance analysis of biochar and W. Robusta palm waste reinforced green mortar using response surface methodology and machine learning methods. Constr. Build. Mater. 2024, 438, 137214. [Google Scholar] [CrossRef]
  42. Singh, N.; Kumar, P.; Goyal, P. Reviewing the behaviour of high volume fly ash based self compacting concrete. J. Build. Eng. 2019, 26, 100882. [Google Scholar] [CrossRef]
  43. IS. EN 12390-3:2019; Testing Hardened Concrete—Part 3: Compressive Strength of Test Specimens. National Standards Authority of Ireland: Dublin, Ireland, 2019.
  44. IS. EN 12390-4:2019; Testing Hardened Concrete—Part 4: Compressive Strength—Specification for Testing Machines. National Standards Authority of Ireland: Dublin, Ireland, 2019.
  45. IS. EN 12390-6:2023; Testing Hardened Concrete—Part 6: Tensile Splitting Strength of Test Specimens. National Standards Authority of Ireland: Dublin, Ireland, 2023.
  46. IS. EN 12390-5:2019; Testing Hardened Concrete—Part 5: Flexural Strength of Test Specimens. National Standards Authority of Ireland: Dublin, Ireland, 2019.
  47. Sufian, M.; Ullah, S.; Ostrowski, K.A.; Ahmad, A.; Zia, A.; Śliwa-Wieczorek, K.; Siddiq, M.; Awan, A.A. An Experimental and Empirical Study on the Use of Waste Marble Powder in Construction Material. Materials 2021, 14, 3829. [Google Scholar] [CrossRef] [PubMed]
  48. Alsharari, F.; Khan, K.; Amin, M.N.; Ahmad, W.; Khan, U.; Mutnbak, M.; Houda, M.; Yosri, A.M. Sustainable use of waste eggshells in cementitious materials: An experimental and modeling-based study. Case Stud. Constr. Mater. 2022, 17, e01620. [Google Scholar] [CrossRef]
  49. Lyngdoh, G.A.; Zaki, M.; Krishnan, N.M.A.; Das, S. Prediction of concrete strengths enabled by missing data imputation and interpretable machine learning. Cem. Concr. Compos. 2022, 128, 104414. [Google Scholar] [CrossRef]
  50. Taffese, W.Z.; Espinosa-Leal, L. Prediction of chloride resistance level of concrete using machine learning for durability and service life assessment of building structures. J. Build. Eng. 2022, 60, 105146. [Google Scholar] [CrossRef]
  51. Ahmad, A.; Ahmad, W.; Aslam, F.; Joyklad, P. Compressive strength prediction of fly ash-based geopolymer concrete via advanced machine learning techniques. Case Stud. Constr. Mater. 2022, 16, e00840. [Google Scholar] [CrossRef]
  52. Cao, Q.; Yuan, X.; Nasir Amin, M.; Ahmad, W.; Althoey, F.; Alsharari, F. A soft-computing-based modeling approach for predicting acid resistance of waste-derived cementitious composites. Constr. Build. Mater. 2023, 407, 133540. [Google Scholar] [CrossRef]
  53. Farooq, F.; Ahmed, W.; Akbar, A.; Aslam, F.; Alyousef, R. Predictive modeling for sustainable high-performance concrete from industrial wastes: A comparison and optimization of models using ensemble learners. J. Clean. Prod. 2021, 292, 126032. [Google Scholar] [CrossRef]
  54. Aslam, F.; Farooq, F.; Amin, M.N.; Khan, K.; Waheed, A.; Akbar, A.; Javed, M.F.; Alyousef, R.; Alabdulijabbar, H. Applications of gene expression programming for estimating compressive strength of high-strength concrete. Adv. Civ. Eng. 2020, 2020, 8850535. [Google Scholar] [CrossRef]
  55. Mohammed, A.K.; Hassan, A.M.T.; Mohammed, A.S. Predicting the compressive strength of green concrete at various temperature ranges using different soft computing techniques. Sustainability 2023, 15, 11907. [Google Scholar] [CrossRef]
  56. Li, Y.; Wang, G.; Amin, M.N.; Khan, A.; Qadir, M.T.; Arifeen, S.U. Towards improved flexural behavior of plastic-based mortars: An experimental and modeling study on waste material incorporation. Mater. Today Commun. 2024, 40, 109391. [Google Scholar] [CrossRef]
  57. Lundberg, S.M.; Lee, S.-I. A unified approach to interpreting model predictions. arXiv 2017, arXiv:1705.07874. [Google Scholar] [CrossRef]
  58. Abdulalim Alabdullah, A.; Iqbal, M.; Zahid, M.; Khan, K.; Nasir Amin, M.; Jalal, F.E. Prediction of rapid chloride penetration resistance of metakaolin based high strength concrete using light GBM and XGBoost models by incorporating SHAP analysis. Constr. Build. Mater. 2022, 345, 128296. [Google Scholar] [CrossRef]
  59. Sirico, A.; Bernardi, P.; Sciancalepore, C.; Vecchi, F.; Malcevschi, A.; Belletti, B.; Milanese, D. Biochar from wood waste as additive for structural concrete. Constr. Build. Mater. 2021, 303, 124500. [Google Scholar] [CrossRef]
  60. Aneja, A.; Sharma, R.L.; Singh, H. Mechanical and durability properties of biochar concrete. Mater. Today Proc. 2022, 65, 3724–3730. [Google Scholar] [CrossRef]
  61. Jia, Y.; Li, H.; He, X.; Li, P.; Wang, Z. Effect of biochar from municipal solid waste on mechanical and freeze–thaw properties of concrete. Constr. Build. Mater. 2023, 368, 130374. [Google Scholar] [CrossRef]
  62. Murali, G.; Wong, L.S. A comprehensive review of biochar-modified concrete: Mechanical performance and microstructural insights. Constr. Build. Mater. 2024, 425, 135986. [Google Scholar] [CrossRef]
Figure 1. Flowchart of research method followed in the present study.
Sustainability 17 02516 g001
Figure 2. Compressive strength of biochar concrete at 7 and 28 days.
Sustainability 17 02516 g002
Figure 3. Percentage variation in the compressive strength of biochar concrete at 7 and 28 days.
Sustainability 17 02516 g003
Figure 4. Split tensile strength of biochar concrete at 7 and 28 days.
Sustainability 17 02516 g004
Figure 5. Percentage variation in the split tensile strength of biochar concrete at 7 and 28 days.
Sustainability 17 02516 g005
Figure 6. Flexural strength of biochar concrete at 7 and 28 days.
Sustainability 17 02516 g006
Figure 7. Percentage variation in the flexural strength of biochar concrete at 7 and 28 days.
Sustainability 17 02516 g007
Figure 8. Three-dimensional scatter plot for strength properties with flexural strength as a dependent variable.
Sustainability 17 02516 g008
Figure 9. Three-dimensional scatter plot for strength properties with split tensile strength as a dependent variable.
Sustainability 17 02516 g009
Figure 10. Relationship between experimental and predicted CS for the linear regression model.
Sustainability 17 02516 g010
Figure 11. Distribution of experimental and predicted CS and absolute error for the linear regression model.
Sustainability 17 02516 g011
Figure 12. Relationship between experimental and predicted CS for the GEP model.
Sustainability 17 02516 g012
Figure 13. Distribution of experimental and predicted CS and absolute error for the GEP model.
Sustainability 17 02516 g013
Figure 14. SHAP values indicating the impact of inputs on the model outcomes.
Sustainability 17 02516 g014
Table 1. Mix proportions used for the experimental programme.
Mix IDBiochar TypeBiochar Content (wt.% of Cement)Cement (kg/m3)Biochar (kg/m3)Water (kg/m3)Fine Aggregate (kg/m3)Coarse Aggregate (kg/m3)
CM-047902256031073
OB-2.5Olive pits2.546712.02256031073
OB-5.0Olive pits5.045524.02256031073
WB-2.5Wood2.546712.02256031073
WB-5.0Wood5.045524.02256031073
Table 2. Hyperparameters selected for GEP modelling.
HyperparameterValue
population_size1000
generations8
stopping_criteria0.00001
function_set‘add’, ‘sub’, ‘mul’, ‘div’, ‘sqrt’
parsimony_coefficient0.001
max_samples0.9
metricMSE
verbose1
random_state42
n_jobs−1
K-fold splits5
Table 3. Statistical parameters for the developed models for the CS of biochar concrete.
ParameterLinear Regression ModelGEP Model
R20.7350.932
MAE3.0091.794
MAPE7.304.30
RMSE3.5512.079
OBJ3.7812.005
SI0.0850.051
Disclaimer/Publisher’s Note: The statements, opinions and data contained in all publications are solely those of the individual author(s) and contributor(s) and not of MDPI and/or the editor(s). MDPI and/or the editor(s) disclaim responsibility for any injury to people or property resulting from any ideas, methods, instructions or products referred to in the content.

