Article

Leveraging the GEV Model to Estimate Flood Due to Extreme Rainfall in Ungauged Dry Catchments of the Gobi Region

by
Myagmarsuren Bat-Erdene
1,
Munkhtsetseg Zorigt
1,2,*,
Oyunbaatar Dambaravjaa
3,
Dorjsuren Dechinlkhundev
4,
Erdenesukh Sumiya
1,2 and
Michael Nones
5,*
1
Department of Geography, School of Art and Sciences, National University of Mongolia, Ulaanbaatar 14200, Mongolia
2
Department of Meteorology and Hydrology, School of Art and Sciences, National University of Mongolia, Ulaanbaatar 14200, Mongolia
3
Hydrological Research Division, The Information and Research Institute of Meteorology, Hydrology, and Environment, Ulaanbaatar 15160, Mongolia
4
Fresh Water Institute, Ulaanbaatar 14200, Mongolia
5
Department of Hydrology and Hydrodynamics, Institute of Geophysics, Polish Academy of Sciences, 01-452 Warszawa, Poland
*
Authors to whom correspondence should be addressed.
Sustainability 2025, 17(6), 2500; https://doi.org/10.3390/su17062500
Submission received: 14 February 2025 / Revised: 10 March 2025 / Accepted: 11 March 2025 / Published: 12 March 2025
(This article belongs to the Section Air, Climate Change and Sustainability)

Abstract

:
Extreme high flows can have negative economic, social, and ecological effects and are expected to become more severe in many regions due to climate change. Knowledge of maximum flow regimes and estimation of extreme rainfall is important, especially in ungauged dry regions, for planning and infrastructure development. In this study, we propose a regional method for estimating extreme flow regimes and modeled extreme rainfall using the extreme value theory, with examples from the Gobi region of Mongolia. The first step is to apply the Generalized Extreme Value (GEV) theory for the maximum rainfall data using 44-year observational data covering the period 1978–2022. Then, estimated rainfall with a 100-year return period is used for the empirical equation of the maximum flood calculation. As a result, most stations’ maximum rainfall follows a Fréchet distribution and 100-year return period rainfall values that range between 27.8–130.6 mm. The local reference value in the 100-year return period rainfall is defined as 90 mm for the whole Gobi region. Our results show that extremely high rainfall in the Gobi region has changed from −7% to 16%, leading to higher flood events. These findings further provide evidence for the maximum rainfall for flood calculation, climate change impact assessment, water resource planning, and management studies.

1. Introduction

Having information on the maximum flow of rivers is crucial for human security, as well as hydro techniques and water infrastructure planning, especially in scarcely gauged and ungauged basins [1]. The geographical location of Mongolia combined with the continental harsh climate favors the formation of water resources that are unequally distributed throughout the country. Perennial rivers exist in the northern part of the country, but the southern part is drier [2]. Weather conditions and surface flow are mostly dependent on rainfall, intensity, and the structure of soil and soil infiltration rate because, during heavy rains, there is a small flow of dry pebbles occurring in the study area, the Gobi region. This region is included in the Central Asian Internal drainage basin without outflow, and 1000–1500 mm of water evaporates from open water. Following the climate zone Köppen–Geiger classification [3], the southern part of Mongolia lies in the dry Bwk (cold desert climate) class, even though the local climate is dry and less precipitation occurs compared to the other regions of the country, with heavy rains and rainwater that contribute in reaching flood levels. Such floods are a major cause of damage and loss for the local community [4].
In the Gobi region, floods occur during the heavy rainfall in the summertime. In that region, rainfall flash floods and mixed mud floods occur as a result of high-intensity rainfall during July and August, but the water that feeds small rivers infiltrates into the soil or evaporates within 2–3 days. The floods have not been measured because of the limited local observational network. It is crucial to estimate floods for infrastructure planning and development projects, as well as to ensure community safety. Empirical methods are applied to estimate rainfall floods for the dry catchments in the region. Regardless of the empirical method applied, a key driver is the amount of maximum rainfall that is considered for flood calculation.
In recent years, heavy rainfall patterns and extreme precipitation magnitude have changed under a changing climate [5,6,7,8,9]. Moreover, several studies noted that hydroclimatic conditions and atmospheric circulation patterns over Eurasia have significantly changed since the mid-1990s [10,11,12,13]. Light rains and the number of rainy days have decreased while rain intensity has increased [14,15,16]. Recent studies also concluded that the maximum precipitation has occurred in a shorter duration, and very heavy precipitation events have increased [17,18]. Similar studies were pointed out from research conducted in Mongolia, which highlighted that annual precipitation has not changed much over time, but the duration of high-intensity rains increased significantly in the eastern and southeastern parts of the country [19]. The variability in rainfall patterns and increased air temperature tend to have more extreme events and floods in drylands [20]. These changes in the rainfall patterns are projected to continue in the future [21,22,23].
Extreme rainfall data and extreme value modeling are among the most critical processes in flood calculation. Plenty of analyses and studies on extreme precipitation changes have been conducted in different regions by employing different methods. Most precipitation data tend to have extreme values with a heavy-tailed distribution [24]. Modeling high rainfall using the fitted distribution of the actual data increases the possibilities of using input for the flood model development. The characteristics of extreme precipitation have been analyzed using statistical approaches such as probability distributions like the Generalized Extreme Value (GEV) distribution model [25,26,27,28,29,30] and frequency analysis [31]. Different regions in the world have adopted the GEV model for maximum rainfall distributions. GEV was recommended as a suitable model for describing the distribution of annual maximum precipitations in the Ontario region, Malaysia, China, and European countries [32,33,34,35,36]. Especially for the arid region, GEV reasonably predicts higher extreme rainfall intensity [31] and represents a reasonable distribution to reproduce when data is extremely imbalanced with a limited sample size [37]. However, past studies concluded that sampling data and geographical locations have different behavior in estimating extreme rainfall through the GEV model [34]. Thus, to recognize the local characteristics of extreme rainfall and to further calculate flood conditions, the GEV model was selected for this study.
The model has three parameters, which are found through different methods such as maximum likelihood estimator, L-moments and probability-weighted moments, and penalized maximum likelihood estimator [38]. The location parameter is defined as a distribution that follows Gumbel, Fréchet, and Weibull. Investigations should take into account that changes in high rainfall are critical for the analysis of the maximum flood calculation, especially in the case of ungauged dry regions where data availability is limited, such as in the case of the Gobi region. Here, there is no information on flood occurrence in dry beds and channels, and studies on how runoff responds to rainfall patterns are unknown [39]. To overcome actual limitations and provide additional insights into the regional flood dynamics, the empirical method “Rainfall intensity method” for flood calculation was adopted using local parameters focusing on small rivers with catchment areas of less than 200 km2, and considering a return period of 100 years. The empirical equation depends on various parameters, in particular the 100-year return period rainfall. Therefore, to improve the flood calculation, three goals were achieved in this study. The first is to identify the trends in high rainfall from the observed data and the second is to apply extreme precipitation occurrence using the GEV model in the ungauged dry catchments of the Gobi region. The last goal is to estimate maximum floods in these dry river catchments using the modelled 100-year return period rainfall. The outcomes of the study would be crucial for flood prevention and management in the region.

2. Materials and Methods

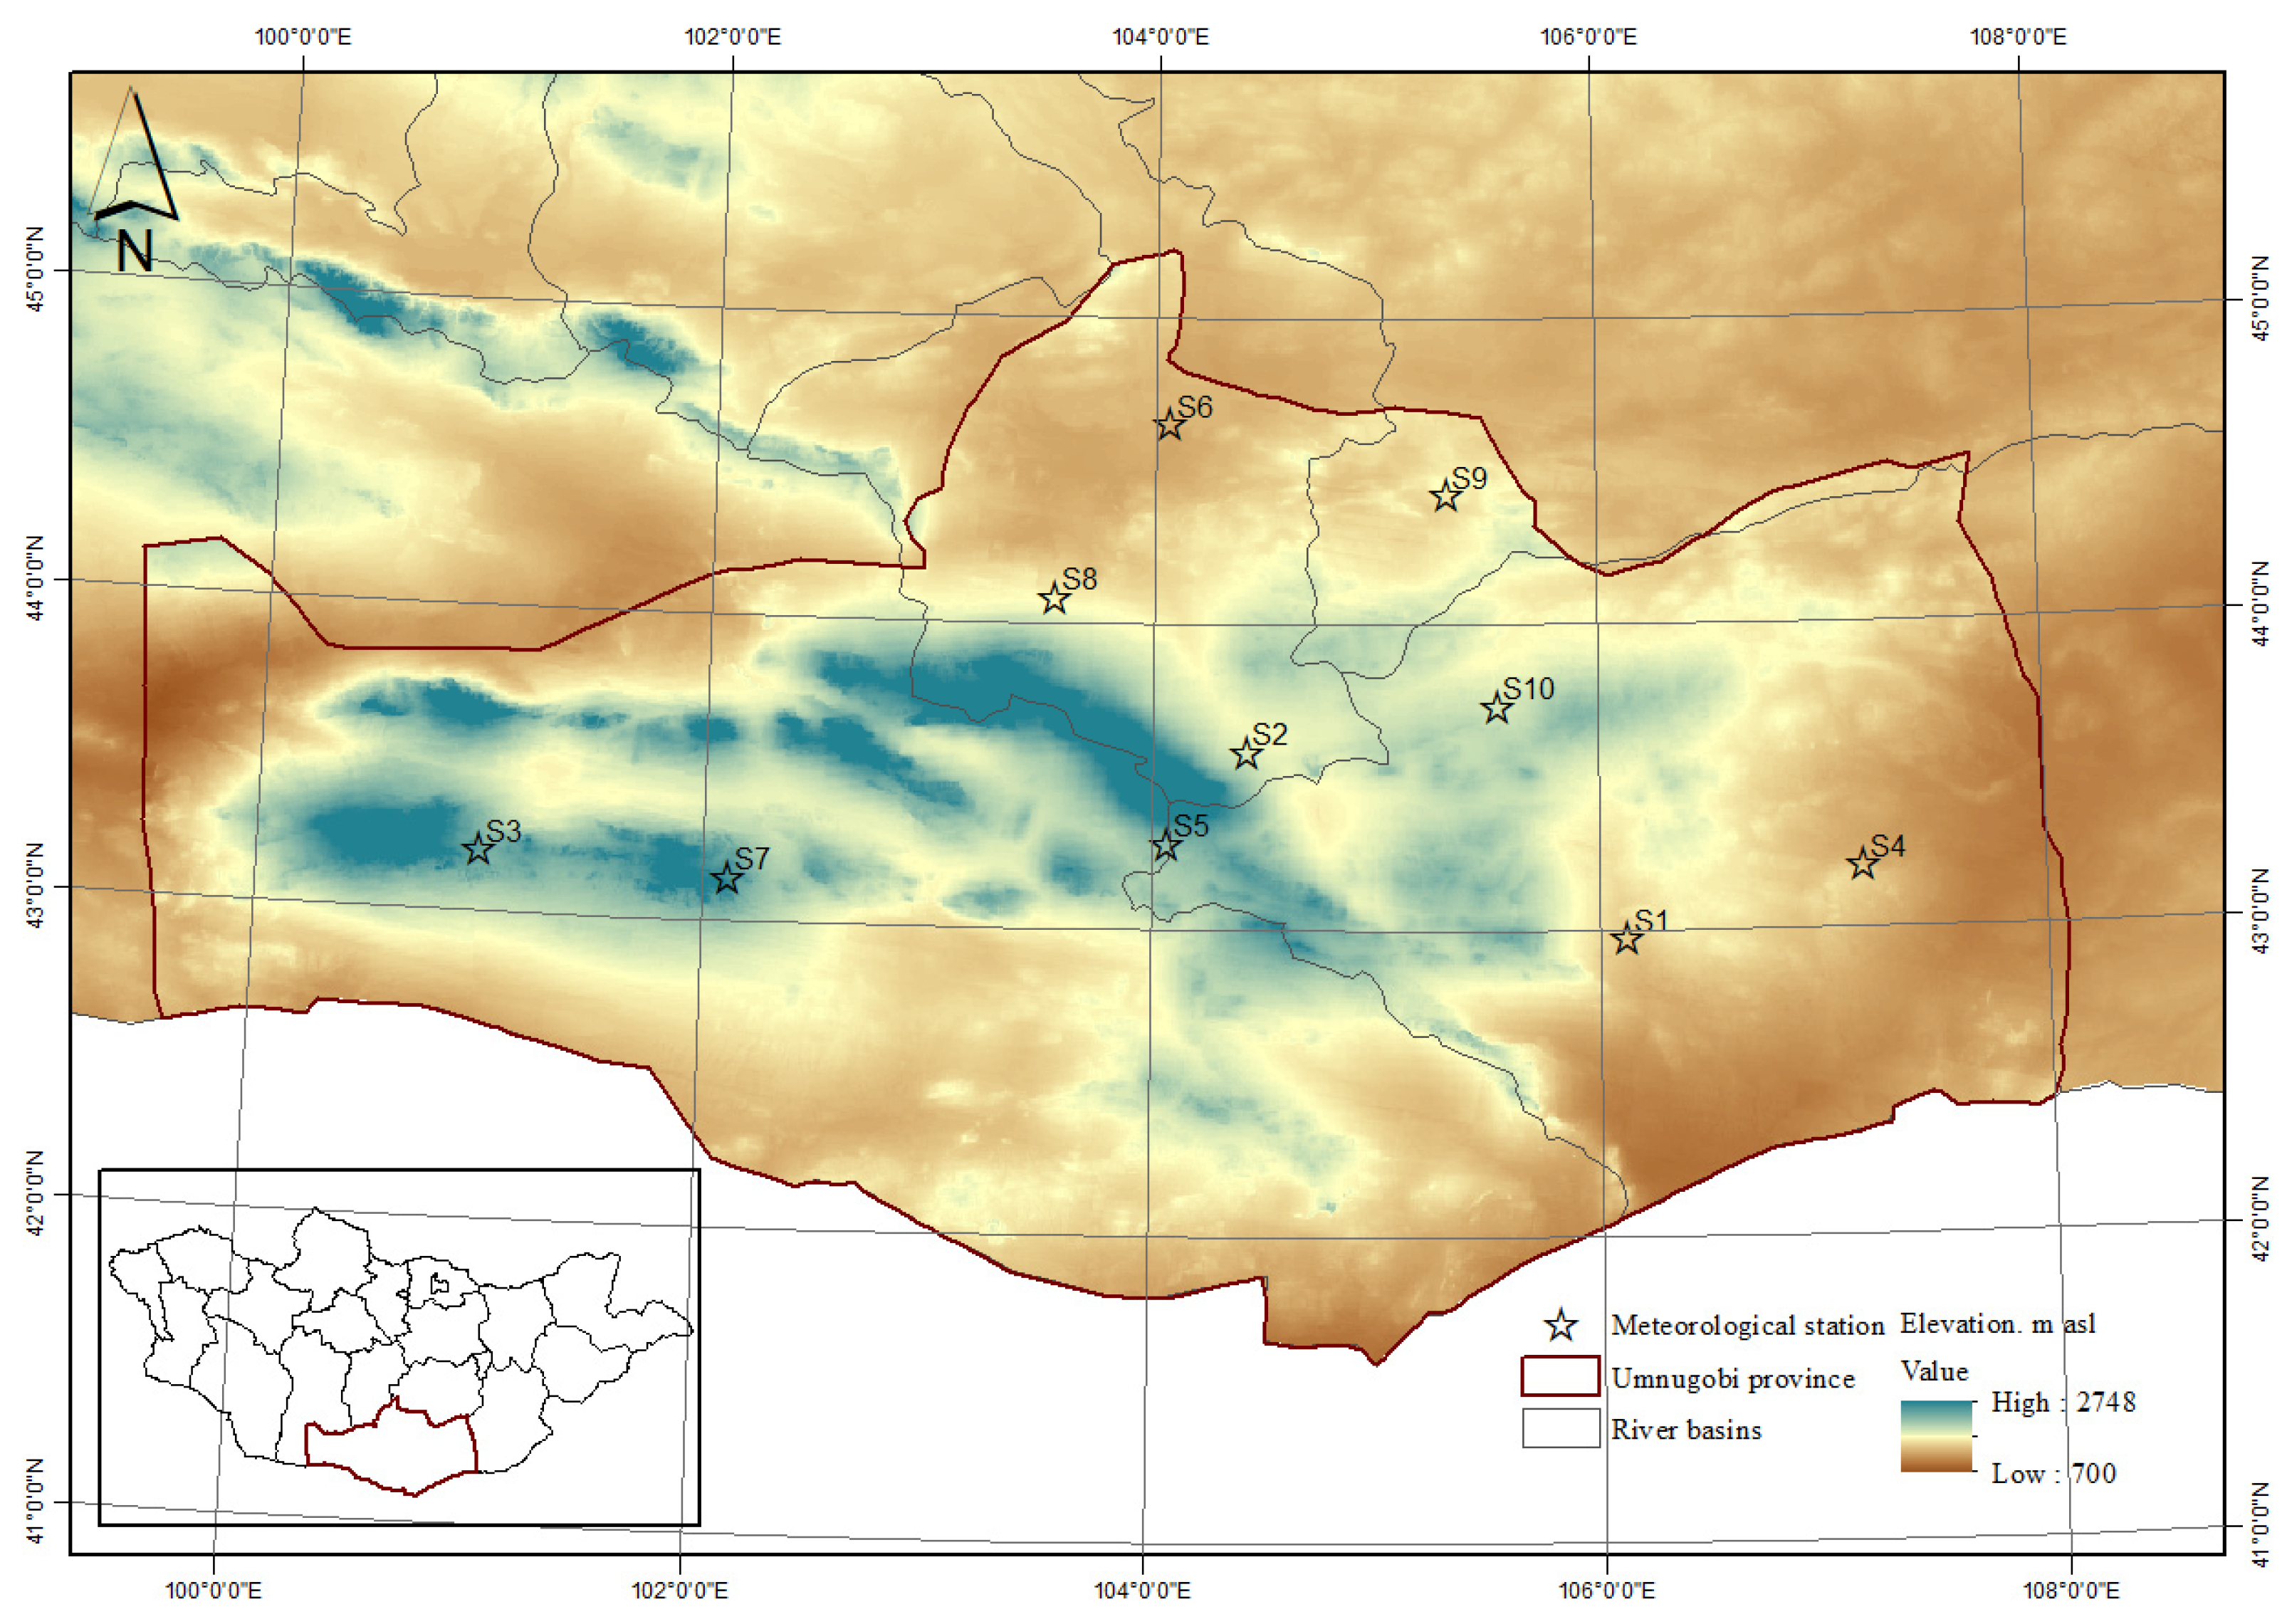
2.1. Study Area and Dataset

The study area is located in the Umnugobi province of southern Mongolia, Gobi region (see Figure 1). Due to the recent intensive development of the mining industry in this region, the human population and number of livestock are rapidly growing. Flood occurrences in the Gobi region are serious in the short term, and their research is crucial for infrastructure development and engineering design. The study area belongs to the desert and desert steppe region. The mean annual precipitation is 63–102 mm [40]. The most distinctive rainfall condition characteristic of the region is that over 90% of total precipitation falls during the summer season, and only about 7% comes down during the winter season. The time range of flood is, on average, 15 to 20 days, depending on rainfall intensity. The Gobi region of Mongolia has experienced notable changes in precipitation patterns and an increase in flood events influenced by climate change and human activities. The alteration in precipitation patterns has resulted in more frequent and intense flood events in the Gobi region. The increase in heavy rainfall leads to flash floods, which are exacerbated by the region’s arid conditions and sparse vegetation, reducing the land’s ability to absorb water. These floods pose significant challenges to local communities, particularly nomadic herders, by damaging infrastructure, degrading pastures, and threatening livestock [41]. These climatic shifts underscore the need for adaptive strategies to mitigate the adverse effects on the environment and livelihoods in the Gobi region. Since the 1940s, Mongolia’s average temperature has risen by approximately 2.25 °C, about three times the global average [23,42]. This warming has led to changed precipitation and altered rainfall patterns, with a shift from light, ground-absorbing rains to heavier downpours that cause rapid runoff and soil erosion. These changes have contributed to the expansion of desertification in the Gobi region [41].
The daily precipitation data from 10 meteorological stations/gauges and morphometric measurement data from 27 dry beds are included in the study. Precipitation data gathered from the National Agency of Meteorology and Environmental Monitoring refer to the period of 1978–2022 for four stations and 1985–2022 for six stations, respectively (Table 1).
A combination of field measurements and GIS-based spatial analysis was employed. Within the study area, 27 small ephemeral streams selected to systematically analyze using topographic maps (1:100,000 scale) for initial watershed delineation. GIS was employed to extract key catchment characteristics, including drainage area, stream length, and slope (longitudinal gradient). Field measurements were then conducted to validate these parameters and provide additional cross-sectional data. According to Table 2, the catchment area ranges from 1.0 to 95.2 km2, while their lengths vary between 1.11 and 7.9 km. The bed slope ranges from 1.8 to 15.1‰. The Manning (roughness) coefficient is 0.067 s/m1/3, while the Chezy’s coefficient varies between 6.93–12.2 for the selected 27 dry beds. The flow velocity ranges from 0.03 to 0.53 m/s, as determined during field measurements performed in 2013, while the depth of the riverbeds varies in the range 0.01–0.29 m.

2.2. Methods

Precipitation changes from 1978 to 2022 were analyzed using the Mann–Kendall test. Then, the GEV model was applied to define a 100-year return period rainfall, which is one of the important parameters for calculating maximum runoff.

2.2.1. Trend Analysis

The non-parametric Mann–Kendall (MK) trend analysis [43,44,45] was applied to the maximum rainfall for the ten stations of the study area. The purpose of the test is to assess statistically whether there is a monotonic upward or downward trend of the variable at a certain time series. The MK test works as the slope of the estimated linear regression line is non-zero. The MK test is a non-parametric test which does not require the residuals from the fitted regression line, and uses the following statistics for the time series x 1 , x n :
S = i = 1 n 1 j = i + 1 n s g n ( x j x i )
Equation (1) illustrates the number of the data n for x j and x i which are values in years j and i . Then, Z statistics are computed using the following formula:
Z m k = S 1 V a r S , i f   S > 0 0 , i f   S = 0 S + 1 V a r S , if   S < 0
Positive and negative Z m k explain the increasing and decreasing trend, respectively. The magnitude of the trend was analyzed through Sen’s slope estimator.

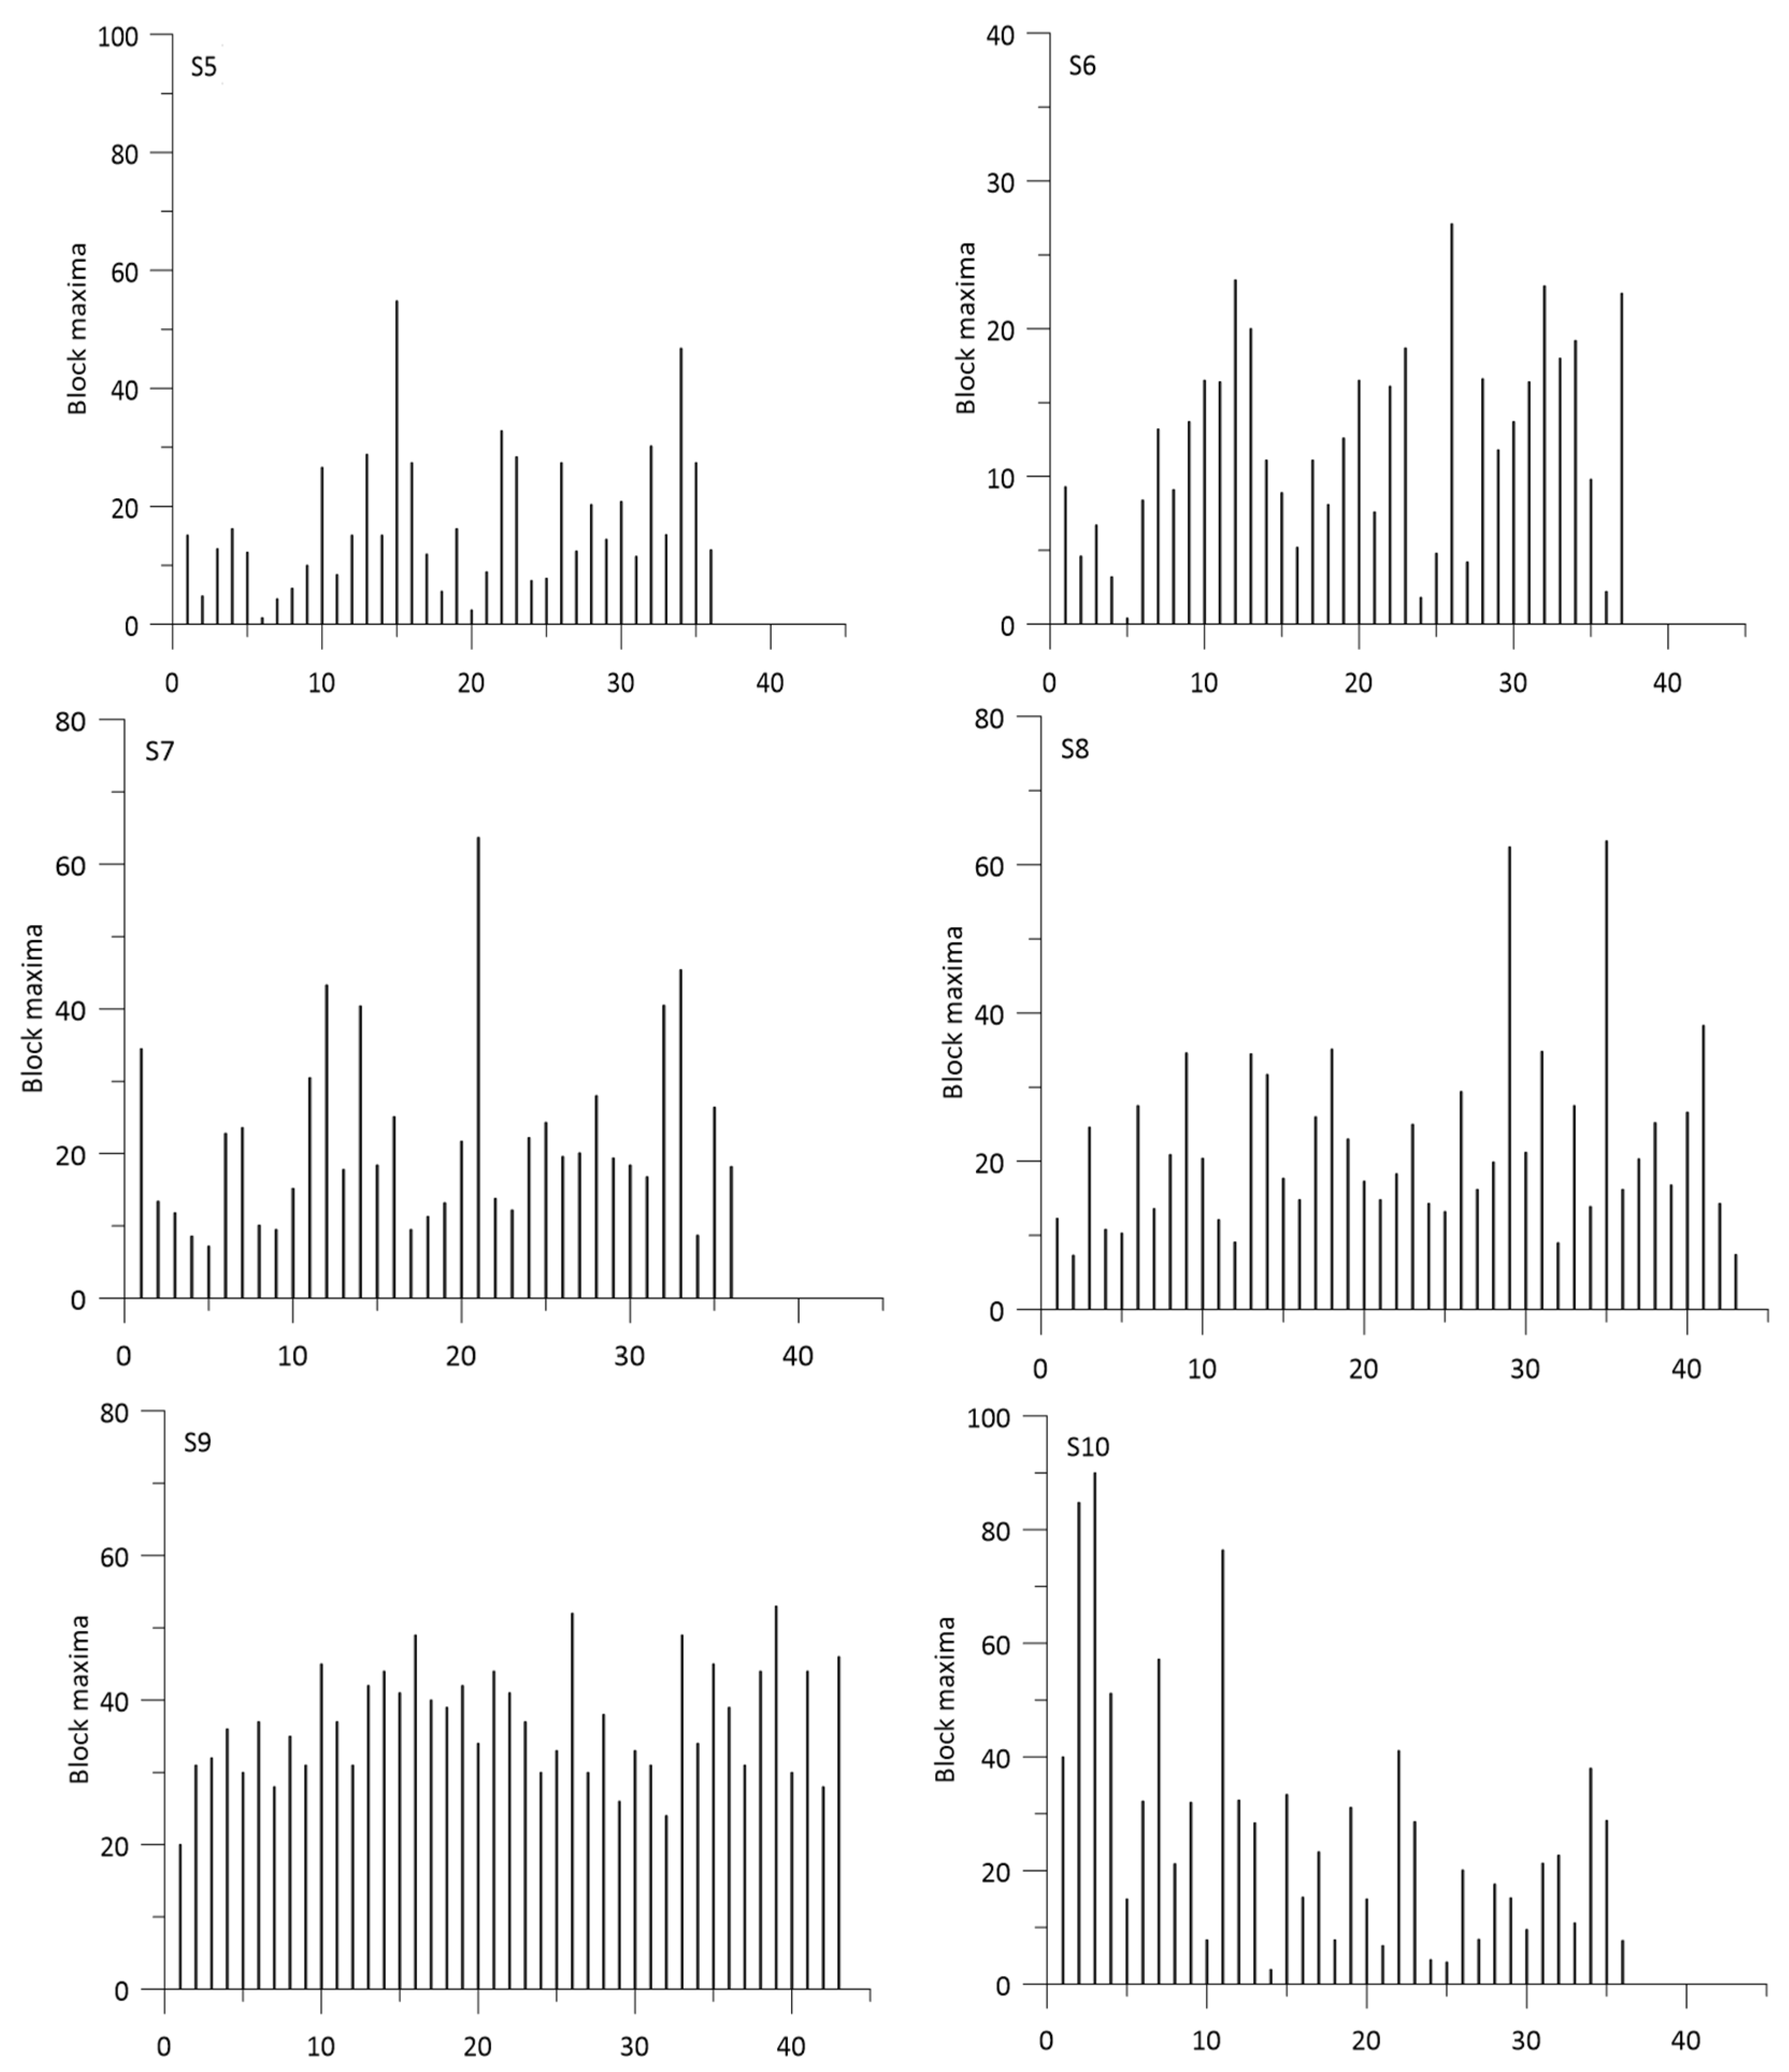
2.2.2. GEV Model for Extreme Precipitation

GEV distribution has been widely used [46,47] in many fields, such as economy, finance, engineering, climate, and natural sciences, to estimate the distribution of extreme values. The distinguishing feature of extreme value analysis is the objective to quantify the stochastic behavior of a process at unusually large—or small—levels. In particular, extreme value analyses usually require estimating the probability of events that are more extreme than any that have already been observed [48]. GEV has two principles for maximum value from the time series: block maxima and threshold criteria value. The distribution consists of three parameters such as shape (ξ), scale (σ), and location (µ).
H ξ , μ , σ = exp 1 + ξ x μ σ 1 / ξ ,   ξ 0 exp e x μ σ ,                     ξ = 0  
ξ = 0 Gumbel, ξ > 0 Fréchet, and ξ < 0 Weibull, where, three parameters of the GEV model (namely, location ( μ ), scale (δ) and shape ( ξ ) parameters) are considered to compute the independent variable x.
To estimate parameters, the maximum likelihood estimator (MLE) is applied as described in the following equation.
μ , σ ,   ξ = m l o g σ 1 + 1 ξ i = 1 m log 1 + ξ z i μ σ i = 1 m 1 + ξ z i μ σ 1 ξ 1 + ξ z i μ σ > 0 ,   f o r   i = 1 , , m
where z i represents the independent variable.
The return level at 100 years of rainfall was identified for each station. After rainfall estimation, the maximum flood discharges for the dry channels were analyzed by means of an empirical model, namely the “Rainfall intensity method”. For this method, 1% precipitation is one of the important parameters [49,50] in the method. Since more than half of the annual precipitation occurs during the summer season [51], floods are primarily caused by rainfall during this time of year.

2.2.3. Rainfall Intensity Method for Flood Calculation

The method is adopted in catchments over Mongolia and is widely used, especially for the ungauged and unstudied catchments. Local parameters were applied to reference values. One of the inputs is maximum rainfall at a 100-year return level. Former studies [52] use the regional maximum rainfall value or log-normal/gamma distribution.
Q 1 % = q 1 % J H 1 % s I 1 % F
where Q 1 % (m3/s) represents the flood flow with 1% probability. The coefficient of specific runoff with a 1% probability q 1 % (l/s km2) is applied. Multipliers including flow multiplier J and lake, forest, and swamp multipliers s are used. Also, I 1 % stands as a multiplier to change from 1% probability to other rates of probability. H 1 % defines maximum rainfall with 1% probability (mm) and F (km2) represents the catchment area.

3. Results

A temperature rise indeed accelerates the hydrological cycle, hence increasing the intensity and frequency of extreme rainfall events [53]. A projected increased summer rainfall intensity, as well as an increased frequency of heavy rainfall events, is likely to intensify the risk of river and flash floods in the region. The number of very heavy precipitation days is a climate index that indicates the annual number of days with a daily rainfall of over 20 mm. A seasonal increase in monthly precipitation occurs mainly in July–August [40].
The current analysis was done using rainfall data from 10 meteorological stations distributed across the study area and covering 38–44 complete years. Firstly, a time series of extreme values was made from observational datasets using block maxima. The daily maximum of the year at each station is summarized in Figure 2.
Daily maximum rainfall of the stations ranges between 0.4 mm to 90 mm for the period 1978–2022, as reported in Figure 3.
The Mann–Kendall test analyzed the trends for the maximum rainfall data, and the results are shown in Table 3. As visible, there are statistically insignificant increasing and decreasing trends in the data, with only two stations (S5 and S10) that have significant increasing and decreasing trends, respectively.
The estimated quantile and GEV parameters (location, shape, and scale) are shown in Table 4. The shape parameter ranges from −0.2 to 0.2 and the location parameter from 9.4 to 33.7, while the scale parameter ranges from 5.1 to 12.7.
Stations coded S1 (Gurvantes), S5 (Khurmen), S7 (Noyon), S8 (Saikhan), and S10 (Tsogttsetsii) are described as Fréchet distribution, while others follow the Weibull distribution. The goodness of fit of GEV was evaluated using the QQ plot, which is a useful tool to validate the similarity of the empirical distribution and critical distribution [26]. The results show that GEV has fitted the maximum rainfall for the stations well. Figure 4 shows the QQ plot (95% tolerance interval) for the fit of the GEV of annual maximum rainfall.
The 100-year return period value ranges from 27.8 mm to 130.6 mm (Table 5). With the aim of improving the calculation of the flood, the 1% rainfall using the GEV model is reanalyzed for those stations. In fact, it is more reasonable to use extreme rainfall from the GEV than reference values of the observed maximum rainfall in the stations.
We applied the 1% rainfall from GEV model to calculate the maximum flow in the selected 27 catchments (Figure 5). The morphometric parameters of the various catchments range between 0.4–95.2 km2, length 1.11–17.9 km, and slope 1.26–31.5‰, respectively. The results of the estimated maximum runoff range between 0.94–15.7 m3/s for the rainfall intensity method, using the former 100-year return period rainfall defined as 90 mm for the study area or the observed maximum value of the closest station. The re-estimated maximum rainfall through the GEV model is 130.6 mm. Using that value in calculating the maximum flood provides a range of 1.4–22.6 m3/s.

4. Discussion

The annual maxima of daily time series in rainfall data for the period 1978–2022 were analyzed to force the GEV model to calculate the 100-year return period rainfall using 10 meteorological stations evenly distributed over the study area. This is important in the Gobi region, where the estimation of flood flows for the dry catchments depends on an accurate extreme rainfall estimation. Due to the arid region, flood observations are rare and rainfall is the main driver of the floods. Extreme rainfall is a key input parameter reflected on flood flows in arid and semi-arid region where catchments respond with rapid runoff due to limited infiltration capacity [54]. The ability of estimated return period rainfall is therefore critical for flood risk assessments and infrastructure design. The practice of using historical reference rainfall values for flood investigations is common but its reliability should be accurately assessed due to the impacts of climate variability and long-term changes.
According to the Mann–Kendall (MK) test applied here to the series of annual maxima for the study period, there are no significant trends at most stations, except for two. This is normal for arid and semi-arid regions where interannual rainfall variability is often high and long-term trends are difficult to detect and similar heterogeneity in trends has been observed in neighboring arid regions. Different trends in extreme rainfall have been observed in arid regions, such as decreasing in Inner Mongolia [55,56] and increasing trends in North China and the Yellow River basin, while other regions including the Yangtze River basin, Southeast Coast, South China, Inner Mongolia, Northwest China, and Tibetan Plateau over the period 1961–2009 [56]. Such spatial contrasts highlight the complex interaction between regional climate drivers, such as the East Asian monsoon and westerlies, which influence precipitation patterns across the region.
The block maxima approach, using annual maxima from daily time series, was used to collect extreme rainfall events over time. The GEV model was then applied, defined its flexible three-parameter formulation that allows it to represent different types of extreme value distribution following the Gumbel, Fréchet, and Weibull distribution. In this study, the shape parameter indicated that the Fréchet distribution provided the best fit to the observed rainfall extremes. This aligns with previous global analyses [48,57], which found that heavy-tailed Fréchet distributions often characterize extreme rainfall in arid and semi-arid regions where isolated convective storms produce highly localized, intense rainfall events. However, some studies conducted in different climate zones such as humid temperate have found that the Gumbel distribution offers a better fit, especially in areas with more regular and less intense rainfall patterns [58]. Other authors [59,60] obtained similar results, with 80% of the rainfall data corresponding to a Fréchet distribution, considering a global data survey. However, other local regions have different results, with the Gumbel probability distribution performing better, adjusting to 87.5% of cases [31]. Based on the literature evidence and the results presented here, the GEV model has the potential to predict extremes connected to climate variations; therefore, time series duration and characteristics of the data should be further considered in the future.
The results presented in the current study, combined with findings from the literature, indicate that the GEV model is not only useful for characterizing past extremes but also offers a foundation for developing climate-informed flood estimates when combined with climate model projections. Another important factor highlighted by this study is the influence of time series length and data quality on the reliability of extreme value analysis. The 44-year period analyzed here provides a reasonable basis for estimating 100-year rainfall return periods; however, longer records would improve confidence, particularly given the high variability inherent to arid climate systems. Future work should consider integrating paleo-hydrological data, satellite-derived rainfall products, and reanalysis datasets to extend the temporal coverage and reduce uncertainty.

5. Conclusions

This study aims to estimate the rainfall maximum flood along the small creeks and dry beds in the Gobi region of southern Mongolia, Umnugobi province. For that purpose, modeling the 100-year return period rainfall is the main input for calculating the maximum magnitude of the floods. Because of a lack of heavy rainfall analysis, the GEV model was tested for this dry region. The maximum rainfall was analyzed and modeled with GEV in the Gobi region of Mongolia considering the period from 1978–2022, and this pointed out changes that span between −7% and 16%, depending on the natural characteristics of each zone where a station is located. The heavy rainfall from the two stations has a significant increasing and decreasing trend as the MK test, but others are insignificant.
Following the GEV analysis, most stations’ maximum rainfall has a Fréchet distribution and 100-year values that range between 27.8–130.6 mm. The local value in the 100-year return period rainfall is defined as 90 mm for the whole Gobi region.
The geographical distribution of the maximum rainfall shows that the western and northern part of the region has a high potential, meaning that heavy floods are more likely to happen here. The catchment area of the selected creeks and dry beds varies from 0.4 to 95.2 km2 with a length of 17.9 km. Field surveys were carried out on 27 dry beds and morphological and cross-sectional data were measured.

Author Contributions

Conceptualization, M.B.-E., O.D. and M.Z.; methodology, M.Z., O.D. and M.B.-E.; software, M.Z. and M.B.-E.; validation, O.D., D.D. and E.S.; formal analysis, M.B.-E. and M.Z.; investigation, M.Z., M.B.-E. and O.D., resources, M.B.-E.; data curation, M.B.-E.; writing—original draft preparation, M.Z., M.B.-E. and M.N.; writing—review and editing M.N.; visualization, M.B.-E. and M.Z.; supervision, O.D., D.D. and E.S.; project administration, O.D. and D.D.; funding acquisition, M.B.-E. and M.Z. All authors have read and agreed to the published version of the manuscript.

Funding

This research received no external funding.

Institutional Review Board Statement

Not applicable.

Informed Consent Statement

Not applicable.

Data Availability Statement

The original contributions presented in this study are included in the article. Further inquiries can be directed to the corresponding authors.

Acknowledgments

A subsidy from the Polish Ministry of Education and Science for the Institute of Geophysics and the Polish Academy of Sciences supported M.N.’s work.

Conflicts of Interest

The authors declare that they have no conflicts of interest.

References

  1. Loyeh, N.S.; Bavani, A.M. Daily Maximum Runoff Frequency Analysis under Non-Stationary Conditions Due to Climate Change in the Future Period: Case Study Ghareh Sou Basin. J. Water Clim. Change 2021, 12, 1910–1927. [Google Scholar] [CrossRef]
  2. Fan, M. Making Water Available in Mongolia at the Right Time, at the Right Place, and in the Right Quality; ADB Brief No. 140; Asian Development Bank: Mandaluyong, Philippines, 2020. [Google Scholar] [CrossRef]
  3. Peel, M.C.; Finlayson, B.L.; McMahon, T.A. Updated World Map of the Köppen-Geiger Climate Classification. Hydrol. Earth Syst. Sci. 2007, 11, 1633–1644. [Google Scholar] [CrossRef]
  4. National Statistical Office. Baseline study of Umnugobi aimag report, 2018. In Changes in the Environmental Indicators of Umnugobi in 2008–2018; National Statistical Office: Ulaanbaatar, Mongolia, 2018. [Google Scholar]
  5. Baldi, M.; Amin, D.; Al Zayed, I.S.; Dalu, G. Climatology and Dynamical Evolution of Extreme Rainfall Events in the Sinai Peninsula—Egypt. Sustainability 2020, 12, 6186. [Google Scholar] [CrossRef]
  6. Henny, L.; Thorncroft, C.D.; Hsu, S.S.; Bosart, L.F. Extreme Rainfall in Taiwan: Seasonal Statistics and Trends. J. Clim. 2021, 34, 4711–4731. [Google Scholar] [CrossRef]
  7. Li, X.; Zhang, K.; Gu, P.; Feng, H.; Yin, Y.; Chen, W.; Cheng, B. Changes in precipitation extremes in the Yangtze River Basin during 1960–2019 and the association with global warming, ENSO, and local effects. Sci. Total Environ. 2021, 760, 144244. [Google Scholar] [CrossRef] [PubMed]
  8. Intergovernmental Panel on Climate Change (IPCC). Climate Change 2023: Synthesis Report. In Contribution of Working Groups I, II, and III to the Sixth Assessment Report of the Intergovernmental Panel on Climate Change; IPCC: Geneva, Switzerland, 2023; Available online: https://www.ipcc.ch/report/ar6/syr/ (accessed on 5 December 2024).
  9. Kartal, V.; Nones, M. Assessment of Meteorological, Hydrological and Groundwater Drought in the Konya Closed Basin, Türkiye. Environ. Earth Sci. 2024, 83, 285. [Google Scholar] [CrossRef]
  10. Antokhina, O.; Antokhin, P.; Gochakov, A.; Zbirannik, A.; Gazimov, T. Atmospheric Circulation Patterns Associated with Extreme Precipitation Events in Eastern Siberia and Mongolia. Atmosphere 2023, 14, 480. [Google Scholar] [CrossRef]
  11. Li, C.; Zhang, X.; Liu, Y. Hydroclimatic Variability over Eurasia during the 21st Century: A Review. Earth Sci. Rev. 2019, 199, 102972. [Google Scholar] [CrossRef]
  12. Zorigt, M.; Gankhuu, B.; Ganjuur, S.; Kenner, S.; Nergui, S.; Markus, H. Runoff dynamics of the upper Selenge basin, a major water source for Lake Baikal, under a warming climate. Reg. Environ. Change 2019, 19, 2609–2619. [Google Scholar] [CrossRef]
  13. Ying, H.; Zhang, H.; Zhao, J.; Shan, Y.; Zhang, Z.; Guo, X.; Rihan, W.; Deng, G. Effects of spring and summer extreme climate events on the autumn phenology of different vegetation types of Inner Mongolia, China, from 1982 to 2015. Ecol. Indic. 2020, 111, 105974. [Google Scholar] [CrossRef]
  14. Gong, D.Y.; Shi, P.J.; Wang, J.A. Daily precipitation changes in the semi-arid region over northern China. J. Arid Environ. 2004, 59, 771–784. [Google Scholar] [CrossRef]
  15. Zhai, P.; Zhang, X.; Wan, H.; Pan, X. Trends in Total Precipitation and Frequency of Daily Precipitation Extremes over China. J. Clim. 2005, 18, 1096–1108. [Google Scholar] [CrossRef]
  16. Liu, B.; Xu, M.; Henderson, M.; Gong, D. Changes in precipitation over China during the past half-century. Int. J. Climatol. 2011, 31, 111–123. [Google Scholar]
  17. Hiraga, Y.; Tahara, R.; Meza, J. A methodology to estimate Probable Maximum Precipitation (PMP) under climate change using a numerical weather model. J. Hydrol. 2025, 652, 132659. [Google Scholar] [CrossRef]
  18. Rai, P.; Bangelesa, F.; Abel, D.; Ziegler, K.; Huang, J.; Schaffhauser, T.; Polinger, F.; Disse, M.; Paeth, H. Extreme precipitation and temperature indices under future climate change in central Asia based on CORDEX-CORE. Theor. Appl. Climatol. 2024, 155, 6015–6039. [Google Scholar] [CrossRef]
  19. Vandandorj, S.; Munkhjargal, E.; Boldgiv, B.; Gantsetseg, B. Changes in event number and duration of rain types over Mongolia from 1981 to 2014. Environ. Earth Sci. 2016, 76, 70. [Google Scholar] [CrossRef]
  20. Davi, N.; Jacoby, G.; Fang, K.; Li, J.; D’Arrigo, R.; Baatarbileg, N.; Robinson, D. Reconstructing drought variability for Mongolia based on a large- scale tree ring network:1520–1993. J. Geophys. Res. 2010, 115, D22103. [Google Scholar] [CrossRef]
  21. Kang, S.; Huang, J.; Zhang, F. Projections of future precipitation changes in Central Asia based on CMIP5 climate models. Environ. Res. Lett. 2015, 10, 064016. [Google Scholar]
  22. Mijiddorj, T.; Davaa, G.; Tumenjargal, E. Assessment of hydroclimatic variability in Mongolia using observational data. Water 2020, 12, 2392. [Google Scholar]
  23. World Bank. Climate Risk Profile: Central Asia; World Bank Group Publications: Chicago, IL, USA, 2021. [Google Scholar]
  24. Tanprayoon, E.; Tonggumnead, U.; Aryuyuen, S. A new extension of generalized extreme value distribution: Extreme value analysis and return level estimation of the rainfall data. Trends Sci. 2023, 20, 4034. [Google Scholar] [CrossRef]
  25. Cavanaugh, N.R.; Gershunov, A.; Panorska, A.K.; Kozubowski, T.J. The probability of distribution of intense daily precipitation. Geophys. Res. Lett. 2015, 42, 1560–1567. [Google Scholar] [CrossRef]
  26. Paula, F.D.; Giugni, M.; Pugliese, F.; Annis, A.; Nardi, F. EV Parameter Estimation and Stationery vs. Non-Stationary Analysis of Extreme Rainfall in African Test Cities. Hydrology 2018, 5, 28. [Google Scholar] [CrossRef]
  27. Ulrich, J.; Faur, F.S.; Rust, H.W. Modeling seasonal variations of extreme rainfall on different time scales in Germany. Hydrol. Earth Syst. Sci. 2021, 25, 6133–6149. [Google Scholar] [CrossRef]
  28. Hossain, I.; Khastagir, A.; Aktar, M.N.; Imteaz, M.A. Comparison of estimation techniques for generalized extreme value (GEV) distribution parameters: A case study with Tasmanian rainfall. Int. J. Environ. Sci. Technol. 2022, 19, 7737–7750. [Google Scholar] [CrossRef]
  29. Belhiri, A.; Kim, J.H. Advanced frequency analysis techniques in modeling extreme rainfall events. J. Hydrol. Res. 2023, 78, 12–25. [Google Scholar]
  30. Gründemann, G.J.; Zorzetto, E.; Hylke, E.; Bec, H.E.; Schleiss, M.; van de Giesen, N.; Marani, M.; Ruud, J.; van der Ent, R. Extreme precipitation return levels for multiple durations on a global scale. J. Hydrol. 2023, 621, 129558. [Google Scholar] [CrossRef]
  31. Back, A.J.; Bonfante, F.M. Evaluation of generalized extreme value and Gumbel distributions for estimating maximum daily rainfall. Braz. J. Environ. Sci. 2021, 56, 654–664. [Google Scholar] [CrossRef]
  32. Hanum, H.; Djuraidah, A.H.W.; Mangku, I.W. Modeling extreme rainfall with Gamma-Paretto distribution. Appl. Math. Sci. 2015, 9, 6029–6039. [Google Scholar] [CrossRef]
  33. Min, J.L.; Halim, S.A. Rainfall modelling using generalized extreme value distribution with cyclic covariate. Math. Stat. 2020, 8, 762–772. [Google Scholar] [CrossRef]
  34. Salinas, J.L.; Castellarin, A.; Kohnová, S.; Kjeldsen, T.R. Regional parent flood frequency distributions in Europe-Part 2: Climate and scale controls. Hydrol. Earth Syst. Sci. 2014, 18, 4391–4401. [Google Scholar] [CrossRef]
  35. He, S.; Li, Z.; Liu, X. An improved GEV boosting method for imbalanced data classification with application to short-term rainfall prediction. J. Hydrol. 2023, 617 Pt B, 128882. [Google Scholar] [CrossRef]
  36. Chaudhuri, R.R.; Sharma, P. Addressing uncertainty in extreme rainfall intensity for semi-arid urban regions: Case study of Delhi, India. Nat. Hazards 2020, 104, 2307–2324. [Google Scholar] [CrossRef]
  37. Nguyen, V.T.V.; Nguyen, T.H. Statistical Modeling of Extreme Rainfall Processes (SMExRain): A Decision Support Tool for Extreme Rainfall Frequency Analyses. Procedia Eng. 2016, 154, 624–630. [Google Scholar] [CrossRef]
  38. Das, S.; Zhu, D.; Yin, Y. Comparison of mapping approaches for estimating extreme precipitation of any return period at ungauged locations. Stoch. Environ. Res. Risk Assess. 2020, 34, 1175–1196. [Google Scholar] [CrossRef]
  39. Roslan, S.N.; Siadatmousavi, S.M.; Naderi, A. Extreme value analysis for waves in the Persian Gulf: Skill assessment of different methods for a fetch-limited basin. Reg. Stud. Mar. Sci. 2023, 57, 102576. [Google Scholar]
  40. National Statistical Office. Social Indicator Sample Survey 2018; National Statistical Office: Ulaanbaatar, Mongolia, 2018.
  41. Chepelianskaia, O. Mongolia—Climate Change and Disaster Risk Profile; United Nations Economic and Social Commission for Asia and the Pacific (ESCAP): Bangkok, Thailand, 2022. [Google Scholar]
  42. Dagvadorj, D.; Batjargal, Z.; Natsagdorj, L. Mongolian Second Assessment Report on Climate Change 2014; Ministry of Environment and Tourism: Ulaanbaatar, Mongolia, 2014.
  43. Mann, H.B. Non-Parametric Test against Trend. Econometrica 1945, 13, 245–259. [Google Scholar] [CrossRef]
  44. Kendall, M.G. Rank Correlation Methods, 4th ed.; Charles Griffin: London, UK, 1975. [Google Scholar]
  45. Gilbert, R.O. Statistical Methods for Environmental Pollution Monitoring; Wiley: New York, NY, USA, 1987. [Google Scholar]
  46. Embrechts, P.; Klüppelberg, C.; Mikosch, T. Modelling Extremal Events for Insurance and Finance; Springer: Berlin/Heidelberg, Germany, 1987. [Google Scholar]
  47. McNeil, A.J.; Frey, R.; Embrechts, P. Quantitative Risk Management: Concepts, Techniques, and Tools; Princeton University Press: Princeton, NJ, USA, 2005. [Google Scholar]
  48. Coles, S. An Introduction to Statistical Modeling of Extreme Values; Springer Series in Statistics; Springer: Berlin/Heidelberg, Germany, 2001. [Google Scholar]
  49. National Construction Committee. Norms and Rules for Calculating Hydrological Definitions; National Construction Committee: Ulaanbaatar, Mongolia, 1986.
  50. Davaa, G. Surface Water Regime and Resources of Mongolia; Admon Printing: Ulaanbaatar, Mongolia, 2015; ISBN 978-99973-0-767-5. [Google Scholar]
  51. Batima, P.; Dagvadorj, D. Climate Change and Its Impacts in Mongolia; JEMR Publication; National Agency for Meteorology, Hydrology, and Environmental Monitoring: Ulaanbaatar, Mongolia, 2000; 227p.
  52. Dashdorj, B. Peak flow frequency analysis of the Orkhon River, Mongolia. In Proceedings of the Second International Conference on Resources and Technology (RESAT 2023), Ulaanbaatar, Mongolia, 19–20 June 2023; Lkhamsuren, A., Dashdorj, B., Tsend, C., Eds.; Advances in Engineering Research. Atlantis Press: Dordrecht, The Netherlands, 2023; pp. 133–145. [Google Scholar]
  53. Trenberth, K.E. The impact of climate change and variability on heavy precipitation, floods, and droughts. Encycl. Hydrol. Sci. 2005, 17, 1–11. [Google Scholar]
  54. Pilgrim, D.H.; Cordery, I. Flood Runoff. In Handbook of Hydrology; Maidment, D.R., Ed.; McGraw-Hill: New York, NY, USA, 1993; Chapter 9; pp. 1–42. [Google Scholar]
  55. Tong, S.; Li, X.; Zhang, J.; Bao, Y.; Bao, Y.; Li, N.; Si, A. Spatial and temporal variability in extreme temperature and precipitation events in Inner Mongolia (China) during 1960–2017. Sci. Total Environ. 2019, 649, 75–89. [Google Scholar] [CrossRef]
  56. Xu, Z.; Li, Y.; Yang, X. Recent changes in heavy rainfall events in East Asia: A response to anthropogenic climate change. Clim. Change 2021, 166, 78. [Google Scholar]
  57. Kharin, V.V.; Zwiers, F.W. Estimating Extremes in Transient Climate Change Simulations. J. Clim. 2005, 18, 1156–1173. [Google Scholar] [CrossRef]
  58. Haddad, K.; Rahman, A. Selection of the best fit flood frequency distribution and parameter estimation procedure: A case study for Tasmania in Australia. Stoch. Environ. Res. Risk Assess. 2011, 25, 415–428. [Google Scholar] [CrossRef]
  59. Fu, G.; Yu, J.; Yu, X.; Ouyang, R.; Zhang, Y.; Wang, P.; Liu, W.; Min, L. Temporal variation of extreme rainfall events in China, 1961–2009. J. Hydrol. 2013, 487, 48–59. [Google Scholar] [CrossRef]
  60. Papalexiou, S.M.; Koutsoyiannis, D. Battle of extreme value distributions: A global survey on extreme daily rainfall. Water Resour. Res. 2013, 49, 187–201. [Google Scholar] [CrossRef]
Figure 1. Study area, with indication of meteorological stations S (see Table 1).
Sustainability 17 02500 g001
Figure 2. Maximum rainfall data from each station using block maxima. Here, S1–S10 refer to the stations codes for ten stations illustrated in Table 1.
Sustainability 17 02500 g002aSustainability 17 02500 g002b
Figure 3. Boxplots for daily maximum rainfall data.
Sustainability 17 02500 g003
Figure 4. QQ-plot for the 10 stations (S1–S10).
Sustainability 17 02500 g004
Figure 5. Comparison of estimated maximum discharge the reference values of high rainfall and GEV model.
Sustainability 17 02500 g005
Table 1. Information of the meteorological stations used in the study.
No.Station NameStation CodeElevation, m aslNatural Zone
1Bayan-OvooS11179Desert
2DalanzadgadS21465Desert
3GurvantesS31726Desert steppe
4KhanbogdS41115Desert
5KhurmenS51701Desert steppe
6Mandal-OvooS61084Desert steppe
7NoyonS71960Desert steppe
8SaikhanS81328Desert steppe
9Tsogt-OvooS91287Desert steppe
10TsogttsetsiiS101480Desert steppe
Table 2. Morphometric data of dry beds.
No.Code of the Dry BedsCoordinatesCatchment AreaLengthSlope
LongitudeLatitudeS, km2L, kmJ, ‰
1OP1105.5701843.6432216.97.912.4
2OP2105.6059943.644685.02.51.26
3OP3105.6395043.631899.44.916.2
4OP4105.6994943.5761621.16.110.4
5OP5105.7071643.5690030.67.86.88
6OP6105.7904843.5282831.016.610.4
7OP7106.1516543.0892127.97.66.20
8OP8106.4103043.027171.01.417.8
9OP9106.4152443.025721.41.910.2
10OP10106.4900843.0119421.65.15.82
11OP11106.5248143.011481.11.421.4
12OP12106.5654543.010766.13.89.39
13OP13106.5803343.010381.91.816.2
14OP14106.6120043.010637.85.610.7
15OP15106.6143743.010775.94.912.3
16OP16106.6435943.016252.51.110.8
17OP17106.6459643.016743.01.512.8
18OP18106.7015743.019058.33.27.8
19OP19106.7346343.0095324.36.27.3
20OP20106.9493342.930289.74.36.9
21OP21106.9835242.840893.42.28.3
22OP22107.0294542.775211.51.88.6
23OP23107.1334342.662838017.99.5
24OP24107.3626842.4855849.47.84.5
25OP25107.4375042.4630295.216.94.3
26OP26107.5558242.4404926.89.26.0
27OP27107.6181442.4130711.53.56.1
Table 3. Mann–Kendall test parameters.
Stations CodeZ-ValueSen’s Slopep-Value
S11.080.120.27
S2−0.41−0.030.68
S3−0.88−0.070.37
S41.420.090.14
S52.050.300.04
S61.680.190.09
S71.370.230.16
S81.040.120.29
S90.670.060.53
S10−2.18−0.620.02
Table 4. Estimated GEV parameters for each station.
Station CodeMaximum Livelihood
Location (µ)Scale (σ)Shape (ξ)
S111.55.50.1
S227.95.1−0.1
S333.77.3−0.2
S427.95.1−0.1
S511.38.10.2
S69.46.2−0.2
S715.47.30.2
S816.18.00.1
S933.77.2−0.2
S1016.512.70.2
Table 5. Estimated maximum rainfall at 1% (i.e., with a return period of 100 years).
No.Station CodeReturn Level 100-Years
1S144.6
2S263.1
3S368.4
4S446.5
5S579.1
6S627.8
7S779.4
8S871.1
9S954.1
10S10130.6
Disclaimer/Publisher’s Note: The statements, opinions and data contained in all publications are solely those of the individual author(s) and contributor(s) and not of MDPI and/or the editor(s). MDPI and/or the editor(s) disclaim responsibility for any injury to people or property resulting from any ideas, methods, instructions or products referred to in the content.

