Article

Quality or Quantity? The Impact of Voluntary Environmental Regulation on Firm’s Green Technological Innovation: Evidence from Green Factory Certification in China

1
School of Business, Xiangtan University, Xiangtan 411105, China
2
School of Business, Hunan University of Science and Technology, Xiangtan 411201, China
3
School of Business, Sichuan University, Chengdu 610064, China
*
Author to whom correspondence should be addressed.
Sustainability 2025, 17(6), 2498; https://doi.org/10.3390/su17062498
Submission received: 12 February 2025 / Revised: 2 March 2025 / Accepted: 10 March 2025 / Published: 12 March 2025

Abstract

:
Adequately incentivizing firms to implement green technological innovation (GTI) is pivotal to achieving sustainable development. Green factory certification, a prominent example of voluntary environmental regulation, has garnered significant attention in both theoretical and policy concerns regarding its impact on green technological innovation. Leveraging green factory certification as a quasi-natural experiment, this paper utilizes a multi-timepoint difference-in-differences (DID) approach to systematically investigate its influence on firms’ green technological innovation. The findings reveal several important insights. (1) Green factory certification significantly enhances firms’ green technological innovation capabilities, facilitating substantial enhancements in both the quantity and quality of green technological innovation. (2) Mechanism analysis indicates that green factory certification promotes green innovation via three key channels—promoting the digitalization level, strengthening ESG practices, and facilitating financing constraints. (3) The green innovation incentive effects of green factory certification are particularly pronounced among firms in the eastern region, non-state-owned entities, and those exhibiting lower pollution levels. These findings underscore the critical role of green certification systems in fostering corporate green development, offering both theoretical insights and practical guidance for firms undergoing green transformation while contributing to the broader goal of sustainable development.

Graphical Abstract

1. Introduction

With escalating climate change and worsening environmental pollution, countries worldwide are intensifying efforts to promote green transformation as a pathway to attain sustainable development [1]. As the world’s second-largest economy and the largest developing country, China’s traditional extensive growth model has, alongside its rapid economic expansion, led to significant resource and environmental challenges [2]. The 2022 Global Environmental Performance Index (EPI) ranks China at 160th position, underscoring the urgency of addressing these issues. In response to these challenges, China set forth its “dual carbon” goals in 2020, aiming to set up a green, low-carbon, and circular economy. Green technological innovation (GTI) is particularly crucial in this process since it can establish a dynamic balance between economic benefits and environmental requirements via the research and implementation of eco-friendly technologies [3,4]. As a cornerstone of national economic development, GTI in enterprises is not only essential for adapting to the green economy but also a critical driver in achieving the “dual carbon” goals [5]. Consequently, finding effective ways to incentivize firms and enterprises to implement GTI is an urgent and central issue that must be addressed.
Compared to traditional innovation, the twin externalities associated with GTI diminish the motivation for firms to actively pursue GTI [6]. Government environmental regulatory policies have become critical instruments for incentivizing GTI within enterprises [7]. The existing literature has extensively explored the impact of traditional command-and-control regulations [8,9] and market-based regulations [10] on firms’ GTI. However, the former rely on coercive enforcement, and often incur high administrative costs and potential crowding-out effects, while the latter leverage economic incentives but may suffer from market failures that weaken their effectiveness in fostering GTI [4,11].
In light of these challenges, voluntary environmental regulation is being increasingly adopted and viewed as a valuable complement to traditional regulatory tools, with their flexible governance, rapid adaptability, and efficient responsiveness [11]. This is particularly relevant in China, a rapidly developing economy where the environmental governance system and regulatory capacity are still evolving. Weak coordination among policy instruments and inconsistent enforcement of environmental laws have resulted in a significant gap between the intended objectives and the actual effectiveness of traditional environmental regulations [12]. Consequently, the potential value of voluntary environmental regulation is increasingly being recognized and progressively integrated into China’s environmental management framework.
In 2016, the Ministry of Industry and Information Technology (MIIT) of China issued the Notice on the Construction of a Green Manufacturing System, which introduced a green factory certification system as a means to drive industrial transformation, upgrading, and green development within the sector. This certification encompasses the entire enterprise lifecycle, from energy input and product manufacturing to environmental emissions [13], representing an innovative application of voluntary environmental regulation within China’s institutional framework. To date, thousands of enterprises across multiple provinces and cities have participated in this certification, with a broad scope of participation. Implemented in multiple phases over several rounds, green factory certification has become a key policy instrument in advancing the country’s green industrial development.
In recent years, an increasing body of literature has explored the environmental incentive effects of voluntary environmental regulatory tools. Recent studies have concentrated on environmental certification programs initiated by non-governmental organizations, including ISO14001 certification [14,15] and sustainable forest management certification [16]. However, research on green factory certification has largely examined its economic impacts, such as financial performance [17], while its role in fostering corporate GTI remains underexplored. Compared to these certification tools, green factory certification is government-led, offering higher credibility and stronger institutional safeguards [13]. Within the context of GTI, it embodies the dual functions of a “proactive government” and an “efficient market”, theoretically providing stronger incentives for enterprises to pursue GTI. Against this backdrop, this raises the following core research question:
(1)
Can green factory certification promote GTI in enterprises?
(2)
If so, what are the key mechanisms through which certification affects innovation outcomes?
To address these issues, this paper employs a multi-timepoint DID to systematically explore both the driving role of green factory certification in empowering GTI and the underlying mechanisms, leveraging the execution of green factory certification, the typical voluntary environmental regulation policy, as the quasi-natural experiment. The findings show that green factory certification enhances firms’ GTI capabilities, achieving dual breakthroughs in both the quantity and quality of GTI. Such phenomenon is especially evident for firms situated in the eastern and central regions, non-state-owned organizations, and those operating in less-polluting industries. Additionally, the digitalization level, ESG practices, and the mitigation of financial constraints play crucial mediating roles in this process.
This study presents three fundamental contributions. Firstly, it broadens the scope of research concerning voluntary environmental regulations. While prior research predominantly concentrates on the environmental impacts of voluntary regulations led by non-governmental organizations, this paper shifts attention to green factory certification led by government, a policy with distinct Chinese characteristics. This research advances the theoretical comprehension of the incentive effects associated with voluntary environmental regulatory policies, presents additional empirical evidence, and enriches the research on the economic effect of green factory certification. Secondly, it enriches the literature on the drivers of GTI. This paper examines the link between green factory certification and GTI, particularly regarding both the quantity and quality of GTI. It offers a comprehensive dissection of their relationship within the “constraint and incentive”, providing novel insights into strategies for enhancing GTI. Thirdly, it investigates the mediation roles of digitalization level, ESG, and financing constraints. This sheds light on the internal mechanisms through which green certification policies influence the GTI process within firms, offering critical policy levers for maximizing the environmental benefits of green factory certification.
The structure is arranged as: Section 2 develops the policy background, literature review, and theoretical mechanisms; Section 3 presents the data collected, methods, and variables; Section 4 presents the baseline results; Section 5 presents the mechanism and heterogeneity analysis results; and Section 6 presents the conclusions, policy suggestions, and limitations.

2. Policy Background, Literature Review and Theoretical Analysis

2.1. Policy Background

Expediting the green transformation of development models is a critical pathway toward achieving sustainable development. In 2015, the State Council introduced the “Made in China 2025” initiative, identifying the “comprehensive promotion of green manufacturing” as a key strategic objective. Among these, green factory certification constitutes a core element of China’s green manufacturing framework. Later, in 2016, the MIIT issued the Notice on the Construction of a Green Manufacturing System, formally establishing the procedures and requirements for green factory certification. According to the General Principles for Green Factory Evaluation (GB/T 36132-2018) [18], the evaluation system employs rigorous, multi-dimensional standards that comprehensively assess all aspects of the manufacturing process, including infrastructure, management systems, energy and resource consumption, product design, and environmental emissions.
The green factory policy combines voluntary application with independent third-party evaluation. The process is as follows: enterprises first conduct self-assessments and submit their applications, which are reviewed and recommended by local supervisory departments [13]. Ultimately, green factory certification is awarded by the MIIT. As a typical example of voluntary environmental regulation, this policy exhibits the following characteristics:
Firstly, enterprises have the right to self-declare [19]. Voluntary participation and self-assessment reflect the proactive role of enterprises in green manufacturing and underscore their commitment to self-regulation in environmental protection.
Secondly, certified enterprises benefit from policy support. The MIIT and governments at various levels provide incentives to green factories through mechanisms such as special funds, green credits, and tax breaks [20]. For instance, certified enterprises typically enjoy loan interest rates below the market average, with financing costs approximately 15% lower than those for non-certified enterprises [21].
Thirdly, the policy emphasizes ongoing management, with certified enterprises subject to a series of constraints [19]. These enterprises undergo regular audits, and the MIIT conducts a review every three years to ensure that they continue to meet high standards for green production. Enterprises that fail the audit risk having their green factory certification revoked. This stringent monitoring system not only reinforces the effectiveness of policy incentives but also promotes continuous improvements in GTI and resource and environmental performance.
From 2017 to 2022, China certified seven batches of national-level green factories, totaling 3657 certified enterprises. Specifically, 201 enterprises were certified in 2017, with the number increasing to 391 in 2018, 602 in 2019, 719 in 2020, 651 in 2021, and reaching 874 in 2022. These green factories span a wide array of industries, including electronics, chemicals, and metallurgy, thereby highlighting the extensive applicability of the policy and its pivotal role in advancing green transformation.

2.2. Literature Review

2.2.1. Related Literature on GTI

GTI refers to process or product innovations designed to conserve resources and minimize environmental impact [22]. Unlike traditional innovation, GTI emphasizes both “innovation” and “green”; the goal is to achieve economic benefits while generating good environmental and ecological outcomes [23]. To this end, GTI is widely recognized as an inevitable choice for decoupling environmental pressure and economic growth.
To better promote GTI and achieve dual benefits, the academic community has paid widespread attention to factors driving GTI, and related research mainly focuses on the following three dimensions. Firstly, from an internal perspective of enterprises, scholars have mainly analyzed the driving role of executive team characteristics, ESG, and other enterprise conditions in GTI [24,25]. Secondly, from the perspective of stakeholder theory, the attention of stakeholders, such as investors, customers, and consumers, could encourage active participation in GTI [6,26]. Finally, from the perspective of the external institutional environment, previous studies have analyzed the impact of policy tools such as government subsidies [27], tax policy [28], and environmental regulations [29] on corporate GTI.
Although significant progress has been made in identifying the influencing factors of GTI in the existing research, it mainly focuses on the impact of proactive behavior and characteristics within enterprises or external traditional environmental regulatory policies. In contrast, there is still a lack of systematic research on voluntary environmental regulation policies, especially the impact of green factory certification on corporate GTI in the Chinese context. Therefore, it is necessary to further explore the incentive effects of this policy to fill the current research gap.

2.2.2. Related Literature on Voluntary Environmental Regulation

Environmental regulation is a crucial policy instrument used by governments to mitigate environmental pollution and promote sustainable development. Based on different implementation approaches, environmental regulations can be categorized into three main types: command-and-control, market-based, and voluntary regulations [29]. Unlike traditional regulatory frameworks, voluntary environmental regulations incentivize firms to provide environmental public goods through agreements, commitments, or action plans [30]. Their core function lies in establishing incentive mechanisms that encourage enterprises to proactively assume environmental responsibility.
Extensive research has examined the impact of voluntary environmental regulations on environmental performance [31,32], economic benefits [33], corporate innovation [30,34], and GTI [11,35,36] from multiple perspectives. Ma et al. [11] and Hu et al. [35] have shown that ISO14001 [37] certification can significantly enhance firms’ GTI performance. Ren et al. [38] measure voluntary environmental regulation across three dimensions—public voluntary participation, ISO14001 certification, and environmental information disclosure—confirming its positive impact on ecological efficiency.
However, much of this research is based on foreign experiences, and studies specific to the Chinese context have predominantly focused on the economic consequences of ISO14001 certification. Their applicability within China’s institutional framework remains limited. Therefore, this paper examines the role and underlying mechanisms of voluntary environmental regulations with distinct Chinese characteristics in driving GTI. Addressing this gap will contribute to a more comprehensive understanding of the effectiveness of voluntary environmental policies in developing countries.

2.2.3. Related Literature on Green Factory Certification

Green factory certification is an innovative practice of voluntary environmental regulation in China’s institutional environment. Compared to other green certifications such as ISO14001 certification, green factory certification is government-led and has stronger credibility [13]. Its standards not only rely on highly specialized environmental technical specifications, but also cover the entire process of energy input, product production, and environmental emissions, with higher certification requirements and a more comprehensive system [12].
As green factory certification system continues to evolve, related research has also gained momentum. Existing studies have primarily examined its impact on the trade market [39], labor income [19], environmental information disclosure [40], etc. However, while these studies have revealed important economic implications, they have not fully explored the role and underlying mechanisms of green factory certification in fostering both the quantity and quality of GTI. This study seeks to address this research gap by investigating the certification’s impact on corporate GTI and the pathways through which it operates.

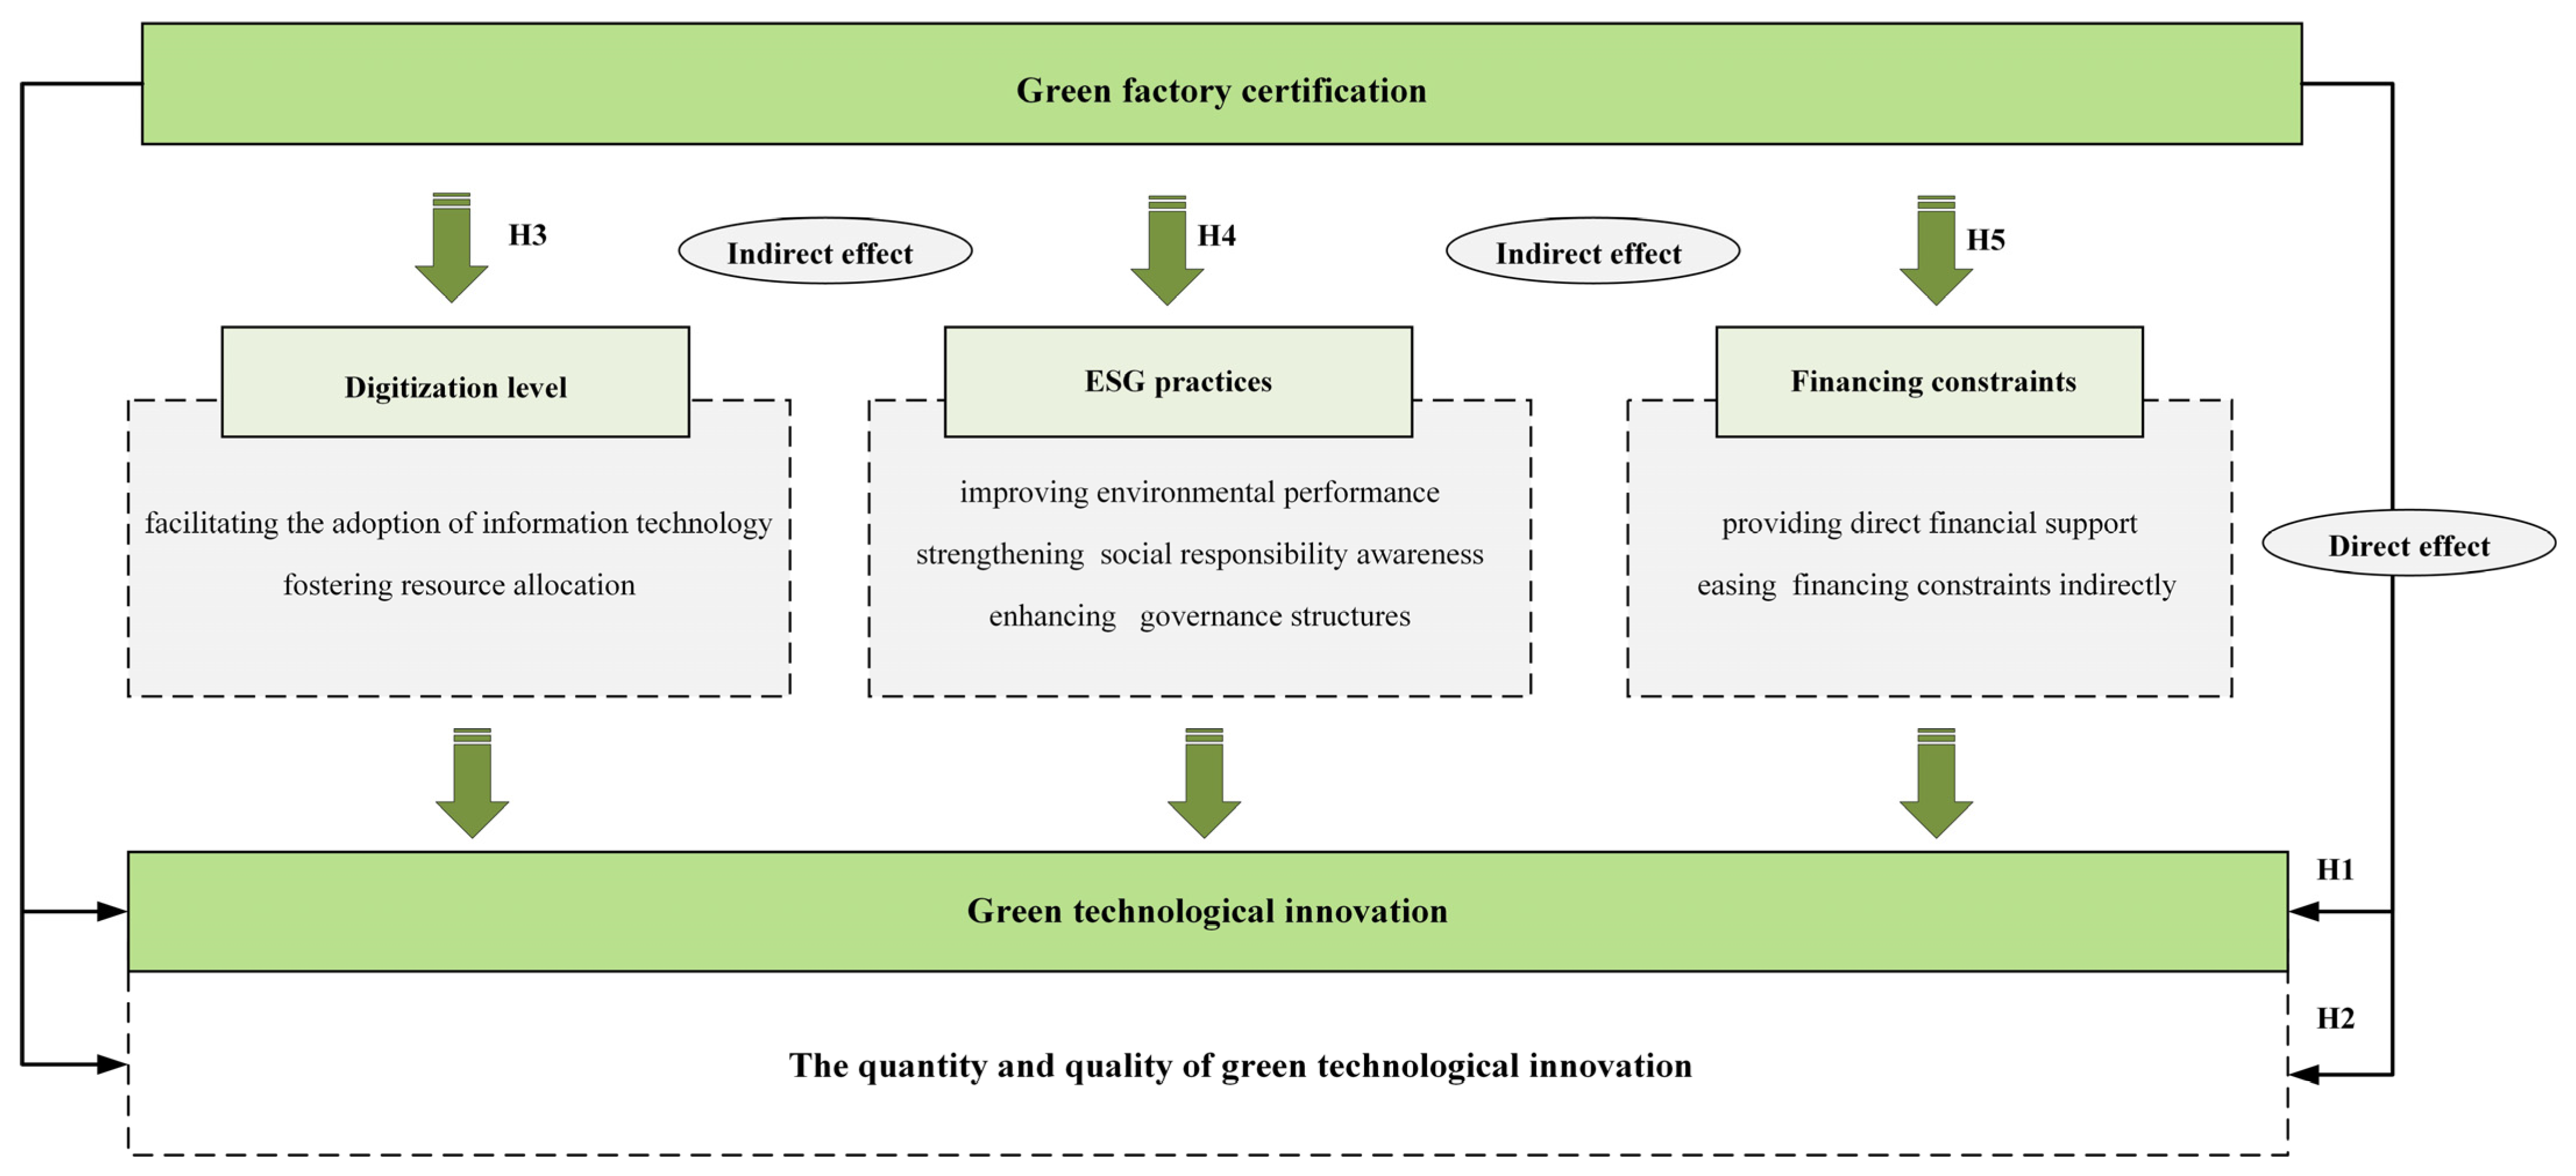
2.3. Theoretical Analysis

2.3.1. Green Factory Certification and GTI

Voluntary environmental regulation is undertaken by governments, industry organizations, or independent third-party entities—either individually or in collaboration—with enterprises voluntarily choosing to participate [41,42]. This regulatory approach aims to promote the implementation of environmental commitments, plans, or agreements. Compared to traditional environmental regulations that rely solely on government enforcement or market forces, voluntary environmental regulation places the responsibility for compliance directly on enterprises, granting them greater autonomy in environmental governance [36]. This approach not only stimulates corporate social responsibility, but also fosters a proactive attitude toward innovation [4]. Furthermore, voluntary environmental regulation offers long-term profitability [30]. Firms that opt into such initiatives anticipate that the long-term benefits of integrating GTI into their corporate development strategies will outweigh the short-term costs, thereby strengthening incentives for GTI [30]. Li et al. [36] and Ren et al. [38] have affirmed the positive impact of voluntary environmental regulations on firms’ GTI.
As an emerging voluntary environmental regulation in China, the green factory certification policy serves as a cornerstone of the country’s industrial green transformation [43]. It plays a crucial role in facilitating firms’ GTI. On the one hand, the green factory certification system fosters firms’ GTI through its stringent standards and dynamic management mechanisms. Firstly, the certification system establishes high standards in areas such as energy utilization, resource management, and pollutant emissions [44]. This requires firms to enhance green production and environmental technology [45]. Secondly, the certification system uses a dynamic management and periodic evaluation mechanism, requiring firms to continuously improve their green management and optimize production processes and environmental technologies [46], making GTI a key driver of their long-term development.
On the other hand, green factory certification enhances firms’ market reputation and brand value, strengthening their capacity to acquire external resources and form technology clusters. Certified firms are often regarded as benchmarks for green development, enjoying a high environmental reputation and enhanced brand value in society and the market. This reputational effect helps firms attract investors, business partners, and technology suppliers, particularly in the environmental technology and green product markets, thereby expanding external resource channels and facilitating technological collaboration [47,48]. Such relationships enable firms to achieve breakthroughs in green technology, providing critical support for GTI and enhancing competitiveness. Moreover, a strong environmental reputation fosters the formation of industrial clusters and technology alliances, encouraging cross-industry collaboration and resource integration. This not only advances the GTI development of individual enterprises, but also drives the green transformation and sustainable development of the entire industry chain. Building on these insights, this paper puts forward the following hypothesis:
Hypothesis 1 (H1):
Green factory certification significantly enhances firms’ GTI.
Furthermore, in practice, firms exhibit highly heterogeneous GTI models. From the perspectives of content and motivation, GTI can be categorized into quantity and quality dimensions. The quantity of GTI primarily reflects strategic innovation projects with short cycles and high success rates [49]. The quality of GTI, in contrast, represents high-value, substantive innovation efforts aimed at advancing technological progress and enhancing competitive advantage [50].
From the perspective of resource support, firms undergoing green factory certification must upgrade their technology and optimize processes related to resource conservation, pollutant emission control, and energy efficiency improvement to drive the development of green technology projects [51]. After certification, firms benefit from policy support such as tax reductions and green credits, which alleviate financial pressure and reduce the risks linked to GTI. This further promotes firms to increase R&D projects in GTI [52]. From a technological guidance standpoint, the strict standards of green factory certification require firms to uphold advanced technological capabilities to meet the evaluation criteria and retain their green factory status. Therefore, firms’ investment in green technology projects extends beyond the mere expansion of project quantity to encompass technological advancements, application effectiveness, and improvements in environmental performance [53]. Additionally, government subsidies and policy incentives play a crucial role in motivating enterprises to allocate more resources toward high-quality GTI, thereby strengthening the technological content and market competitiveness of their GTI [54].
Therefore, through the dual effects of resource support and technological guidance, the green factory certification policy is able to boost the quantity and quality of firms’ GTI. Building on these insights, this paper puts forward the following hypothesis:
Hypothesis 2 (H2):
Green factory certification significantly enhances both the quantity and quality of firms’ GTI.

2.3.2. The Underlying Mechanism of Digitalization Level

Green factory certification motivates firms to implement digital technologies to optimize production management and enhance resource efficiency, thereby strengthening their GTI capabilities. On the one hand, green factory certification promotes firms’ digitalization level. Firstly, certified firms must meet high standards in energy management, pollution control, and resource recycling [40]—requirements that traditional production methods often struggle to fulfill. Consequently, firms increasingly adopt digital technologies like IoT and AI to upgrade production processes, increase energy effectiveness, and diminish pollutant emissions [55]. Secondly, continuous oversight and auditing by the government, media, and the public necessitate regular disclosure of environmental performance data [12]. This regulatory requirement incentivizes companies to develop digital information management systems that enhance transparency and accountability, ensure compliance with green factory standards, and improve the credibility of their environmental disclosures.
On the other hand, enhancing the digitization level further promotes firms’ GTI. Firstly, the enhancement of firms’ digitization level facilitates the widespread adoption of information technology. This effectively breaks down the information barriers within or between enterprises and reduces information asymmetry [56]. Additionally, it provides firms with more accurate and abundant data resources, enabling more efficient cost management and optimized green technology R&D strategies [57]. Secondly, the enhancement of firms’ digitization level improves resource allocation efficiency. Digital production tools can be used to promote enterprise personnel, knowledge, technology, and other factors to achieve cross-time and space–time agglomeration and diffusion [58], effectively adjusting the configuration and supply of various types of GTI input factors [59], and thus improve the input–output efficiency of firms’ GTI. Thirdly, the enhancement of firms’ digitization level has accelerated the shift toward green consumption. As digitalization progresses, market demand increasingly favors green products and services, strengthening consumer preference for sustainability and further stimulating corporate GTI [60].
To sum up, green factory certification promotes firms’ digitization level by facilitating the widespread adoption of information technology and fostering resource allocation, thereby strengthening GTI’s abilities. Building on these insights, this paper puts forward the following hypothesis:
Hypothesis 3 (H3):
Green factory certification can enhance firms’ GTI by facilitating their digitization level.

2.3.3. The Underlying Mechanism of ESG Practices

ESG (environmental, social, and governance) practices reflect enterprises’ ability to integrate sustainability considerations into their business strategies while pursuing financial gains [61]. Under the green factory certification policy, firms can enhance their ESG performance, thereby fostering GTI. On the one hand, green factory certification promotes corporate ESG practices. Firstly, green factory certification compels enterprises to improve their environmental performance and social responsibility. This certification process is based on stringent environmental criteria [61]. Once certified, firms remain under continuous environmental scrutiny by regulatory authorities [40]. This rigorous oversight encourages firms to integrate environmental and social responsibilities into their decision-making processes, thereby improving their overall ESG practices. Secondly, green factory certification improves corporate governance structures. The certification process mandates the establishment of robust environmental management systems and strengthens compliance in environmental, social, and governance practices [62]. To meet these high standards, firms must continuously refine their governance frameworks and optimize internal control mechanisms, thereby elevating their ESG performance. Wei et al. [46] has confirmed that green factory certification can improve corporate ESG performance.
On the other hand, ESG practices further drive firms’ GTI. Many studies have supported the notion that ESG practices can enhance a company’s GTI [63,64]. Firstly, from an environmental performance perspective, firms must address challenges such as energy conservation, emission reduction, and pollution control in the process of improving environmental performance. These challenges create a strong demand for green technologies, products, and services, thereby stimulating corporate enthusiasm for GTI [65]. Secondly, from a social responsibility perspective, strong ESG practices reflect a company’s proactive commitment to environmental responsibility [66] and its responsiveness to the sustainability expectations of key stakeholders, including governments, investors, and customers [67]. This proactive approach helps firms gain market trust and policy support, securing critical resources for GTI [68]. Finally, from a governance perspective, robust ESG practices contribute to an improved corporate governance framework. A well-structured governance system mitigates risks associated with GTI, enhances decision-making efficiency, and ensures the long-term sustainability of corporate green strategies [69].
In summary, green factory certification enhances corporate ESG performance by enhancing environmental behavior, reinforcing social responsibility, and optimizing governance structures. This fosters a positive incentive mechanism for GTI, ultimately driving corporate green technological advancements. Building on these insights, this paper puts forward the following hypothesis:
Hypothesis 4 (H4):
Green factory certification can enhance firms’ GTI by facilitating their ESG practices.

2.3.4. The Underlying Mechanism of Financing Constraint

Green factory certification can enhance corporate GTI by alleviating financing restrictions. On the one hand, green factory certification can alleviate financing constrains for enterprises. Firstly, green factory certification directly mitigates firms’ financing constraints. As a government-led green industrial policy, certified enterprises benefit from various policy incentives, including government subsidies and tax reductions [70]. These incentives increase the availability of internal funds, thereby facilitating GTI. Secondly, green factory certification indirectly eases external financing constraints. Certified enterprises receive government-backed credit endorsement [12], signaling official recognition that increases their likelihood of securing bank loans and other external funding sources [71]. Additionally, corporates with green factory certification tend to disclose environmental information more comprehensively [40], improving corporate transparency and mitigating information asymmetry between themselves and investors [72]. This enhanced disclosure fosters investor confidence, facilitating enterprises’ access to financial backing.
On the other hand, alleviating financing constraints significantly enhances corporate GTI. The process of GTI is marked by substantial investment, significant risk, and a long cycle [73]. The alleviation of financing constraints ensures sufficient cash flow for GTI, allowing enterprises to allocate more resources to capitalize on opportunities arising from the new technological revolution [74]. At the same time, it reduces the risk of GTI failure due to funding shortages, providing stable and sustained support for firms’ long-term GTI.
In summary, green factory certification alleviates firm financing constraints through direct financial support from government policies, the signaling effect, and reducing information asymmetry, thereby fostering greater output in GTI. Building on these insights, this paper puts forward the following hypothesis:
Hypothesis 5 (H5):
Green factory certification can enhance firms’ GTI by alleviating financing constraints.
To summarize, the systematic theoretical framework is described in Figure 1.

3. Data and Research Method

3.1. Data Sources

Considering the promulgation of the “Guidelines for Environmental Information Disclosure of Listed Companies” by the Shanghai Stock Exchange in 2008, which aimed to guide the green information disclosure of listed firms and the substantial absence of data for some key variables in 2023, this paper uses A-share listed companies in China from 2008 to 2022 as the sample. Data on green factory certifications were sourced from the MIIT of China and were manually compiled and matched with companies and their subsidiaries. The data on firms’ ESG performance originated from the China Securities ESG Rating Agency, while other financial and firm characteristic data originated from the CSMAR and Wind.
The sample selection process followed a series of rigorous steps to ensure both representativeness and randomness. (1) Firms designated as ST or *ST, as well as those with long-term losses, were excluded to avoid distortions caused by financial distress or delisting risks. (2) Firms with an asset–liability ratio below 0 or exceeding 1 were removed to ensure financial stability and consistency. (3) Firms with substantial missing data on key variables were excluded to avoid introducing bias into the analysis. (4) All continuous variables were winsorized at the 1% and 99% percentiles to minimize the impact of extreme outliers. After these screening and processing steps, the final dataset comprised 22,720 observations, providing a robust foundation for the analysis.

3.2. Model Design

Given that green factory certification is a dynamic process of phased evaluation, this study utilizes a multi-period DID approach, referencing Beck et al. [75]. This approach enhances the robustness of the findings by controlling for potential time-varying confounders and accounting for the gradual nature of the green factory certification process. Furthermore, the use of this method helps mitigate potential endogeneity issues, as it compares the changes over time between treated and control groups, thus isolating the true effects of green factory certification on GTI. This method not only strengthens the validity of the study’s conclusions but also ensures a more nuanced understanding of how policy impacts evolve.
In this study, the multi-period DID approach is applied by defining treatment groups based on the timing of when firms received green factory certification. Interaction terms are introduced to indicate whether a firm received certification at different time points, allowing the model to capture the specific impacts at various stages of policy implementation. This specification helps to control for any potential biases that may arise from unobserved time-varying factors, ensuring that the estimated effects reflect the causal impact of the green factory policy. The model is specified as follows:
GTIi,t = β0 + β1 GP + β2 ∑ Controlsi,t + Year + Firm + εi,t
GTI_Invi,t = γ0 + γ1 GP + γ2 ∑ Controlsi,t + Year + Firm + εi,t
GTI_Utii,t = δ0 + δ1 GP + δ2 ∑ Controlsi,t + Year + Firm + εi,t
where i indicates the listed firm, and t indicates the year. GTI indicates firms’ level of GTI, GTI_Inv represents the quality of GTI, GTI_Uti indicates the quantity of GTI; GP is the core explanatory variable, representing whether a company has been certified as a green factory; Controls denotes several control variables; Year and Firm denote the time-fixed and firm-fixed effects, respectively; εi,t represents the regression residual.

3.3. Variable Definitions

3.3.1. Dependent Variables

Green technological innovation (GTI). This study measures GTI using the number of green patent applications, which more accurately reflects the enterprise’s actual innovation capacity at present, referencing Lv et al. [76]. Given the varying complexity of GTI, this paper further categorizes GTI into the quality and quantity of GTI. Green utility patents, compared to green invention patents, typically involve lower technological content, lower capital investment, and lower difficulty—resulting in relatively smaller new products, services, and value-added. Consequently, they serve as a suitable measure of the quantity of GTI. In contrast, green invention patents, which reflect substantial technological advancements and long-term innovation efforts, serve as an indicator of the quality of GTI. Specifically, GTI is measured as the natural logarithm of 1 plus the number of green invention and utility model patent applications. The quality of GTI (GTI_Inv) is measured as the natural logarithm of 1 plus the number of green invention patent applications, while the quantity of GTI (GTI_Uti) is measured as the natural logarithm of 1 plus the number of green utility model patent applications.

3.3.2. Independent Variable

Green factory certification (GP). Given that the list of green factory certifications from 2016 to 2022 varies by batch and year, with each year’s list including newly certified companies and those whose certifications have been revoked, the GP variable for firms is assigned according to the green factory demonstration list issued by China’s MIIT each year. Specifically, if a listed firm receives green factory certification in a given year, its GP is set to 1; if not certified, it is set to 0. In cases where certification is revoked within that year, the GP variable is adjusted to 0 accordingly.

3.3.3. Mechanism Variables

Digitalization level (Dig): Referencing Liao et al. [77], this study comprehensively measures firms’ digitalization level (Dig) by aggregating six layers: artificial intelligence technology, big data, cloud computing, blockchain, digital technology utilization, and digital transformation.
ESG practices (ESG): Referencing Feng et al. [78] to measure ESG practices, this study employs the Huazheng ESG rating as a proxy variable to evaluate firms’ comprehensive practices in sustainable development, social responsibility, and corporate governance. The ESG ratings are assigned numerical values from 9 to 1, corresponding to the nine rating categories from AAA to C, respectively.
Financing constraints (SA): Referencing Gao et al. [79], this study utilizes the SA index to evaluate firms’ financing constraints.

3.3.4. Control Variables

To ensure the scientific rigor of the study and minimize potential bias from corporate organizational structure, internal controls, and financial characteristics, this study incorporates some control variables, referencing Wang et al. [13] and Ai et al. [80]. Regarding firms’ characteristics and financial status, given their potential impact on investment capacity, innovation expenditures, and management activities, this study controls for the following variables: firm profitability (Roa), leverage ratio (Lev), firm size (Size), firm value multiple (Evm), Tobin’s Q (Tobinq), and firm age (Age). Regarding firms’ governance, considering that governance structures and manager and shareholder characteristics can influence strategic decision-making, management practices, and financial performance—thereby affecting GTI—this study additionally controls for the following variables: board size (BoardSize), shareholding ratio of the largest shareholder (Top1), number of independent directors (Indp), and CEO duality (Dual). By controlling for these variables, the study can more effectively assess the impact of green factory policies on GTI, while minimizing the influence of other external factors that may distort the results, thereby enhancing the reliability of the findings. Table 1 outlines the measurement methods and descriptions for all variables in this paper.

4. Empirical Results

4.1. Descriptive Statistics and Correlation Test

The statistical software STATA 18.0 is used for the empirical test. Table 2 offers the descriptive statistics for main variables. The mean value of GTI is 0.414, with a standard deviation of 0.849 and a range of [0, 7.06]. This indicates a substantial variation in firms’ GTI capabilities within the sample. While some firms exhibit high innovation capacity, the majority demonstrate relatively low innovation levels. The average value of green factory certification is 0.041, with a standard deviation of 0.198, suggesting that only about 4% of the firms in the sample have been certified as green factories.
In this paper, we calculated the Pearson correlation matrix between variables to examine the linear relationships among them. The outcomes of the Pearson correlation matrix shown in Table 3 indicate a notable positive correlation between green factory certification and corporate GTI. Overall, corporate GTI is positively correlated with firm value multiples, chairman size, the integration of ownership and control, the number of independent directors, Tobin’s Q, and firm age. It is negatively correlated with the debt-to-equity ratio. Furthermore, by observing the correlation coefficients, the absolute values of all correlations between variables are lower than 0.5, reducing concerns about multicollinearity distorting the estimated relationships. Consequently, the results are able to accurately reflect the effects of green factory certification and other factors on GTI.

4.2. Baseline Regression

Table 4 presents the results regarding the impact of green factory certification on firms’ GTI. The results for overall GTI, as shown in Columns (1) and (2), indicate that the coefficient for GP is significantly positive at the 1% level, with coefficients of 0.114 and 0.107, respectively. This suggests that firms certified as green factories experience a notable increase in GTI compared to non-certified firms. Specifically, these results imply that firms with green factory certification achieve, on average, a 10.7% higher level of GTI than their non-certified counterparts. This substantial positive effect highlights the critical role of green factory certification in strengthening firms’ capacity for GTI. Thus, Hypothesis 1 is supported.
Moreover, the results in Columns (3) to (6) show the results when the dependent variables are the quality (GTI_Inv) and quantity (GTI_Uti) of GTI separately. Specifically, the coefficients of GP for GTI_Inv are 0.096 and 0.101, while those for GTI_Uti are 0.068 and 0.061. These results suggest that green factory certification not only increases a higher volume of GTI, but also enhances its quality. Hypothesis H2 is supported. From an economic perspective, all the significance coefficients highlight the multifaceted role of green factory certification in driving GTI. The increase in GTI_Uti reflects growth in applied and practical innovations, while the rise in GTI_Inv signifies advancements in more fundamental and sophisticated technologies. This dual effect underscores the certification’s contribution to both incremental and transformative GTI, reinforcing its role as a catalyst for sustainable technological progress.

4.3. Parallel Trend Test

To examine the dynamic treatment effects of being selected as a green factory demonstration project over time, this study ran a parallel trend test. Figure 2 illustrates the results. The outcomes suggest that prior to the policy execution, the treatment and control groups exhibited an approximate tendency, without any significant variances. This indicates that the two groups had the characteristic of parallel trends prior to the policy intervention. After the policy implementation (at time point 0), the dynamic economic benefits of the treatment group increase significantly, with the estimated coefficients showing a gradual upward trend and achieving statistical significance at several time points.
This finding suggests that the implementation of green factory certification positively and increasingly enhances firms’ economic benefits. The observed upward trend indicates that firms not only experience immediate gains from certification, but also benefit from sustained improvements as its effects accumulate. This long-term value stems from the adoption of green technologies and practices, which enhance operational efficiency, reduce costs, and strengthen market competitiveness. Furthermore, the increasing benefits suggest that firms are progressively unlocking the full potential of their GTI, generating greater returns over time. These results underscore the economic significance of environmental certification—not merely as a short-term compliance measure but as a long-term strategic advantage that fosters continuous improvement and growth.

4.4. PSM-DID

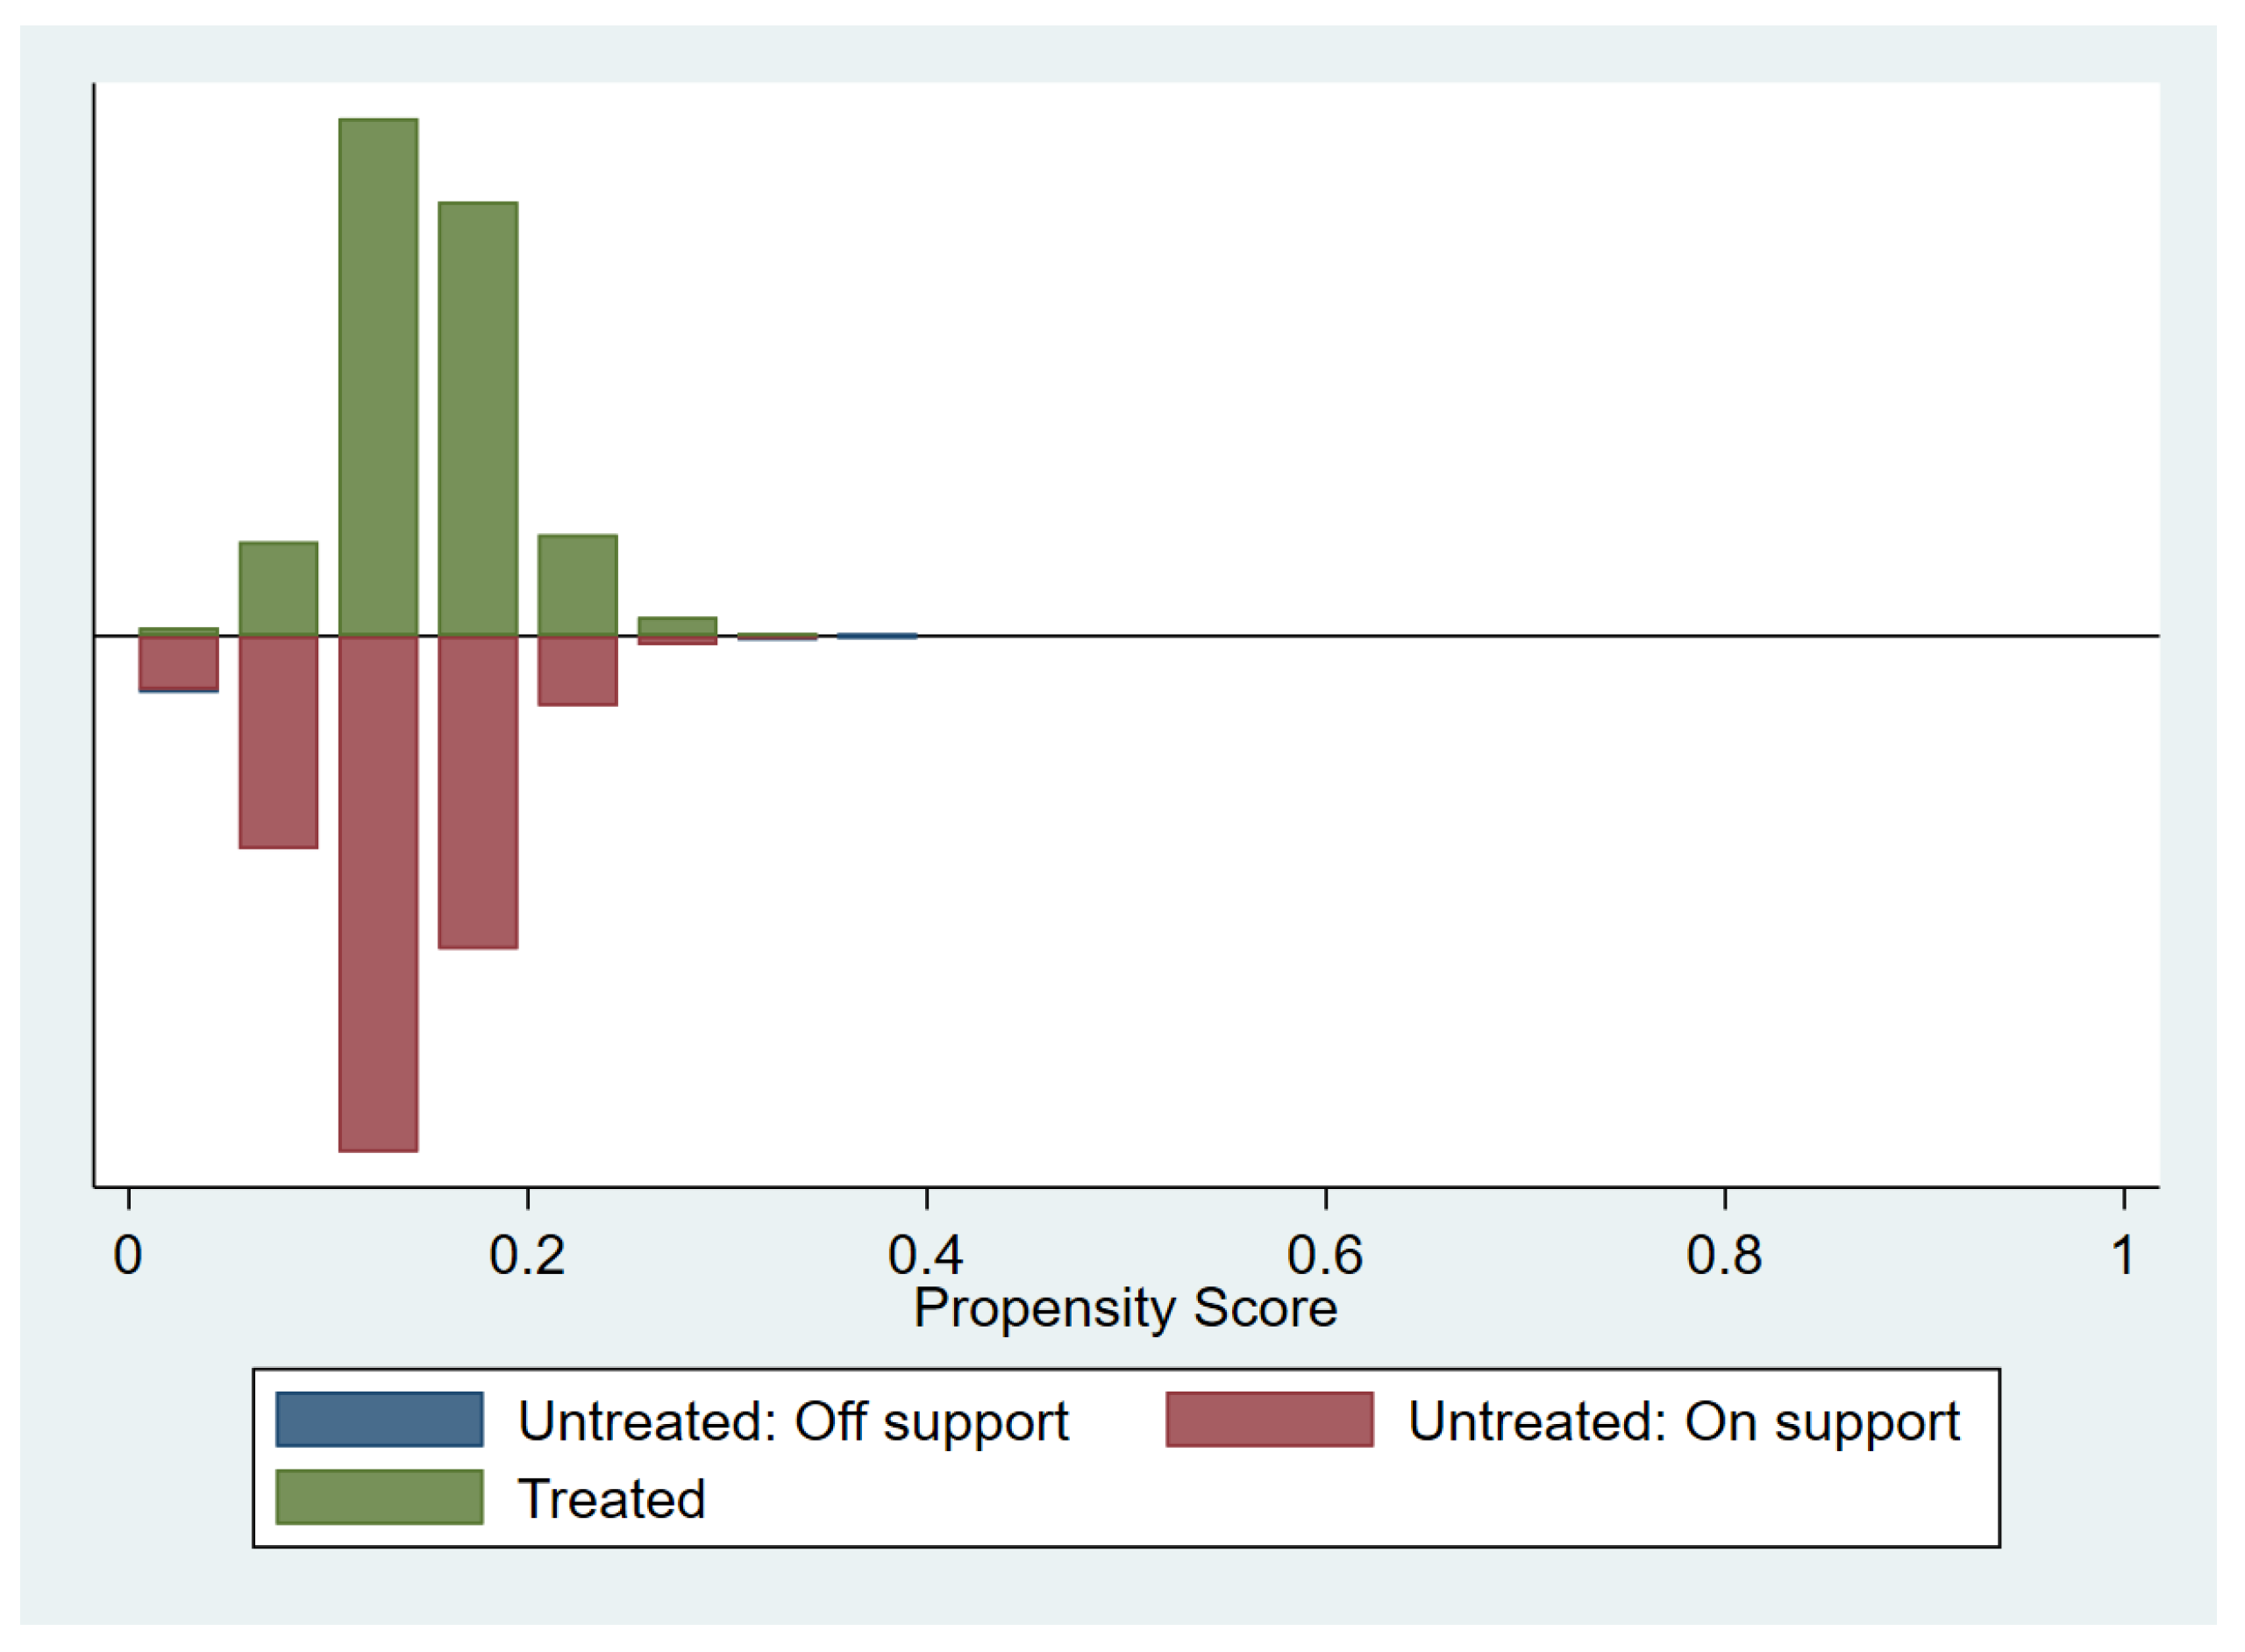
4.4.1. Common Support Domain Test

The propensity score matching (PSM) method must satisfy the common support domain assumption to ensure the comparability between the treatment and control groups. Figure 3 shows the outcomes of the common support domain test, with the green and red bars denoting the propensity score distribution of the treatment and control groups, respectively. The results indicate that within the common support domain (On support), the propensity scores of the two groups exhibit substantial overlap, suggesting good comparability between the two groups in the PSM process.

4.4.2. PSM-DID Balance Test

This study employs a 1:2 nearest-neighbor matching method for PSM, using the control variables mentioned in the previous sections. Table 5 displays the outcomes of the propensity score matching. Before matching, most covariates had largely standardized biases, especially the variables Size and Top1, with biases close to or exceeding 20%. After PSM, the standardized biases of all covariates are significantly reduced and are less than 10%, suggesting that the treatment and control groups have achieved a good balance on these key variables after matching.

4.4.3. PSM-DID Regression Test

After completing the PSM matching, this study further conducts baseline regression analysis using the matched sample. The outcomes in Table 6 show that, after PSM matching, the results for the influences of green factory certification on firms’ GTI, the quality of GTI, and the quantity of GTI remain significantly positive, thereby further confirming the above findings.

4.5. Robustness Tests

4.5.1. Placebo Test

To further ensure the robustness of the research findings and mitigate the underlying influence of unobservable factors on the conclusions, this study conducted 500 placebo tests, randomly assigning the influence of green factory certification on firms’ GTI, referencing Ferrara et al. [81]. This methodology serves as a critical validation step to confirm that the observed effects are not driven by unobserved factors.
The results are displayed in Figure 4. Assuming no policy intervention, the distribution of t-values approximates zero and adheres to a normal distribution. This conclusion suggests that the results of this study are robust and reliable. This pattern strongly suggests that the observed positive impact of green factory certification on firms’ GTI is not driven by random fluctuations or external factors unrelated to the policy intervention. These findings enhance the credibility of the study’s empirical results, reinforcing the argument that green factory certification is a legitimate and effective policy instrument for promoting firms’ GTI.

4.5.2. Alternative Measurements of the Dependent Variables

To further ensure the robustness of the above findings, this study replaces the measurements of GTI and re-run. In this section, referencing Kong et al. [82], GTI, the quality of GTI, and the quantity of GTI are measured by the ratio of green patent applications to total patent applications, the ratio of green invention patent applications to total, and the ratio of green utility model patent applications to total, respectively. This replacement examines the relative contribution rate of GTI rather than the absolute number of applications, ensuring consistency of model conclusions under different measurement methods. The outcomes in Columns (1) to (3) of Table 7 show that the coefficients for all the replaced dependent variables remain significant. Therefore, the previous conclusions remain unchanged.

4.5.3. Exclusion of Municipal Samples

Considering the unique economic status, policy environment, and resource allocation characteristics of municipal cities, these regions may exhibit different traits and tendencies in green factory certification and corporate GTI. To exclude the underlying influence of these economic and political centers on the research results, this section further refines the sample by excluding the four municipalities in China (Beijing, Shanghai, Tianjin, and Chongqing). The adjusted empirical outcomes are displayed in Column (4) of Table 7. The coefficient of green factory certification and its significance levels remain largely unchanged, suggesting that excluding municipal samples does not substantially affect the robustness of the above conclusions.

4.5.4. Alternative Econometric Models

This study revalidates the findings by adopting different econometric models. Specifically, GTI is redefined as a binary variable, which is equal to 1 if a firm implements GTI and 0 if it does not. Based on this redefinition, a Logit model is utilized to re-estimate the influence of green factory certification on GTI. The results in Column (5) of Table 7 show that, despite employing an alternative econometric model, the beneficial impact of green factory certification on firms’ GTI continues to be notable. This means that the above conclusions are robust.

4.5.5. Entropy Balancing Method

This study adopts the entropy balancing (EB) method for robustness testing, following the research of Cao et al. [83]. Specifically, the entropy balancing method is utilized to correct initial disparities in green factory certification between the treatment and control groups, thereby improving the accuracy and robustness of policy evaluation. The findings in Column (6) of Table 7 indicate that, after applying the entropy balancing method, the beneficial impact of green factory certification on GTI remains significant. This signifies that the conclusions have strong robustness.

4.5.6. Lagged Variable Test

Based on the interactive logic between green factory certification and GTI, there may be reverse causality issues, leading to endogeneity bias. Specifically, firms with initially elevated levels of GTI are more likely to receive green factory certification. Once certified, they gain additional resources, policy incentives, and reputational benefits that further enhance their GTI capabilities. To mitigate the influence of reverse causality, this study lags both the primary independent and control variables by one period and performs regression analysis. The results are displayed in Table 8 (with the “L” prefix indicating a one-period lag). Column (1) shows that green factory certification is significantly positively correlated with GTI. Columns (2) and (3) indicate that green factory certification is significantly positively correlated with the quality and quantity of GTI, respectively. These regression results suggest that, after accounting for reverse causality and endogeneity bias, the findings remain robust.

4.5.7. Instrumental Variable Estimations

This paper employs the instrumental variable (IV) approach to address potential endogeneity concerns. Specifically, following Wu et al. [84], we use air quality (AQ), published by the China Meteorological Administration, as an instrumental variable. The rationale for selecting air quality as an instrument is threefold. First, as a regional environmental indicator, air quality is closely linked to local environmental policies and corporate social responsibility awareness, both of which may influence firms’ GTI, particularly in the context of green factory certification. Second, while air quality may exert an indirect effect on firm-level GTI, its direct impact on other determinants of innovation is relatively weak, making it a suitable instrument for isolating the effect of environmental regulation. Third, air quality exhibits strong regional externalities, meaning it is largely independent of individual firms’ strategic decisions and is unlikely to be directly related to their GTI activities.
The results from the instrumental variable regressions are presented in Table 9. The first-stage regression indicates that the coefficient of AQ is statistically significant, demonstrating a strong correlation between AQ and GP, thereby confirming instrument relevance. Moreover, the weak instrument test results (K-P LM statistic: 12.197; K-P F statistic: 12.200) exceed the critical threshold of 10, ensuring that AQ is a sufficiently strong instrument. In the second stage, the coefficient of GP on GTI remains positive and highly significant, reinforcing the core conclusion that green factory certification plays a crucial role in promoting corporate GTI.

4.5.8. Inclusion of Multi-Dimensional Fixed Effects

To address potential regional policy differences and local government factors that may influence the green factory certification process, we extend the baseline regression model by incorporating both city and provincial fixed effects. The results, presented in Table 10, show that after controlling for city and provincial fixed effects, green factory certification continues to have a statistically significant impact on GTI across all three measures: GTI, the quality of GTI, and the quantity of GTI. Specifically, the coefficients for GP are 0.104, 0.100, and 0.061, respectively, all significant at the 1% level. These findings reaffirm that green factory certification remains a key driver of GTI, even when accounting for regional policy variations and local government influences. This approach strengthens the robustness of our findings by ensuring that the observed effects of green factory certification on GTI are not driven by unobserved regional characteristics.

5. Further Analysis

5.1. Mechanism Analysis

There are not only direct effects but also indirect effects between green factory certification and GTI. Through the prior theoretical analysis, this paper introduces digitalization level (Dig), ESG (ESG), and financing constraint (SA) as mechanism variables and empirically verifies the existence of their mechanism effects. The mediation model is formulated as follows, referencing Baron and Kenny [85]:
GTI it = a 0 + a 1 G P it + a 2 control it + μ i + δ t + ε i t
M it = b 0 + b 1 G P it + b 2 control it + μ i + δ t + ε i t
GTI it = c 0 + c 1 G P it + c 2 M i , t + c 3 control it + μ i + δ t + ε i t
where Model (4) denotes the influence of green factory certification on GTI; Model (5) denotes the influence of green factory certification on mechanism variables; and Model (6) examines whether the green factory certification influences GTI through these mechanism variables. Here, M it denotes the mechanism variables, and other variables align with Model (1).

5.1.1. Digitalization Level

Table 11 displays the results of mediating effects of digitalization level. In Column (2), the coefficient of GP is significant and positive at the 1% level, suggesting that green factory certification encourages firms to enhance their digitalization levels. Column (3) displays the results of whether the green factory certification influences GTI through promotion of digitalization levels, where the coefficients of Dig and GP are both significant and positive. Notably, the coefficient of GP decreases (the coefficient drops from 0.107 to 0.078). This suggests that firms certified as green factories are incentivized to accelerate digitalization efforts, and the extensive application of digital technologies further strengthens corporate GTI.

5.1.2. ESG Practices

Table 12 displays the results of mediating effects of ESG practices. In Column (2), the coefficient of GP is significant and positive at the 1% level, suggesting that green factory certification encourages enterprises to enhance their ESG practices. Column (3) displays the results of whether the green factory certification influences GTI through enhancement of ESG practices, where the coefficients of ESG and GP both are significantly positive. Meanwhile, the coefficient of GP decreases substantially (from 0.107 to 0.094). This result suggests that green factory certification promotes GTI by encouraging firms to strengthen their ESG practices.

5.1.3. Financing Constraints

Table 13 displays the results of mediating effects of ESG practices. In Column (2), the coefficient of GP is significant and negative at the 1% level, suggesting that firms obtaining green factory certification can reduce their financing constraints. Column (3) displays the results of whether the green factory certification influences GTI through enhancement of financing constraints, where the coefficient of SA is significantly negative, while the coefficient of GP remains significantly positive. Meanwhile, the coefficient of GP decreases (from 0.107 to 0.096). This finding suggests that green factory certification can foster firms’ GTI by alleviating their financing constraints.

5.2. Heterogeneity Analysis

5.2.1. Industry Heterogeneity

According to the “Guidelines for Environmental Information Disclosure of Listed Companies” issued in 2012, this study divides sample firms into two categories of industries: heavy-polluting and light-polluting. Heavy-polluting industries include 16 sectors identified by industry codes B06-B09, C17, C19, C22, C25-C28, C30-C33, and D44, while other industries are classified as light-polluting industries. The results are displayed in Table 14. The outcomes show that the coefficient of GP for firms in heavy-polluting industries is −0.002 and insignificant, while the coefficient of GP for firms in light-polluting industries is positive and significant. Green factory certification on GTI exerts a more pronounced effect on firms in light-polluting industries.
The significant disparity can be attributed to industry characteristics, firms’ innovation needs, and their varying adaptability to green policies. Firms in light-polluting industries are generally more agile in adopting green transformations, leveraging policy tools such as green factory certification to accelerate their GTI. In contrast, firms in heavy-polluting industries typically face more stringent environmental regulations and higher societal pressures, requiring more complex structural adjustments and substantial technological overhauls, which constrain the innovation-driving effects of green factory certification. Consequently, their lower adaptability to green policies results in a weaker innovation incentive from certification.

5.2.2. Firm Heterogeneity

To investigate the differential influences of green factory certification on corporate GTI across different ownership structures, this study divides the sample into SOEs and non-SOEs based on their ownership type. The results are displayed in Table 15. Column (1) presents the results of the influence of green factory certification on GTI in SOEs, where the coefficient is 0.040 and insignificant. This suggests that green factory certification has a limited incentive effect on GTI in SOEs. Column (2) presents the results of influence of green factory certification on GTI in non-SOEs, with a coefficient of 0.140, which is significant. The results suggest that green factory certification significantly promotes GTI in non-SOEs.
The differing effects of green factory certification between SOEs and non-SOEs can be attributed to variations in resource allocation, policy support, and management structure. SOEs typically benefit from substantial policy support and resource advantages, with their innovation activities primarily shaped by regulatory compliance and government mandates. As a result, they are less reliant on green factory certification as a mechanism for driving GTI. In contrast, non-SOEs depend more on both market dynamics and government incentives to stimulate innovation. For these firms, green factory certification serves as a dual incentive—both as a policy-driven requirement and a competitive market signal—promoting greater engagement in GTI and strengthening their market positioning. Without the same level of state-backed resources as SOEs, non-SOEs are more likely to perceive green factory certification as a strategic tool for improving sustainability, attracting investment, and differentiating themselves within the industry.

5.2.3. Regional Heterogeneity

To explore the differential impacts of green factory certification on corporate GTI across regions, the sample is categorized into three geographic regions—eastern, central, and western—according to their locations. The results are displayed in Table 16. Column (1) presents the results for firms in the eastern region, with the coefficient of GP being 0.087 and significant. Column (2) presents the results for firms in the central region, where the coefficient of GP is 0.168, which is also significant. Column (3) presents the regression results for firms in the western region, where the coefficient of GP is 0.105 but insignificant. These outcomes suggest that the green factory certification’s driving role in GTI is stronger for firms in the eastern and central regions.
These disparities may be attributed to differences in economic development levels, market conditions, technological resources, and policy environments. Firms in the eastern and central areas benefit from higher levels of economic development, more advanced technological infrastructure, and stronger policy support, which enable them to implement green factory strategies more effectively and enhance their GTI skills. In contrast, firms in the western region are deficient in economic development and technological resources, hindering their ability to adopt the green factory strategy. As a result, the policy’s impact on GTI is less pronounced in the western region, highlighting the need for targeted support to bridge regional disparities in green technological development.

6. Discussion and Conclusions

6.1. Conclusions

Adopting a multi-timepoint DID approach and mediation model, this paper systematically researches the influence of the green factory certification on firms’ GTI, by manually compiling the latest data on seven batches of green factory certification for A-share-listed companies in China from 2008 to 2022. The principal findings are as follows:
(1)
After receiving green factory certification, there is a significant improvement in firms’ GTI capabilities, achieving dual breakthroughs in both the quantity and quality of GTI. The existing research suggests that voluntary environmental regulations create environmental incentive effects and promote GTI [11,36]. This study not only reinforces these findings, but also broadens the research perspective. Unlike previous studies that primarily examined non-governmental environmental certification tools, this study focuses on government-led green factory certification, a voluntary environmental regulation policy uniquely localized in China. These findings further confirm the effectiveness of voluntary environmental regulation within China’s institutional framework.
(2)
Under the process of fostering corporate GTI, green factory certification exerts both direct and indirect effects. Beyond its immediate influence, it enhances GTI by improving firms’ digitalization levels, strengthening ESG practices, and alleviating financing constraints. These findings align with prior research emphasizing the critical role of digitalization, ESG performance, and financial accessibility in enhancing firms’ capacity and motivation for GTI [57,69,74].
(3)
Heterogeneity analysis exposes that green factory certification’s driving role in GTI demonstrates significant heterogeneity. Firms with better geographic locations, non-SOE firms, and those in light-polluting industries experience a more significant enhancement in GTI driven by green factory certification.

6.2. Theoretical Implications

The main theoretical implications of this paper are as follows: Firstly, this paper broadens the research scope of voluntary environmental regulations from the perspective of green factory certification. The existing research about voluntary environmental regulations primarily focuses on the environmental incentive effects of non-governmental certification tools such as ISO 14001 [34,35]. In contrast, green factory certification is government-led and has a dual role as both a constraint and incentive. By providing empirical evidence on the effectiveness of this voluntary environmental regulation policy within the Chinese context, this study enriches the literature on environmental regulation policies.
Secondly, this paper enriches the research on the effectiveness of green factory certification from the perspective of GTI. While the literature on green factory certification is growing, existing studies have primarily focused on its economic effects, such as trade credit [39] and labor income [19]. In contrast, from an innovation insight, this paper investigates how green factory certification drives firms’ GTI, with a particular focus on both quantity and quality, thereby expanding the research boundaries of green factory certification.
Thirdly, this paper enriches the literature on the driving factors of GTI. Previous studies have predominantly centered on the influences of external command-and-control and market-based environmental regulations [86,87,88], government subsidies [54,89], and internal firm characteristics [90,91], among other factors. However, in-depth research on voluntary environmental regulation remains limited. This paper addresses this gap by examining the relationship between green factory certification and firms’ GTI, thereby expanding the research scope of environmental regulatory factors in the field of GTI.
Finally, this paper uncovers the potential mechanisms through which green factory certification promotes firms’ GTI, focusing on three key dimensions—digital transformation, ESG practices, and financing constraints. By exploring these pathways, this paper further refines the existing theoretical framework on how green certification fosters corporate GTI.

6.3. Policy and Managerial Implications

Based on the above findings, this paper proposes the following policy recommendations to enhance the level of GTI in enterprises and move towards sustainable development goals.
Firstly, leveraging the promotion of green factory certification strengthens the synergistic effects between voluntary environmental regulations and other environmental policies. The findings suggest that green factory certification significantly boosts GTI in enterprises. Therefore, the government should enhance the green manufacturing system, promote the growth of green factories, and pursue the dual goals of pollution reduction, carbon emission cuts, and green growth. On the one hand, systematically compiling successful cases of green factory development, promoting demonstration models nationwide, and fully utilizing their role as benchmarks to inspire other enterprises. On the other hand, continuously expanding the reach of green factory certification, optimizing certification standards, and supporting enterprises with green development potential by offering targeted policy guidance to help them meet these standards.
Secondly, optimizing the incentive mechanisms and market environment for green factory certification would further unlock its potential in promoting GTI. The research indicates that green factory certification enhances GTI by driving digital transformation, encouraging ESG practices, and alleviating financing constraints. Therefore, the government should increase fiscal and tax incentives to reduce the cost of environmental responsibility for enterprises and optimize the financing environment to alleviate constraints on GTI funding. Meanwhile, the government should accelerate the construction of digital infrastructure, promote the growth of the digital economy, and provide robust support for GTI in enterprises.
Thirdly, in the implementation and supervision of green factory certification policies, the heterogeneity characteristics of enterprises should be fully considered and targeted policies should be formulated. The findings have shown that there are different incentive effects of green factory certification of GTI in terms of industry attributes, property rights, and regional dimensions. Therefore, future policy design should be more precise. For example, for non-state-owned enterprises, and enterprises in the eastern region, the government should encourage them to actively participate in green factory certification and provide stronger financial support and market incentives to promote green development.
Fourthly, enterprises should enhance their awareness of GTI by integrating environmental and social responsibilities into their core development strategies. In particular, enterprises should improve transparency in environmental practices and enhance stakeholder engagement to reinforce ESG management frameworks. Additionally, firms may leverage digital tools such as AI and IoT to establish an efficient environmental management system and improve GTI.

6.4. Limitations and Future Research

This study highlights a positive relationship between green factory certification and GTI but has several limitations. First, the study primarily focuses on Chinese A-share listed firms, which may limit the generalizability of the findings to other economies with different regulatory environments and industrial structures. Second, as the study is based on China’s green factory certification policy, its applicability in diverse political and economic contexts remains uncertain. Third, this article mainly explores digital transformation, ESG practices, and financial constraints as intermediary mechanisms, but these mechanisms only show partial intermediary effects, and other potential impact paths still need to be further explored.
Future research can further expand in several directions. First, the sample scope can be broadened to include non-listed companies, allowing for a more comprehensive evaluation of the impact of green factory certification on firms’ GTI. Second, future studies could link green factory certification with other policies to further explore how variations in political systems influence the relationship between voluntary environmental regulation and GTI, thereby enhancing the international applicability of the findings. Third, future studies can investigate additional transmission mechanisms and boundary effects, or incorporate game theory approaches [92] to uncover the micro-level mechanisms through which voluntary environmental regulations drive firms’ GTI. Finally, long-term tracking data can be utilized to examine the sustained impact of green factory certification on firms’ GTI capabilities, as well as its long-term role in promoting sustainable development.

Author Contributions

Conceptualization, Y.C. and M.C.; Methodology, Y.C. and W.L.; Software, Y.C.; Validation, W.L.; Formal analysis, Y.C. and M.C.; Investigation, Y.C. and W.L.; Resources, Y.C.; Data curation, W.L. and L.Z.; Writing—original draft, Y.C.; Writing—review & editing, M.C.; Visualization, L.Z.; Supervision, M.C. All authors have read and agreed to the published version of the manuscript.

Funding

This work was supported by the Social Science Achievement Evaluation Committee of Hunan Province, China, grant number XSP25ZDI003.

Institutional Review Board Statement

Not applicable.

Informed Consent Statement

Not applicable.

Data Availability Statement

Data are contained within the article.

Conflicts of Interest

The authors declare no conflicts of interest.

References

  1. Acemoglu, D.; Aghion, P.; Bursztyn, L.; Hemous, D. The environment and directed technical change. Am. Econ. Rev. 2012, 102, 131–166. [Google Scholar] [CrossRef]
  2. Tang, K.; Wang, Y.Y.; Wang, H.J. The impact of innovation capability on green development in China’s urban agglomerations. Technol. Forecast. Soc. Chang. 2024, 200, 123128. [Google Scholar] [CrossRef]
  3. Xie, X.; Huo, J.; Zou, H. Green process innovation, green product innovation, and corporate financial performance: A content analysis method. J. Bus. Res. 2019, 101, 697–706. [Google Scholar] [CrossRef]
  4. López-Gamero, M.D.; Molina-Azorín, J.F.; Claver-Cortés, E. The potential of environmental regulation to change managerial perception, environmental management, competitiveness and financial performance. J. Clean. Prod. 2010, 18, 963–974. [Google Scholar] [CrossRef]
  5. Cainelli, G.; De Marchi, V.; Grandinetti, R. Does the development of environmental innovation require different resources? Evidence from Spanish manufacturing firms. J. Clean. Prod. 2015, 94, 211–220. [Google Scholar] [CrossRef]
  6. Zhang, F.; Zhu, L. Enhancing corporate sustainable development: Stakeholder pressures, organizational learning, and green innovation. Bus. Strateg. Environ. 2019, 28, 1012–1026. [Google Scholar] [CrossRef]
  7. Lin, B.; Chen, X. Environmental regulation and energy-environmental performance—Empirical evidence from China’s non-ferrous metals industry. J. Environ. Manag. 2020, 269, 110722. [Google Scholar] [CrossRef]
  8. Sun, D.; Zeng, S.; Chen, H.; Meng, X.; Jin, Z. Monitoring effect of transparency: How does government environmental disclosure facilitate corporate environmentalism? Bus. Strateg. Environ. 2019, 28, 1594–1607. [Google Scholar] [CrossRef]
  9. Carrión-Flores, C.E.; Innes, R.; Sam, A.G. Do voluntary pollution reduction programs (VPRs) spur or deter environmental innovation? Evidence from 33/50. J. Environ. Econ. Manag. 2013, 66, 444–459. [Google Scholar] [CrossRef]
  10. Lin, B.; Huang, C. Analysis of emission reduction effects of carbon trading: Market mechanism or government intervention? Sustain. Prod. Consump. 2022, 33, 28–37. [Google Scholar] [CrossRef]
  11. Ma, H.; Dong, Y.; Zhou, M.; Fang, N. Impact of voluntary environmental regulation on green innovation from the perspective of enterprise life cycle: Evidence from China. Environ. Res. Commun. 2024, 6, 095012. [Google Scholar] [CrossRef]
  12. Sun, H.; Liu, C.; Guo, J. Environmental incentive effect and spillover effect of the government′s green certification system on manufacturing enterprises. China Popul. Resour. Environ. 2024, 34, 76–87. [Google Scholar]
  13. Wang, W.; Zhang, Q.; Hao, J. How Does Green Factory Certification Affect Corporate Sustainability Performance: Evidence from China. Sustainability 2025, 17, 61. [Google Scholar] [CrossRef]
  14. Arocena, P.; Orcos, R.; Zouaghi, F. The impact of ISO 14001 on firm environmental and economic performance: The moderating role of size and environmental awareness. Bus. Strategy Environ. 2021, 30, 955–967. [Google Scholar] [CrossRef]
  15. Heras-Saizarbitoria, I.; Boiral, O.; Díaz de Junguitu, A. Environmental management certification and environmental performance: Greening or greenwashing? Bus. Strategy Environ. 2020, 29, 2829–2841. [Google Scholar] [CrossRef]
  16. Qiu, Y.; Kahn, M.E. Impact of voluntary green certification on building energy performance. Energy Econ. 2019, 80, 461–475. [Google Scholar] [CrossRef]
  17. Chen, Y.; Singhal, V.; Zhu, Q. Environmental policies and financial performance: Stock market reaction to firms for their proactive environmental practices recognized by governmental programs. Bus. Strategy Environ. 2021, 30, 1548–1562. [Google Scholar] [CrossRef]
  18. GB/T 36132-2018; General Principles for Assessment of Green Factory. Standardization Administration of China: Beijing, China, 2018.
  19. Wei, X.; Jiang, F.; Su, Y. More green, less labor gains? Green factory and labor income share in China. Energy Econ. 2024, 133, 107481. [Google Scholar] [CrossRef]
  20. Zou, X.; Min, J.; Meng, S. The green development effect of science and technology financial policy in China. Front. Environ. Sci. 2024, 12, 1463679. [Google Scholar] [CrossRef]
  21. Liao, Y.; Zhou, X. Real green or fake green? Impact of green credit policy on corporate ESG performance. Humanit. Soc. Sci. Commun. 2024, 11, 1097. [Google Scholar] [CrossRef]
  22. Cai, W.; Ye, P. Local-neighborhood effects of different environmental regulations on green innovation: Evidence from prefecture level cities of China. Environ. Dev. Sustain. 2022, 24, 4810–4834. [Google Scholar] [CrossRef]
  23. Li, S.; Chen, L.; Xu, P. Quantity or quality? The impact of financial geo-density on firms’ green innovation. Environ. Sci. Pollut. Res. 2023, 30, 54073–54094. [Google Scholar] [CrossRef]
  24. Huang, M.; Li, M.; Liao, Z. Do politically connected CEOs promote Chinese listed industrial firms’ green innovation? The mediating role of external governance environments. J. Clean. Prod. 2021, 278, 123634. [Google Scholar] [CrossRef]
  25. Yin, H.; Zhang, L.; Cai, C.; Zhang, Z.; Zhu, Q. Fiscal & tax incentives, ESG responsibility fulfillments, and corporate green innovation performance. Int. Rev. Econ. Financ. 2025, 98, 103838. [Google Scholar]
  26. Qi, G.; Zeng, S.; Tam, C.; Yin, H.; Zou, H. Stakeholders’ Influences on Corporate Green Innovation Strategy: A Case Study of Manufacturing Firms in China. Corp. Soc. Responsib. Environ. Manag. 2013, 20, 1–14. [Google Scholar] [CrossRef]
  27. Adnan, M.; Zhu, N.; Abdullah; Bilal, M. The nexus between female CEOs, government subsidies and green innovation: Probing board diversity dynamics. Total Qual. Manag. Bus. Excell. 2025. [Google Scholar] [CrossRef]
  28. Wang, H.; Yang, J.; Zhu, N. Does Tax Incentives Matter to Enterprises’ Green Technology Innovation? The Mediating Role on R&D Investment. Sustainability 2024, 16, 5902. [Google Scholar] [CrossRef]
  29. Zhang, J.; Kang, L.; Li, H.; Ballesteros-Pérez, P.; Skitmore, M.; Zuo, J. The impact of environmental regulations on urban Green innovation efficiency: The case of Xi’an. Sustain. Cities Soc. 2020, 57, 102123. [Google Scholar] [CrossRef]
  30. Bu, M.; Qiao, Z.; Liu, B. Voluntary environmental regulation and firm innovation in China. Econ. Model. 2020, 89, 10–18. [Google Scholar] [CrossRef]
  31. Johnstone, L.; Hallberg, P. ISO 14001 adoption and environmental performance in small to medium sized enterprises. J. Environ. Manag. 2020, 266, 110592. [Google Scholar] [CrossRef]
  32. Li, R.; Ramanathan, R. Exploring the relationships between different types of environmental regulations and environmental performance: Evidence from China. J. Clean. Prod. 2018, 196, 1329–1340. [Google Scholar] [CrossRef]
  33. Yang, X.; Yao, Y. Environmental compliance and firm performance: Evidence from China. Oxf. Bull. Econ. Stat. 2012, 74, 397–424. [Google Scholar] [CrossRef]
  34. Lim, S.; Prakash, A. Voluntary regulations and innovation: The case of ISO 14001. Public Adm. Rev. 2014, 74, 233–244. [Google Scholar] [CrossRef]
  35. Hu, S.; Wang, M.; Wu, M.; Wang, A. Voluntary environmental regulations, greenwashing and green innovation: Empirical study of China’s ISO14001 certification. Environ. Impact Assess. Rev. 2023, 102, 107224. [Google Scholar] [CrossRef]
  36. Li, D.; Tang, F.; Jiang, J. Does environmental management system foster corporate green innovation? The moderating effect of environmental regulation. Technol. Anal. Strateg. Manag. 2019, 31, 1242–1256. [Google Scholar] [CrossRef]
  37. ISO 14001; Environmental Management Systems—Requirements with Guidance for Use. International Organization for Standardization (ISO): Geneva, Switzerland, 2015.
  38. Ren, S.; Li, X.; Yuan, B.; Li, D.; Chen, X. The effects of three types of environmental regulation on eco-efficiency: A cross-region analysis in China. J. Clean. Prod. 2018, 173, 245–255. [Google Scholar] [CrossRef]
  39. Li, P.; Yao, S.; Fan, L.; Yin, S.; Du, H. Government certified environmental labels and trade credit: Evidence from green factories. Econ. Lett. 2024, 244, 112008. [Google Scholar] [CrossRef]
  40. Wang, M.; Ye, T.; Kong, D. Green Manufacturing and Corporate Environmental Information Disclosure:Evidence from the Policy Experiment of “Creation of Green Factories” in China. Econ. Res. J. 2024, 59, 116–134. [Google Scholar]
  41. Li, Z.; Shao, Q.; Song, J. The efforts of manufacturing enterprises toward sustainable development under voluntary environmental policy: The roles of external pressure, attraction, and internal attributes. Corp. Soc. Responsib. Environ. Manag. 2023, 30, 2315–2329. [Google Scholar] [CrossRef]
  42. Jiang, Z.; Wang, Z.; Zeng, Y. Can voluntary environmental regulation promote corporate technological innovation? Bus Strateg Environ 2020, 29, 390–406. [Google Scholar] [CrossRef]
  43. Ni, H.; Liu, W.; Yang, Z. Training investment, human capital upgrading and firm innovation: The role of government training subsidies. Kybernetes 2024, 53, 2934–2966. [Google Scholar] [CrossRef]
  44. Ahmad, M.F.; Ismail, S.N.; Hassan, M.F.; Chan, S.W.; Abdul Hamid, N.; Ahmad, A.N.A.; Mohd Nawi, M.N.; Abdul Rahman, N.A. A study of green factory practices in Malaysia manufacturing industry. Int. J. Supply Chain Manag. 2019, 8, 772–776. [Google Scholar]
  45. Yang, M.; Li, H.; Li, J. The Theory and Practice of Evaluating Green Factories in China. S. Asian J. Soc. Stud. Econ. 2021, 10, 24–33. [Google Scholar] [CrossRef]
  46. Wei, X.; Jiang, F.; Chen, Y. The value of “green label”: Green factory and corporate ESG performance. Appl. Econ. Lett. 2024. [Google Scholar] [CrossRef]
  47. Awan, A.; Hussain, K.; Zafar, M.; Butt, M.J.; Yaghmour, S. Impact of nations’ green behavior on green growth by considering the moderating role of environmental policy stringency. Manag. Environ. Qual. Int. J. 2024, 36, 309–328. [Google Scholar] [CrossRef]
  48. Wang, Z.; Chen, J.; Xue, X. Assessing the efficacy of green credit policy in fostering green innovation in heavily polluting industries. Clean Technol. Environ. Policy 2024, 27, 309–325. [Google Scholar] [CrossRef]
  49. Su, Y.; Lee, C.C. Green finance, environmental quality and technological innovation in China. Int. J. Financ. Econ. 2023, 30, 405–425. [Google Scholar] [CrossRef]
  50. Vargas-Hernández, J.G.; Vargas-González, O.C. Organizational Innovation Approach to Green Technological Innovation. In Intellectual Capital as a Precursor to Sustainable Corporate Social Responsibility; IGI Global: Hershey, PA, USA, 2023; pp. 181–199. [Google Scholar]
  51. Bi, S.; Kang, C.; Bai, T.; Yi, X. The effect of green fiscal policy on green technological innovation: Evidence from energy saving and emission reduction fiscal policy. Environ. Sci. Pollut. Res. 2024, 31, 10483–10500. [Google Scholar] [CrossRef]
  52. Al Koliby, I.S.; Al-Hakimi, M.A.; Zaid, M.A.K.; Khan, M.F.; Hasan, M.B.; Alshadadi, M.A. Green entrepreneurial orientation and technological green innovation: Does resources orchestration capability matter? Bottom Line 2024, 37, 45–70. [Google Scholar] [CrossRef]
  53. Upadhayay, N.B.; Rocchetta, S.; Gupta, S.; Kamble, S.; Stekelorum, R. Blazing the trail: The role of digital and green servitization on technological innovation. Technovation 2024, 130, 102922. [Google Scholar] [CrossRef]
  54. Bai, Y.; Song, S.; Jiao, J.; Yang, R. The impacts of government R&D subsidies on green innovation: Evidence from Chinese energy-intensive firms. J. Clean. Prod. 2019, 233, 819–829. [Google Scholar] [CrossRef]
  55. Ma, D.; Zhu, Q. Innovation in emerging economies: Research on the digital economy driving high-quality green development. J. Bus. Res. 2022, 145, 801–813. [Google Scholar] [CrossRef]
  56. Teece, D. Profiting from innovation in the digital economy: Enabling technologies, standards, and licensing models in the wireless world. Res. Policy 2018, 47, 1367–1387. [Google Scholar] [CrossRef]
  57. Lai, A.; Li, Z.; Hu, X.; Wang, Q. Does digital economy improve city-level eco-efficiency in China? Econ. Anal. Policy 2024, 81, 1198–1213. [Google Scholar] [CrossRef]
  58. Goldfarb, A.; Tucker, C. Digital economics. J. Econ. Lit. 2019, 57, 3–43. [Google Scholar] [CrossRef]
  59. Liu, W.; Wang, Z.; Shi, Q.; Bao, S. Impact of the digital transformation of Chinese new energy vehicle enterprises on innovation performance. Humanit. Soc. Sci. Commun. 2024, 11, 1–11. [Google Scholar] [CrossRef]
  60. Hamari, J.; Sjöklint, M.; Ukkonen, A. The sharing economy: Why people participate in collaborative consumption. J. Assoc. Inf. Sci. Technol. 2016, 67, 2047–2059. [Google Scholar] [CrossRef]
  61. Gao, H.; Wang, H.; Wen, H. Corporate ESG Performance Guided by Environmental Rule of Law: Evidence from the Establishment of Intermediate Environmental Courts in China. J. Financ. Econ. 2025, 50, 77–92. [Google Scholar] [CrossRef]
  62. Zhou, C.; Wang, H.; Shu, Y. The Spillover Effects of Green Industry Policies from the Perspective of Common Shareholders——A Quasi Natural Experiment Based on Green Factory Evaluation. Financ. Res. 2024, 78–92. [Google Scholar] [CrossRef]
  63. Zhou, Y.; Huo, W.; Bo, L.; Chen, X. Impact and mechanism analysis of ESG ratings on the efficiency of green technology innovation. Financ. Res. Lett. 2023, 58, 104591. [Google Scholar] [CrossRef]
  64. Zhou, J.; Lei, X.; Yu, J. ESG rating divergence and corporate green innovation. Bus Strateg Environ 2024, 33, 2911–2930. [Google Scholar] [CrossRef]
  65. Wang, M.; Li, Y.; Wang, Z. A nonlinear relationship between corporate environmental performance and economic performance of green technology innovation: Moderating effect of government market-based regulations. Bus. Strateg. Environ. 2023, 32, 3119–3138. [Google Scholar] [CrossRef]
  66. Abdullah; Zhu, N.; Hashmi, M.A.; Shah, M.H. CEO power, board features and ESG performance: An extensive novel moderation analysis. Corp. Soc. Responsib. Environ. Manag. 2024, 31, 5627–5655. [Google Scholar] [CrossRef]
  67. Laguir, I.; Stekelorum, R.; El Baz, J. Proactive environmental strategy and performances of third party logistics providers (TPLs): Investigating the role of eco-control systems. Int. J. Prod. Econ. 2021, 240, 108249. [Google Scholar] [CrossRef]
  68. Cheng, B.; Ioannou, I.; Serafeim, G. Corporate social responsibility and access to finance. Strateg. Manag. J. 2014, 35, 1–23. [Google Scholar] [CrossRef]
  69. Zhang, D.; Rong, Z.; Ji, Q. Green innovation and firm performance: Evidence from listed companies in China. Resour. Conserv. Recycl. 2019, 144, 48–55. [Google Scholar] [CrossRef]
  70. Liu, H.-j.; Hu, H.-g. “From Point to Area” Effect of Government Environmental Governance: A Non-Binding Perspective on Voluntary Environmental Regulation. China Ind. Econ. 2024, 80–98. [Google Scholar] [CrossRef]
  71. Flammer, C. Corporate green bonds. J. Financ. Econ. 2021, 142, 499–516. [Google Scholar] [CrossRef]
  72. Ghoul, S.E.; Guedhami, O.; Kim, Y. Country-level institutions, firm value, and the role of corporate social responsibility initiatives. J. Int. Bus. Stud. 2017, 48, 360–385. [Google Scholar] [CrossRef]
  73. Adams, R.; Jeanrenaud, S.; Bessant, J.; Denyer, D.; Overy, P. Sustainability-oriented Innovation: A Systematic Review. Int. J. Manag. Rev. 2016, 18, 180–205. [Google Scholar] [CrossRef]
  74. Chen, F.; Zeng, X.; Guo, X. Green finance, climate change, and green innovation: Evidence from China. Financ. Res. Lett. 2024, 63, 105283. [Google Scholar] [CrossRef]
  75. Beck, T.; Levine, R.; Levkov, A. Big bad banks? The winners and losers from bank deregulation in the United States. J. Financ. 2010, 65, 1637–1667. [Google Scholar] [CrossRef]
  76. Lv, D.; Liu, X.; Cao, G. The impact of enterprise digital transformation on green technology innovation in manufacturing: A factor flow perspective. Singap. Econ. Rev. 2024, 1–36. [Google Scholar] [CrossRef]
  77. Liao, X.; Zhang, Y.; Wang, X.; Yuan, R. Digitalization Level and Green-Oriented Transition Development of Highly Energy-Intensive Enterprises Based on Carbon Reduction Perspective. Sustainability 2023, 15, 15549. [Google Scholar] [CrossRef]
  78. Feng, H.; Zhang, Z.; Wang, Q.; Yang, L. Does a Company’s Position within the Interlocking Director Network Influence Its ESG Performance?—Empirical Evidence from Chinese Listed Companies. Sustainability 2024, 16, 4190. [Google Scholar] [CrossRef]
  79. Gao, Y.; Yang, H.; Sun, X.; Tian, X.; Xu, J. Corporate Digital Transformation and Financing Constraints: The Moderating Effect of Institutional Investors. Heliyon 2024, 10, e33199. [Google Scholar] [CrossRef]
  80. Ai, M.; Luo, F.; Bu, Y. Green innovation and corporate financial performance: Insights from operating risks. J. Clean. Prod. 2024, 456, 142353. [Google Scholar] [CrossRef]
  81. Ferrara, E.L.; Chong, A.; Duryea, S. Soap operas and fertility: Evidence from Brazil. Am. Econ. J. Appl. Econ. 2012, 4, 1–31. [Google Scholar] [CrossRef]
  82. Kong, H.; Sun, L.; Zhang, W. Digitization and Green Technology Innovation of Chinese Firms Under Government Subsidy Policies. Systems 2024, 12, 447. [Google Scholar] [CrossRef]
  83. Cao, S.; Fang, Z.; Pu, W.; Ruan, Y.-Y. Vertical interlock and firm value: The role of corporate innovation. Emerg. Mark. Financ. Trade 2022, 58, 1061–1077. [Google Scholar] [CrossRef]
  84. Wu, K.; Kong, D.; Yang, W. Does Environmental, Social, and Governance Rating Affect Firms’ Real Earnings Management—Evidence from China. Financ. Res. Lett. 2024, 67, 105764. [Google Scholar] [CrossRef]
  85. Baron, R.M.; Kenny, D.A. The moderator–mediator variable distinction in social psychological research: Conceptual, strategic, and statistical considerations. J. Personal. Soc. Psychol. 1986, 51, 1173. [Google Scholar] [CrossRef] [PubMed]
  86. Xu, P.; Ye, P.; Zhao, F.; Jahanger, A. Technology spillover and market competitiveness in green credit induced corporate green innovation: An evolutionary game theory and empirical study. Technol. Forecast. Soc. Chang. 2024, 207, 123622. [Google Scholar] [CrossRef]
  87. Zhang, Q.; Wang, Y.; Chen, Q. Green Bond Issuance and the Spillover Effect of Green Technology Innovation from the Perspective of Market Attention: Evidence from China. Systems 2024, 12, 399. [Google Scholar] [CrossRef]
  88. Zhang, Y.-J.; Wang, W. How does China’s carbon emissions trading (CET) policy affect the investment of CET-covered enterprises? Energy Econ. 2021, 98, 105224. [Google Scholar] [CrossRef]
  89. Huang, Z.; Liao, G.; Li, Z. Loaning scale and government subsidy for promoting green innovation. Technol. Forecast. Soc. Change 2019, 144, 148–156. [Google Scholar] [CrossRef]
  90. Du, L.; Zhang, Z.; Feng, T. Linking green customer and supplier integration with green innovation performance: The role of internal integration. Bus. Strategy Environ. 2018, 27, 1583–1595. [Google Scholar] [CrossRef]
  91. Xu, N.; Zhang, D.; Li, Y.; Bai, Y. Research on the heterogeneity of executives’ nonsalary incentives on corporate green technology innovation. Chin. Manag. Stud. 2024, 18, 1583–1609. [Google Scholar] [CrossRef]
  92. Su, C.; Deng, J.; Li, X.; Huang, W.; Ma, j.; Wang, C.; Wang, X. Investment in enhancing resilience safety of chemical parks under blockchain technology: From the perspective of dynamic reward and punishment mechanisms. J. Loss Prev. Process Ind. 2025, 94, 105523. [Google Scholar] [CrossRef]
Figure 1. Systematic theoretical framework.
Sustainability 17 02498 g001
Figure 2. Results of parallel trend test.
Sustainability 17 02498 g002
Figure 3. Results of common support domain test.
Sustainability 17 02498 g003
Figure 4. Placebo test results.
Sustainability 17 02498 g004
Table 1. Variable definitions.
Variable TypeVariablesCodeMeasurement
Dependent VariablesGreen Technological Innovation (GTI)GTINatural logarithm of 1 plus the number of green invention patents and green utility model patent applications.
Quality of GTIGTI_InvNatural logarithm of 1 plus the number of green invention patent applications.
Quantity of GTIGTI_UtiNatural logarithm of 1 plus the number of green utility model patent applications.
Independent VariableGreen Factory CertificationGPWhether a listed company is certified as a Green Factory in a given year is coded as 1 if certified, and 0 otherwise. If the certification is revoked in that year, the company is coded as 0 for that year.
Mechanism VariablesDigitalization levelDigThe composite index values for the six dimensions—artificial intelligence technology, big data, cloud computing, blockchain, digital technology utilization, and digital transformation.
ESG practicesESGThe Huazheng ESG rating.
Financing constraintsSAThe SA index.
Control
Variables
ProfitabilityRoaThe ratio of net profit to total assets.
Leverage RatioLevThe ratio of total liabilities to total assets.
Enterprise Value MultipleEvmThe ratio of enterprise value to EBITDA (Earnings Before Interest, Taxes, Depreciation, and Amortization).
Firm SizeSizeNatural logarithm of total assets.
Board SizeBoardSizeTotal number of board members.
Shareholding Ratio of the Largest ShareholderTop1The proportion of shares held by the largest shareholder relative to the total shares outstanding.
CEO DualityDualAssumes a value of 1 if the CEO concurrently holds the position of chairman of the board, and 0 otherwise.
Number of Independent DirectorsIndpTotal number of independent directors on the board.
Tobin’s QTobinqThe ratio of market value to book value.
years listedAgeThe duration of the enterprise’s listing in years.
Table 2. Descriptive statistics.
VariableNMeanStd. DevMinMedianMax
GTI22,7200.4140.8490.0000.0007.060
GTI_Inv22,7200.2950.7120.0000.0006.620
GTI_Uti22,7200.2260.5940.0000.0006.080
GP22,7200.0410.1980.0000.0001.000
Roa22,7200.0760.2580.0000.06022.010
Lev22,7200.9020.1330.0000.9501.000
Size22,72021.7481.16215.72021.60028.100
Evm22,7203.29970.7150.483.207.74
BoardSize22,7208.3741.5914.0009.00018.000
Top122,72035.43015.0373.89033.88089.090
Indp22,7203.1050.5341.0003.0008.000
Dual22,7204.6467.3280.0000.00063.810
Tobinq22,7200.5310.2390.0100.5201.460
Age22,7201.6081.0600.0001.6103.470
Table 3. Pearson correlation matrix.
VariablesGTIGPRoaLevSizeEvmBoardSizeTop1IndpDualTobinqAge
GTI1.000
GP0.054 ***1.000
Roa−0.0120.0001.000
Lev−0.039 ***−0.042 ***−0.058 ***1.000
Size0.0070.0090.087 ***−0.302 ***1.000
Evm0.276 ***0.144 ***−0.023 **−0.229 ***0.086 ***1.000
BoardSize0.053 ***0.011−0.009−0.060 ***0.034 ***0.262 ***1.000
Top1−0.010−0.002−0.001−0.115 ***0.026 ***0.169 ***0.022 *1.000
Indp0.049 ***−0.012−0.002−0.048 ***0.017 *0.293 ***0.721 ***0.078 ***1.000
Dual0.038 ***0.037 ***0.003−0.0020.0150.058 ***0.037 ***0.171 ***−0.0081.000
Tobinq0.066 ***0.060 ***−0.085 ***−0.299 ***−0.121 ***0.312 ***0.113 ***0.157 ***0.086 ***0.0111.000
Age0.020 **0.065 ***0.0050.112 ***0.020 **0.392 ***0.158 ***−0.054 ***0.158 ***0.088 ***−0.040 ***1.000
Note: * p < 0.1, ** p < 0.05, *** p < 0.01.
Table 4. Baseline regression results.
Variables(1)(2)(3)(4)(5)(6)
GTIGTIGTI_InvGTI_InvGTI_UtiGTI_Uti
GP0.114 ***0.107 ***0.096 ***0.101 ***0.068 ***0.061 ***
(6.059)(4.694)(6.018)(5.167)(4.595)(3.463)
Roa −0.009 −0.003 −0.004
(−0.416) (−0.192) (−0.268)
Evm −0.000 −0.000 −0.000
(−0.467) (−0.406) (−0.196)
Lev 0.000 −0.000 0.000
(0.806) (−1.282) (1.536)
Size 0.055 *** 0.049 *** 0.023 ***
(6.300) (6.553) (3.364)
BoardSize 0.004 −0.003 0.011 ***
(0.820) (−0.640) (2.712)
Top1 −0.001 ** −0.001 ** −0.001
(−2.225) (−2.057) (−1.390)
Indp −0.014 −0.005 −0.019 *
(−1.048) (−0.435) (−1.747)
Dual −0.000 −0.000 −0.000
(−0.132) (−0.122) (−0.171)
Tobinq 0.020 −0.006 0.044 **
(0.718) (−0.239) (2.048)
Age −0.022 * −0.025 ** 0.007
(−1.909) (−2.554) (0.806)
Constant0.401 ***−0.701 ***0.278 ***−0.658 ***0.236 ***−0.308 **
(148.867)(−3.753)(121.418)(−4.092)(111.815)(−2.111)
FirmYesYesYesYesYesYes
YearYesYesYesYesYesYes
N22,72022,72022,72022,72022,72022,720
adj. R20.6760.6940.6570.6770.6160.636
Note: t statistics in parentheses; * p < 0.1, ** p < 0.05, *** p < 0.01.
Table 5. PSM results.
VariablesMatching StatusMean
(Treatment Group)
Mean
(Control Group)
Standardized Bias (%)T-Valuep-Value
RoaBefore1.8941.972−8.5−4.350.000
After1.8911.8920.20.080.940
EvmBefore22.45934.76−4.9−1.960.050
After22.45522.280.10.370.712
LevBefore1.4291.658−1.9−0.760.448
After1.4221.3990.20.580.564
SizeBefore8.7828.55913.06.850.000
After8.7828.7631.10.420.674
BoardSizeBefore3.2253.1679.65.170.000
After3.2243.2200.80.290.768
Top1Before0.0580.0554.82.020.043
After0.0530.060−1.5−0.470.640
IndpBefore22.47522.23818.99.510.000
After22.44222.461.00.390.693
DualBefore6.7776.7522.91.430.152
After6.7336.778−0.3−0.110.910
TobinqBefore−3.807−3.794−4.4−2.290.022
After−3.816−3.8080.70.290.773
AgeBefore1.6341.3422.92.100.036
After1.6511.5710.70.280.776
Table 6. PSM-DID regression results.
Variables(1)(2)(3)
GTIGTI_InvGTI_Uti
GP0.113 ***0.068 *0.113 ***
(2.824)(1.912)(3.767)
ControlsYesYesYes
FirmYesYesYes
YearYesYesYes
Constant0.414 ***0.296 ***0.224 ***
(75.077)(60.574)(54.167)
N728472847284
adj. R20.6920.6560.649
Note: t statistics in parentheses; * p < 0.1, *** p < 0.01.
Table 7. Robustness test results 1.
VariablesAlternative Measurement of Dependent VariablesExclusion of Municipal SamplesLogit ModelEntropy Balancing Method
(1)(2)(3)(4)(5)(6)
GTIGTI_InvGTI_UtiGTIGTIGTI
GP0.113 ***0.105 ***0.084 *0.122 ***0.404 ***0.198 ***
(5.368)(5.842)(1.648)(5.170)(3.383)(10.729)
ControlsYesYesYesYesYesYes
FirmYesYesYesYesYesYes
YearYesYesYesYesYesYes
Constant−0.350 **−0.309 **−1.593 ***−0.973 ***−17.844 ***−8.256 ***
(−2.014)(−2.084)(−2.743)(−4.790)(−21.077)(−29.891)
N22,72022,72022,72018,12422,72022,720
adj. R20.6670.6460.6390.673 0.205
Note: t statistics in parentheses; * p < 0.1, ** p < 0.05, *** p < 0.01.
Table 8. Robustness test results 2—lagged effect test.
Variables(1)(2)(3)
GTIGTI_InvGTI_Uti
L.GP0.075 ***0.064 ***0.045 **
(2.855)(2.832)(2.182)
L.Roa−0.019−0.0170.001
(−0.469)(−0.495)(0.045)
L.Evm−0.000−0.000−0.000
(−0.259)(−0.365)(−0.006)
L.Lev−0.0000.000−0.000
(−0.216)(0.382)(−1.065)
L.Size0.055 ***0.052 ***0.021 ***
(5.880)(6.419)(2.868)
L.Boardsize0.0080.0050.009 **
(1.563)(1.062)(2.205)
L.Top1−0.000−0.000−0.001
(−0.704)(−0.279)(−1.145)
L.Indp−0.018−0.018−0.013
(−1.254)(−1.454)(−1.123)
L.Dual−0.001−0.0010.000
(−0.983)(−0.742)(0.198)
L.Tobinq−0.086 ***−0.059 **−0.043 *
(−2.896)(−2.284)(−1.841)
L.Age−0.027 **−0.022 **−0.005
(−2.176)(−2.047)(−0.528)
Constant−0.664 ***−0.731 ***−0.193
(−3.319)(−4.233)(−1.224)
N22,72022,72022,720
adj. R20.7080.6920.647
Note: t statistics in parentheses; * p < 0.1, ** p < 0.05, *** p < 0.01.
Table 9. Robustness test results 3—instrumental variable approach.
VariableFirst StageSecond Stage
GPGTI
GP 0.787 ***
(2.692)
AQ0.671 ***
(2.991)
K-P LM Statistic12.197 ***
C-D F Statistic18.932
K-P F Statistic12.200
ControlsYesYes
FirmYesYes
YearYesYes
N17,83217,832
Note: t statistics in parentheses; *** p < 0.01.
Table 10. Robustness test results 4—multi-dimensional fixed effects model.
Variables(1)(2)(3)
GTIGTI_InvGTI_Uti
GP0.104 ***0.100 ***0.061 ***
(4.577)(5.085)(3.400)
Constant−0.806 ***−0.748 ***−0.362 **
(−4.218)(−4.546)(−2.420)
ControlsYesYesYes
FirmYesYesYes
YearYesYesYes
ProvinceYesYesYes
CityYesYesYes
N22,66222,66222,662
adj. R20.6950.6770.636
Note: t statistics in parentheses; ** p < 0.05, *** p < 0.01.
Table 11. Regression results of the digitalization level mechanism.
Variables(1)(2)(3)
GTIDigGTI
GP0.107 ***2.542 ***0.078 ***
(4.694)(3.544)(3.452)
Dig 0.001 **
(2.554)
ControlsYesYesYes
FirmYesYesYes
YearYesYesYes
Constant−0.701 ***328.417 ***−0.892 ***
(−3.753)(49.640)(−3.912)
N22,72022,72022,720
adj. R20.6940.9830.714
Note: statistics in parentheses; ** p < 0.05, *** p < 0.01.
Table 12. Regression results of the ESG practices mechanism.
Variables(1)(2)(3)
GTIESGGTI
GP0.107 ***0.168 ***0.094 ***
(4.694)(5.580)(4.110)
ESG 0.027 ***
(4.827)
ControlsYesYesYes
FirmYesYesYes
YearYesYesYes
Constant−0.701 ***0.043−0.694 ***
(−3.753)(0.164)(−3.499)
N22,72022,72022,720
adj. R20.6940.5200.702
Note: t statistics in parentheses; *** p < 0.01.
Table 13. Regression results of the financing constraints mechanism.
Variables(1)(2)(3)
GTISAGTI
GP0.107 ***−0.012 ***0.096 ***
(4.694)(−4.389)(4.242)
SA −0.092 ***
(−15.398)
ControlsYesYesYes
FirmYesYesYes
YearYesYesYes
Constant−0.701 ***−3.374 ***2.415 ***
(−3.753)(−150)(8.796)
N22,72022,72022,720
adj. R20.6940.9530.698
Note: t statistics in parentheses; *** p < 0.01.
Table 14. Industry heterogeneity regression results.
Variables(1)(2)
Heavy-Polluting IndustriesLight-Polluting Industries
GP−0.0020.175 ***
(−0.045)(5.834)
ControlsYesYes
FirmYesYes
YearYesYes
Constant−0.017−1.192 ***
(−0.047)(−5.043)
N709815,622
adj. R20.6520.708
Note: t statistics in parentheses; *** p < 0.01.
Table 15. Firm heterogeneity regression results.
Variables(1)(2)
State-Owned EnterprisesNon-State-Owned Enterprises
GP0.0400.140 ***
(0.820)(5.457)
ControlsYesYes
FirmYesYes
YearYesYes
Constant−0.326−1.264 ***
(−0.822)(−5.704)
N805014,670
adj. R20.7340.666
Note: t statistics in parentheses; *** p < 0.01.
Table 16. Regional heterogeneity regression results.
Variables(1)(2)(3)
Eastern RegionCentral RegionWestern Region
GP0.087 ***0.168 ***0.105
(3.195)(3.138)(1.626)
ControlsYesYesYes
FirmYesYesYes
YearYesYesYes
Constant−0.841 ***−1.836 ***−1.105 **
(−3.684)(−3.265)(−2.108)
N17,82231451753
adj. R20.7050.6720.648
Note: t statistics in parentheses; ** p < 0.05, *** p < 0.01.
Disclaimer/Publisher’s Note: The statements, opinions and data contained in all publications are solely those of the individual author(s) and contributor(s) and not of MDPI and/or the editor(s). MDPI and/or the editor(s) disclaim responsibility for any injury to people or property resulting from any ideas, methods, instructions or products referred to in the content.

