
Study on Development Pattern and Comprehensive Evaluation of Integration of Urban Underground Space and Rail Transit in China

Abstract
1. Introduction
2. Methods
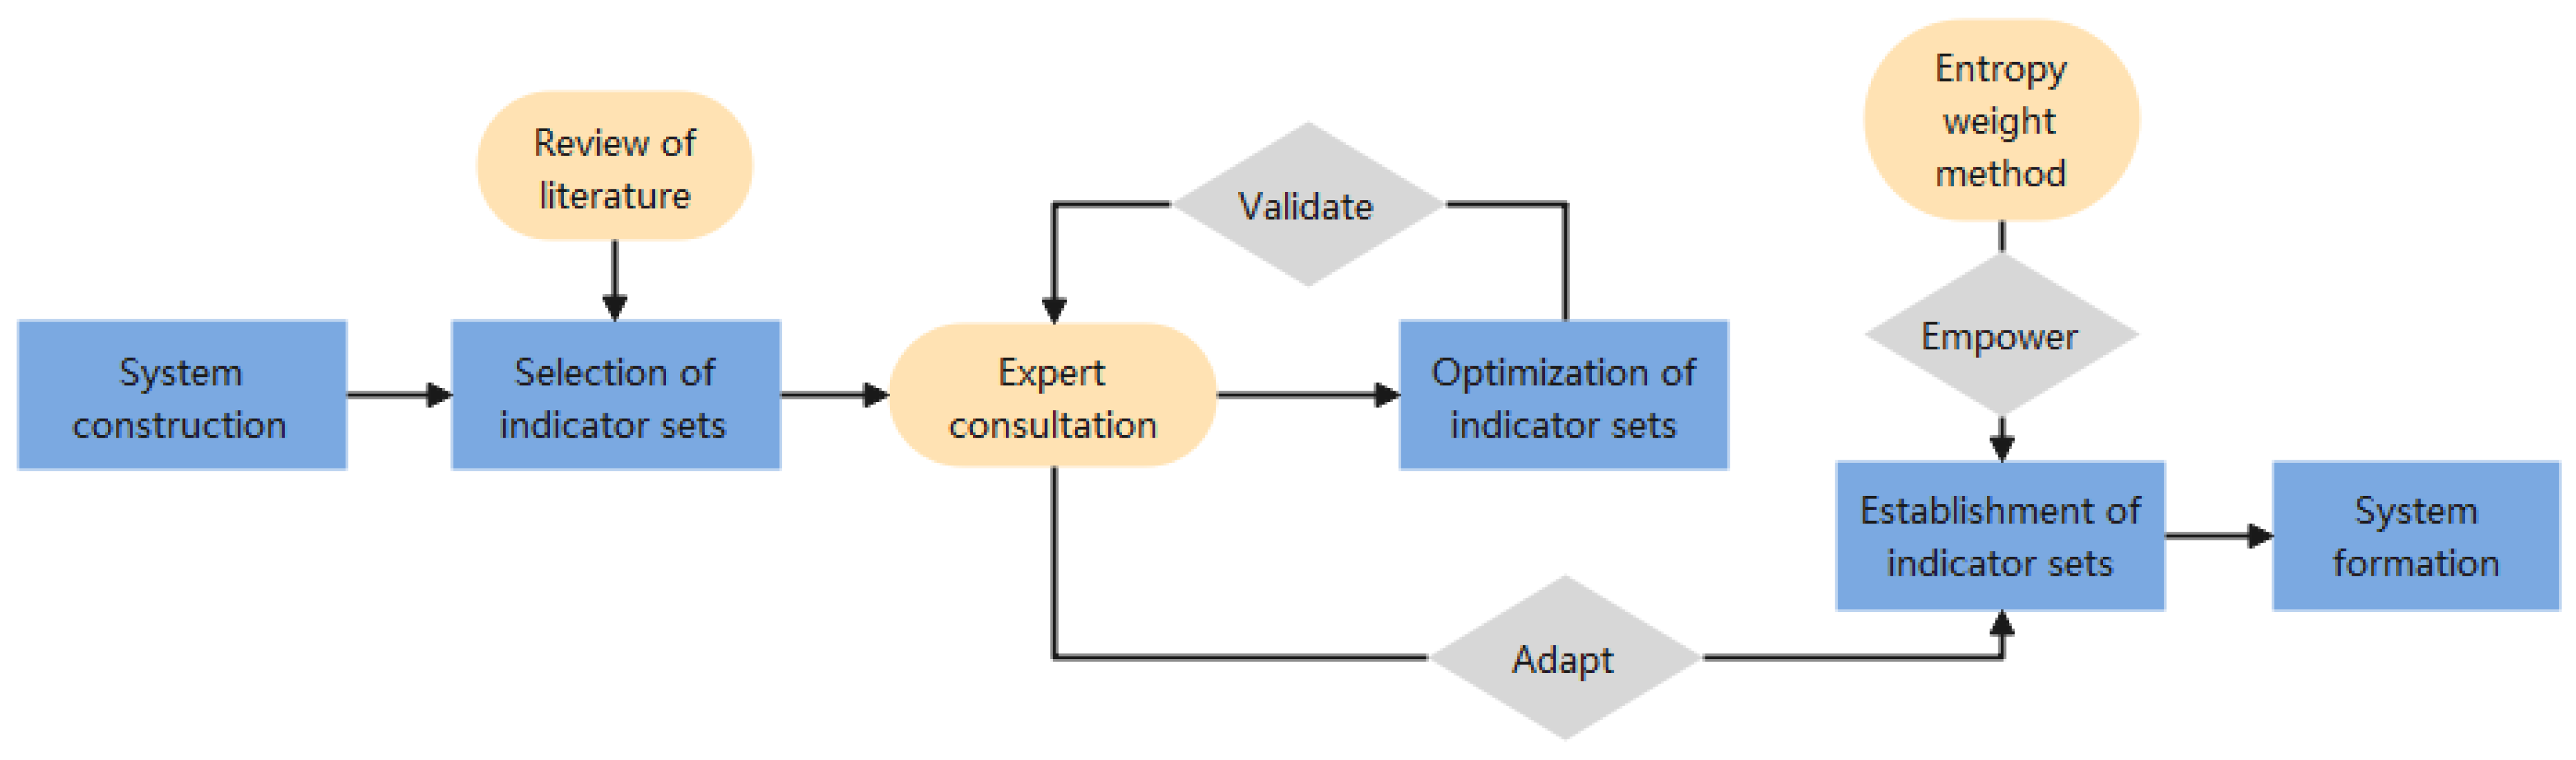
2.1. System Construction
2.1.1. System Construction Process
- Literature Review: A preliminary indicator system is formulated based on an extensive review of domestic and international studies.
- Expert Validation: Industry experts provide feedback to refine the indicator framework, ensuring its relevance and applicability.
- Iterative Verification: The framework undergoes multiple rounds of validation and adjustment to enhance its robustness and accuracy.
2.1.2. Expert Validation
2.2. Selection of Indicators
2.2.1. Integration Interactions
2.2.2. Indicator Content
2.2.3. Indicator Statistics
2.3. Weighting Scheme
2.3.1. Z-Score Scaling of Data Indicators
2.3.2. Determination of Indicator Weights
- Calculation of indicator ratios:
- 2.
- Calculation of entropy:
- 3.
- Calculation of coefficient of variation:
- 4.
- Calculation of indicator weights:
2.3.3. Comprehensive Evaluation
- 1.
- Calculation of the weighted comprehensive score:
- 2.
- Calculation of the positive and negative ideal solutions:
- 3.
- Calculation of group benefit values and individual regret values:
- 4.
- Calculation of the degree of compromise:
2.4. Cluster Analysis
- 1.
- Calculation of distance:
- 2.
- Update of the clustering center:
- 3.
- Repeating of iterations:
- 4.
- Calculation of the sum of squared errors:
3. Research Objects and Data Sources
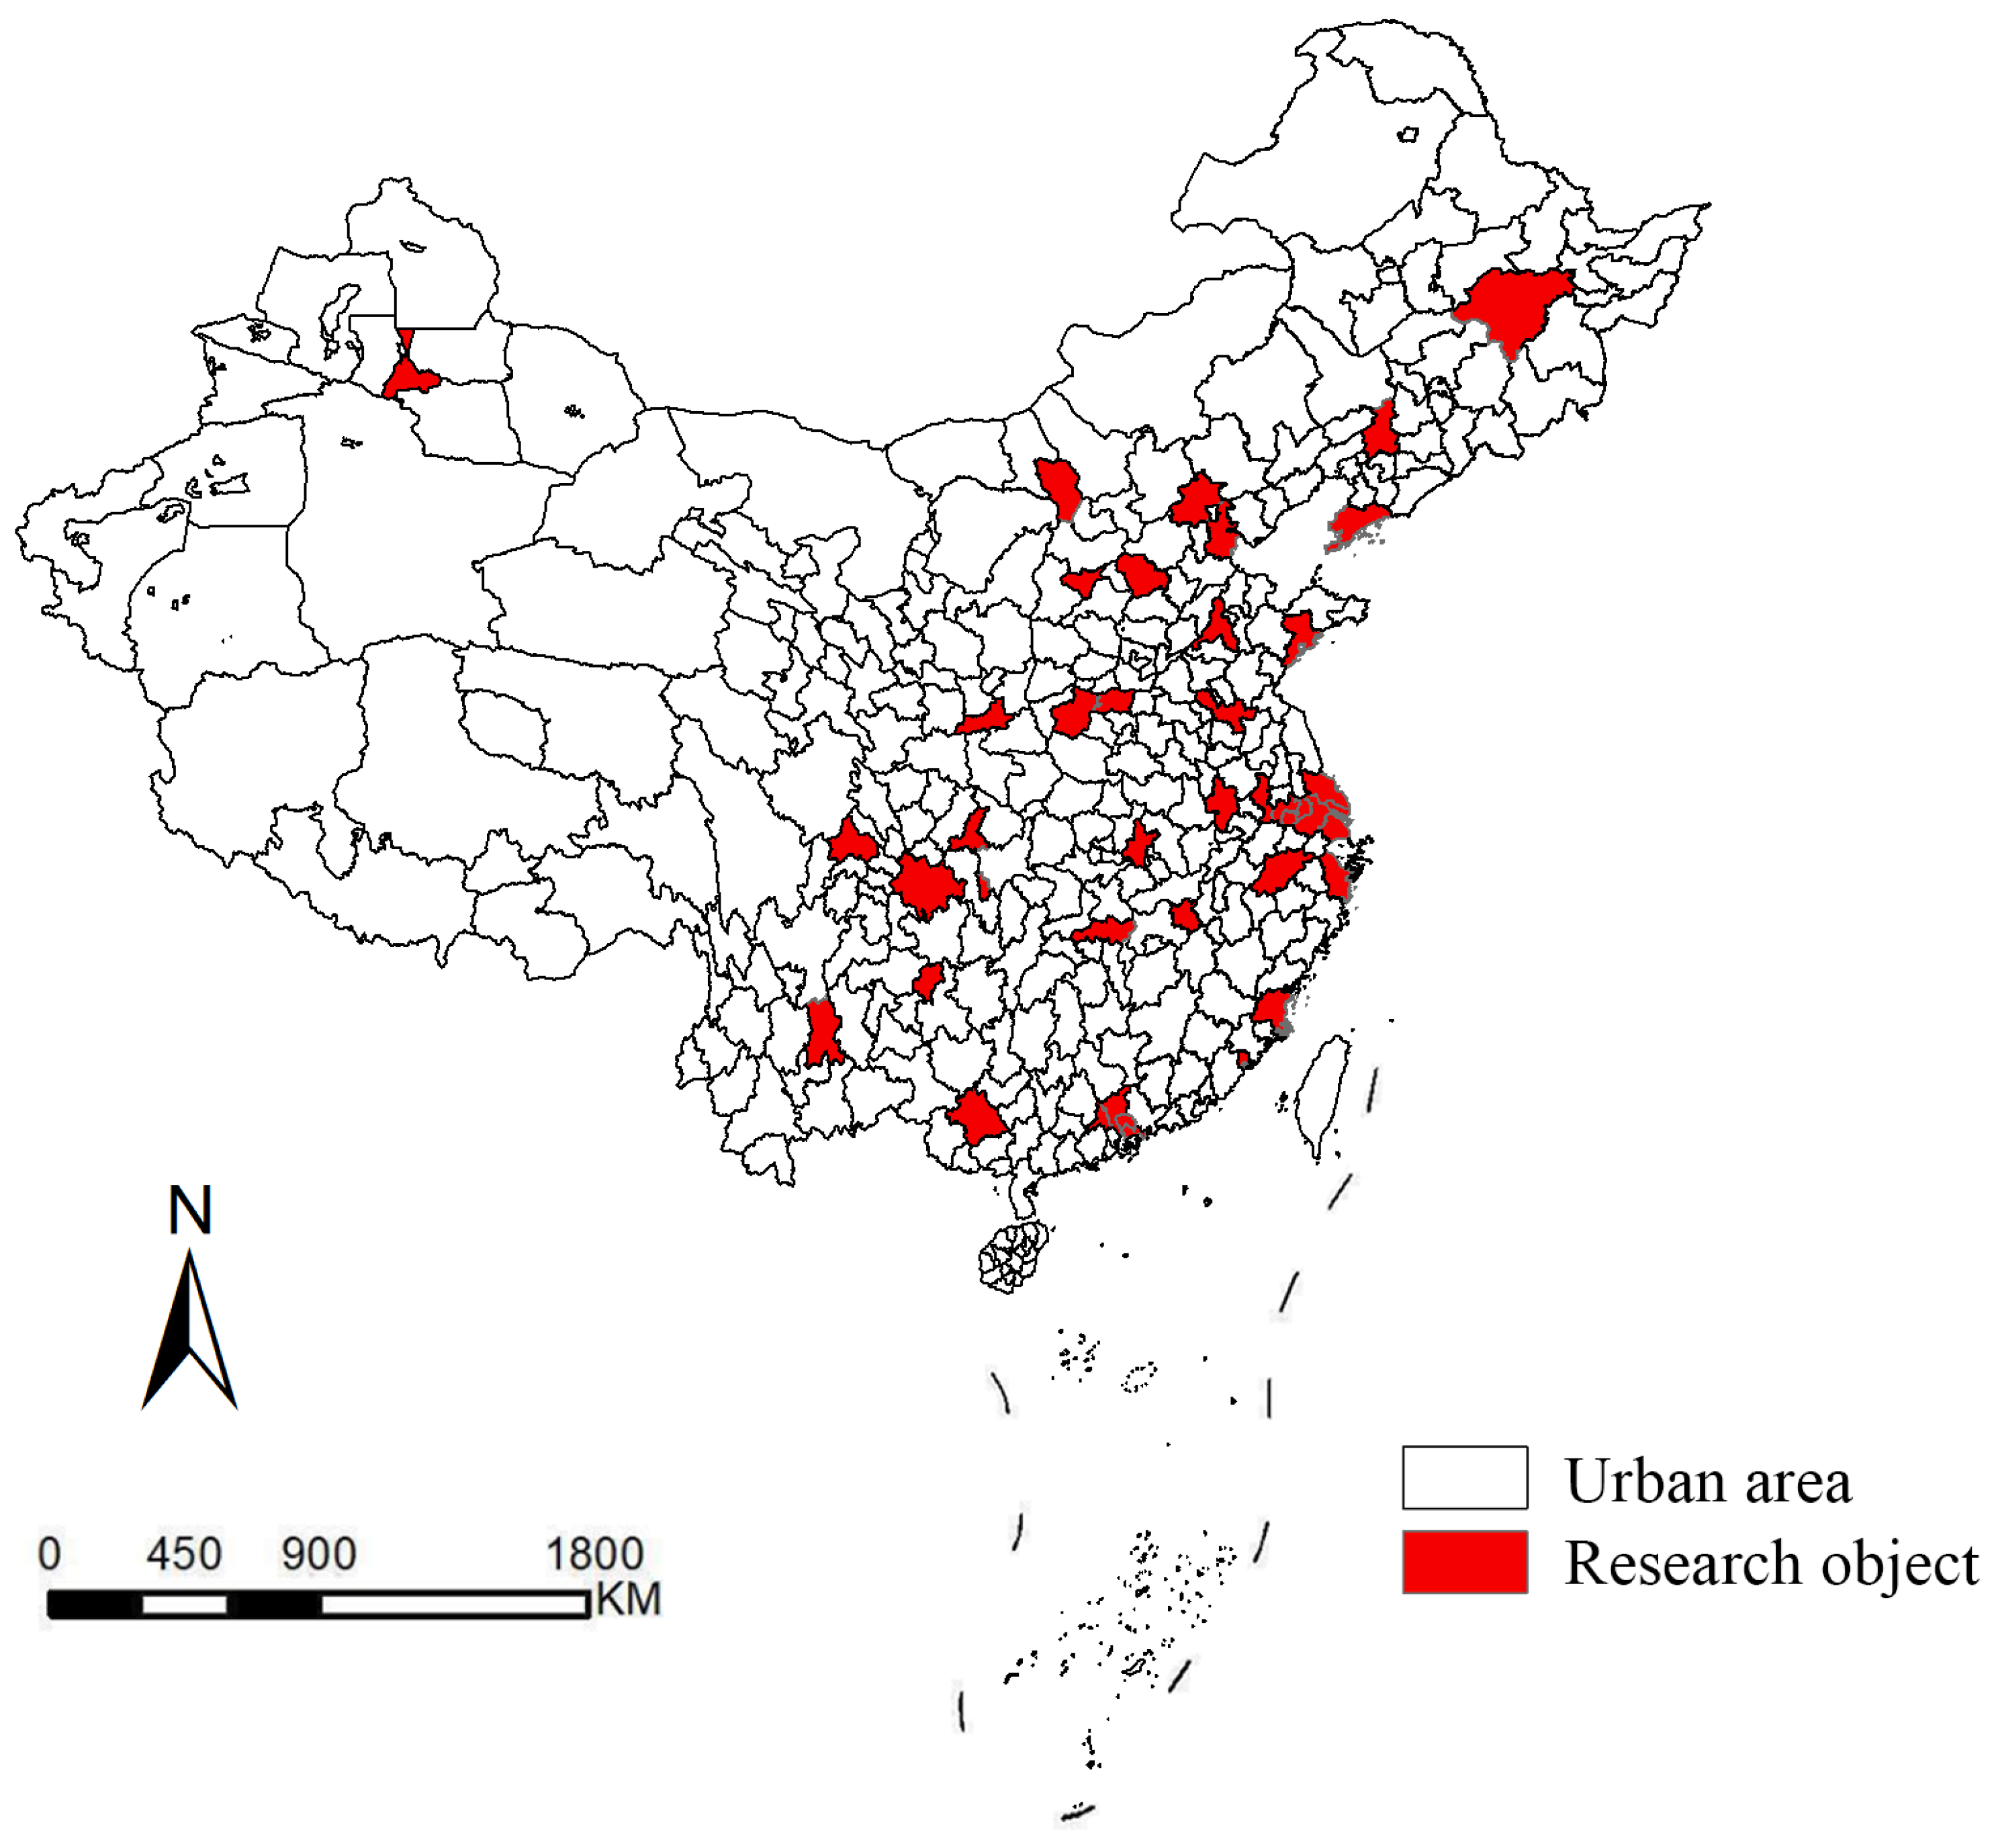
3.1. Objects of Study
- Since this study examines the relationship between UUS and URT, all selected cities have operational subway lines and URT stations.
- The selected cities differ in size and level of development, encompassing first-tier, second-tier, and relatively smaller cities to ensure that the findings are representative of diverse urban characteristics and needs.
- The selected cities are geographically distributed across eastern, central, and western China, ensuring that the findings reflect regional variations in urban spatial patterns.
- These thirty-eight cities possess comprehensive public data sources, including construction statistics yearbooks, rail transit analysis reports, and government-released data on underground space development.
3.2. Data Sources
4. Results and Discussion
4.1. Measurement Results of Each Index Layer
4.2. Results of Urban Typology Classification
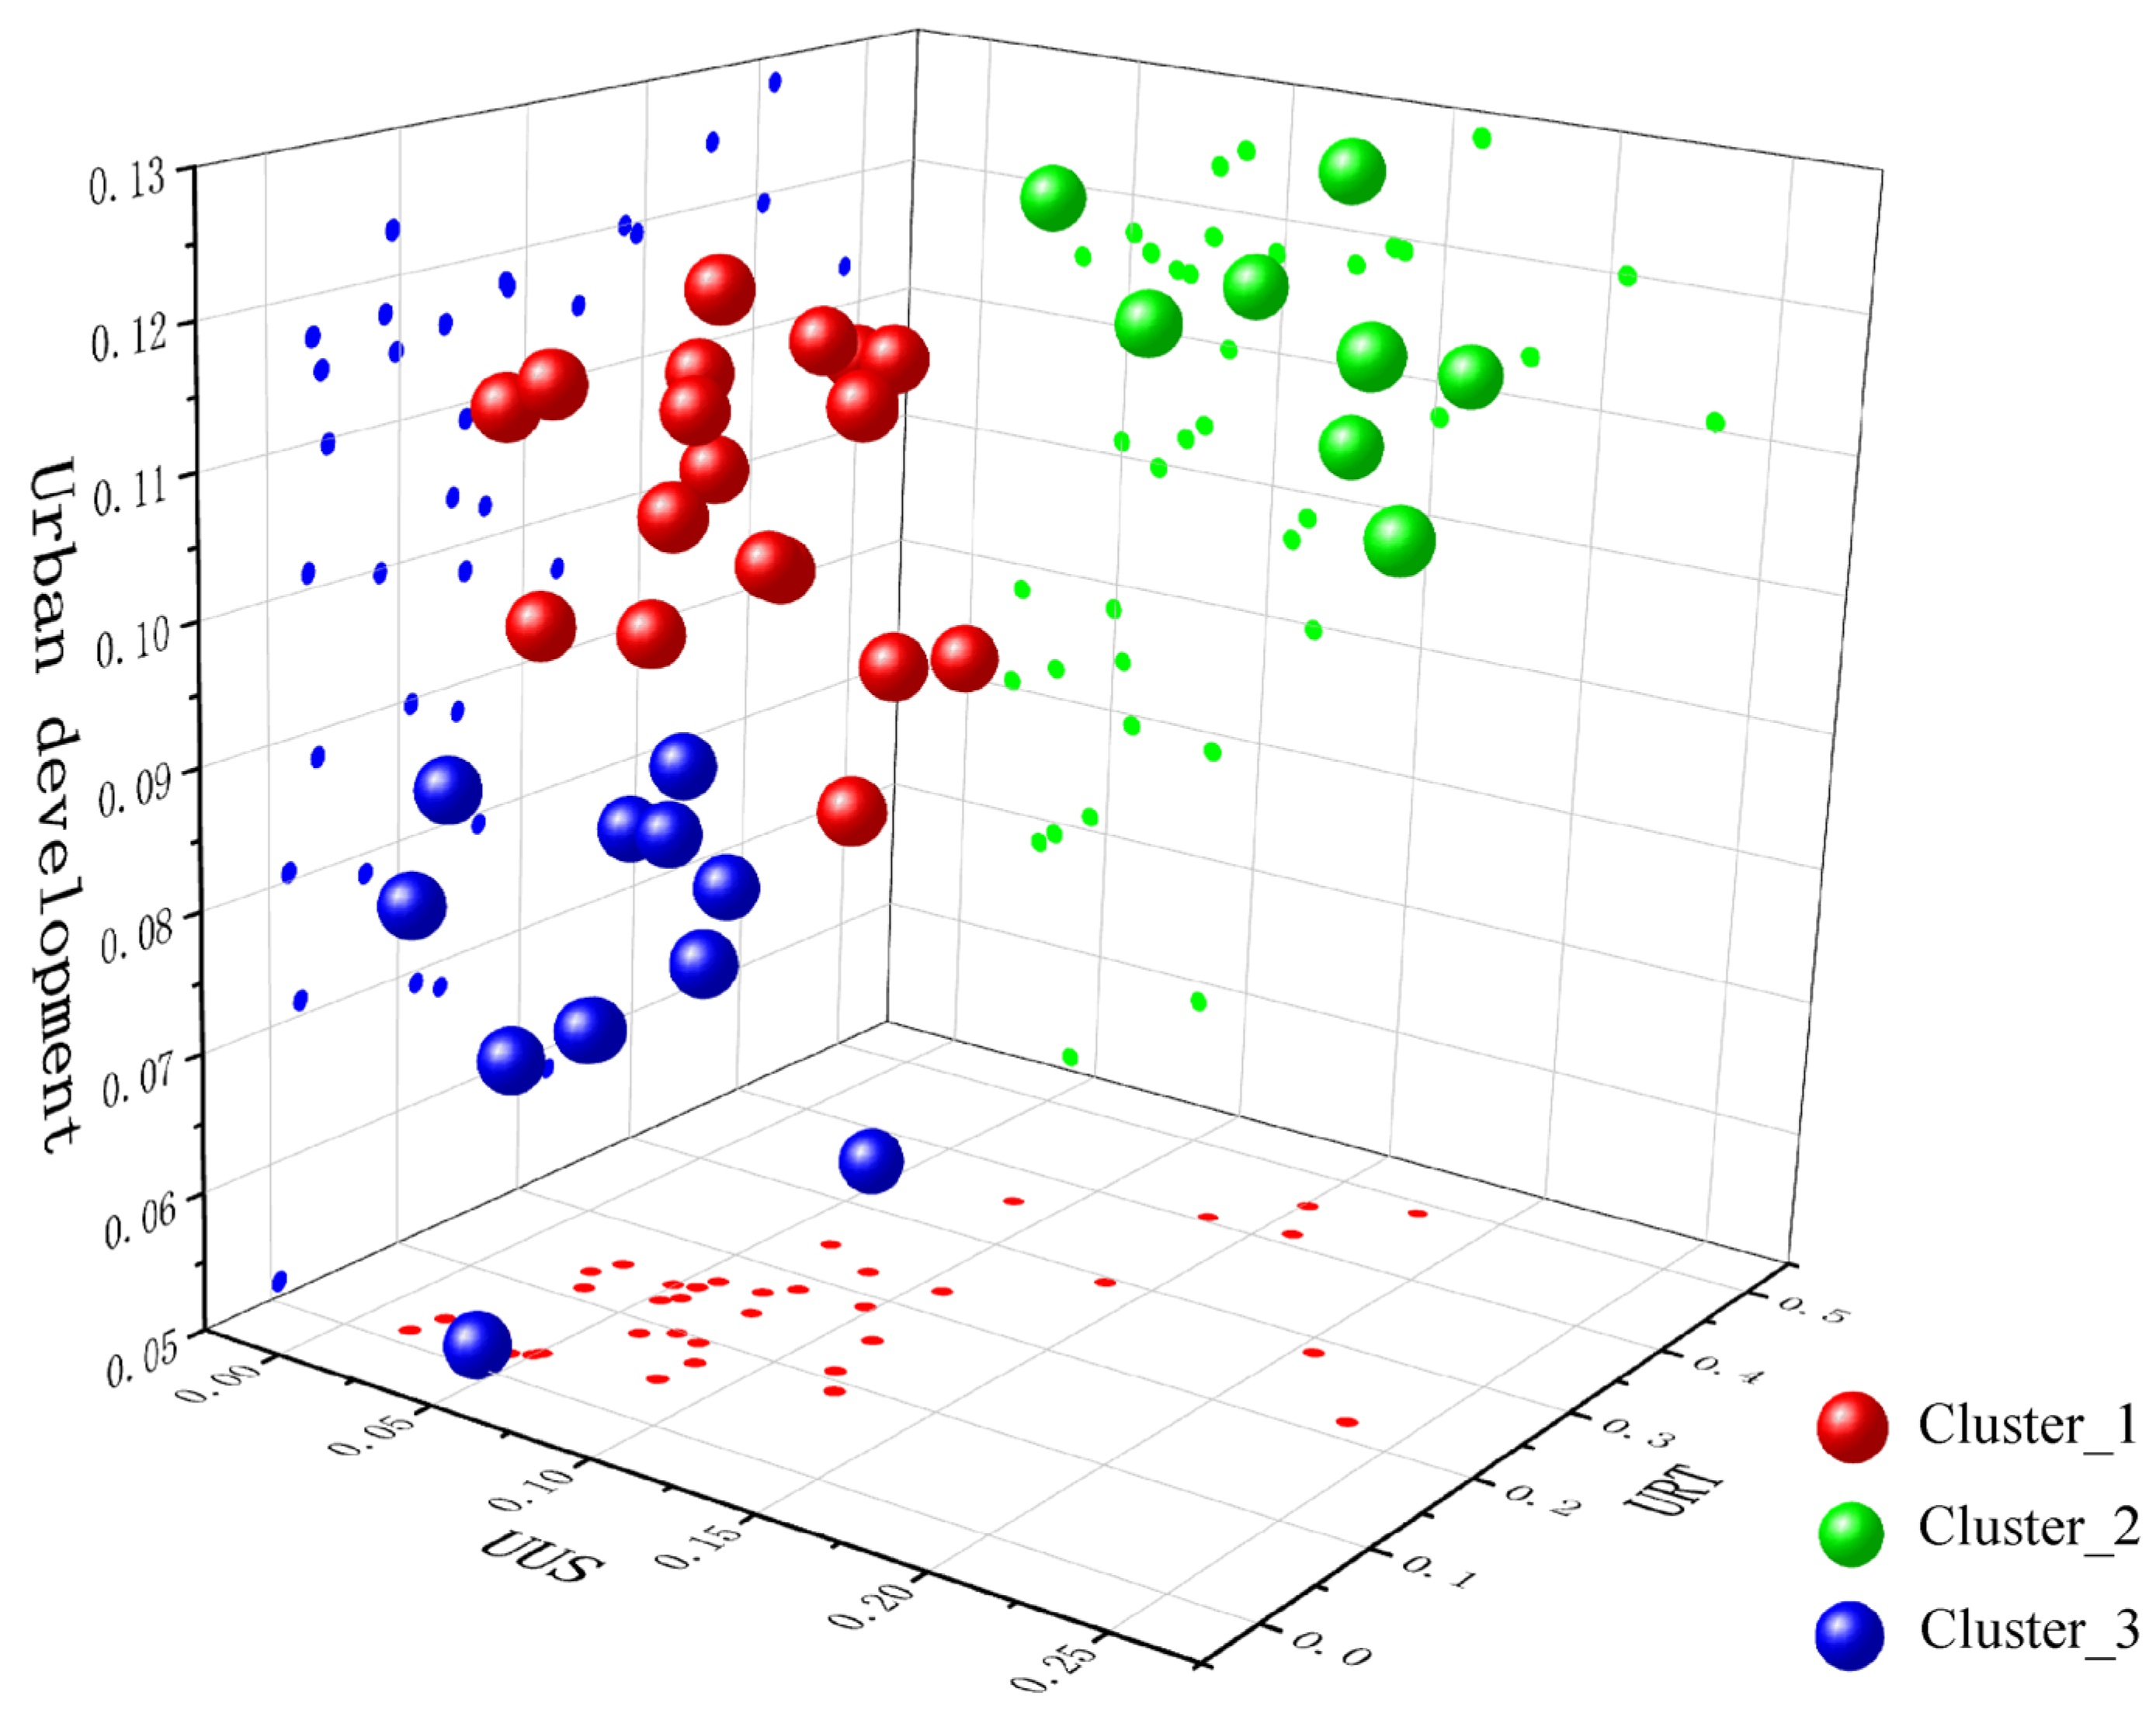
4.2.1. Description of Classification
- Developing cities (18 cities): These cities are characterized by moderate UUS development (0.08 ± 0.03), insufficient URT planning (0.12 ± 0.06), and overall good urban development (0.11 ± 0.01). Although the current level of UUS and URT development in these cities remains moderate, they exhibit significant potential for future growth. Notably, Tianjin, Suzhou, Xi’an, and other cities, leveraging their strong economic foundations, have made rapid progress in rail transit construction in recent years and demonstrate positive momentum for future development.
- Mature cities (8 cities): These cities are characterized by advanced UUS development (0.16 ± 0.05), well-planned URT systems (0.36 ± 0.09), and robust urban development (0.12 ± 0.01). This category includes some of China’s most developed cities, such as Shanghai, Beijing, and Shenzhen, which exhibit significantly higher levels of infrastructure development than other cities, as well as more balanced growth and strong capacity for sustainable development.
- Underdeveloped cities (12 cities): These cities are characterized by underdeveloped UUS (0.04 ± 0.02), inadequate URT planning (0.10 ± 0.07), and weak urban development (0.07 ± 0.01). Most cities in this category are in the early stages of UUS and URT development, with lower economic levels, smaller populations, and other limiting factors compared with the previous two categories. Two cities in this category require special consideration: Chongqing, as a municipality with a mountainous terrain and a vast non-central urban area, has statistical indicators that are significantly affected by its administrative classification, leading to a reported development level lower than its actual status. Meanwhile, Dalian, due to relatively low population density and a well-developed surface transportation network, has only opened three rail lines since 2003, as its urban development priorities do not focus on UUS and URT expansion.
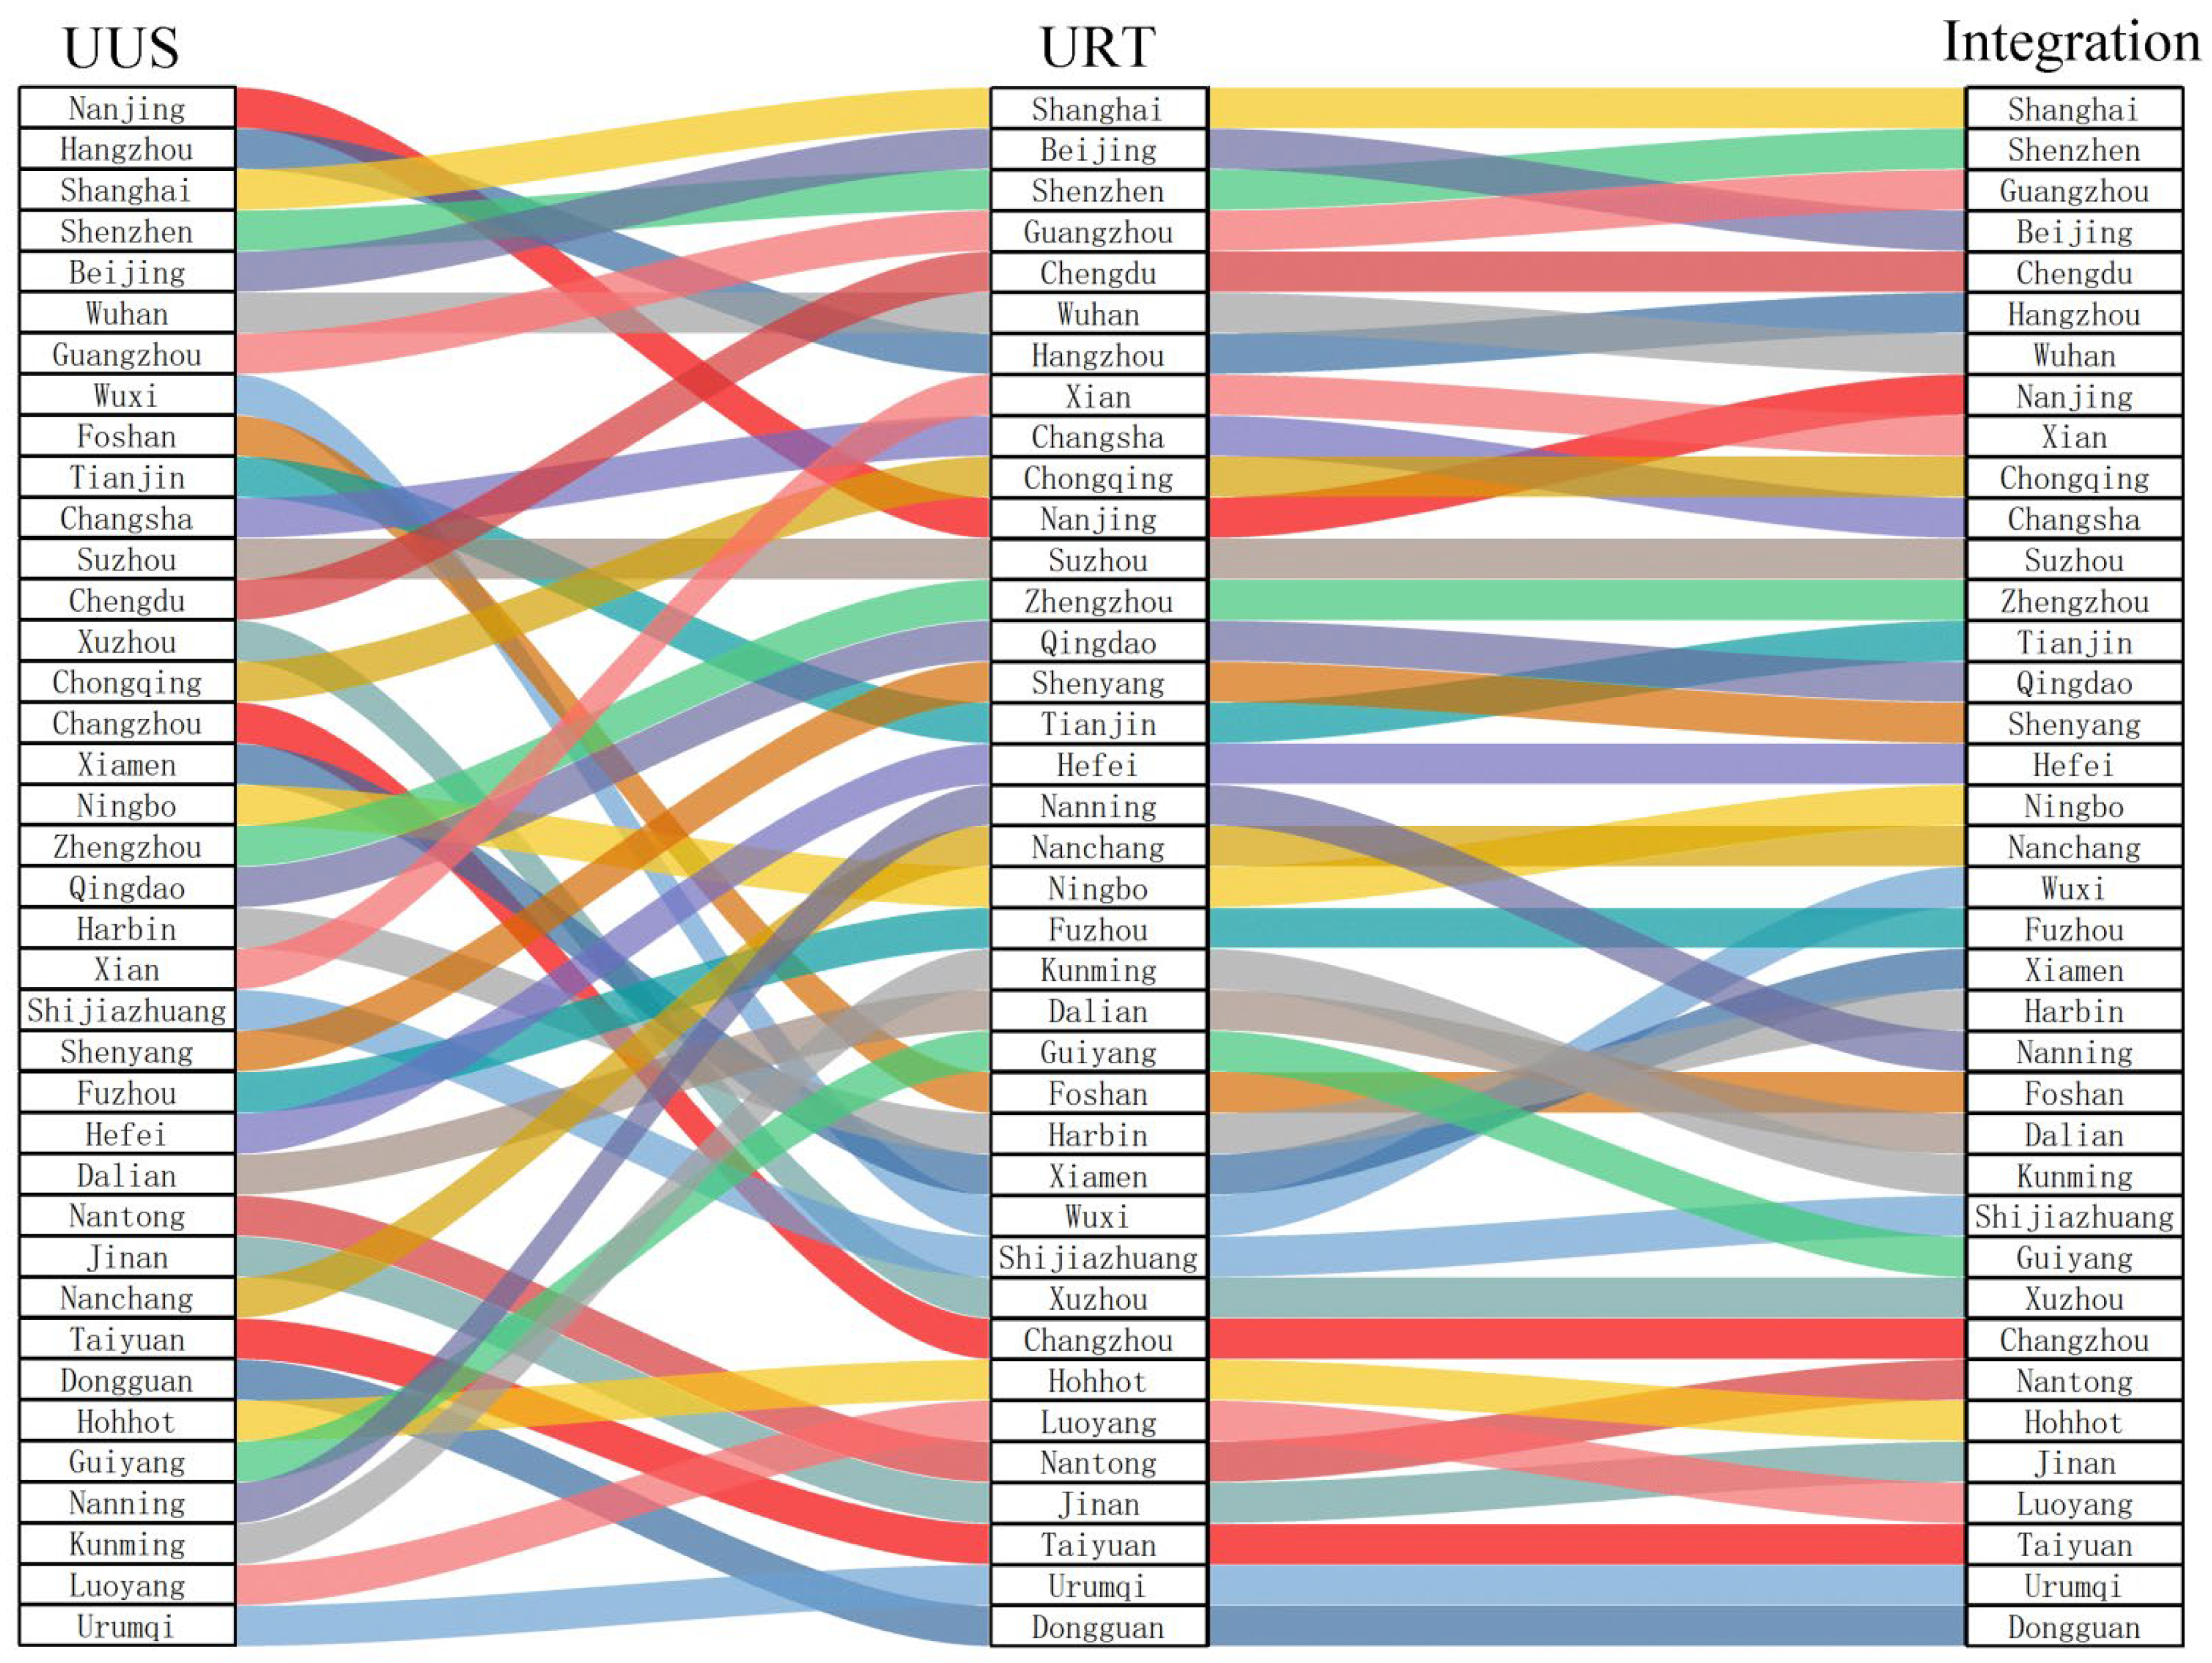
4.2.2. Distribution of Cities
4.3. Overall Measurement Results
4.3.1. Analysis of Measurement Results
- Complementary Urban Functions
- 2.
- Urban Activity Promotion
- 3.
- Urban Environment Improvement
- 4.
- Planning Synchronization
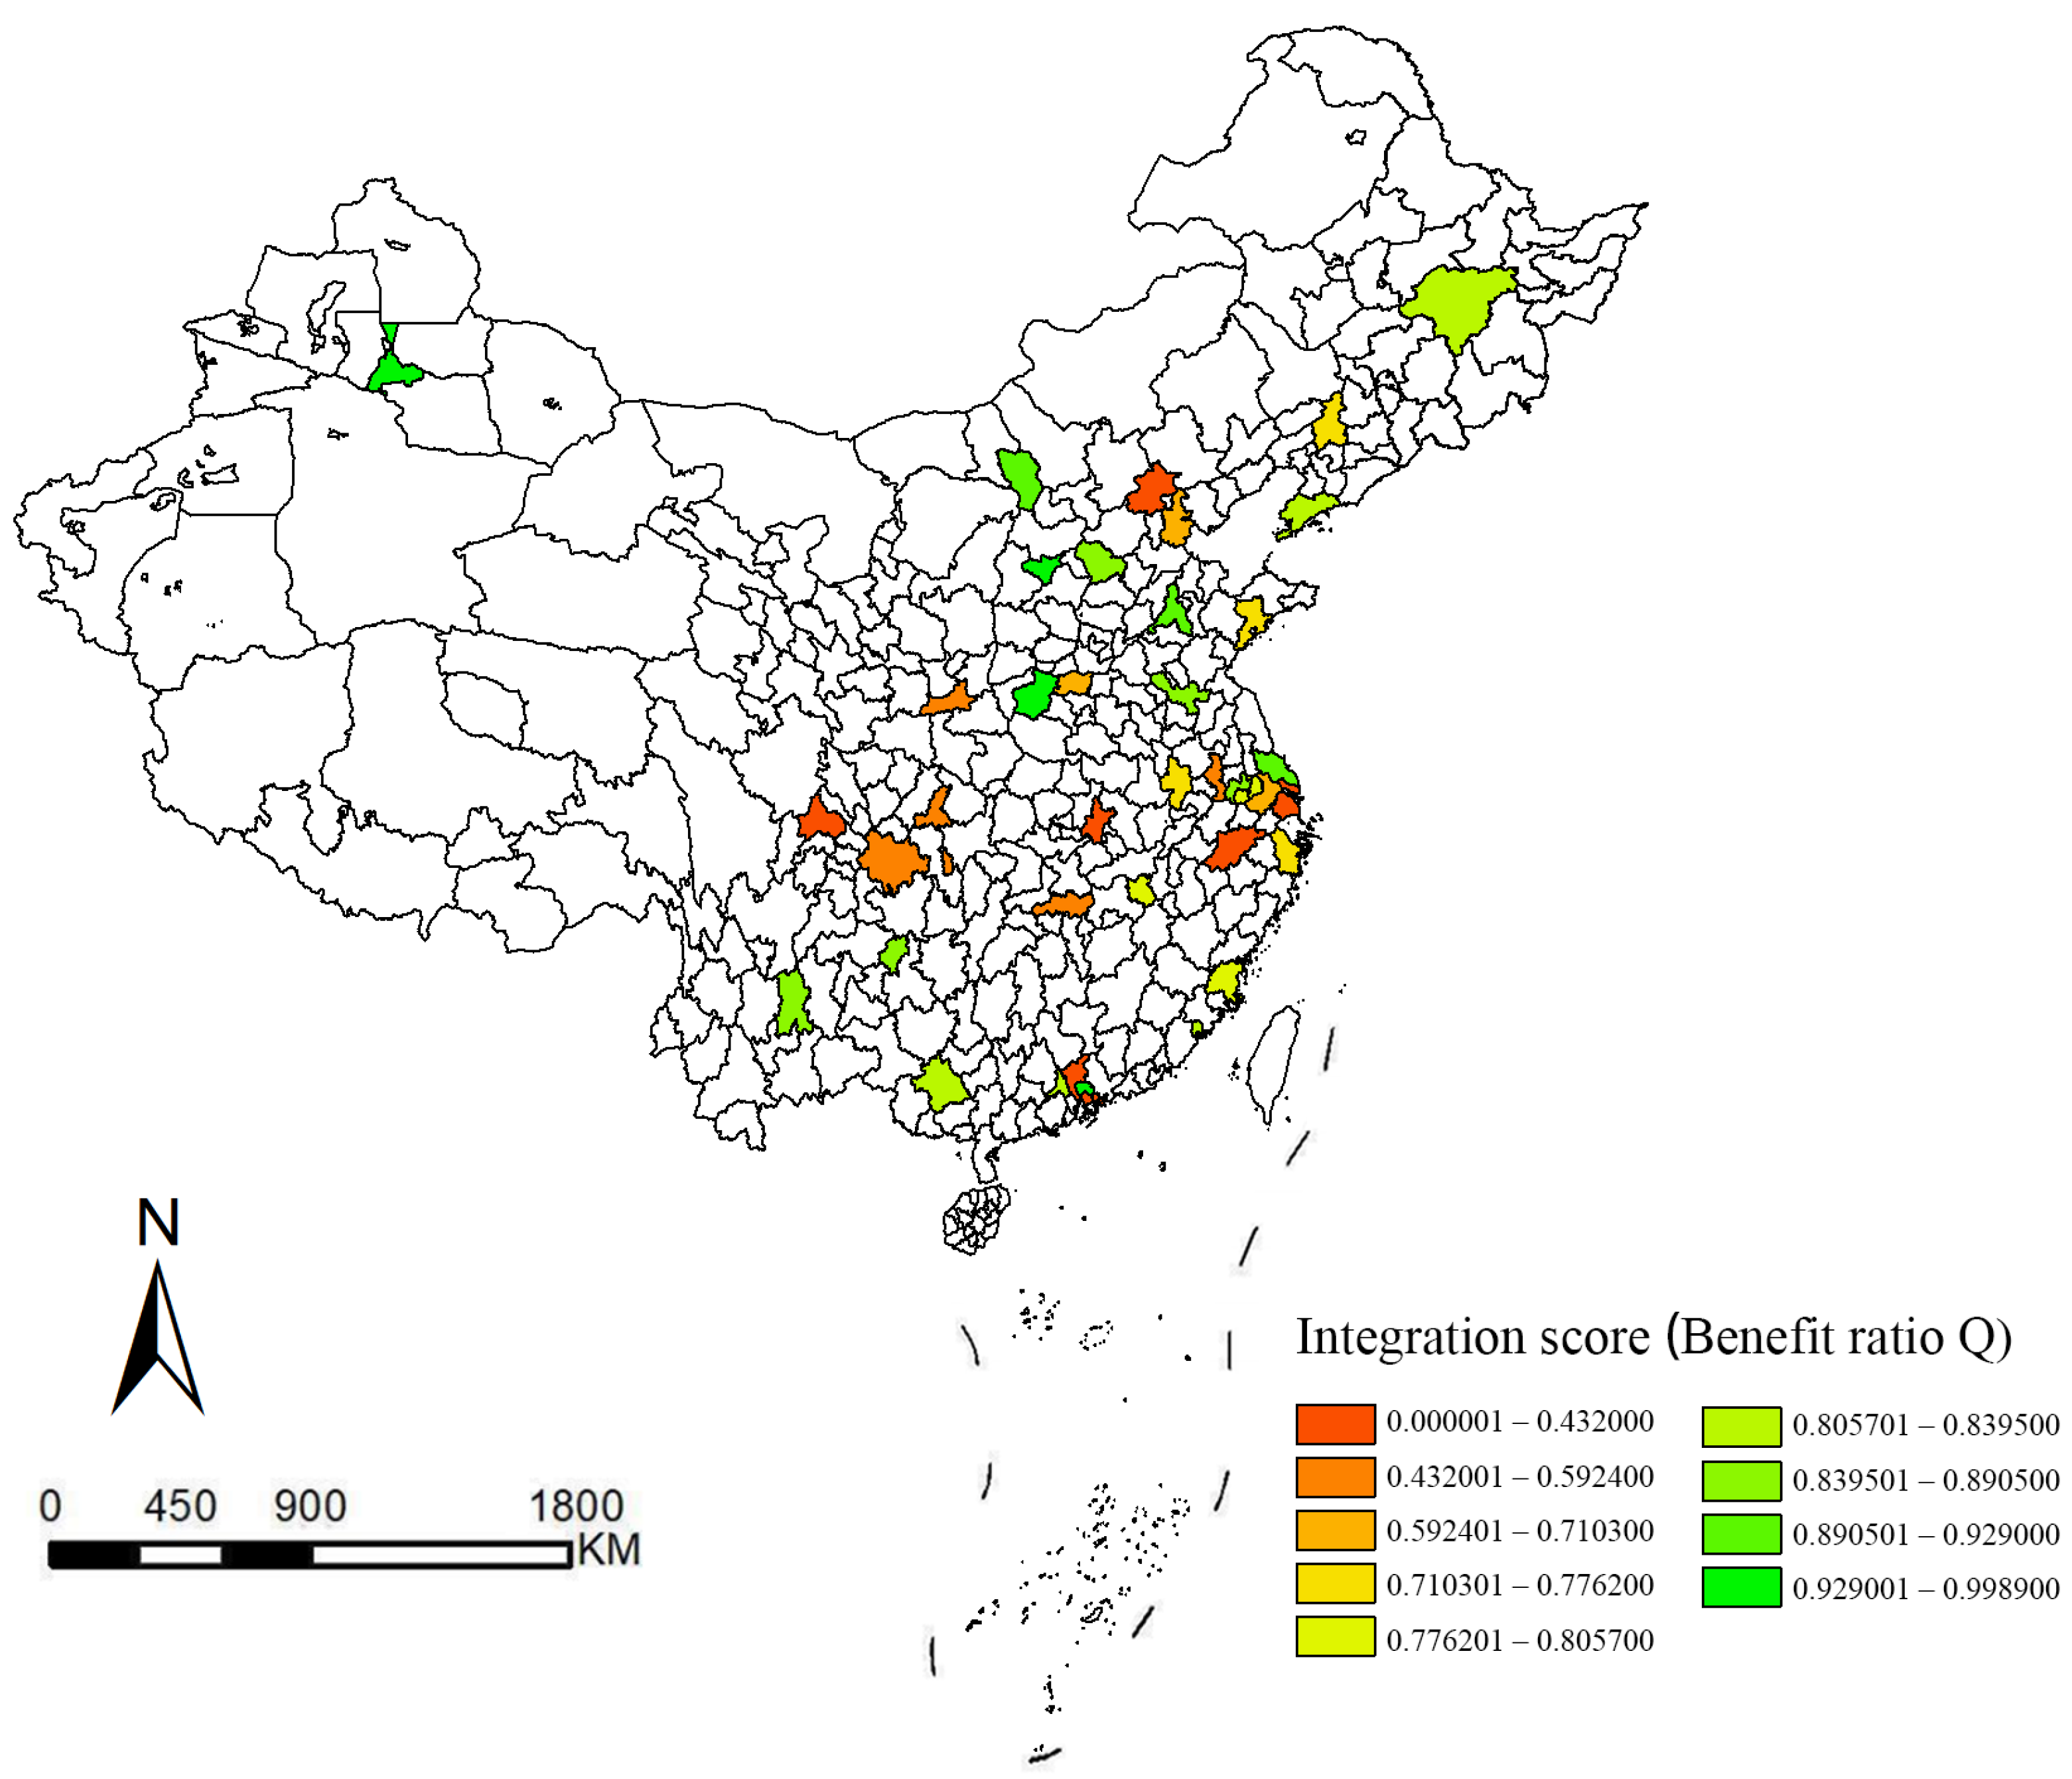
4.3.2. Spatial Distribution Pattern
4.4. International City Comparison
5. Conclusions
5.1. Research Conclusions
- 1.
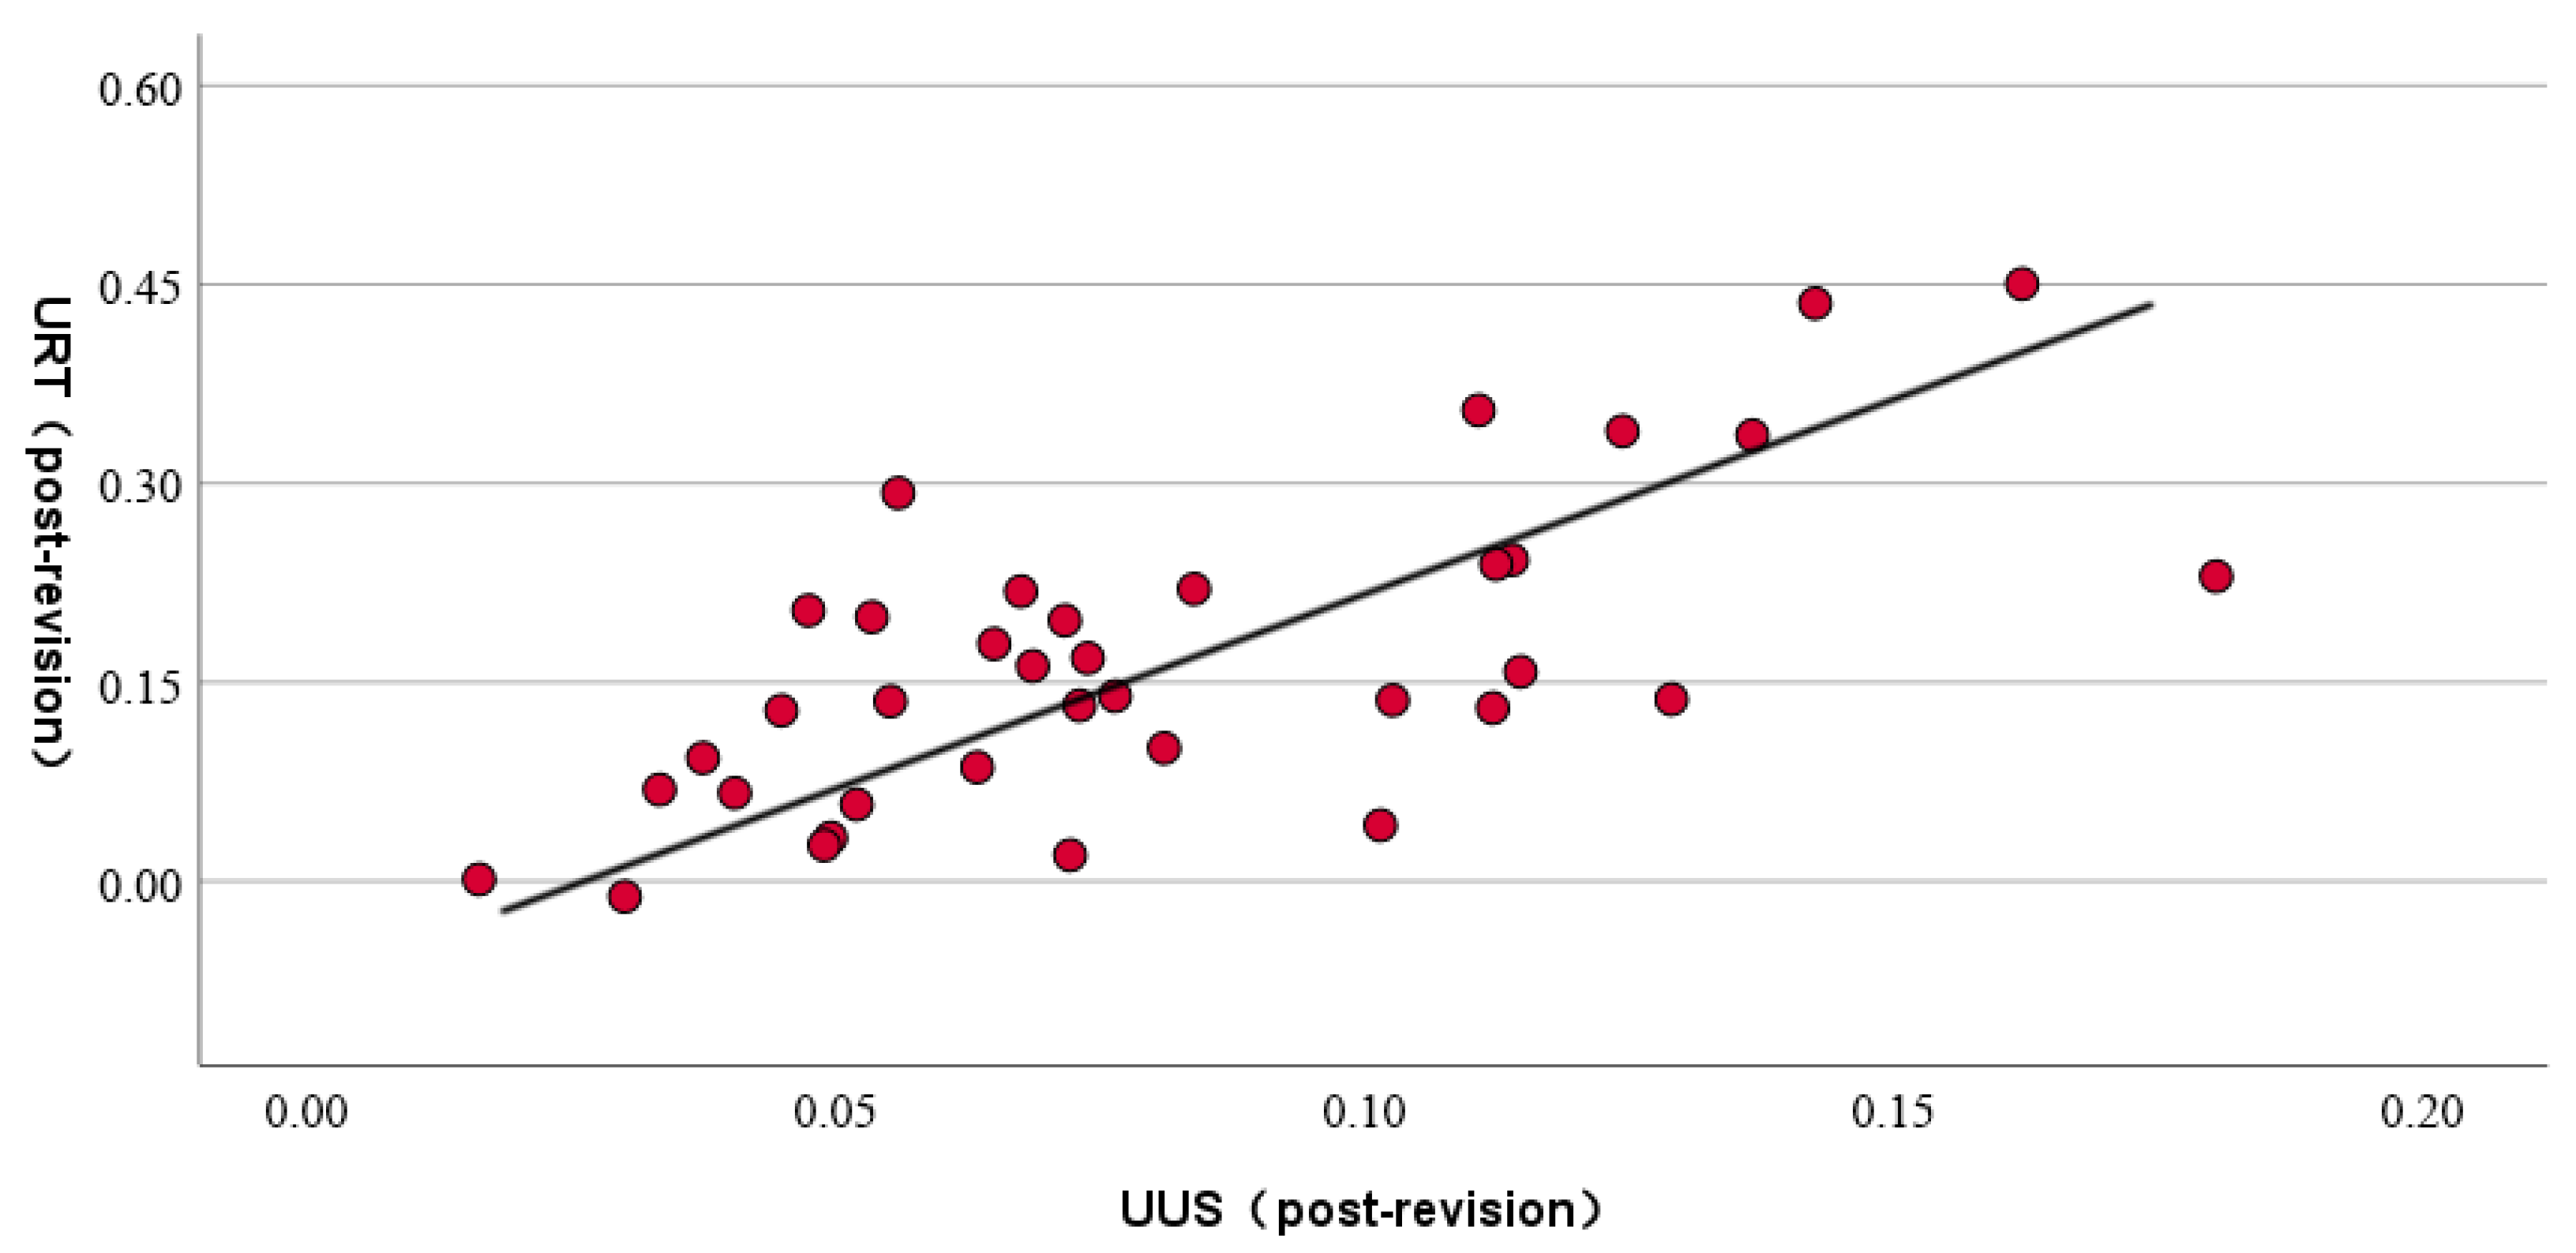
- UUS development and URT construction are correlated with each other
- 2.
- URT construction dominates in integrated development
- 3.
- The level of urban integration development is spatially heterogeneous
5.2. Suggestions
- For underdeveloped cities, governments should implement targeted measures to reduce regional disparities and promote balanced urban development. Policies should prioritize infrastructure investment and financial support. The most effective approach involves increasing financial transfers, offering targeted subsidies and policy incentives, prioritizing investments in URT infrastructure, and implementing phased UUS development. Balanced development does not imply indiscriminate expansion; rather, cities should adopt a strategy aligned with their economic capacity, development stage, and actual needs. For example, in resource-depleted cities, UUS development can be integrated with the repurposing of abandoned mining sites, underground parking structures, or former air defense facilities.
- For developing cities, policies should prioritize optimizing the efficiency of existing infrastructure and progressively enhancing the integration between UUS and URT. Traffic congestion and energy consumption can be reduced by strengthening public transportation networks and promoting multimodal transportation systems. Urban planners should prioritize core urban districts, key transportation hubs, and high-density areas. The development of multifunctional complexes integrating rail transit stations with commercial, office, and public service facilities can enhance multilevel spatial planning and facilitate urban connectivity.
- For mature cities, integration efforts should align with national regional development strategies to strengthen the influence of core cities, expand metropolitan areas, foster coordinated city cluster development, and establish model cases. For instance, the cross-regional integrated planning of UUS development and URT projects can enhance planning efficiency, implementation effectiveness, and project coordination. Additionally, advanced digital tools such as GISs and BIM can be employed to develop a dynamic monitoring and evaluation system, enabling the real-time tracking of planning implementation and the assessment of construction outcomes.
5.3. Research Limitations and Prospects
Author Contributions
Funding
Institutional Review Board Statement
Informed Consent Statement
Data Availability Statement
Acknowledgments
Conflicts of Interest
Abbreviations
| UUS | urban underground space |
| URT | urban rail transit |
Appendix A
- Principal Investigator: XX
- Student: XX
- Contact: XX
| Indicator Layer | Element Layer |
| Urban underground space (T1) | Intensity of UUS development (T11) |
| Size of UUS per capita (T12) | |
| Social domination of UUS (T13) | |
| Parking undergrounding rate (T14) | |
| Urban rail transit (T2) | Annual average daily passenger flow (T21) |
| Number of lines in operation (T22) | |
| Line density (T23) | |
| Site density (T24) | |
| Passenger flow intensity (T25) | |
| Orbital coverage ratio (T26) | |
| Urban development (T3) | GDP (T31) |
| Percentage of tertiary sector (T32) | |
| Urban travel intensity (T33) | |
| Population density (T34) | |
| Per capita road area (T35) |
- Instructions for Filling in the Form:
| Indicator Layer | Expert Advice |
| Urban underground space (T1) | |
| Urban rail transit (T2) | |
| Urban development (T3) |
| Element Layer | Expert Advice |
| Intensity of UUS development (T11) | |
| Size of UUS per capita (T12) | |
| Social domination of UUS (T13) | |
| Parking undergrounding rate (T14) | |
| Annual average daily passenger flow (T21) | |
| Number of lines in operation (T22) | |
| Line density (T23) | |
| Site density (T24) | |
| Passenger flow intensity (T25) | |
| Orbital coverage ratio (T26) | |
| GDP (T31) | |
| Percentage of tertiary sector (T32) | |
| Urban travel intensity (T33) | |
| Population density (T34) | |
| Per capita road area (T35) |
Appendix B
- Calculate the distance of each scheme from the ideal solution as
- 2.
- Calculate the relative proximity of each scheme as

| Original City Rankings | City | Composite Scores by TOPSIS Method | City Rankings by TOPSIS Method |
|---|---|---|---|
| 1 | Shanghai | 0.775819708 | 1 |
| 2 | Shenzhen | 0.714472286 | 2 |
| 3 | Guangzhou | 0.659983073 | 4 |
| 4 | Beijing | 0.70114961 | 3 |
| 5 | Chengdu | 0.607723432 | 5 |
| 6 | Hangzhou | 0.568776486 | 6 |
| 7 | Wuhan | 0.549764217 | 8 |
| 8 | Nanjing | 0.563295932 | 7 |
| 9 | Xian | 0.432221934 | 9 |
| 10 | Chongqing | 0.368382887 | 13 |
| 11 | Changsha | 0.424254958 | 10 |
| 12 | Suzhou | 0.400978589 | 11 |
| 13 | Zhengzhou | 0.377918788 | 12 |
| 14 | Tianjin | 0.362542509 | 14 |
| 15 | Qingdao | 0.341492953 | 15 |
| 16 | Shenyang | 0.329278396 | 16 |
| 17 | Hefei | 0.316686666 | 18 |
| 18 | Ningbo | 0.322540115 | 17 |
| 19 | Nanchang | 0.314988599 | 19 |
| 20 | Wuxi | 0.301593229 | 21 |
| 21 | Fuzhou | 0.307841198 | 20 |
| 22 | Xiamen | 0.295509466 | 22 |
| 23 | Harbin | 0.281908617 | 24 |
| 24 | Nanning | 0.265353646 | 25 |
| 25 | Foshan | 0.28455352 | 23 |
| 26 | Dalian | 0.263262459 | 26 |
| 27 | Kunming | 0.228906615 | 30 |
| 28 | Shijiazhuang | 0.247254362 | 27 |
| 29 | Guiyang | 0.216047197 | 31 |
| 30 | Xuzhou | 0.236960215 | 29 |
| 31 | Changzhou | 0.23854068 | 28 |
| 32 | Nantong | 0.202068601 | 32 |
| 33 | Hohhot | 0.189549948 | 33 |
| 34 | Jinan | 0.181078053 | 34 |
| 35 | Luoyang | 0.1432042 | 35 |
| 36 | Taiyuan | 0.139112749 | 36 |
| 37 | Urumqi | 0.111142411 | 37 |
| 38 | Dongguan | 0.09890912 | 38 |
Appendix C
| Initial Cluster Center | Final Cluster Center | |||||
|---|---|---|---|---|---|---|
| Cluster_1 | Cluster_2 | Cluster_3 | Cluster_1 | Cluster_2 | Cluster_3 | |
| UUS (T1) | 1.681 | 0.617 | −1.176 | −0.146 | 1.486 | −0.772 |
| URT (T2) | −0.386 | 2.326 | 1.870 | −0.350 | 1.572 | −0.522 |
| Urban development (T3) | 0.470 | −0.746 | 0.278 | 0.446 | 0.880 | −1.256 |
| City | Sum of Distance Ratios of Optimal Solutions S | Maximum Value of Distance Ratio of Optimal Solution R | Benefit Ratio Q | Program Ranking |
|---|---|---|---|---|
| Beijing | 0.2858 | 0.0639 | 0.1076 | 4 |
| Shanghai | 0.2244 | 0.0448 | 0.0002 | 1 |
| Tianjin | 0.6374 | 0.1695 | 0.7103 | 14 |
| Chongqing | 0.6316 | 0.1283 | 0.5723 | 10 |
| Guangzhou | 0.34 | 0.0448 | 0.0854 | 3 |
| Shenzhen | 0.2991 | 0.0525 | 0.0802 | 2 |
| Wuhan | 0.4504 | 0.1264 | 0.432 | 7 |
| Nanjing | 0.4364 | 0.1456 | 0.4841 | 8 |
| Shenyang | 0.6982 | 0.17 | 0.7567 | 16 |
| Dalian | 0.7364 | 0.1868 | 0.8395 | 26 |
| Chengdu | 0.4312 | 0.0837 | 0.2792 | 5 |
| Xian | 0.5758 | 0.1299 | 0.536 | 9 |
| Harbin | 0.7179 | 0.1855 | 0.8217 | 23 |
| Suzhou | 0.5986 | 0.171 | 0.6863 | 12 |
| Zhengzhou | 0.622 | 0.1669 | 0.6904 | 13 |
| Kunming | 0.7711 | 0.185 | 0.8591 | 27 |
| Hangzhou | 0.3923 | 0.1252 | 0.3851 | 6 |
| Foshan | 0.6847 | 0.1969 | 0.834 | 25 |
| Changsha | 0.5675 | 0.1491 | 0.5924 | 11 |
| Ningbo | 0.677 | 0.1808 | 0.7762 | 18 |
| Wuxi | 0.6701 | 0.1908 | 0.8036 | 20 |
| Nanchang | 0.7152 | 0.1801 | 0.8021 | 19 |
| Qingdao | 0.6581 | 0.1751 | 0.7436 | 15 |
| Fuzhou | 0.6919 | 0.1865 | 0.8057 | 21 |
| Dongguan | 0.9009 | 0.1985 | 0.9989 | 38 |
| Nanning | 0.7345 | 0.1818 | 0.8218 | 24 |
| Hefei | 0.6831 | 0.1784 | 0.773 | 17 |
| Shijiazhuang | 0.7525 | 0.1915 | 0.8666 | 28 |
| Guiyang | 0.7838 | 0.19 | 0.8849 | 29 |
| Xiamen | 0.7041 | 0.1875 | 0.8177 | 22 |
| Urumqi | 0.8887 | 0.1988 | 0.991 | 37 |
| Changzhou | 0.7609 | 0.1969 | 0.8905 | 31 |
| Xuzhou | 0.7627 | 0.1958 | 0.8881 | 30 |
| Hohhot | 0.8101 | 0.1972 | 0.9278 | 33 |
| Taiyuan | 0.8605 | 0.1986 | 0.9694 | 36 |
| Luoyang | 0.8565 | 0.1978 | 0.9641 | 35 |
| Nantong | 0.7973 | 0.1987 | 0.9233 | 32 |
| Jinan | 0.8185 | 0.1957 | 0.929 | 34 |
References
- Zhu, H.; Luo, X.; Peng, F.; Li, X.; Liu, C. Development Strategy on Urban Underground Space Planning in China. Chin. J. Eng. Sci. 2017, 19, 12. [Google Scholar] [CrossRef]
- Xu, Y.; Chen, X. The spatial vitality and spatial environments of urban underground space (UUS) in metro area based on the spatiotemporal analysis. Tunn. Undergr. Space Technol. 2022, 123, 104401. [Google Scholar] [CrossRef]
- Peng, F.L.; Qiao, Y.K.; Zhao, J.W.; Liu, K.; Li, J.C. Planning and implementation of underground space in Chinese central business district (CBD): A case of Shanghai Hongqiao CBD. Tunn. Undergr. Space Technol. 2020, 95, 103176. [Google Scholar] [CrossRef]
- Chen, Z.L.; Chen, J.Y.; Liu, H.; Zhang, Z.F. Present status and development trends of underground space in Chinese cities: Evaluation and analysis. Tunn. Undergr. Space Technol. 2018, 71, 253–270. [Google Scholar] [CrossRef]
- Lin, D.; Nelson, J.D.; Cui, J. Exploring influencing factors on metro development in China from urban and economic perspectives. Tunn. Undergr. Space Technol. 2021, 112, 103877. [Google Scholar] [CrossRef]
- Zhao, J.W.; Peng, F.L.; Wang, T.Q.; Zhang, X.Y.; Jiang, B.N. Advances in master planning of urban underground space (UUS) in China. Tunn. Undergr. Space Technol. 2016, 55, 290–307. [Google Scholar] [CrossRef]
- Cui, J.; Lin, D. Utilisation of underground pedestrian systems for urban sustainability. Tunn. Undergr. Space Technol. 2016, 55, 194–204. [Google Scholar] [CrossRef]
- Wang, J.; Duan, H.; Chen, K.; Chan, I.Y.; Xue, F.; Zhang, N.; Chen, X.; Zuo, J. Role of Urban Underground-Space Development in Achieving Carbon Neutrality: A National-Level Analysis in China. Engineering 2024, 45, 212–221. [Google Scholar] [CrossRef]
- Peng, F.L.; Qiao, Y.K.; Sabri, S.; Atazadeh, B.; Rajabifard, A. A collaborative approach for urban underground space development toward sustainable development goals: Critical dimensions and future directions. Front. Struct. Civ. Eng. 2021, 15, 20–45. [Google Scholar] [CrossRef]
- Cui, J. Building three-dimensional pedestrian networks in cities. Undergr. Space 2021, 6, 217–224. [Google Scholar] [CrossRef]
- Yuan, H.; He, Y.; Zhou, J.; Li, Y.; Cui, X.; Shen, Z. Research on compactness ratio model of urban underground space and compact development mechanism of rail transit station affected area. Sustain. Cities Soc. 2020, 55, 102043. [Google Scholar] [CrossRef]
- Zhang, M.; Wang, H.; Dong, Y.; Li, L.; Sun, P.-P.; Zhang, G. Evaluation of urban underground space resources using a negative list method: Taking Xi’an City as an example in China. China Geol. 2020, 3, 124–136. [Google Scholar] [CrossRef]
- Liu, S.C.; Peng, F.L.; Qiao, Y.K.; Zhang, J.B. Evaluating disaster prevention benefits of underground space from the perspective of urban resilience. Int. J. Disaster Risk Reduct. 2021, 58, 102206. [Google Scholar] [CrossRef]
- Qiao, Y.K.; Peng, F.L.; Sabri, S.; Rajabifard, A. Low carbon effects of urban underground space. Sustain. Cities Soc. 2019, 45, 451–459. [Google Scholar] [CrossRef]
- Liu, S.; Ge, J.; Ye, X.; Wu, C.; Bai, M. Urban vitality assessment at the neighborhood scale with geo-data: A review toward implementation. J. Geogr. Sci. 2023, 33, 1482–1504. [Google Scholar] [CrossRef]
- Chen, Y.; Chen, Z.; Guo, D.; Zhao, Z.; Lin, T.; Zhang, C. Underground space use of urban built-up areas in the central city of Nanjing: Insight based on a dynamic population distribution. Undergr. Space 2022, 7, 748–766. [Google Scholar] [CrossRef]
- Xu, Y.; Chen, X. Quantitative analysis of spatial vitality and spatial characteristics of urban underground space (UUS) in metro area. Tunn. Undergr. Space Technol. 2021, 111, 103875. [Google Scholar] [CrossRef]
- Xie, H.; Zhang, Y.; Chen, Y.; Peng, Q.; Liao, Z.; Zhu, J. A case study of development and utilization of urban underground space in Shenzhen and the Guangdong-Hong Kong-Macao Greater Bay Area. Tunn. Undergr. Space Technol. 2021, 107, 103651. [Google Scholar] [CrossRef]
- Peng, F.L.; Dong, Y.H.; Wang, W.X.; Ma, C.X. The next frontier: Data-driven urban underground space planning orienting multiple development concepts. Smart Constr. Sustain. Cities 2023, 1, 3. [Google Scholar] [CrossRef]
- Ma, C.X.; Peng, F.L.; Qiao, Y.K.; Li, H. Evaluation of spatial performance of metro-led urban underground public space: A case study in Shanghai. Tunn. Undergr. Space Technol. 2022, 124, 104484. [Google Scholar] [CrossRef]
- Dou, F.; Li, X.; Xing, H.; Yuan, F.; Ge, W. 3D geological suitability evaluation for urban underground space development—A case study of Qianjiang Newtown in Hangzhou, Eastern China. Tunn. Undergr. Space Technol. 2021, 115, 104052. [Google Scholar] [CrossRef]
- Cao, Z.; Asakura, Y.; Tan, Z. Coordination between node, place, and ridership: Comparing three transit operators in Tokyo. Transp. Res. Part D Transp. Environ. 2020, 87, 102518. [Google Scholar] [CrossRef]
- Wang, W. Design of Public Building Space in Smart City Based on Big Data. J. Environ. Public Health 2022, 2022, 4733901. [Google Scholar] [CrossRef]
- Ma, S.; Zhao, M. Traffic Flow Prediction and Analysis in Smart Cities Based on the WND-LSTM Model. Comput. Intell. Neurosci. 2022, 2022, 1–9. [Google Scholar] [CrossRef]
- Sun, L.; Leng, J. Research on influencing factors of travel in underground space based on multi-source data: Spatial optimization design for low-carbon travel. Energy Build. 2021, 253, 111524. [Google Scholar] [CrossRef]
- Liu, Y.; Dai, F.; Pei, P. A wing-crack extension model for tensile response of saturated rocks under coupled static-dynamic loading. Int. J. Rock Mech. Min. Sci. 2021, 146, 104893. [Google Scholar] [CrossRef]
- Li, X.; Xu, H.; Li, C.; Sun, L.; Wang, R. Study on the demand and driving factors of urban underground space use. Tunn. Undergr. Space Technol. 2016, 55, 52–58. [Google Scholar] [CrossRef]
- Hámor-Vidó, M.; Hámor, T.; Czirok, L. Underground space, the legal governance of a critical resource in circular economy. Resour. Policy 2021, 73, 102171. [Google Scholar] [CrossRef]
- Su, S.; Zhang, H.; Wang, M.; Weng, M.; Kang, M. Transit-oriented development (TOD) typologies around metro station areas in urban China: A comparative analysis of five typical megacities for planning implications. J. Transp. Geogr. 2021, 90, 102939. [Google Scholar] [CrossRef]
- Zhang, Y.; Zhu, J.; Liao, Z.; Guo, J.; Xie, H.; Peng, Q. An intelligent planning model for the development and utilization of urban underground space with an application to the Luohu District in Shenzhen. Tunn. Undergr. Space Technol. 2021, 112, 103933. [Google Scholar] [CrossRef]
- Wang, K.; Jiang, C.; Ng, A.K.Y.; Zhu, Z. Air and rail connectivity patterns of major city clusters in China. Transp. Res. Part A Policy Pract. 2020, 139, 35–53. [Google Scholar] [CrossRef]
- Delmelle, E.; Nilsson, I. New rail transit stations and the out-migration of low-income residents. Urban Stud. 2020, 57, 134–151. [Google Scholar] [CrossRef]
- Berawi, M.A.; Miraj, P.; Saroji, G.; Sari, M. Impact of rail transit station proximity to commercial property prices: Utilizing big data in urban real estate. J. Big Data 2020, 7, 71. [Google Scholar] [CrossRef]
- Lee, J.K. New rail transit projects and land values: The difference in the impact of rail transit investment on different land types, values and locations. Land Use Policy 2022, 112, 105807. [Google Scholar] [CrossRef]
- Quiroz Villanueva, M.J.; Guglielmi, F.; De Fabiis, F.; Coppola, P. Social and Economic Impacts of Transportation Multi-Modal and Multi-Service Hub Development. Sustainability 2025, 17, 1767. [Google Scholar] [CrossRef]
- Li, Z.; Lu, Y.; Zhuang, Y.; Yang, L. Influencing factors of spatial vitality in underground space around railway stations: A case study in Shanghai. Tunn. Undergr. Space Technol. 2024, 147, 105730. [Google Scholar] [CrossRef]
- Hong, X.; Ji, X. Spatial Pattern of Underground Space Development in Major Cities in China: Evaluation and Analysis. Math. Probl. Eng. 2021, 2021, 1–21. [Google Scholar] [CrossRef]
- Tao, Z.; Shu, Y.; Yang, X.; Peng, Y.; Chen, Q.; Zhang, H. Physical model test study on shear strength characteristics of slope sliding surface in Nanfen open-pit mine. Int. J. Min. Sci. Technol. 2020, 30, 421–429. [Google Scholar] [CrossRef]
- Ma, C.X.; Peng, F.L.; Zhang, J.B.; Wang, T.Q. Evaluation of Spatial Performance of Urban Underground Public Space: A Case Study of Wujiaochang Sub-center in Shanghai. IOP Conf. Ser. Earth Environ. Sci. 2021, 703, 012013. [Google Scholar] [CrossRef]
- Rodríguez, D.A.; Kang, C.D. A typology of the built environment around rail stops in the global transit-oriented city of Seoul, Korea. Cities 2020, 100, 102663. [Google Scholar] [CrossRef]
- Mavrikos, A.; Kaliampakos, D. An integrated methodology for estimating the value of underground space. Tunn. Undergr. Space Technol. 2021, 109, 103770. [Google Scholar] [CrossRef]
- Dong, Y.H.; Peng, F.L.; Zha, B.H.; Qiao, Y.K.; Li, H. An intelligent layout planning model for underground space surrounding metro stations based on NSGA-II. Tunn. Undergr. Space Technol. 2022, 128, 104648. [Google Scholar] [CrossRef]
- Hou, Q.; Xing, Y.; Wang, D.; Liu, J.; Fan, X.; Duan, Y. Study on coupling degree of rail transit capacity and land use based on multivariate data from cloud platform. J. Cloud Comput. 2020, 9, 4. [Google Scholar] [CrossRef]
- Dong, Y.H.; Peng, F.L.; Guo, T.F. Quantitative assessment method on urban vitality of metro-led underground space based on multi-source data: A case study of Shanghai Inner Ring area. Tunn. Undergr. Space Technol. 2021, 116, 104108. [Google Scholar] [CrossRef]
- Wang, Y.; Li, J.; Zhang, G.; Li, Y.; Asare, M.H. Fuzzy evaluation of comprehensive benefit in urban renewal based on the perspective of core stakeholders. Habitat Int. 2017, 66, 163–170. [Google Scholar] [CrossRef]
- Zhang, L.; Liang, T.; Wei, X.; Wang, H. An improved indicator standardization method for multi-indicator composite evaluation: A case study in the evaluation of ecological civilization construction in China. Environ. Impact Assess. Rev. 2024, 108, 107600. [Google Scholar] [CrossRef]
- Lu, L.; Chen, J.; Liu, Y.; Xu, L.; Ding, Y. Optimizing building energy conservation by balancing energy savings and construction costs of two passive techniques using the VIKOR method: A case study in Chongqing. J. Build. Eng. 2025, 101, 111885. [Google Scholar] [CrossRef]
- Fahim, A.M.; Salem, A.M.; Torkey, F.A.; Ramadan, M.A. An efficient enhanced k-means clustering algorithm. J. Zhejiang Univ.-Sci. A 2006, 7, 1626–1633. [Google Scholar] [CrossRef]
- Lai, Y.; Wang, Y.; Cheng, J.; Chen, X.; Liu, Q. Review of constraints and critical success factors of developing urban underground space. Undergr. Space 2023, 12, 137–155. [Google Scholar] [CrossRef]
- Darroch, N.; Beecroft, M.; Nelson, J.D. A qualitative analysis of the interfaces between urban underground metro infrastructure and its environment in London. Tunn. Undergr. Space Technol. 2021, 114, 103930. [Google Scholar] [CrossRef]
- Peng, J.; Peng, F.L.; Yabuki, N.; Fukuda, T. Factors in the development of urban underground space surrounding metro stations: A case study of Osaka, Japan. Tunn. Undergr. Space Technol. 2019, 91, 103009. [Google Scholar] [CrossRef]
- Lee, E.H.; Luo, C.; Sam, Y.L.; Roberts, A.C.; Kwok, K.W.; Car, J.; Soh, C.-K.; Christopoulos, G.I. The underground workspaces questionnaire (UWSQ): Investigating public attitudes toward working in underground spaces. Build. Environ. 2019, 153, 28–34. [Google Scholar] [CrossRef]
- Debrock, S.; Van Acker, M.; Admiraal, H. Design recommendations for sustainable urban underground spaces. Tunn. Undergr. Space Technol. 2023, 140, 105332. [Google Scholar] [CrossRef]
- Tucker, W. Crossrail project: The execution strategy for delivering London’s Elizabeth line. Proc. Inst. Civil. Eng.-Civil. Eng. 2017, 170, 3–14. [Google Scholar] [CrossRef]
- Vichiensan, V.; Ponkhonburi, T.; Kii, M.; Hayashi, Y. Association of the TOD Measures around Rail Transit Stations in Bangkok Metropolitan. Transp. Res. Procedia 2025, 82, 2834–2849. [Google Scholar] [CrossRef]
- Coppola, P.; De Fabiis, F.; Silvestri, F. Urban Air Mobility demand forecasting: Modeling evidence from the case study of Milan (Italy). Eur. Transp. Res. Rev. 2025, 17, 2. [Google Scholar] [CrossRef]
- Lee, J.; Tommy Gim, T.H. Reconsidering AVs future: A socio-spatial perspective. Technol. Soc. 2024, 78, 102618. [Google Scholar] [CrossRef]


| Indicator Layer | Element Layer | Meaning and Calculation Method | Reference |
|---|---|---|---|
| UUS (T1) | Intensity of UUS development (T11) | Indicator measuring the orderly and connotative development of UUS resource utilization; the higher the development intensity, the higher the economic efficiency of land use. Calculated as UUS construction area/urban area | [1,9,16,21,26] |
| Size of UUS per capita (T12) | Per capita ownership of underground space floor space. Calculated as total UUS area/resident population | [11,12,14,17,20,26] | |
| Social domination of UUS (T13) | Indicator measuring the social-led or policy-led character of UUS development. Calculated as area of urban public underground space (minus the scale of human defense works)/total area of UUS | [14,19,41] | |
| Parking undergrounding rate (T14) | Indicator measuring the functional structure of urban underground space and the rational allocation of infrastructure. Calculated as underground parking spaces/actual total parking spaces in the city | [13,16,19,25] | |
| URT (T2) | Annual average daily passenger flow (T21) | The daily average of cumulative passenger traffic on the transportation system throughout the year. Calculated as total annual passenger volume/365 | [20,22,25,29,31] |
| Number of lines in operation (T22) | Total number of lines actually operating in the URT system, which measures the size of the URT network. | [21,22,26,29] | |
| Line density (T23) | Density of operating lines in the URT network. Calculated as total line length/built-up area of the city | [20,27,29,31] | |
| Site density (T24) | Density of all service stations installed in the URT system, reflecting the size of the nodes covered by the network. Calculated as total number of stations/built-up area of the city | [20,24,28] | |
| Passenger flow intensity (T25) | Annual passenger flow per unit of line length, used to measure the efficiency of line utilization. Calculated as total annual passenger flow/total length of the line | [23,24,29] | |
| Orbital coverage ratio (T26) | Space share of area covered within the service radius of the station. Calculated as area of built-up land within 800 m of URT station/total area | [42] | |
| Urban development (T3) | GDP (T31) | Reflecting the level of regional economic development. Calculated as regional GDP/total population | [18,28] |
| Percentage of tertiary sector (T32) | The share of the service sector in the structure of the regional economy. Calculated as value added of the tertiary industry/regional GDP | [18,28] | |
| Urban travel intensity (T33) | Average frequency of transportation trips per unit of population, which is used to reflect the level of transportation demand in the city. Calculated as total number of trips in the city/total population | [43] | |
| Population density (T34) | Number of people per unit area. Calculated as total urban population/area of administrative area | [35,44] | |
| Per capita road area (T35) | Urban road area allocated per unit of population. Calculated as total road area/total urban population | [35,39,40] |
| Indicator Layer | Weights | Element Layer | Group Weights | Combined Weights |
|---|---|---|---|---|
| UUS (T1) | 0.256 | Intensity of UUS development (T11) | 0.2574 | 0.066 |
| Size of UUS per capita (T12) | 0.1788 | 0.046 | ||
| Social domination of UUS (T13) | 0.2537 | 0.065 | ||
| Parking undergrounding rate (T14) | 0.3101 | 0.079 | ||
| URT (T2) | 0.531 | Annual average daily passenger flow (T21) | 0.3742 | 0.199 |
| Number of lines in operation (T22) | 0.2116 | 0.112 | ||
| Line density (T23) | 0.0991 | 0.053 | ||
| Site density (T24) | 0.0706 | 0.037 | ||
| Passenger flow intensity (T25) | 0.1145 | 0.061 | ||
| Orbital coverage ratio (T26) | 0.1300 | 0.069 | ||
| Urban development (T3) | 0.213 | GDP (T31) | 0.2426 | 0.052 |
| Percentage of tertiary sector (T32) | 0.1971 | 0.042 | ||
| Urban travel intensity (T33) | 0.1303 | 0.028 | ||
| Population density (T34) | 0.3001 | 0.064 | ||
| Per capita road area (T35) | 0.1299 | 0.028 |
| Mean ± Standard Deviation | |||
|---|---|---|---|
| Cluster_1 (n = 18) | Cluster_2 (n = 8) | Cluster_3 (n = 12) | |
| UUS (T1) | 0.08 ± 0.03 | 0.16 ± 0.05 | 0.04 ± 0.02 |
| URT (T2) | 0.12 ± 0.06 | 0.36 ± 0.09 | 0.10 ± 0.07 |
| Urban development (T3) | 0.11 ± 0.01 | 0.12 ± 0.01 | 0.07 ± 0.01 |
| Clustering Category | Frequency | Percentage | Cluster Content |
|---|---|---|---|
| Developing | 18 | 47.37% | Tianjin, Xian, Harbin, Suzhou, Zhengzhou, Foshan, Changsha, Ningbo, Wuxi, Qingdao, Fuzhou, Hefei, Shijiazhuang, Xiamen, Changzhou, Hohhot, Nantong, and Jinan |
| Mature | 8 | 21.05% | Beijing, Shanghai, Guangzhou, Shenzhen, Wuhan, Nanjing, Chengdu, and Hangzhou |
| Underdeveloped | 12 | 31.58% | Chongqing, Dalian, Shenyang, Kunming, Nanchang, Dongguan, Nanning, Guiyang, Urumqi, Xuzhou, Taiyuan, and Luoyang |
| Aggregate | 38 | 100% | - |
| Mean | Standard Deviation | UUS (T1) | URT (T2) | Urban Development (T3) | |
|---|---|---|---|---|---|
| UUS (T1) | 0.084 | 0.051 | 1 | ||
| URT (T2) | 0.167 | 0.125 | 0.683 * | 1 | |
| Urban development (T3) | 0.100 | 0.020 | 0.559 * | 0.432 * | 1 |
Disclaimer/Publisher’s Note: The statements, opinions and data contained in all publications are solely those of the individual author(s) and contributor(s) and not of MDPI and/or the editor(s). MDPI and/or the editor(s) disclaim responsibility for any injury to people or property resulting from any ideas, methods, instructions or products referred to in the content. |
© 2025 by the authors. Licensee MDPI, Basel, Switzerland. This article is an open access article distributed under the terms and conditions of the Creative Commons Attribution (CC BY) license (https://creativecommons.org/licenses/by/4.0/).
Share and Cite
Yang, M.; Zhu, Y.; Ji, X.; Wang, J.; Fang, H. Study on Development Pattern and Comprehensive Evaluation of Integration of Urban Underground Space and Rail Transit in China. Sustainability 2025, 17, 2497. https://doi.org/10.3390/su17062497
Yang M, Zhu Y, Ji X, Wang J, Fang H. Study on Development Pattern and Comprehensive Evaluation of Integration of Urban Underground Space and Rail Transit in China. Sustainability. 2025; 17(6):2497. https://doi.org/10.3390/su17062497
Chicago/Turabian StyleYang, Mengchen, Yusong Zhu, Xiang Ji, Jiuxin Wang, and Huanhuan Fang. 2025. "Study on Development Pattern and Comprehensive Evaluation of Integration of Urban Underground Space and Rail Transit in China" Sustainability 17, no. 6: 2497. https://doi.org/10.3390/su17062497
APA StyleYang, M., Zhu, Y., Ji, X., Wang, J., & Fang, H. (2025). Study on Development Pattern and Comprehensive Evaluation of Integration of Urban Underground Space and Rail Transit in China. Sustainability, 17(6), 2497. https://doi.org/10.3390/su17062497