Article

Enhancing Sustainable Flood Resilience and Energy Efficiency in Residential Structures: Integrating Hydrological Data, BIM, and GIS in Quetta, Pakistan

1
Key Laboratory of Mountain Hazards and Earth Surface Process, Institute of Mountain Hazard and Environment, Chinese Academy of Sciences, Chengdu 610041, China
2
Department of Civil Engineering Technology, National Skills University, Islamabad 44000, Pakistan
3
China-Pakistan Joint Research Centre on Earth Science (CPJRC), Chinese Academy of Sciences, Islamabad 44000, Pakistan
4
Department of Earth Science, The Haripur University, Haripur 22620, Pakistan
5
State Key Laboratory of Mountain Hazards and Engineering Resilience, Institute of Mountain Hazards and Environment, Chinese Academy of Sciences, Chengdu 610299, China
*
Authors to whom correspondence should be addressed.
Sustainability 2025, 17(6), 2496; https://doi.org/10.3390/su17062496
Submission received: 30 December 2024 / Revised: 30 January 2025 / Accepted: 5 February 2025 / Published: 12 March 2025

Abstract

:
This study explores the integration of Building Information Modeling (BIM) and Geographic Information Systems (GISs) to enhance sustainable energy efficiency and flood resilience in residential buildings, with a case study from Quetta, Pakistan. The research leverages BIM to optimize energy performance through scenario-based energy consumption assessments, thermal efficiency, material properties, and groundwater considerations, ensuring structural integrity against water infiltration. Enhanced insulation and double-glazed windows reduced energy use by 11.78% and 5.8%, respectively, with monthly energy cost savings of up to 48.2%. GIS tools were employed for high-resolution flood risk analysis, utilizing Digital Elevation Models (DEMs) and hydrological data to simulate flood scenarios with depths of up to 2 m, identifying vulnerabilities and estimating non-structural damage costs at PKR 250,000 (~10% of total building costs). Groundwater data were also incorporated to evaluate their impact on foundation stability, ensuring the building’s resilience to surface and subsurface water challenges. A novel BIM-GIS integration framework provided precise 2D and 3D visualizations of flood impacts, facilitating accurate damage assessments and cost-effective resilience planning. The findings demonstrated that incorporating flood-resistant materials and design modifications could reduce repair costs by 30–50%, highlighting the cost-efficiency of sustainable resilience strategies. This research advances sustainable and resilient construction practices by showcasing the dual potential of BIM-GIS integration to address energy efficiency and groundwater-related structural vulnerabilities alongside hazard mitigation challenges. Future applications include automating workflows, integrating renewable energy systems, and validating models across diverse climatic regions to promote the global adoption of innovative urban planning solutions.

1. Introduction

Building Information Modeling (BIM) has revolutionized the global Architecture, Engineering, and Construction (AEC) industry by offering a collaborative platform for integrating design, structural analysis, and facility management data across various project stakeholders [1]. With growing environmental concerns and the demand for sustainable buildings, BIM has been increasingly utilized for energy analysis, providing a digital framework for assessing and optimizing the energy performance of buildings. According to the International Energy Agency (2020), the building sector accounts for approximately 40% of global energy consumption and 36% of carbon emissions. BIM technologies enable stakeholders to simulate energy performance, identify energy-saving opportunities, and make data-driven decisions that enhance design and operational efficiencies [1,2,3]. Its ability to model systems such as lighting, heating, ventilation, and renewable energy integration has made BIM indispensable for architects and engineers striving to meet global energy efficiency standards [4,5,6].
Globally, countries have adopted BIM as a part of their regulatory frameworks to meet energy efficiency goals. In the European Union, the Energy Performance of Buildings Directive (EPBD) mandates nearly zero-energy building (nZEB) standards, and BIM has proven instrumental in meeting these stringent requirements (European Commission, 2018). BIM supports certifications like LEED and Energy Star in the United States, driving sustainable construction practices (Autodesk, headquartered in San Francisco, CA, USA, 2017). Similarly, emerging economies such as China, India, and Brazil have begun integrating BIM into national energy strategies to address urbanization and rising energy demand [7,8]. These examples demonstrate BIM’s transformative potential in advancing energy efficiency, sustainability, and cost savings across the AEC industry [7,9].
In Pakistan, BIM adoption is still in its early stages, particularly in the context of energy efficiency. The National Energy Efficiency and Conservation Act of 2016 established the Pakistan Energy Efficiency and Conservation Board (PEECB) to promote energy-efficient practices (Government of Pakistan, 2016). However, while BIM has been employed in some large-scale, internationally funded construction projects, its broader adoption remains limited. Challenges such as high initial software costs, limited technical expertise, and insufficient training hinder widespread use, particularly in the residential sector [10]. Many professionals remain unfamiliar with advanced energy modeling techniques, resulting in missed opportunities for optimizing building energy efficiency [6,11]. Additionally, weak enforcement of energy regulations means that BIM performance assessments are not yet mandated, further delaying its adoption [10,12].
The innovation of this study lies in its holistic approach to simultaneously enhancing energy efficiency and flood resilience through the integration of BIM and GIS. By combining energy performance simulations with flood risk assessments, this research provides a unified framework that considers both static building attributes and dynamic environmental factors, including groundwater impacts. This dual focus not only advances the current understanding of BIM-GIS applications but also offers practical solutions for improving building sustainability and resilience in flood-prone areas.
This research focuses on Quetta, the capital city of Balochistan province in Pakistan, as a case study to evaluate these challenges and opportunities. Quetta’s unique geomorphological and climatic characteristics, combined with its rapid urbanization and vulnerability to floods, make it an ideal testbed for integrating BIM and Geographic Information Systems (GIS) to address energy efficiency and flood resilience. The city, home to approximately 2.27 million people as of the 2017 census [12], is situated at an average elevation of 1,680 meters above sea level. Its semi-arid climate features hot summers and cold winters, necessitating significant energy consumption for heating and cooling. Additionally, Quetta experiences annual rainfall of 250–300 mm, primarily during the monsoon and winter seasons, leading to frequent flash floods due to inadequate drainage infrastructure and low-permeability soils.
Quetta is characterized by residential construction that predominantly consists of reinforced concrete frame (RCF) buildings with masonry infills, which often exhibit low thermal performance. Housing units range from single-story homes to eight-story apartment buildings, with built areas typically varying between 70 and 200 square meters per unit. This typology reflects a lack of energy-efficient designs and materials, exacerbating energy consumption and carbon emissions. The city’s geomorphological features, such as its valley terrain surrounded by mountain ranges, and its susceptibility to tectonic activity and poor drainage systems, further intensify its vulnerability to floods. Despite these challenges, public policies addressing flood resilience and energy efficiency remain underdeveloped, emphasizing the need for innovative solutions like BIM and GIS integration.
This research aims to address these challenges by evaluating the effectiveness of BIM-integrated software in conducting energy analysis for residential buildings in Pakistan. The study investigates how BIM can optimize energy performance through case studies and energy simulations and offers policy recommendations to encourage its adoption. Moreover, this study introduces the integration of BIM with Geographic Information Systems (GISs) to enable a more comprehensive assessment of flood damage to buildings. While GISs excel in large-scale spatial analysis and flood mapping, they lack the detailed building-specific information BIM provides. By combining the two technologies, the research bridges gaps in traditional Flood Damage Assessment (FDA) methods, which often fail to account for unique building attributes, groundwater-related factors, and site-specific damage locations [13]. This dual focus on energy efficiency and flood resilience enhances the applicability of BIM in tackling critical environmental challenges.
Risk-based flood management, traditionally reliant on damage curves and large-scale GIS analyses, has evolved to incorporate more precise micro-level assessments [14,15,16]. This research leverages BIM’s detailed 3D modeling capabilities and GISs’ spatial analysis tools to evaluate flood impacts on individual buildings, allowing for accurate cost estimations and damage modeling. A case study of a residential building in Quetta demonstrates this integration, combining high-resolution Digital Elevation Models (DEMs), hydrological data, groundwater considerations, and spatial–temporal flood parameters to identify flood-prone zones and assess infrastructure vulnerability. Ultimately, this study seeks to bridge gaps in BIM adoption for energy efficiency and flood resilience, providing a roadmap for its transformative use in Pakistan’s construction industry. Exploring BIM-GIS integration underscores the potential for advancing sustainable and resilient design practices tailored to the country’s unique environmental and regulatory context.

2. Materials and Methods

This study integrates advanced Building Information Modeling (BIM) techniques with Geographic Information Systems (GISs) to quantitatively evaluate the energy performance and flood resilience of residential structures in Quetta, Pakistan (Figure 1a). Integrating Building Information Modeling (BIM) with Geographic Information Systems (GIS) enables a comprehensive analysis of both the internal and external factors affecting a building’s performance. BIM provides detailed insights into a building’s structural and energy characteristics, while GIS offers contextual environmental data, such as topography and flood zones. Combining these technologies facilitates the development of models that simultaneously address energy efficiency and flood resilience, leading to more sustainable and resilient building designs.
Figure 1 illustrates the foundational datasets used in this study and Figure 1a represents the DEM of Quetta, highlighting the potential flood flow and drainage network within the study area. The potential flood flow is classified into three categories: low risk (green triangles), medium risk (yellow triangles), and high risk (red triangles) the data has been obtained from the Baluchistan flood department. Major settlements are marked with circular points, and drainage lines are shown to depict water flow pathways. The grayscale DEM values indicate elevation, with lighter tones representing higher elevations and darker tones representing lower elevations. This analysis underscores the spatial distribution of flood-prone zones and their proximity to key settlements, serving as a critical tool for risk assessment and flood management within the region (Figure 1b). The methodology employs a three-phase process encompassing energy simulation, hydrological risk modeling, and the seamless integration of BIM and GIS for comprehensive spatial–temporal assessments. Figures and tables cited throughout this section illustrate critical workflows, input parameters, and analytical outcomes, providing a robust framework for urban resilience analysis (Figure 1c).

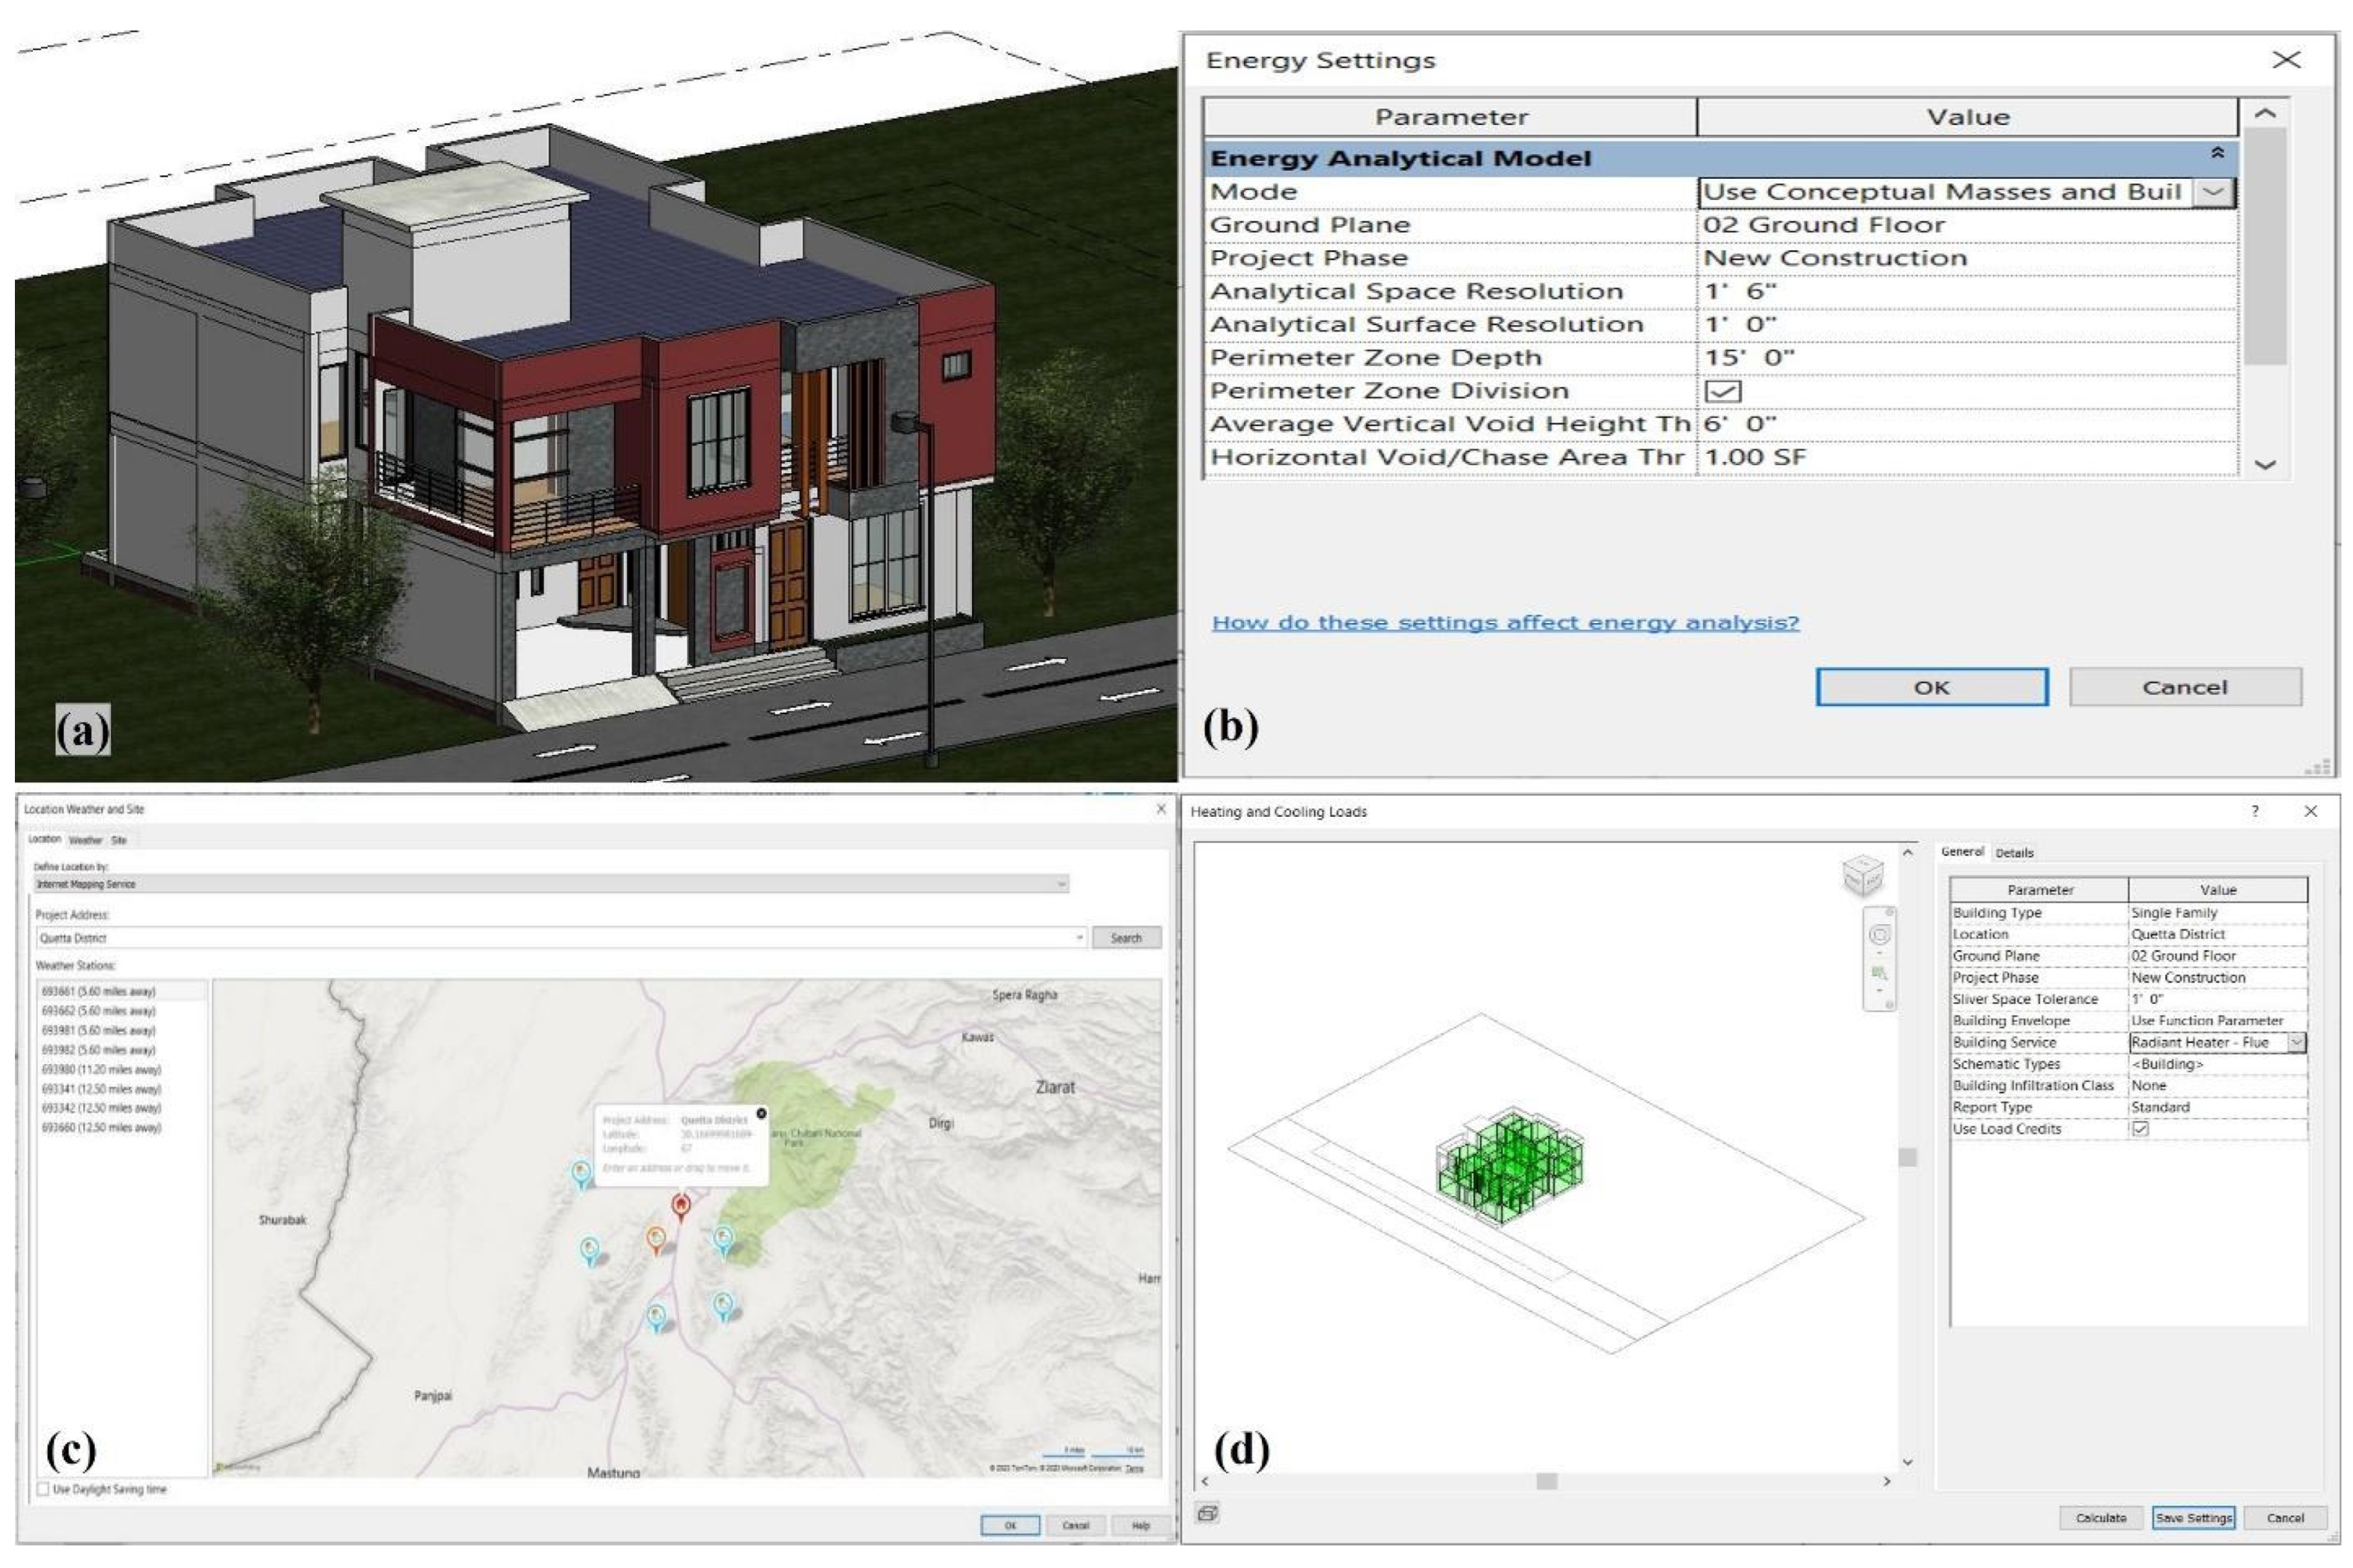
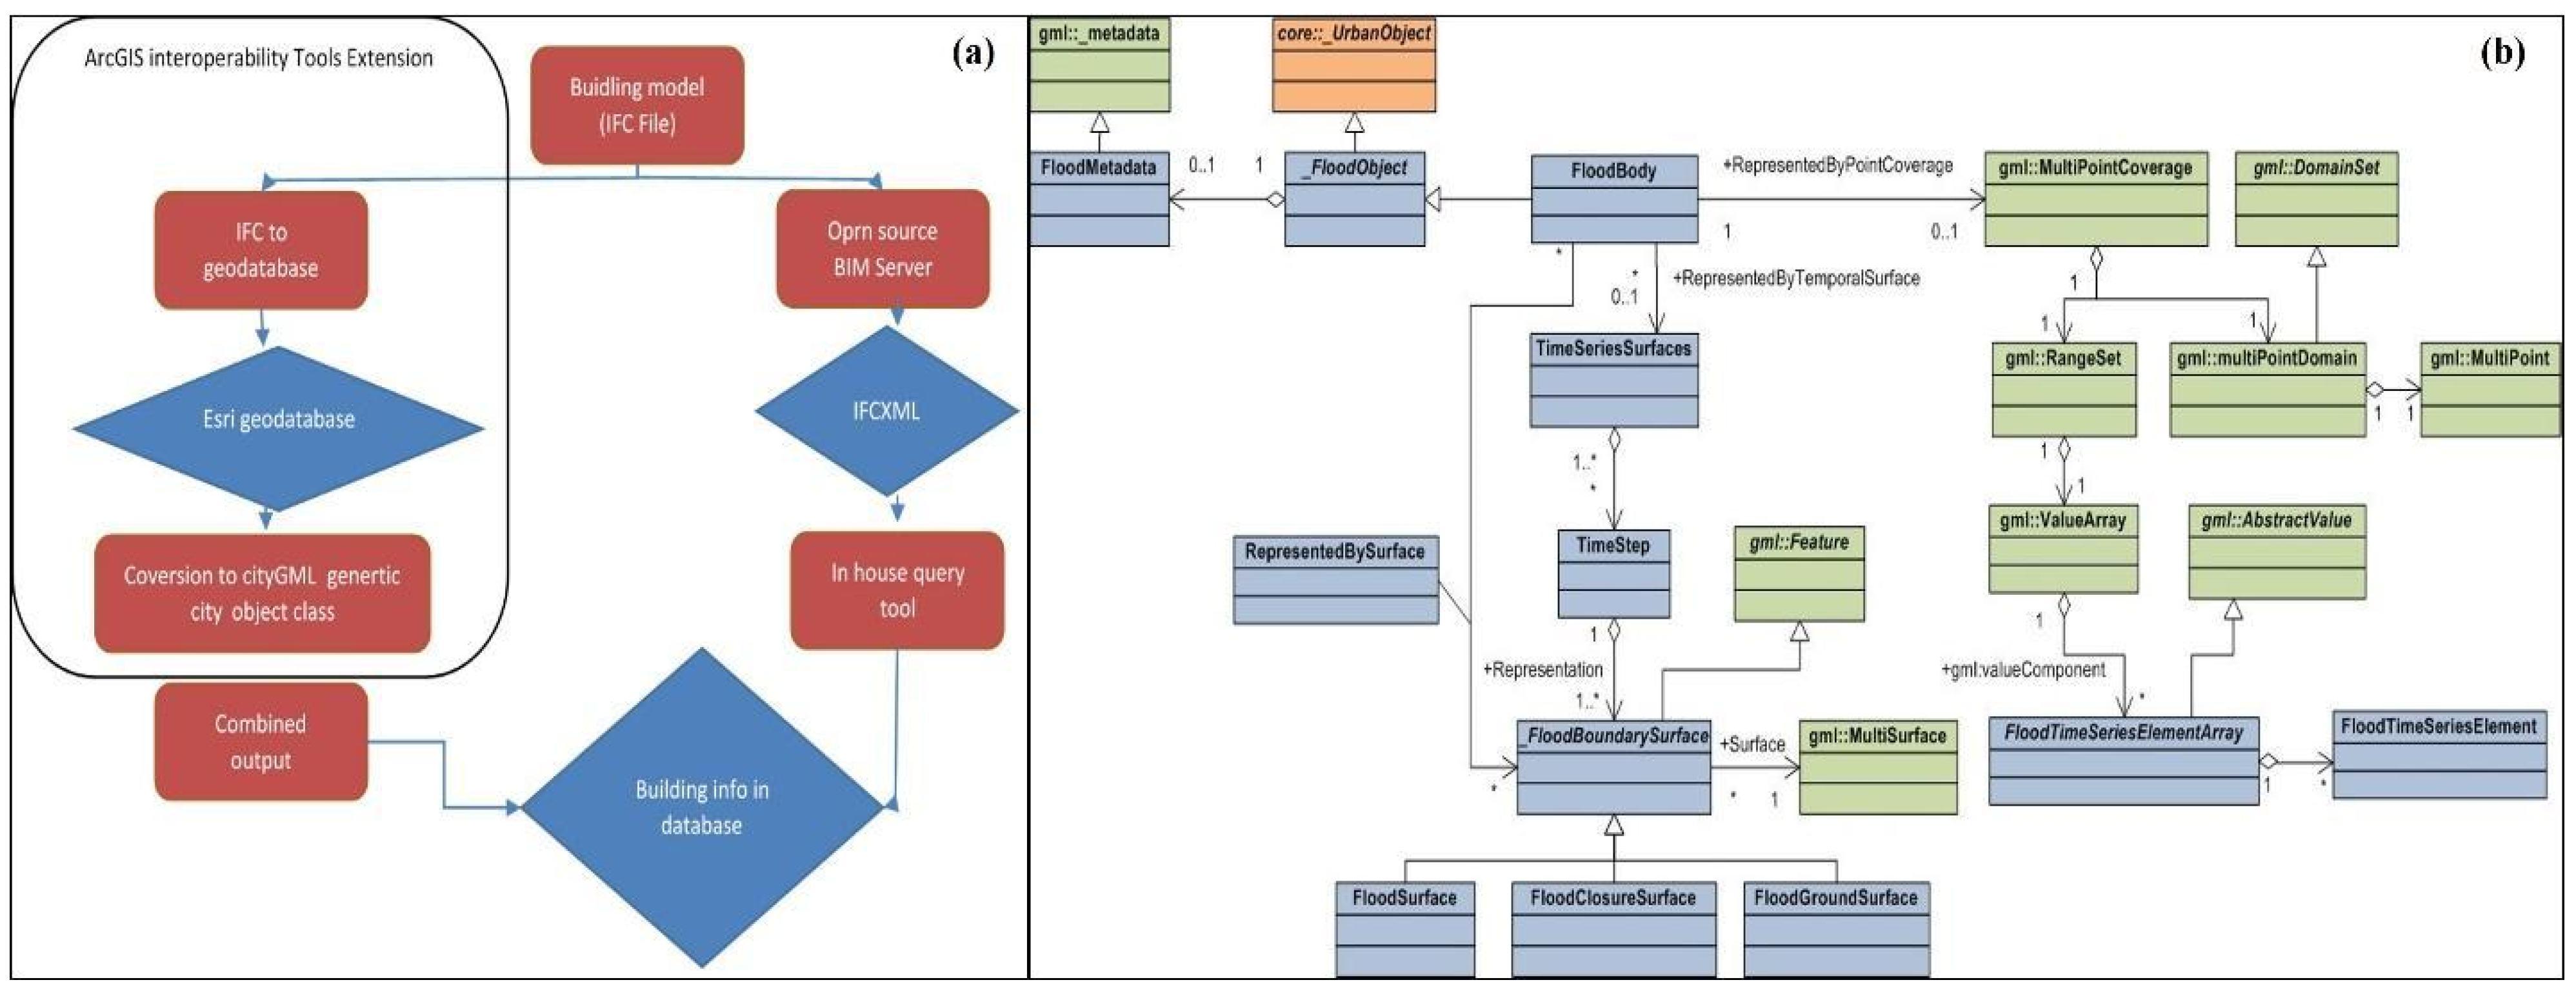
2.1. Integrated BIM-GIS Workflow

Energy Performance Analysis:
The Building Information Modeling (BIM) utilized for this study adhered to Level of Development (LOD) 300 standards. This level ensured that all components were accurately represented in terms of geometry, spatial relationships, and basic material specifications, as required for energy performance simulations and integration with GIS tools. A detailed 3D building model was developed in Autodesk Revit to serve as the basis for energy performance simulations (Figure 2a). This model included key architectural features such as thermal properties, spatial configurations, and material specifications tailored to the climatic conditions of Quetta. Input parameters (Figure 2b), systematically outlined in Table 1, were pivotal in defining the simulation environment within Green Building Studio (Figure 2c,d). These parameters encompassed critical aspects such as building typology, orientation, envelope properties, and localized weather data, which collectively shaped the energy simulation. The table includes industry-standard values, such as infiltration airflow rates and sensible heat gain per person, grounded in authoritative guidelines like ASHRAE and the International Residential Code (IRC). These standards not only informed the simulation’s accuracy but also ensured compliance with global energy efficiency benchmarks.
As shown in Figure 3, The energy simulations focused on evaluating seasonal heating and cooling loads (Figure 3a,b), which were visualized to provide clear insights into energy demand variations throughout the year. The methodology adopted an iterative optimization process, refining design features like glazing properties, insulation materials, and Solar Heat Gain Coefficients (SHGC). This iterative approach was aligned with ASHRAE Standard 90.1-2022 [18] to meet stringent energy efficiency standards. Key factors, such as Quetta’s meteorological conditions—including temperature fluctuations, wind speed, and direction—were integrated to optimize ventilation strategies and insulation designs (Figure 3c,d).
These computational techniques offered actionable insights into improving energy efficiency in residential construction. For example, the analysis identified potential design improvements that could minimize heating and cooling demands while maintaining indoor thermal comfort. This phase demonstrated the effectiveness of using a data-driven methodology to align energy performance assessments with real-world challenges. Furthermore, the integration of BIM tools with energy simulation software provided a scalable framework for urban energy efficiency improvements, particularly relevant in flood-prone regions like Quetta, where climatic conditions exacerbate energy demands.

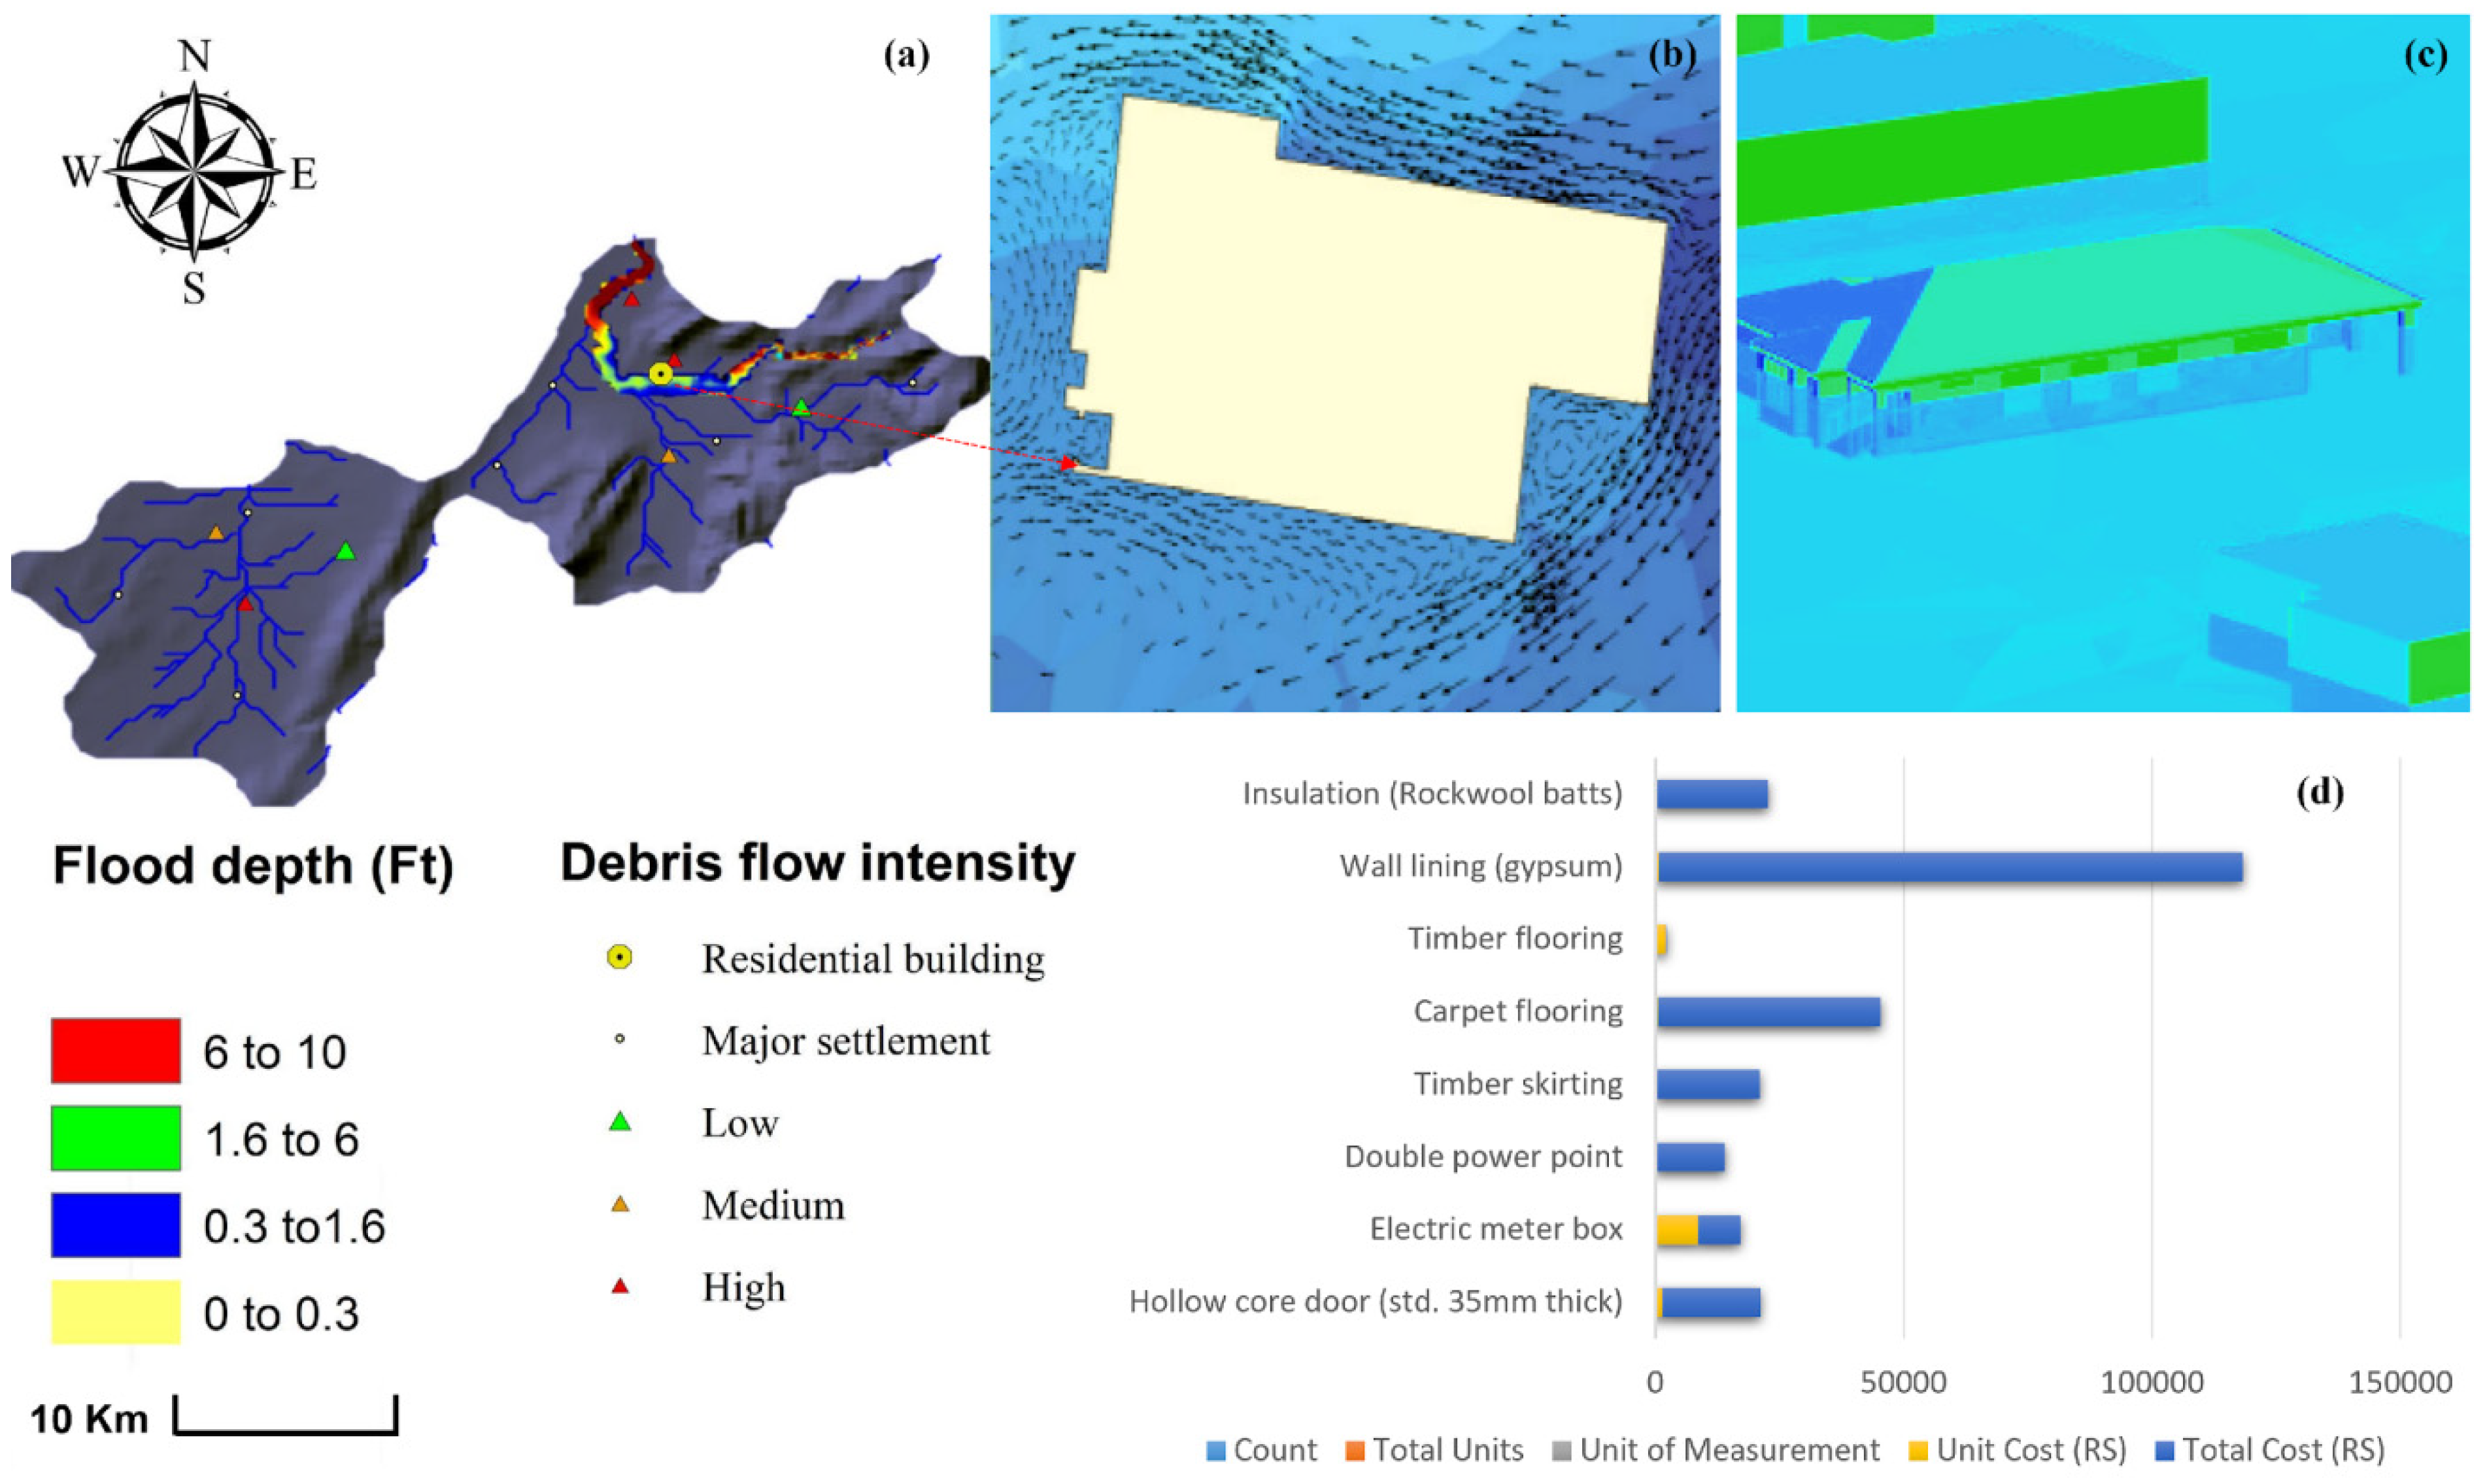
2.2. Hydrological Risk Assessment

Flood hazard modeling was carried out using high-resolution Digital Elevation Models (DEM), capturing elevation gradients that ranged from 1,438 to 3,411 meters across the study area. This topographic data served as a critical input for identifying flood-prone zones and understanding water flow dynamics. DEMs were complemented by hydrological datasets, including drainage patterns, flow velocities, soil permeability, and precipitation records, which together enabled a detailed simulation of flood extents, depths, and velocities. These datasets were processed through advanced hydrological modeling tools, integrating both spatial and temporal flood parameters to offer a robust representation of potential flooding scenarios. The flood modeling methodology accounted for various rainfall intensities and durations to simulate extreme weather conditions, which are increasingly frequent due to climate change. The map illustrates areas with varying flood risks based on elevation and drainage patterns, making it an integral component of the flood modeling analysis presented in Figure 4.
Spatial overlays were used to map flood extents, combining DEM outputs with precipitation and drainage models to highlight critical areas of urban vulnerability (Figure 4a). Flow accumulation and velocity maps were generated to assess the dynamics of water movement across Quetta’s terrain, identifying areas prone to rapid inundation or prolonged water retention.
To evaluate the potential impact of flooding on residential structures, structural vulnerability assessments were integrated into the flood risk model. This involved a detailed analysis of building components such as walls, flooring, insulation, and utilities. Damage estimation protocols adhered to Pakistani engineering standards and guidelines, ensuring localized relevance and accuracy (Figure 4b). The study also incorporated socio-economic factors by estimating the financial implications of various flood scenarios. For example, flooding with depths exceeding 2 meters was found to cause non-structural damages estimated at Rs. 250,000 (~10% of total building costs) for a single residential unit. Table 2 outlines the spatial and structural parameters used in these assessments, including terrain characteristics, building footprints, and material properties, which were crucial for linking hydrological data with structural vulnerabilities.
The findings identified high-risk zones within Quetta and provided specific recommendations for disaster preparedness and mitigation. Proposed strategies included the use of flood-resistant materials, elevation of floor levels, and improved drainage infrastructure to minimize future damage. Additionally, 3D floods visualizations offered an effective medium for communicating risks and mitigation strategies to stakeholders, providing urban planners and policymakers with actionable insights. This phase linked hydrological data with structural and spatial analyses, ensuring a comprehensive understanding of flood impacts on urban infrastructure. The integration of BIM and GIS technologies further enhanced the granularity of these assessments, enabling precise, building-specific evaluations critical for designing resilient urban environments.

2.3. BIM-GIS Integration for Multi-Hazard Analysis

Integrating BIM and GIS facilitated a multidimensional analysis of energy and flood risks. The BIM model, exported in the IFC format, was imported into ArcGIS for spatial analysis, enabling the synthesis of energy performance metrics with flood hazard data (Figure 4a). This seamless workflow allowed for an enriched understanding of spatial relationships and the temporal dynamics of flood events. Flood scenarios were further enriched through CityGML, which extended the BIM model to include temporal metadata. Figure 4b illustrates the urban flood representation framework, capturing flood probabilities, durations, and time-step data for enhanced 3D visualization. Incorporating metadata and temporal dynamics into the GIS environment facilitated a deeper analysis of flood resilience, offering critical insights into mitigation strategies and urban planning. This phase synthesized the findings from energy performance simulations and flood hazard analyses, providing a comprehensive evaluation of building resilience. Figure 2, Figure 3 and Figure 4, Table 1 and Table 2 served as essential references, detailing the inputs, workflows, and results that underpin this integrated approach. The robust analytical framework developed in this study represents a significant contribution to urban resilience, offering scalable applications for similar flood-prone regions globally.

3. Results and Discussion

This study employed an advanced methodological framework integrating BIM-based tools, energy simulation software, and hydraulic modeling to analyze energy efficiency and resilience under varied environmental conditions. By incorporating scenario-based analysis, the research addresses key performance metrics for optimizing energy consumption, assessing flood vulnerability, and improving structural resilience. Figures and tables cited throughout this section offer detailed insights into the findings.

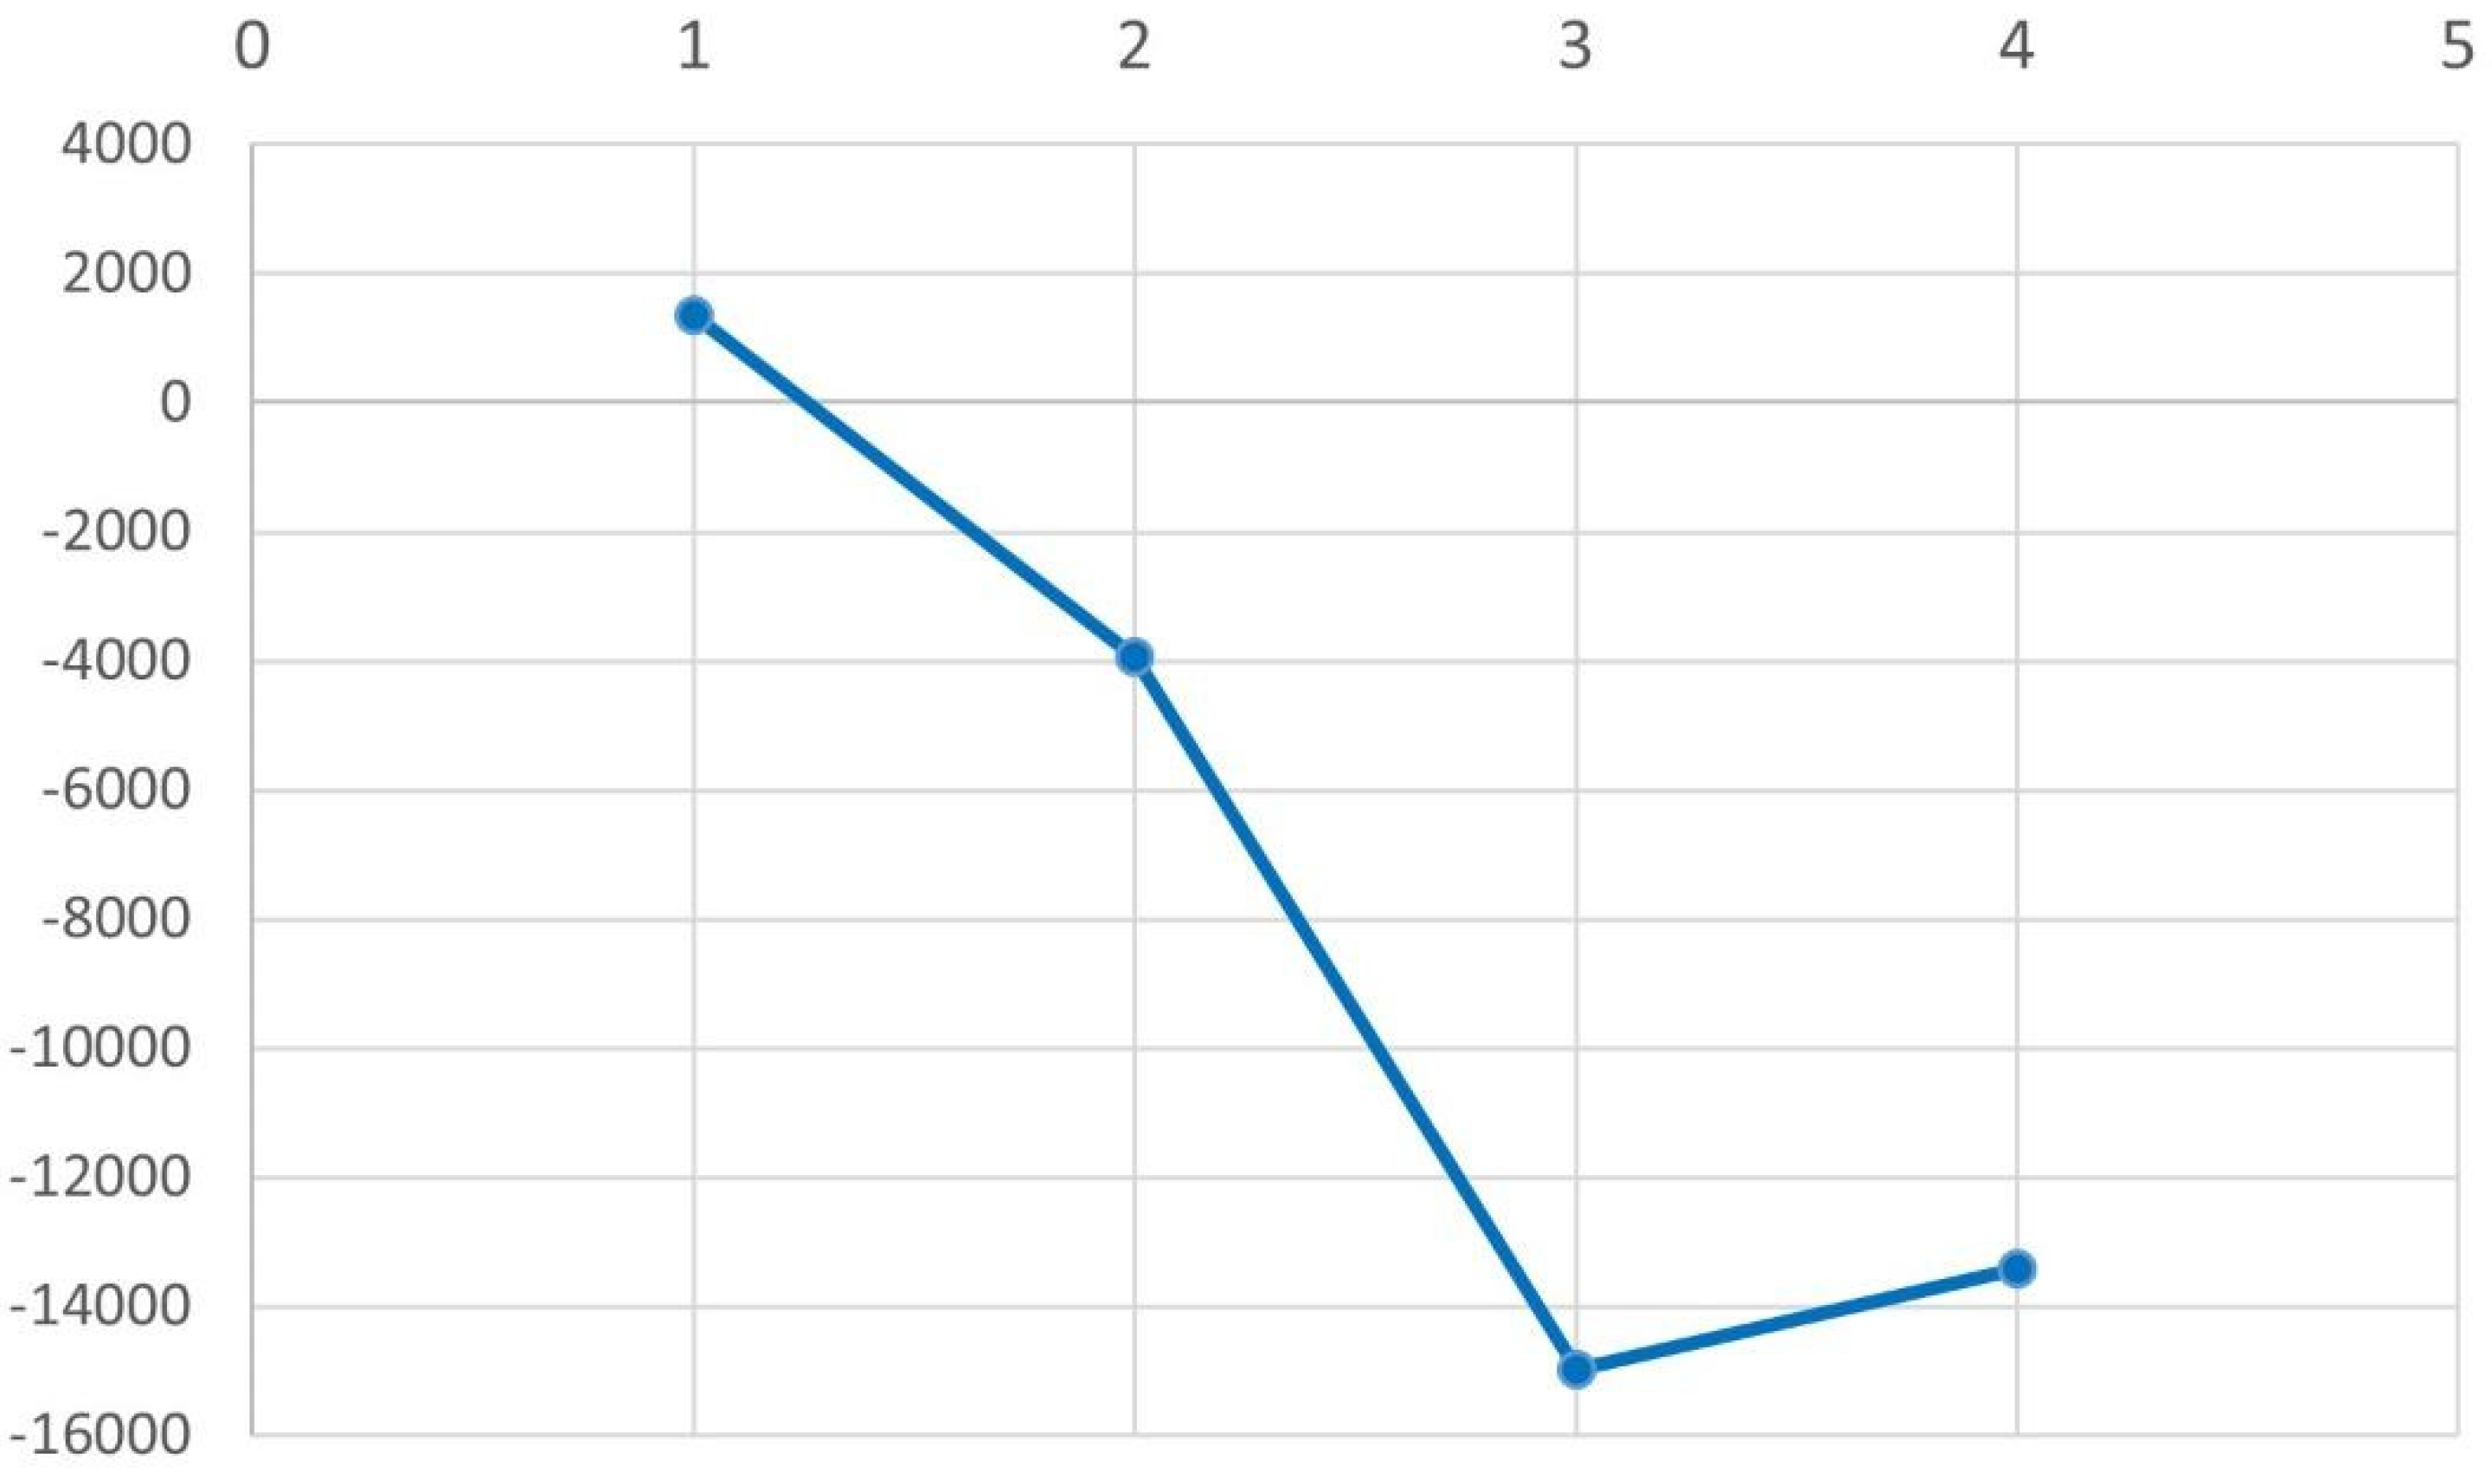
3.1. Energy Performance and Optimization

Integrating real-time occupancy schedules, lighting controls, and power management provided substantial insights into optimizing energy performance. Adjusting peak heating and cooling schedules reduced energy consumption by 18.3% compared to static schedules (Figure 5). Building Information Modeling (BIM) simulations highlighted the potential for significant energy savings through precise adjustments in design parameters such as insulation and glazing.
Table 3 summarizes the conducted scenario-based energy optimizations [19]. The base-case Energy Use Intensity (EUI) was reduced by 11.78% when insulation was upgraded to high-performance closed-cell spray foam. This improvement resulted in monthly cost savings of PKR 1363.33, translating into an annual saving of PKR 16,359.96. Enhanced glazing systems reduced energy use by 5.8%, with double-glazed windows providing additional benefits by reducing solar heat gain. The importance of building orientation was underscored, with north-facing orientations incurring the highest energy losses (12.54%) due to reduced solar exposure, while east-facing orientations (90°) increased energy consumption by 3.35% due to elevated morning heat gain. These findings corroborate results from [20,21], highlighting similar trends in orientation-based energy efficiency [22].

3.2. Natural Hazard Resilience and Building Design

The study explored the application of flood-resistant materials and seismic-resilient designs, emphasizing BIM’s role in hazard simulation [23]. Closed-cell spray foam insulation improved energy performance and reduced flood-related damage by 40%, as it mitigated water ingress during inundation scenarios. Integrating 3D BIM with 2D hydraulic models facilitated the detailed assessments of structural vulnerabilities, particularly in flood-prone regions (Figure 6).
Figure 6a presents a detailed analysis of flood depth zones and debris flow risk within the Digital Elevation Model (DEM) of Quetta, highlighting potential flood and debris flow impacts on residential buildings and major settlements. The flood depth zones are categorized into three distinct ranges: 5 to 10 feet (red), 1.6 to 6 feet (green), 0.3 to 1.6 feet (blue) and 0 to 0.3 (yellow), each indicating varying levels of flood risk. Debris flow risk is classified into three categories: low (green triangles), medium (yellow triangles), and high (red triangles), visually represented across the study area. The data for flood depth and debris flow risk were derived from reputable sources, including the United States Geological Survey (USGS) and the National Oceanic and Atmospheric Administration (NOAA), ensuring robust analysis and accuracy. The map also identifies key residential buildings and settlement areas, with a particular residential building—yours—located within the 1.6 to 6 feet flood depth zone, signifying moderate exposure to flood risks. This proximity emphasizes the importance of implementing appropriate mitigation measures to reduce potential flood damage. Figure 6b,c show two-dimensional and three-dimensional flood model visualizations, respectively, which reveal areas of elevated local vulnerability This analysis serves as a crucial tool for understanding the spatial distribution of flood risks and debris flow hazards, facilitating informed decision-making in flood management and urban planning within the Quetta region. Key structural elements were analyzed using quantitative metrics, such as water ingress rates, material resilience, and repair costs, enabling a precise estimation of economic losses (Figure 6d). For instance, the analysis revealed that wall linings (gypsum) were particularly susceptible to damage, with repair costs significantly outweighing those of other components, as illustrated in Figure 6d. The resulting damage to insulation, flooring, and wall linings totaled approximately PKR 250,000 (Figure 6d). The use of flood-resilient alternatives, such as elevated flooring and reinforced concrete walls, reduced potential repair costs by up to 50%. These findings align with studies such as [13], emphasizing the cost-effectiveness of integrating hazard-resistant designs [24].
Additionally, the results parallel the findings by [13,25], who noted that flood-resistant materials can significantly enhance durability and minimize post-disaster repair costs. BIM tools effectively simulated the interplay between water infiltration and structural stability, providing actionable insights for urban resilience.

3.3. Cost Analysis and Sustainability

Energy-efficient upgrades, while initially costly, demonstrated long-term financial and environmental benefits [26]. Improved insulation provided a cost-benefit ratio of 1:4 over a 10-year lifecycle. Poor building orientations—particularly north-facing—resulted in the highest monthly energy costs of PKR 13,242.41 (Figure 7). These results underscore the critical importance of incorporating passive design strategies in energy-efficient building designs [26].
These findings have significant sustainability implications. Enhanced insulation and glazing reduce energy demand and lower greenhouse gas emissions, contributing to climate change mitigation. This aligns with the findings of [8,25], who demonstrated that sustainable building materials can achieve environmental and economic goals. Furthermore, incorporating renewable energy sources, such as rooftop solar panels, could further amplify cost savings and sustainability outcomes.

3.4. Building Impact Assessments During Flood Events

Using ArcGIS and Digital Elevation Model (DEM) data, flood impact assessments identified significant vulnerabilities in Quetta’s urban fabric. Maximum external floodwater levels reached 2.1 m, with internal water levels gradually aligning due to infiltration over time (Figure 8). Hydrostatic pressure differentials initially posed structural risks. They were mitigated as internal and external water levels equalized. This finding highlights the role of infiltration pathways in structural stability. The assessment also highlighted the critical role of groundwater dynamics, particularly in flood-prone areas where prolonged water exposure can lead to rising groundwater levels. This phenomenon increases the risk of foundation settlement, seepage, and long-term structural degradation, especially in buildings lacking sufficient waterproofing or drainage systems. Effective groundwater management, such as installing subsurface drainage layers and waterproof membranes, was identified as a key strategy to enhance building resilience. Figure 6b,c illustrate 2D and 3D flood visualizations, effectively mapping localized vulnerabilities. These visual tools are invaluable for urban planners seeking to integrate climate resilience into their designs following FEMA guidelines and ISO 14090 standards. Similar approaches were noted in studies by [27], who emphasized integrating GISs and BIM for urban flood management. By accounting for groundwater dynamics, this study adds a new dimension to flood resilience planning, offering actionable recommendations for reducing immediate and long-term risks to building structures in flood-prone regions.

3.5. Discussion in Context of Existing Studies

The results of this study are consistent with findings in the literature. For example, the energy savings associated with improved insulation and glazing align with conclusions of [28], which reported an 11–14% reduction in EUI from similar upgrades. Additionally, the flood resilience measures corroborate the recommendations of [29], which emphasized the dual benefits of energy efficiency and hazard mitigation [30]. The study’s findings also emphasize the need for comprehensive strategies that integrate energy optimization with resilience planning. For instance, it highlighted the importance of addressing thermal efficiency and structural vulnerabilities in disaster-prone regions [31,32]. This dual focus ensures buildings are sustainable and resilient, aligning with global sustainability goals [32]. Including groundwater considerations in flood resilience planning further aligns with studies by [12,33,34], underscoring the critical impact of rising groundwater levels on building foundations during flood events. These studies noted that prolonged waterlogging and inadequate drainage systems can exacerbate structural vulnerabilities, highlighting the importance of groundwater assessments in resilience strategies. In line with these insights, flood-proofing approaches described by Bignami, Rosso, and Sanfilippo, further underscore the necessity of integrating structural reinforcement measures to mitigate urban flood risks This research extends these insights by demonstrating how integrating BIM-GIS technologies can evaluate surface flood dynamics and subsurface groundwater behavior, providing a comprehensive approach to mitigating structural risks.
By incorporating advanced methodologies, including BIM-based simulations and hydraulic modeling, this research contributes to the growing body of knowledge on sustainable and resilient building design [24]. Future research should focus on enhancing predictive capabilities through machine learning and expanding applications to other climate-sensitive regions. Moreover, integrating real-time groundwater monitoring systems with BIM-GIS frameworks could significantly improve predictive flood models, offering actionable insights for designing buildings resilient to surface and subsurface water pressures. Additionally, integrating renewable energy systems and further cost–benefit analyses will provide deeper insights into achieving long-term sustainability.

4. Conclusions

This study underscores the transformative potential of integrating Building Information Modeling (BIM) and Geographic Information Systems (GISs) to enhance sustainable energy efficiency and flood resilience in residential structures, with a case focus on Quetta, Pakistan. Scenario-based analyses revealed significant energy and cost savings through strategic design modifications. Enhanced insulation reduced energy consumption by 11.78%, while double-glazed windows achieved an additional 5.8% reduction, cutting monthly energy costs by up to 48.2%. Building orientation played a critical role, with north-facing orientations increasing energy costs by 36.82% and east- and west-facing orientations contributing to 12.11% and 20.96% increases, respectively. Flood risk assessments, powered by high-resolution GIS and hydraulic modeling, predicted maximum flood depths of approximately 2 m, resulting in estimated non-structural damage costs of PKR 250,000 (~10% of total building costs). Mitigation strategies, such as using flood-resistant materials and elevating floor levels, demonstrated the potential to reduce repair costs by 30–50%, emphasizing the cost-effectiveness of sustainable resilience-focused designs. Additionally, groundwater considerations highlighted the importance of addressing subsurface water impacts on building foundations, further reinforcing the value of comprehensive resilience strategies. Integrating BIM and GISs provided a precise framework for vulnerability mapping and decision making. By leveraging these technologies, urban planners and engineers can prioritize sustainable design strategies that reduce environmental impact while enhancing structural resilience.
Despite its promising results, this research has limitations that must be acknowledged. First, the study relies on static datasets for GIS flood modeling and does not incorporate real-time hydrological or meteorological data, which could significantly improve predictive accuracy. Second, the integration of BIM and GIS tools requires extensive technical expertise and computational resources, which might limit its practical application in resource-constrained settings. Third, the case study focuses exclusively on Quetta, Pakistan, and may not capture other regions’ diverse environmental and structural challenges. Additionally, assumptions made about material properties and construction typologies may not generalize to all regional building types. Future research should expand the application of BIM and GISs to diverse building types and climatic conditions. Renewable energy systems, such as rooftop solar panels, and automating workflows between parametric BIM models and real-time GIS flood data could enhance resilience and sustainability outcomes. Moreover, validating these methodologies across real-world scenarios will strengthen their applicability and reliability. Developing open-source tools and standardized data protocols will foster collaboration and facilitate the global adoption of these innovative practices, driving sustainable and resilient urban design advancements.

Author Contributions

M.A.: writing—original draft preparation and methodology. N.A.B., H.C. and M.H. (Muhammad Hasan): conceptualization and analysis. N.A.B. calculation and supervision. N.A.B., M.H. (Muhammad Habib), J.I. and M.A.B. contributed to reviewing and editing. All authors have read and agreed to the published version of the manuscript.

Funding

This research is supported by the National Natural Science Foundation of China (grant no. 42350410445).

Institutional Review Board Statement

Not applicable.

Informed Consent Statement

Not applicable.

Data Availability Statement

The original contributions presented in this study are included in the article. Further inquiries can be directed to the corresponding author.

Conflicts of Interest

The authors declare that they have no known competing financial interests or personal relationships that could have appeared to influence the work reported in this paper.

References

  1. Azhar, S.; Brown, J. BIM for sustainability analyses. Int. J. Construct. Educ. Res. 2009, 5, 276–292. [Google Scholar] [CrossRef]
  2. Schlueter, A.; Thesseling, F. Building information model based energy/exergy performance assessment in early design stages. Autom. Constr. 2009, 18, 153–163. [Google Scholar] [CrossRef]
  3. Abanda, F.H.; Vidalakis, C.; Oti, A.H.; Tah, J.H. A critical analysis of Building Information Modelling systems used in construction projects. Adv. Eng. Software 2015, 90, 183–201. [Google Scholar] [CrossRef]
  4. Schwartz, Y.; Raslan, R. Variations in results of building energy simulation tools, and their impact on BREEAM and LEED ratings: A case study. Energy Build. 2013, 62, 350–359. [Google Scholar] [CrossRef]
  5. Haruna, A.; Shafiq, N.; Montasir, O. Building information modelling application for developing sustainable building (Multi criteria decision making approach). Ain Shams Eng. J. 2021, 12, 293–302. [Google Scholar] [CrossRef]
  6. Ghaffarianhoseini, A.; Tookey, J.; Ghaffarianhoseini, A.; Naismith, N.; Azhar, S.; Efimova, O.; Raahemifar, K. Building Information Modelling (BIM) uptake: Clear benefits, understanding its implementation, risks and challenges. Renew. Sustain. Energy Rev. 2017, 75, 1046–1053. [Google Scholar] [CrossRef]
  7. Peng, F.-L.; Qiao, Y.-K.; Sabri, S.; Atazadeh, B.; Rajabifard, A. A collaborative approach for urban underground space development toward sustainable development goals: Critical dimensions and future directions. Front. Struct. Civ. Eng. 2021, 15, 20–45. [Google Scholar] [CrossRef]
  8. Wong, J.K.W.; Zhou, J. Enhancing environmental sustainability over building life cycles through green BIM: A review. Autom. Constr. 2015, 57, 156–165. [Google Scholar] [CrossRef]
  9. Motawa, I.; Almarshad, A. A knowledge-based BIM system for building maintenance. Autom. Constr. 2013, 29, 173–182. [Google Scholar] [CrossRef]
  10. Farooq, U.; Rehman, S.K.U.; Javed, M.F.; Jameel, M.; Aslam, F.; Alyousef, R. Investigating BIM implementation barriers and issues in Pakistan using ISM approach. Appl. Sci. 2020, 10, 7250. [Google Scholar] [CrossRef]
  11. Azhar, S.; Khalfan, M.; Maqsood, T. Building Information Modeling (BIM): Now and beyond. Australas. J. Constr. Econ. Build. 2012, 12, 15–28. [Google Scholar]
  12. Kumar, R.; Yazdan, M.M.S. Evaluating Preventive Measures for Flooding from Groundwater: A Case Study. J. 2022, 6, 1–16. [Google Scholar] [CrossRef]
  13. Zhang, Y.; Fung, J.F.; Cook, D.; Johnson, K.J.; Sattar, S. Benefit–Cost Analysis for Earthquake-Resilient Building Design and Retrofit: State of the Art and Future Research Needs. Nat. Hazards Rev. 2024, 25, 03124001. [Google Scholar] [CrossRef] [PubMed]
  14. Birkmann, J. Measuring Vulnerability to Natural Hazards: Towards Disaster Resilient Societies; American Risk and Insurance Association: Minneapolis, MN, USA, 2013. [Google Scholar]
  15. Bach, C.; Gupta, A.K.; Nair, S.S.; Birkmann, J. Critical Infrastructures and Disaster Risk Reduction; National Institute of Disaster Management and Deutsche Gesellschaft für Internationale Zusammenarbeit GmbH (GIZ): New Delhi, India, 2013; p. 72. [Google Scholar]
  16. Bynum, P.; Issa, R.R.; Olbina, S. Building Information Modeling in support of sustainable design and construction. J. Constr. Eng. Manage. 2013, 139, 24–34. [Google Scholar] [CrossRef]
  17. Halverson, M.A.; Hart, R.; Athalye, R.A.; Rosenberg, M.I.; Richman, E.E.; Winiarski, D.W. ANSI/ASHRAE/IES Standard 90.1-2013 Preliminary Determination: Qualitative Analysis; Pacific Northwest National Lab. (PNNL): Richland, WA, USA, 2014. [Google Scholar]
  18. English, T.R.; Darwich, A.; Stewart, E.; Platt, H. Comparison of Indoor Air Quality Standards in Health Care Settings. ASHRAE Trans. 2015, 121, 1R. [Google Scholar]
  19. Shi, X.; Tian, Z.; Chen, W.; Si, B.; Jin, X. A review on building energy efficient design optimization from the perspective of architects. Renew. Sustain. Energy Rev. 2016, 65, 872–884. [Google Scholar] [CrossRef]
  20. Abbas, S.; Saleem, O.; Rizvi, M.A.; Kazmi, S.M.S.; Munir, M.J.; Ali, S. Investigating the energy-efficient structures using building energy performance simulations: A case study. Appl. Sci. 2022, 12, 9386. [Google Scholar] [CrossRef]
  21. Delgarm, N.; Sajadi, B.; Kowsary, F.; Delgarm, S. Multi-objective optimization of the building energy performance: A simulation-based approach by means of particle swarm optimization (PSO). ApEn 2016, 170, 293–303. [Google Scholar] [CrossRef]
  22. Si, B.; Tian, Z.; Jin, X.; Zhou, X.; Tang, P.; Shi, X. Performance indices and evaluation of algorithms in building energy efficient design optimization. Energy 2016, 114, 100–112. [Google Scholar] [CrossRef]
  23. Paton, D.; McClure, J.; Bürgelt, P.T. Natural hazard resilience: The role of individual and household preparedness. DisasterResil. Integr. Approach 2006, 105, 27. [Google Scholar]
  24. Bianchi, S. Integrating resilience in the multi-hazard sustainable design of buildings. Disaster Prev. Resil. 2023, 2023, 14. [Google Scholar] [CrossRef]
  25. Apostolopoulos, V.; Mamounakis, I.; Seitaridis, A.; Tagkoulis, N.; Kourkoumpas, D.-S.; Iliadis, P.; Angelakoglou, K.; Nikolopoulos, N. An integrated life cycle assessment and life cycle costing approach towards sustainable building renovation via a dynamic online tool. ApEn 2023, 334, 120710. [Google Scholar] [CrossRef]
  26. Mao, C.; Xie, F.; Hou, L.; Wu, P.; Wang, J.; Wang, X. Cost analysis for sustainable off-site construction based on a multiple-case study in China. Habitat Int. 2016, 57, 215–222. [Google Scholar] [CrossRef]
  27. Cao, Y.; Xu, C.; Aziz, N.M.; Kamaruzzaman, S.N. BIM–GIS integrated utilization in urban disaster management: The contributions, challenges, and future directions. Remote Sens. 2023, 15, 1331. [Google Scholar] [CrossRef]
  28. Hee, W.; Alghoul, M.; Bakhtyar, B.; Elayeb, O.; Shameri, M.; Alrubaih, M.; Sopian, K. The role of window glazing on daylighting and energy saving in buildings. Renew. Sustain. Energy Rev. 2015, 42, 323–343. [Google Scholar] [CrossRef]
  29. Hyder, A.H.A.; Awad, J.; Jung, C.; Sher, B.K. Enhancing Climate Resilience Against Flooding in Housing Design Through Synergistic Strategies in Pakistan. Future Cities Environ. 2024, 10, 6. [Google Scholar]
  30. Albach, H.; Meffert, H.; Pinkwart, A.; Reichwald, R. Management of Permanent Change; Springer: Berlin/Heidelberg, Germany, 2015. [Google Scholar]
  31. Duro, E. A Multi-Criteria Methodology for the Integration of Risk Assessment into Spatial Planning as a Basis for Territorial Resilience. The Case of Seismic Risk. Ph.D. Thesis, POLIS University, Yrshek, Albania, 2023. [Google Scholar]
  32. Asl, M.R.; Zarrinmehr, S.; Bergin, M.; Yan, W. BPOpt: A framework for BIM-based performance optimization. Energy Build. 2015, 108, 401–412. [Google Scholar]
  33. Mancini, C.P.; Lollai, S.; Volpi, E.; Fiori, A. Flood modeling and groundwater flooding in urbanized reclamation areas: The case of Rome (Italy). Water 2020, 12, 2030. [Google Scholar] [CrossRef]
  34. Mignot, E.; Dewals, B. Hydraulic modelling of inland urban flooding: Recent advances. J. Hydraul. Eng. 2022, 609, 127763. [Google Scholar] [CrossRef]
Figure 1. Overview of the study area, penal (a) highlighting the stream flood magnitude during the flood and (b) the residential structures assessed for energy performance and flood resilience using BIM-GIS integration. The penal (c) BIM-based workflow methodology, outlining the three-phase process of energy simulation, hydrological risk modeling, and spatial–temporal assessments.
Sustainability 17 02496 g001
Figure 2. (a) 3D model of a residential building developed in Autodesk Revit for energy performance simulation. (b) Key input parameters for the energy analysis include building typology, orientation, and envelope properties. (c) Integration of geolocation and weather data for energy simulation. (d) Heating and cooling load settings are used for energy performance.
Sustainability 17 02496 g002
Figure 3. (a) Monthly cooling loads for the residential building. (b) Monthly heating loads for the residential building. (c) Annual wind rose, showing wind speed and direction distribution. (d) Wind speed and direction data inform ventilation strategies and insulation design.
Sustainability 17 02496 g003
Figure 4. (a) Workflow for integrating the BIM model with ArcGIS for flood hazard modeling and (b) urban flood representation framework.
Sustainability 17 02496 g004
Figure 5. Energy consumption comparisons for optimized scenarios: this figure compares energy consumption under baseline and optimized scenarios and highlights the percentage reduction achieved through improved schedules, insulation, and glazing systems.
Sustainability 17 02496 g005
Figure 6. Flood damage simulations and mitigation strategies: (a) maximum water depth during flood scenarios; (b) 2D flood extent visualization; (c) 3D mapping of flood vulnerabilities; and (d) estimated repair costs for flood-induced damages.
Sustainability 17 02496 g006
Figure 7. Monthly energy costs based on building orientation: Visual representation of energy costs associated with different building orientations. North-facing orientations exhibit the highest costs, while east-facing orientations demonstrate marginal increases due to morning heat gain.
Sustainability 17 02496 g007
Figure 8. Structural impacts of hydrostatic pressure and infiltration pathways: This figure demonstrates external and internal water level dynamics during flood events. It highlights infiltration effects and structural stability assessments, providing insights into mitigation strategies.
Sustainability 17 02496 g008
Table 1. Key parameters used for the energy performance analysis include building typology, orientation, envelope properties, and local weather data.
ParameterValueStandard Reference
Area Per Person (Sft)70, 120IRC (International Residential
Code)
Sensible Heat Gain Per Person (Btu/h)238.85ASHRAE Handbook
Fundamentals
Latent Heat Gain Person (Btu/h)153.55ASHRAE Handbook
Fundamentals
Infiltration Airflow Per Area
(CFM/SFt)
0.4ASHRAE-90.1-2013 [17]
Plenum Lighting Contribution (%)20ASHRAE Handbook Fundamentals
Outdoor Air Per Person (CFM)20ASHRAE Standard 62.1-2013 [18]
Outdoor Air Per Area (CFM/SF)0.06ASHRAE 62 [18]
Table 2. Table of spatial and structural elements for building and terrain analyses.
Concepts Details
Spatial
structures
Defining the spatial container for objects. It can have a corresponding element (e.g., a building story or a space in the building) that acts as the container object.
Terrain Representing the elevation of the area. It is required to be in multiple levels of detail. Terrain can be either point-based or surface-based.
Flood The flood parameters using multiple representations: (a) spatial–temporal point distribution of depth and velocity vectors (for use in damage calculation) and (b) surface representation of flood (e.g., water level surface).
Buildings The footprint, address, height, and the area
Building components Including storys, walls, stairs, floors, foundation, beams, columns, roof, structural connections (e.g., wall ties), framing members, floorings, ceiling, soffit, skirtings and moldings, doors, windows, and cladding vents (e.g., airbricks).
Utilities For example, electrical objects like switches, meter boxes, and outlets
Materials Construction materials of the building elements (single material or multiple)
Cost information Including the cost of repair/replacement of building and utility components and the building value
Table 3. Energy evaluations for various design scenarios: Summary of scenario-based energy optimizations, including enhancements in insulation, glazing, and orientation adjustments. The table provides data on Energy Use Intensity (EUI) reduction, cost savings, and performance under various design modifications.
S.NoScenarioEUI (kWh)Annual Electricity (kWh)Monthly Electricity (kWh)Annual Fuel Cost (Rs)Monthly Fuel Cost (Rs)Difference (Rs)Electricity Cost (Rs)Savings (Rs)
1Base case203.712,3061025.5035,248.032937.340.0013,331.501498.04
2WWR200.311,028919.0035,746.142978.85719.8911,947.001519.21
3Insulation187.319,2721606.0022,678.301889.86−5603.7320,878.00963.83
4Double-glazed window 192.120,0391669.9224,758.602063.22−2756.4321,708.921052.24
5Orientation 90 (East)226.825,0632088.5824,084.702007.06−1593.6727,151.581023.60
6Orientation 180 (North)252.025,7112142.5828,245.302353.78−3956.0027,853.581200.43
7Orientation 270 (West)215.719,4491620.7528,919.202409.93−814.1721,069.751229.07
Disclaimer/Publisher’s Note: The statements, opinions and data contained in all publications are solely those of the individual author(s) and contributor(s) and not of MDPI and/or the editor(s). MDPI and/or the editor(s) disclaim responsibility for any injury to people or property resulting from any ideas, methods, instructions or products referred to in the content.

