Abstract
The swift advancement in monitoring and evaluation systems for road pavement conditions highlights the crucial role that this field plays in ensuring the sustainability of roads. This, in turn, contributes to the growth and prosperity of nations and enables users to enjoy the highest levels of luxury and comfort. Despite numerous studies and ongoing research, finding the most precise and efficient monitoring systems to determine the type and severity of road defects, their causes, and appropriate treatments remains a challenge. This study proposes a system that employs a camera to create an application capable of evaluating road conditions with ease by taking images while driving over the road. Based on the results, the application was accurate in identifying road defects of different severity within the same category. The proposed method was compared to the Pavement Condition Index (PCI) method, and a significant match was found in determining the type and severity of each defect on the selected road sections. More clearly, the overall accuracy of detecting and classifying block cracks, alligator cracks, longitudinal cracks, and potholes was significant for detecting and classifying the patches.
1. Introduction
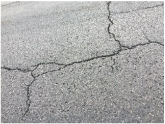
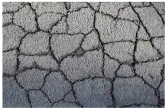
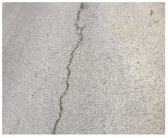
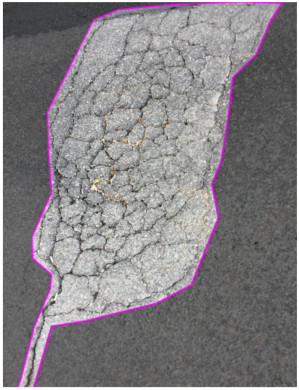
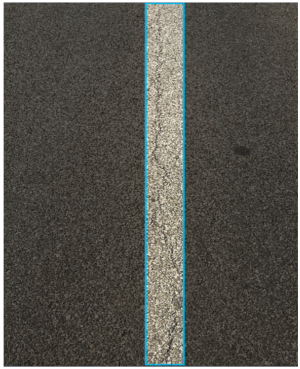
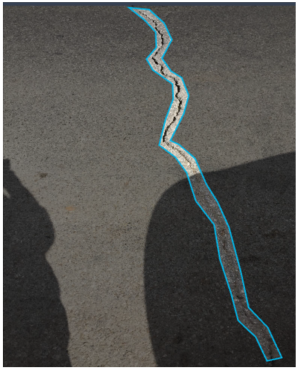
Roads are considered the vital artery of any country, as they regularly feed cities and villages with passengers and goods, which contributes to the growth and prosperity of nations. However, it is necessary to maintain the efficiency of the roads through conducting periodic monitoring and maintenance, which provides an opportunity to sustain the roads and increase their operational life. Governments are obligated to apply special standards in monitoring the condition of roads in general and the condition of pavements in particular through forming committees to monitor, evaluate, and maintain roads and pavements significantly. Governments also have to take into consideration factors that do not directly or indirectly affect traffic flow and passenger comfort. Nowadays, due to the population increase and the significant increase in the use of public and private modes of transportation, the roads are exposed to continuous high loads throughout the day, and thus the chance of defects on the roads increases. The most common defect types in Jordan are alligator cracks, longitudinal cracks, edge cracks, transverse cracks, potholes, patches, ruts, shoving, ravelling, and polished aggregate [1].
The pavement management system is one of the essential systems in maintaining the efficiency of roads and keeping them free from distress, thus achieving the highest levels of comfort for road users, maintaining the safety of vehicles, and reducing the percentage of road conditions’ contribution to traffic accidents [2]. All of this is taken into account when planning, designing, and implementing the construction of roads and pavements. The pavement evaluation system is considered one of the effective systems due to its importance in determining the types, shapes, and severity of defects on road surfaces and then finding the most effective techniques to treat defects in their place without the need for reconstruction [3]. The accuracy of implementing the correct maintenance techniques depends on the results of the inspection and monitoring of the condition of the road surfaces, so the accurate diagnosis of pavement condition leads to applying application-specific and accurate maintenance operations by road maintenance specialists [4].
Selecting road condition evaluation techniques is not an easy task, as it requires many pieces of equipment and techniques to ensure significant pavement condition evaluation results. In the past, the evaluation of pavement conditions was limited to the traditional methods of theoretical survey and observational recording. Then, after the scientific and digital revolution, many technologies appeared that facilitated and assisted in evaluating the condition of pavements, such as using laser-equipped cars, vibration-based methods, video recording, and other modern methods. However, there is an essential point in that the complexity and high cost of using sensors, for example, prevent their use by some researchers [5]. The same applies to cars that are equipped with laser systems that measure distortions on the surface of roads while driving on them. Therefore, this study focuses on using simple tools, including a camera, to record a video while walking on the road’s pavement and then using advanced image processing techniques to detect and classify pavement defects. After that, a comparison is made between the image processing results and one of the international pavement indices, including Pavement Condition Index (PCI), to validate the proposed monitoring method.
Road condition assessment plays a major role in the sustainability of road conditions, positively reflects on the experience of road users, and provides comfort while driving. Governments are trying hard to keep roads in good condition. Despite the diversity of road performance assessment applications as mentioned above, the mechanism for applying road assessment tools and techniques may face challenges that prevent the proper monitoring and evaluation of road health and detection of defects and damages on the road surface, which in turn may lead to deterioration of road conditions due to poor assessment results and incorrect maintenance procedures.
The most significant challenges facing road condition assessment techniques are the high cost of some tools like equipped laser vehicles and their general unavailability to general researchers, the difficulty of using some tools, and the need for a set of complex software. There is also a set of assessment tools that work in the long term, so it takes more time to show the results of the road surface condition, like the static monitoring systems, including penetrated pavement devices.
Hence, the idea of this research came to provide a technology for monitoring, following up, and evaluating the condition of roads through an available, easy, cheap, and usable method for all researchers. This method saves the evaluator time and effort in determining the performance of the road condition and determining the type and severity of defects, thus determining the appropriate treatment and maintenance in order to achieve the best sustainability of the road surface. This method will contribute to opening the door for governments to use it to save time and effort to provide estimates of the condition of roads and the amount of work required for their maintenance.
The paper structure is as follows: The next section discusses the literature review. The research data, including data collection, analysis, and results, are presented in Section 3. Discussions are explained in Section 4, and finally, the paper’s conclusions and future research directions are presented in Section 5.
2. Literature Review
The sustainability of the pavement depends on the set of actions that governments and road specialists must carry out, which include monitoring, evaluating, and professionally repairing defects to ensure the highest levels of service, including comfort while driving [6]. Therefore, these works are the nucleus of the pavement’s sustainability and achieving the highest service specifications for users. For this reason, governments attach great importance to accurately assessing the pavement condition to carry out maintenance work. Despite the diversity and spread of assessment tools, developing countries can still not obtain significant funding to purchase expensive equipment to monitor and evaluate the condition of pavements [7]. Therefore, many developing countries still resort to the use of traditional methods of monitoring the state of the road, which include the use of feedback and complaints from the population about defects in specific areas, as well as adopting the field monitoring approach depending on Present Serviceability Rating (PSR) [1,8]. As mentioned earlier, methods of evaluating the condition of pavements vary, starting with methods based on visual observation, which include the Pavement Condition Index (PCI) and Pavement Condition Rating (PCR). Each observation method has a specific rating scale for detecting and classifying the distress types. More simply, the PCI monitoring method was developed by the U.S. Army Corps of Engineers. It is an indicator that uses a grading system starting from 0 to 100. Grading 0 represents the worst pavement condition, while grading 100 represents the excellent pavement condition [9]. In 2020, the county of Los Angeles, Department of Public Works, reported using five PCI rating categories as (1) failed, (2) poor, (3) fair, (4) good, and (5) excellent, as shown in Table 1. This monitoring indicator depends mainly on providing the type and severity of each pavement defect manually. This method is not preferred by researchers due to the variety of evaluation results, which mainly depend on the level of experience of the inspectors; it is also a time-consuming method. On the other hand, PSR was first developed by the City of Painesville. The PSR depends mainly on providing a clear description of pavement defects in terms of severity and extent based on the visual inspections. This method depends mainly on rating the defect severity as low, medium, and high, while the extent is rated as occasional, frequent, and extensive [10]. There are also five rating scales from 0 to 100, as shown in Table 2. In this study, the PCI monitoring method was used to evaluate the actual condition of pavement for different arterial roads in Jordan. The results are used later to validate the proposed advanced image-processing technique in evaluating pavement conditions.

Table 1.
The grading of the pavement condition index (PCI).
Table 2.
The grading of the Pavement Condition Rating (PCR).
At the same time, many efforts have been made to develop and improve the pavement evaluation system by finding other monitoring techniques that need less time and are accurate, such as vibration-based methods [4]. In the vibration-based method, pavement can be quickly evaluated using sensors that can read the vibrations of vehicle chassis while moving over the road pavement. The vibrations represent the level of comfort while riding and reflect the road surface condition. The signals can be later analyzed to identify the type and severity of pavement conditions [4]. Used the vibration-based method to evaluate different local roads in Melbourne using an accelerometer sensor to measure the vibration signals in three dimensions, x, y, and z, during a vehicle movement over the roads. The results found that the vibration signals accurately detected the pavement distress according to the fluctuations of the conducted signals. More clearly, the signals with high fluctuations mean that there were high-severity defects, while low fluctuation means that there were defects with low severity.
Moreover, the locations of the defects were determined by using a line scan camera with built-in GPS, which was fixed on the vehicle’s rear trunk to record the video during the measurement procedure. A smartphone was also used as a monitoring method by many researchers [11,12]. They used different smartphone applications, including sensor log, accelerometer, vibration meter, and vibration from both the App Store and the Play Store, to measure the vibrations from the front dashboard of a vehicle in motion status.
Image processing is another effective technique researchers use to monitor pavement conditions significantly [11]. A digital imaging technique was used to detect, monitor, and extract cracks at different pavement test sections in California [13]. This study focused on determining the density of cracks on the road surface and their quantity. The results revealed that using the automated crack imaging clearly indicated the quantity and quality of pavement distress. The detection procedure can be easily mapped to minimize the percentage of detection errors. Another study by [14] regarding using laser scanning to detect the rutting on road pavement in Jordan. This research used an image processing technique to simply detect the rutting among different types of pavement distresses. This research claimed that using this technique can add a significant contribution to the field of pavement monitoring and also to the pavement management system.
Image processing techniques and their use in monitoring and evaluating road conditions are an influential element with visual significance. The evaluator can, through visual reasoning, review the pavement condition several times and verify the evaluation results [11]. However, there is a factor that may affect the efficiency of the evaluation results, which is the accuracy of the captured image and its suitability for weather conditions, the speed of the vehicle installed on it, the shooting angle, the height of the camera above the ground, brightness, and shadow [12,14]. All of these elements have a major impact on the efficiency of the evaluation, hence the importance of using prediction results, which play a smart role in the ability to identify elements of a different nature within a single image, and thus the edges of defects on the road can be identified and displayed independently from other parts of the image [11]. Many studies have used prediction models to process images and determine the type and shape of defects, but they faced many limitations, such as continuity and the inability to measure multiple types of defects with different severity [4]. Hence, the importance of the Convolutional Neural Network model emerged due to its distinctive ability to work better on a variety of defects despite their different severity, as well as its ability to predict processed images that were captured in different positions so that the model can easily identify the desired elements, analyze them, and build prediction models accordingly [14].
Accordingly, for almost 50 years, numerous researchers have implemented automatic distress data collection through digital imaging technology. This approach mitigates the hazards to human evaluators and the inconvenience to traffic during the survey [15]. High-speed complementary metal-oxide-semiconductor (CMOS) industrial cameras were used by Zhang et al. (2014) [16] to automatically detect cracks in a subway tunnel by applying thresholding operations and the technique of morphological image processing, while Zhang et al. (2016) [17] employed neural networks to detect road pavement cracks. Nevertheless, Shatnawi (2018) [18] analyzed images captured by drones with neural networks to identify pavement distresses on secondary roads. The research concluded that fractures in pavement require substantial texture information. The textural elements of the fracture pavement exhibit two behaviors: (1) varying within the local range, and (2) demonstrating homogeneity over the global range. As a result, this research employs linear and nonlinear filters to analyze the texture of images. Morphological transition, linear filtering, and non-linear filtering were all employed to examine picture attributes at various scales. Finally, the AdaBoost classifier was used to learn and categorize the aforementioned textural information, as well as to determine the extent of pavement damage. Finally, while this technology improves crack extraction efficiency up to a point, it is unable to identify fine crack extraction. Shi et al. (2016) [19] present the crack forest approach, which uses a random structure forest to extract asphalt fracture pavement [19].
This research work proposes a system that employs a camera to create an application capable of evaluating road conditions with ease by capturing images while driving over the road. The objectives of this study are as follows:
- Identifying road defects of different severity within the same category automatically.
- Matching and comparing the results from Pavement Condition Index results and image processing techniques results for the validation process.
Despite the many studies related to the use of image processing techniques in road condition assessment, the use of techniques associated with predicting road conditions and defect behavior is somewhat limited. A limited number of studies provide a comprehensive understanding that integrates assessment and prediction of road conditions through image processing technology. Perhaps this method is not new in form, but there are details related to building machine learning and prediction models capable of identifying and classifying defects by simply scanning the street with a camera or even a mobile camera and then increasing the efficiency of the method proposed in this study. What distinguishes this proposed method is its ease of application; it does not require time and effort, and it is also economical compared to other known methods, for example, using equipped laser cars.
3. Data
In this section, all the information related to data collection and data analysis is presented. The section also provided clear details on performing the visual inspection of the pavement defects in order to measure the PCI. An overview of the procedure for detection and classification using the image processing technique is presented.
3.1. Site Locations
As shown in Table 3, nine arterial roads with different cracks were selected in Amman and Irbid cities in Jordan for data collection as follows:
Table 3.
Site locations in Amman and Irbid cities.
The data set was collected in these areas in the autumn season; the weather was sunny and rainy in some figures where the roads were wet.
3.2. Data Collection Using PCI
The computation of the PCI was based on the results of a visual condition survey in which distress type, severity, and quantity were identified. The PCI was developed to provide an index of the pavement’s structural integrity and surface operational condition.
The selected pavement sections were divided into random sample units with an area of 232 ± (10) m2. The minimum number of sample units to be surveyed based on the total number of sample units and PCI standard deviation, which is assumed to be 10 for asphalt concrete AC surfaced pavements, is determined. The database covered five types of distresses as follows: block cracking, alligator (fatigue) cracking, longitudinal cracks, patches, and potholes. Normal (ideal pavement) with no crack is taken also for comparison. A hand odometer was used to measure the distress length and area for each distressed spot. The distress inspection was conducted by walking over the sample unit, identifying distress type manually based on observation and visualization, and measuring the distress quantity using tape and a hand odometer. The distress severity levels were observed manually based on visualization and the distress criteria according to the PCI distress manual and PAVER System; these criteria are different from one type of distress to another. The severity level for distress is a ranking index that divides the condition of distress into three types based on different ranking criteria. The three types of severity levels can be categorized into low, medium, and high. The general factors that control the severity level of several cracks are 1. crack width. 2. The condition of the crack, if it was filled, previously maintained, or neither (filled or not filled). 3. The existence of random cracks around the crack. 4. The condition of the area around the crack. Finally, the collected data were recorded on the flexible pavement survey sheet for each sample unit; the Micro PAVER 5.2 version was released by entering the distress type, quantity, and severity for each sample unit in each section. PCI and PCI ratings were computed automatically and used to match and validate with the results from image processing. This research work used the custom PCI rating scale as shown in Figure 1, where the custom PCI rating scale is used to represent the severity level ranges as follows: (a) severity level high (0–57%); (b) severity level medium (58–85%); and (c) severity level low (86–100%).
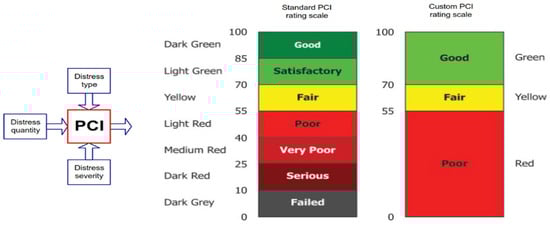
Figure 1.
Pavement Condition Index (PCI) rating scale [13].
3.3. Data Collection Using Camera
Hardware specifications, computational time, and data collection using a camera:
The experiments were conducted on a custom-built PC with the following specifications:
- CPU: AMD Ryzen 9 9950X
- GPU: NVIDIA RTX 4070 Ti with 12 GB VRAM
- RAM: 32 GB
- Storage: 1 TB SSD
The training process for the CNN model spanned 20 epochs and required approximately 40 min to complete on the entire dataset. These hardware specifications and training time highlight the scalability and computational efficiency of the proposed method, making it suitable for real-world applications.
A sports camera, GoPro Hero 7 was used in this study to collect high-quality images without shaking and vibration. This will give more inspection vehicles that can be employed to achieve a fast-monitoring objective. The camera resolution was set as 720 dpi, the focal ratio (aperture) as f/2.8, the film speed as ISO 293, and the exposure time as 1/256 s. The dimensions of the output images were set to 3000 × 4000 pixels, and the camera automatically records one image per second. Moreover, it can provide location information of the images in the format.
The camera was mounted on the front bumper of an electric vehicle model, the Mercedes B250, and the inspection vehicle circulated in the city and took consecutive images from the pavement for about 6 h. The passenger car was used at a speed of 20 km/h in order to count as many defects as possible scattered along the selected roads. Almost 5500 images containing a variety of pavement surface types were collected in September and October 2023. From the 5500 images, the 2000 best images, containing most of the classical distress types, were selected. As shown in Table 4, nine arterial roads with different cracks were selected in Amman and Irbid, Jordan, for data collection as mentioned in Section 3.1.
Table 4.
Nine arterial roads with a sample of different defects.
- Scalability Assessment
The proposed method demonstrates significant scalability due to its efficient hardware utilization and streamlined data collection process. The use of high-performance computing components, such as the AMD Ryzen 9 9950X CPU and NVIDIA RTX 4070 Ti GPU, ensures rapid processing times, making it feasible to scale operations to larger datasets. The relatively short training duration of 40 min for 20 epochs suggests that the model can handle increased data volumes with minimal computational overhead.
The selected camera specifications, particularly the high resolution and automated image capture capability, enable efficient data acquisition without manual intervention. The vehicle-based data collection strategy further enhances scalability by covering extensive areas in a limited time.
Moreover, the flexibility of the methodology allows for adaptation to different environments and road conditions, making it suitable for deployment in various geographic regions, as shown in Table 5. The ability to collect, process, and analyze large datasets with high accuracy and minimal resource constraints underscores the system’s potential for expansion to larger-scale infrastructure monitoring applications.
Table 5.
Different processes have been used to annotate five distress types manually for better precision, and the value of the severity is calculated as a numerical value.
3.4. Data Analysis and Results Using Image Processing Techniques
In this section, we provide a detailed account of the procedures used for constructing the detection model, including data pre-processing, model architecture design, training, and prediction.
3.4.1. Data Pre-Processing
Before model training, the input images are pre-processed to ensure consistency and to augment the dataset, thereby reducing the risk of overfitting. The following steps are applied using TensorFlow’s ImageDataGenerator:
- Rescaling: The pixel values of the images are normalized by dividing by 255, which converts the original range [0, 255] to [0, 1].
- Data Augmentation: To increase the diversity of the training data, the following augmentation techniques are used:
- Shearing: Random shearing is applied (shear_range = 0.2) to simulate slight geometric distortions.
- Zooming: Random zooming (zoom_range = 0.2) is implemented to account for variations in distance.
- Horizontal Flipping: Random horizontal flipping (horizontal_flip = True) is enabled to increase the variability in orientation.
These steps help the model learn robust features and generalize well to unseen data.
3.4.2. Model Architecture and Construction
The detection model is based on a convolutional neural network (CNN) designed to automatically extract spatial features from pavement images and classify various types of road defects. The construction procedure is as follows:
- Convolutional Layers: The model starts with a Conv2D layer using 32 filters with a kernel size of 3 × 3 and ReLU activation. This layer extracts low-level features from the input image (input shape: 64 × 64 × 3).
- Pooling Layers: A MaxPooling2D layer with a pool size of 2 × 2 follows, reducing the spatial dimensions and focusing on the most significant features.
- Additional Convolution and Pooling: A second convolutional layer (32 filters, 3 × 3 kernel, ReLU activation) is added, followed by another max-pooling layer to further refine the extracted features.
- Flattening and Fully Connected Layers: The output from the convolutional layers is flattened into a 1D vector. This vector is then passed to a dense (fully connected) layer with 128 units and ReLU activation, which learns higher-level representations. Finally, a dense output layer with units equal to the number of defect classes (using softmax activation) produces the probability distribution for each class.
- The following pseudocode summarizes the model construction:
model = Sequential()
model.add(Conv2D(32, (3, 3), activation = ‘relu’, input_shape = (64, 64, 3)))
model.add(MaxPooling2D(pool_size = (2, 2)))
model.add(Conv2D(32, (3, 3), activation = ‘relu’))
model.add(MaxPooling2D(pool_size = (2, 2)))
model.add(Flatten())
model.add(Dense(128, activation = ‘relu’))
model.add(Dense(num_classes, activation = ‘softmax’))
model.compile(optimizer = ‘adam’, loss = ‘categorical_crossentropy’, metrics = [‘accuracy’])
Annotations:
- Input Shape: The input images are resized to 64 × 64 pixels with three color channels (RGB) to standardize the model input.
- Optimizer and Loss Function: The Adam optimizer is used for efficient convergence, and categorical cross-entropy is chosen as the loss function for multi-class classification.
3.4.3. Model Training
The CNN model is trained on the pre-processed and augmented dataset with the following parameters:
- Epochs: The training process is executed for 20 epochs. (If there are inconsistencies with other parts of the paper regarding epoch count, they must be aligned.)
- Batch Size and Validation: A suitable batch size is selected, and the dataset is split into training and validation sets to monitor performance. Training history—including loss, accuracy, precision, recall, and F1 score—is recorded for subsequent analysis.
Hardware Specifications: Training is performed on a custom-built PC equipped with an AMD Ryzen 9 9950X CPU, an NVIDIA RTX 4070 Ti GPU (12 GB VRAM), and 32 GB RAM. These specifications ensure rapid training and scalability.
3.4.4. Prediction Function and Post-Processing
After training, the model is deployed via a prediction function that processes new images and outputs the following:
- Class Probabilities: The softmax output yields a probability for each defect class. The class with the highest probability is selected as the predicted defect type.
- Severity Determination: The prediction function also interprets the probability values to assess the severity of the defect, which is subsequently compared with the manual PCI evaluation.
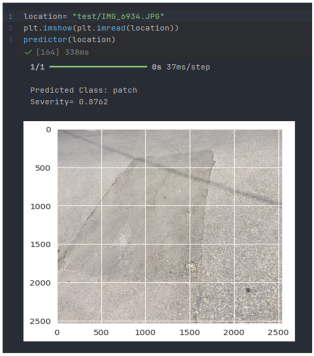
- Visualization: To assist with interpretation, visual outputs are generated using Matplotlib. Grids are superimposed on the images to indicate pixel dimensions, aiding in qualitative assessment without affecting the prediction.
Accuracy is the primary evaluation metric specified in the code. Accuracy measures the proportion of correctly classified instances over the total number of instances in the dataset. While it is a useful metric for overall performance, it may not tell the full story in imbalanced datasets. Table 6 below also provides some facts, including the loss and accuracy of the image processing code.
Table 6.
Loss and accuracy of the written image processing code.
3.4.5. Addressing Key Evaluation Metrics
To ensure a robust evaluation of the proposed CNN-based method, we included precision, recall, and F1 score in our analysis. These metrics provide a comprehensive view of the model’s performance, particularly in handling imbalanced datasets. For instance, the precision of the model reflects its ability to correctly identify defects without over-prediction, while recall demonstrates its effectiveness in capturing all true defect cases as shown in Table 7.
Table 7.
Evaluation metrics such as precision, recall, and F1 score.
- Broadening Dataset Scope:
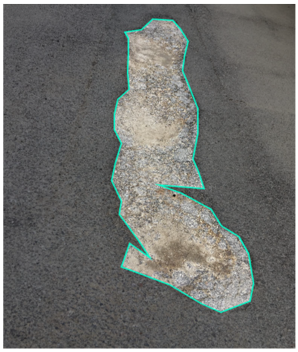
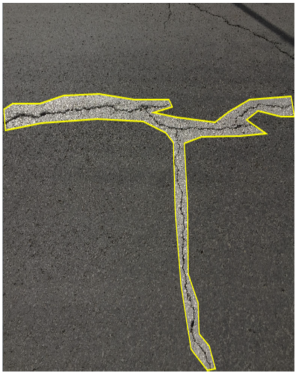
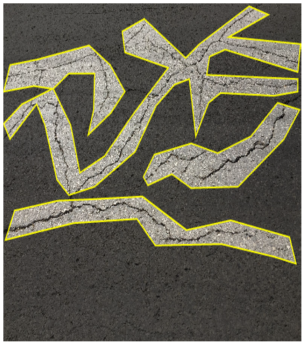
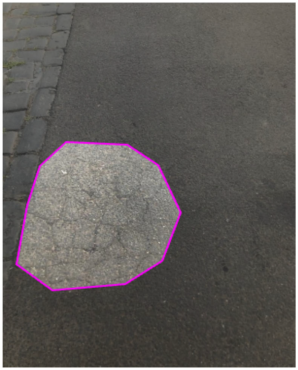
The dataset was expanded to include images of various road types, such as highways, urban streets, and rural roads, to ensure the generalizability of the method. Each image was annotated for defects like cracks, potholes, and patches. This expansion enabled the model to learn from diverse scenarios, enhancing its applicability across different environments.
- Data Pre-Processing and Annotation:
To improve reproducibility, we detailed the pre-processing steps, which included resizing images to 2540 × 2540 pixels, normalizing pixel values, and applying data augmentation techniques such as flipping and rotation. Image annotations were performed manually using open-source tools, and each annotation was cross-verified by two independent reviewers to ensure accuracy.
- Revised Training Details:
We used a custom-built PC with high-end specifications for model training, ensuring efficient computational performance. The training process spanned 20 epochs, with each epoch completed in two minutes, resulting in a total training time of 40 min. This information provides clarity on the computational requirements and scalability of the method.
- Explanation of Metrics in Table 7:
- Precision: The fraction of accurately anticipated positive cases in each class.
- For “block crack,” the precision is 0.88, indicating that 88% of predictions were true.
- Recall: Recall calculates the percentage of accurately anticipated positive instances among all actual positives in each class. For “block crack,” recall is 1.00, indicating that the model correctly identified all occurrences of the class.
- F1 Score: The harmonic mean of precision and recall, resulting in a balance of the two metrics. For “block crack,” the F1 score is 0.93, indicating high overall performance in this class.
- Support: The support column lists the number of actual instances for each class in the dataset. “Block crack” has 650 instances, while “pothole” has only 92.
- Overall Metrics:
- The total accuracy is 0.85, indicating that 85% of cases in the dataset were properly identified.
- The macro average estimates the unweighted mean of precision, recall, and F1 score across all classes, regardless of support.
- The dataset’s average F1 score is 0.71, indicating moderate performance when all classes are treated equally.
- The weighted average takes into account the number of samples for each class, making it a more accurate metric for dealing with imbalanced datasets.
3.4.6. Visualization
In Figure 2, depicted below, the x-axis corresponds to the training epochs, and the y-axis reflects the percentage of each value throughout the training procedure.
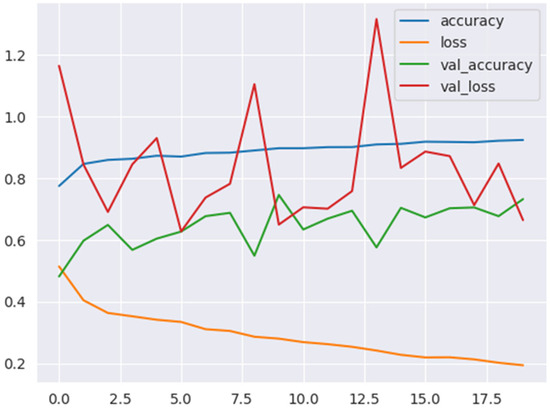
Figure 2.
Visualized training results.
Remarkably, both accuracy and validation accuracy exhibit consistent and progressive improvement with each epoch, suggesting the potential for enhanced performance with increased computational resources.
Notably, the initial three epochs witness fluctuating values in validation loss, attributed to the algorithm’s limited knowledge during the early training stages. However, as the algorithm processes more data, a noteworthy and consistent decline in error rates becomes evident, underscoring the algorithm’s learning and refinement over time.
3.4.7. Prediction Function
The predictor function termed the prediction function herein is formally defined as a mechanism for processing the spatial coordinates of an image. This function leverages a trained convolutional neural network (CNN) model to generate predictions pertaining to both the class of road damage and the associated severity, expressed as a probability.
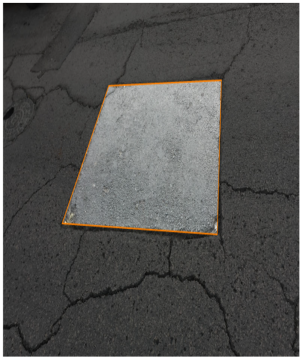
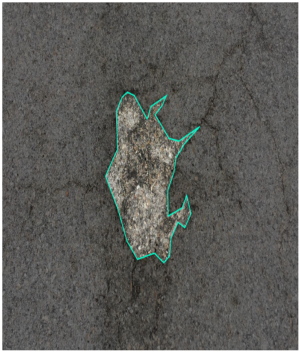
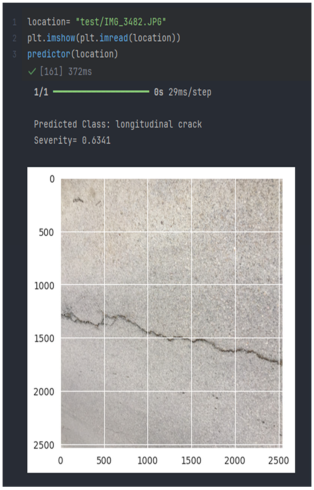
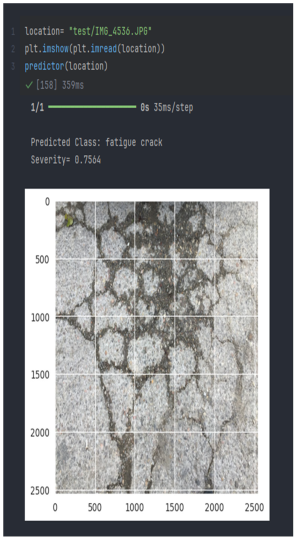
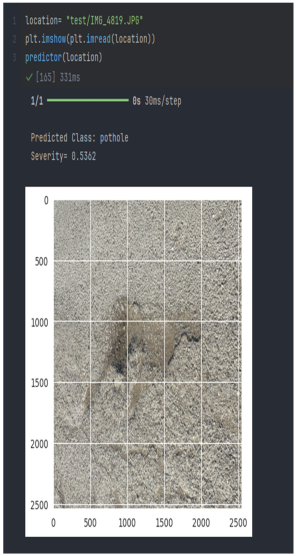
The specific structure of the predictor function is elucidated in Figure 2. Noteworthy results from its application are illustrated in the following table. It is imperative to clarify that the grids superimposed on the images in Table 8 are default visual outputs of the Matplotlib Python library, serving a utilitarian purpose of indicating image size in pixels along each axis, without introducing substantive information beyond this metric. A grid overlay divides the image into smaller segments, likely for processing and feature extraction. The x-axis and y-axis labels indicate pixel coordinates, showing that the image is approximately 2500 × 2500 pixels in resolution. The script loads an image, applies a machine learning model to detect road defects, and outputs the damage type and severity.
Table 8.
Results for different distress types.
3.4.8. A Comparative Analysis of CNNs and Other Machine Learning Algorithms
To achieve optimal performance in automated pavement fault identification and image-based classification tasks, a variety of machine learning techniques have been used. This section compares convolutional neural networks (CNNs) to other sophisticated machine learning approaches to demonstrate the superiority of the proposed CNN-based solution, please see Table 9.
Table 9.
Summary of the key metrics for different algorithms tested on the same dataset to illustrate comparative performance.
- Convolutional Neural Networks (CNNs):
CNNs are a type of deep learning model developed primarily for image processing and computer vision tasks. They excel at extracting spatial hierarchies from images, making them extremely useful for defect detection. The key strengths are as follows:
- CNNs reduce the need for manual feature engineering by automatically extracting essential features, including edges, textures, and patterns.
- Convolutional neural networks outperform traditional methods in difficult classification tasks due to their capacity to learn deep hierarchical representations.
- The architecture can be scaled with deeper layers or pre-trained models such as ResNet or VGGNet to improve performance.
However, CNNs necessitate a large amount of labeled data and processing resources, which might be a constraint in resource-constrained applications.
- 2.
- Support Vector Machines (SVMs):
SVMs have been popular in image classification problems due to their capacity to handle tiny datasets and find appropriate hyperplanes for classification.
- Advantages: SVMs excel in binary classification and are efficient with limited data.
- Limitations: Manual feature extraction for high-dimensional data, such as photos, might create biases and limit SVMs’ scalability to big datasets.
- 3.
- Decision Trees and Random Forests
Decision trees and random forests are versatile algorithms that have been applied to various image-based tasks. Their strengths include the following:
- Ease of Interpretation: These models provide clear decision paths, making them interpretable.
- Robustness: Random forests handle imbalanced datasets and noisy data effectively.
However, these methods often struggle with complex image datasets where spatial hierarchies play a critical role, leading to lower accuracy compared to CNNs.
- 4.
- Traditional Image Processing Techniques
Traditional methods rely on handcrafted features such as histogram of oriented gradients (HOG), scale-invariant feature transform (SIFT), or edge detection algorithms.
- Advantages: These methods require minimal computational resources and are easier to implement.
- Limitations: They lack adaptability to diverse datasets and perform poorly in detecting intricate or subtle defects in images.
- Comparative Evaluation
The proposed CNN-based approach demonstrates superiority over these methods due to its ability to perform the following:
- Handle Diverse Defect Types: CNNs excel at identifying a variety of pavement defects (e.g., cracks, potholes, patches) with high precision and recall.
- Adapt to Imbalanced Datasets: By employing data augmentation techniques and appropriate loss functions, CNNs mitigate the challenges posed by imbalanced datasets.
- Achieve Scalability: The model can be scaled and fine-tuned for other applications, such as unpaved road assessments.
The CNN-based method proposed in this study outperforms traditional machine learning algorithms and image processing techniques in terms of accuracy, robustness, and scalability. These results affirm the efficacy of CNNs in achieving reliable and automated pavement defect detection, especially in resource-limited settings.
4. Results and Discussion
In this section, the results of the proposed pavement evaluation method and PCI are presented in order to validate the significance of using the new method. A matching is also presented between the proposed image processing data and PCI.
Table 10 shows the road condition and maintenance strategy matching severity with the PCI scale for Amman City (Al-Abdali and Al Shmesani District) and Irbid City. It presents a comprehensive evaluation and valuable insights into the current state of road conditions in the selected roads. The assessment is based on a detailed analysis of various road segments, highlighting (a) defect types such as block cracking, fatigue (alligator), patches, potholes, and longitudinal cracks; (b) severity levels into high, medium, and low; and (c) their impact on the Pavement Condition Index (PCI) scale, which is a key indicator of road health. The last column of Table 8 displays average accuracy based on defect type; for example, block cracking was detected at Al Idrisi Street and Abed Al Hameed Sharaf Street in Amman City. The average accuracy for the high severity level of block cracking was 93.01%, whereas the average accuracy for the medium severity level of block cracking was 92.33%, and the average accuracy for the low severity level was 92.11%. These average accuracy numbers reflect that the proposed system and application of this research work can automatically detect and classify the defects and their severity successfully and with high effectiveness. The same situation was in Irbid city cases; all average accuracy numbers were high above 85% for different types of defects, and this means that the proposed system and application are working despite case studies variation. Based on the assessment, the following maintenance strategy is recommended: (1) Roads with high severity defects (0–57%) should be prioritized for immediate maintenance and repair to prevent further deterioration; and (2) implement a regular inspection schedule to monitor and address medium and low severity defects, ensuring timely interventions to maintain road health.
Table 10.
The image processing results for the selected roads (road length (m), number of defects, defect type, and accuracy based on defect type).
A matching process was also performed among captured images and PCI data in order to identify the type and severity of each pavement distress type, as shown in Figure 3 and Figure 4, for Al Idrisi Street and Al Kura, Der Abi Saeed, and Natifa as samples for Amman City and Irbid City, respectively.
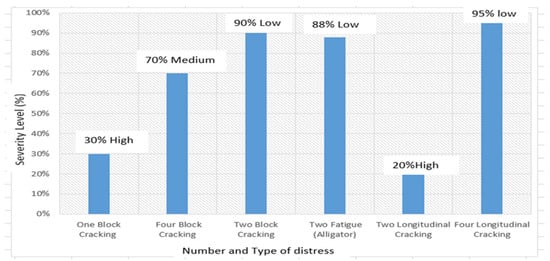
Figure 3.
Results using the Pavement Condition Index method at Al Idrisi Street of Amman City.
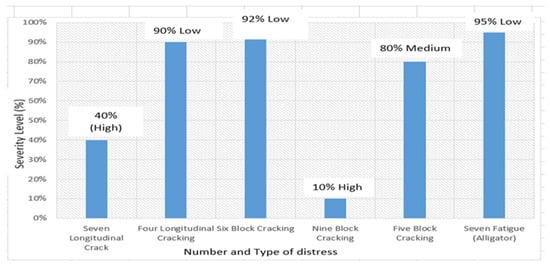
Figure 4.
Results using the Pavement Condition Index method for Al Kura, Der Abi Saeed, Natifa of Irbid City.
Figure 3 presents the three types of defects (seven block cracks, two fatigue (alligator) cracks, and six longitudinal cracks) at Al Idrisi Street in Amman City. Figure 3 was plotted using the conducted visual inspection data for PCI Evaluation, where the x-axis data represent the type and number of defects. At the same time, the y-axis represents the severity level (low, medium, or high) as a percentage for each defect type based on the custom PCI rating scale described in Section 3.2, which can easily give an indication about the situation of the pavement. Based on the drawing, seven locations on AlIdrisi Street suffer from block cracking; one of them has a high severity level (approximately 30%); four of them have a medium severity level (approximately 70%); and the remaining two have a low severity level (90%) based on the PCI method. These results match and agree with the results from image processing techniques as shown in Table 10, where the severity level high is within (0–57%), whereas the severity medium is within (58–85%), and the severity low is within (86–100%). This means that there is a matching and agreement between the results from the PCI method and the results from image processing techniques. Moreover, the results of fatigue (alligator) and longitudinal crack based on the PCI method at AlIdrisi Street also validate and match the results from image processing techniques (Table 10). The same comparison for Al Kura, Der Abi Saeed, and Natifa of Irbid City was performed as shown in Figure 4. Figure 4 was plotted based on the results of the PCI method between the number and type of defect (x-axis) and severity level for each type (y-axis). There are eleven longitudinal cracks, twenty block cracks, and seven fatigue (alligator) with different severities (low, medium, and high). The situation for Al Kura, Der Abi Saeed, and Natifa of Irbid City data showed that there are seven longitudinal cracks with approximately 40% (high severity level), while the remaining four longitudinal cracks have a percentage of 90 (low severity level). These values of severity level agree with image processing results as seen in Table 10. The same comparison was performed for the remaining defects of the Al Kura, Der Abi Saeed, and Natifa of Irbid City. In conclusion, the results from Figure 3 and Figure 4 are consistent and in agreement with the conducted data and results from captured images for the validation process.
5. Conclusions and Future Directions
The proposed road condition assessment method provides a comprehensive overview of road conditions in Amman City and Irbid City, offering valuable insights for urban planners, engineers, and policymakers. The maintenance strategy recommendations aim to contribute to the sustainability and resilience of urban road networks, ensuring safe and efficient mobility for the residents. This study focused on using a proposed method for assessing the condition of roads based on image processing using a vehicle-mounted camera. A road inspection and a PCI calculation of all roads were also carried out in order to validate the proposed image processing monitoring method.
The study also pointed to the procedure that was used in the development of the defect prediction model through the captured images and their processing. The methods of processing the images clearly have been clarified, which will achieve high accuracy in determining the type and severity of defects during image capture. A special application has been developed for this research that enables it to monitor and determine the efficiency of the road pavements by photographing it using any type of camera. Where the designer application has proven its ability to deal with various images and defects apparent in them.
The results indicated a significant match between the data measured by the camera and the field observation regarding the type, severity, and location of defects scattered on the road surface. Five different types of pavement defects were considered in this study. The overall accuracy of using the CNN model for detecting and classifying the pavement distresses was 85%. This accuracy value indicated the ability of this proposed evaluation method to be a significant method for detecting and classifying a wide range of pavement defects on paved roads.
In the future direction, the proposed pavement evaluation method will be performed on unpaved roads and concrete pavement in order to provide a comprehensive evaluation of the road health status. Therefore, understanding the ability of this technique to accurately monitor and assess road surfaces. Also, more distress types will be taken into consideration in further studies.
Author Contributions
Conceptualization, A.S. and M.T.O.; methodology, A.S. and A.B.; software, A.B.; validation, B.A.-M., S.M. and S.A.; formal analysis, A.S.; writing—original draft preparation, A.S. and B.A.-M.; writing—review and editing, B.A.-M., S.M. All authors have read and agreed to the published version of the manuscript.
Funding
This research received no external funding.
Institutional Review Board Statement
Not applicable.
Informed Consent Statement
Not applicable.
Data Availability Statement
The database is available under request.
Conflicts of Interest
The authors declare no conflict of interest.
References
- Msallam, M.; Al Rawi, O.S.; Abudayyeh, D.; Assi, I. Development of a pavement management system to be used in highway pavement evaluation in Jordan. Development 2014, 6, 330–342. [Google Scholar]
- Khahro, S.H. Defects in Flexible Pavements: A Relationship Assessment of the Defects of a Low-Cost Pavement Management System. Sustainability 2022, 14, 16475. [Google Scholar] [CrossRef]
- Cao, W.; Liu, Q.; He, Z. Review of pavement defect detection methods. IEEE Access 2020, 8, 14531–14544. [Google Scholar] [CrossRef]
- Shtayat, A.; Moridpour, S.; Best, B.; Rumi, S. An overview of pavement degradation prediction models. J. Adv. Transp. 2022, 2022, 7783588. [Google Scholar] [CrossRef]
- Shahin, M.Y. Pavement Management for Airports, Roads, and Parking Lots, 2nd ed.; Springer: New York, NY, USA, 2005. [Google Scholar]
- Van Hauwermeiren, W.; David, J.; Dekoninck, L.; De Pessemier, T.; Joseph, W.; Botteldooren, D.; Martens, L.; Filipan, K.; De Coensel, B. Assessing road pavement quality based on opportunistic in-car sound and vibration monitoring. In Proceedings of the 26th International Congress on Sound and Vibration (ICSV 2019), Montreal, QC, Canada, 7–11 July 2019; Canadian Acoustical Association: Ottawa, ON, Canada, 2019. [Google Scholar]
- Al Ayubi, A.R. Evaluasi Kondisi Permukaan Jalan Godean Menggunakan Metode Surface Disstres Index (SDI) dan Present Serviceabilty Index (PSI) Beserta Penanganannya. PhD Thesis, Universitas Islam Indonesia, Krawitan, Indonesia, 2024. [Google Scholar]
- Karim, F.M.; Rubasi, K.A.H.; Saleh, A.A. The road pavement condition index (PCI) evaluation and maintenance: A case study of Yemen. Organ. Technol. Manag. Constr. Int. J. 2016, 8, 1446–1455. [Google Scholar] [CrossRef]
- Sholevar, N.; Golroo, A.; Esfahani, S.R. Machine learning techniques for pavement condition evaluation. Autom. Constr. 2022, 136, 104190. [Google Scholar] [CrossRef]
- Issa, A.; Samaneh, H.; Ghanim, M. Predicting pavement condition index using artificial neural networks approach. Ain Shams Eng. J. 2022, 13, 101490. [Google Scholar] [CrossRef]
- Dong, H.; Song, K.; Wang, Y.; Yan, Y.; Jiang, P. Automatic inspection and evaluation system for pavement distress. IEEE Trans. Intell. Transp. Syst. 2021, 23, 12377–12387. [Google Scholar] [CrossRef]
- Fuentes, L.; Camargo, R.; Martínez-Arguelles, G.; Komba, J.J.; Naik, B.; Walubita, L.F. Pavement serviceability evaluation using whole body vibration techniques: A case study for urban roads. Int. J. Pavement Eng. 2021, 22, 1238–1249. [Google Scholar] [CrossRef]
- Scheffy, C.; Diaz, E. Asphalt concrete fatigue crack monitoring and analysis using digital image analysis techniques. In Proceedings of the Accelerated Pavement Testing International Conference, Reno, NV, USA, 18–20 October 1999. [Google Scholar]
- Shatnawi, N.; Obaidat, M.T.; Al-Mistarehi, B. Road pavement rut detection using mobile and static terrestrial laser scanning. Appl. Geomat. 2021, 13, 901–911. [Google Scholar] [CrossRef]
- Wang, K. Design and Implementation of Automated System for Pavement Surface Distress Survey. J. Infrastruct. Syst. 2000, 6, 24–32. [Google Scholar] [CrossRef]
- Zhang, L.; Yang, F.; Zhang, Y.D.; Zhu, Y.J. Road Crack Detection Using Deep Convolutional Neural Network. In Proceedings of the 2016 IEEE International Conference on Image Processing (ICIP), Phoenix, AZ, USA, 25–28 September 2016; pp. 3708–3712. [Google Scholar]
- Zhang, W.; Zhang, Z.; Qi, D.; Liu, Y. Automatic Crack Detection and Classification Method for Subway Tunnel Safety Monitoring. Sensors 2014, 14, 19307–19328. [Google Scholar] [CrossRef] [PubMed]
- Shatnawi, N. Automatic Pavement Cracks Detection using Image Processing Techniques and Neural Network. Int. J. Adv. Comput. Sci. Appl. 2018, 9, 399–402. [Google Scholar] [CrossRef]
- Shi, Y.; Cui, L.; Qi, Z.; Meng, F.; Chen, Z. Automatic Road Crack Detection Using Random Structured Forests. IEEE Trans. Intell. Transp. Syst. 2016, 17, 3434–3445. [Google Scholar] [CrossRef]
Disclaimer/Publisher’s Note: The statements, opinions and data contained in all publications are solely those of the individual author(s) and contributor(s) and not of MDPI and/or the editor(s). MDPI and/or the editor(s) disclaim responsibility for any injury to people or property resulting from any ideas, methods, instructions or products referred to in the content. |
© 2025 by the authors. Licensee MDPI, Basel, Switzerland. This article is an open access article distributed under the terms and conditions of the Creative Commons Attribution (CC BY) license (https://creativecommons.org/licenses/by/4.0/).