Article

Valorisation of Limestone in Sustainable Cements

1
Department of Materials, Environmental Sciences and Urban Planning (SIMAU), Università Politecnica delle Marche, Via Brecce Bianche 12, UdR INSTM, 60131 Ancona, Italy
2
Innovation Centre for Sustainable Construction (ICSC), CRH Nederland B.V., De Klencke 10-12, 1083 HL Amsterdam, The Netherlands
3
Istituto Di Scienze Dell’Atmosfera e Del Clima (ISAC-CNR), Via Piero Gobetti 101, 40129 Bologna, Italy
*
Author to whom correspondence should be addressed.
Sustainability 2025, 17(6), 2402; https://doi.org/10.3390/su17062402
Submission received: 27 January 2025 / Revised: 20 February 2025 / Accepted: 26 February 2025 / Published: 10 March 2025
(This article belongs to the Section Sustainable Materials)

Abstract

This study investigates the development of two sustainable cements, CEM II/B-LL and CEM VI, in accordance with the UNI EN 197-1 and 197-5 standards. CEM II/B-LL was produced by replacing Portland cement with limestone (LS) at varying dosages (0%, 15%, 25%, and 35% by mass), and CEM VI was made by substituting blast furnace slag with limestone at different levels (0%, 10%, 20%, 30%, and 40% by mass). The results show that both binders are classified as structural cements. LS substitution increases the setting time of CEM II/B-LL but does not significantly affect the setting time of CEM VI. When cured at low temperatures (10 °C), CEM VI mortars retain their mechanical properties even at high LS levels, making them particularly suitable for cold climates. Mortar properties such as total porosity and capillary water absorption increase with LS content, with CEM VI exhibiting lower sensitivity to LS additions. Free shrinkage in CEM II/B-LL mortars decreases with LS content, whereas in CEM VI mortars, it initially increases with up to 20% LS and then decreases at higher LS levels (30–40%). Restrained shrinkage is also lower in CEM VI than in CEM II/B-LL. The Global Warming Potential (GWP) of CEM II/B-LL decreases significantly with increased LS content, whereas in CEM VI, it remains almost constant up to a 40% substitution. However, CEM VI demonstrates a 50% lower environmental impact compared to CEM II/B-LL, underscoring its superior sustainability.

1. Introduction

The construction sector consumes 40% of the world’s energy resources [1], with up to 50% of this consumption attributed to building materials [2]. Among these materials, more than 50% of the energy usage comes from mortars and concretes [3]. While these materials have lower embodied energy per unit of weight or volume compared to others like plastics, metals, and glass [4], they are undeniably the most widely consumed building materials [5].
The key component of mortar and concrete is cement, a cost-effective hydraulic binder. This finely ground inorganic material sets and hardens through hydration reactions when mixed with water. Similar to concrete, global cement production is steadily increasing, with an estimated output of 4.37 billion tons projected for 2023 [6].
The European Cement Standard (EN 197-1:2000) [7] defines 27 distinct types of cement (CEM), grouped into five main classes (CEM I to CEM V) and six strength categories. In CEM I, Ordinary Portland Cement (OPC), the Portland cement clinker (K) content exceeds 95%. In CEM II Portland composite cement, K is 65–94%; in CEM III blast furnace slag cement, K is 5–64%; in CEM IV Pozzolanic cement, K is 45–89%; and in CEM V composite cement, K is 20–64%. Portland cement clinker is the primary constituent, while other materials, referred to as supplementary cementitious materials (SCMs) [8], can partially replace it in what is known as Portland Composite Cement (PCC).
For many years, OPC has been regarded as the benchmark structural material for durable buildings and infrastructure. However, its production requires substantial mineral resources, such as high-quality limestone and clay, as well as significant amounts of energy and fuel. Additionally, it is a major source of greenhouse gas emissions: the global cement industry accounts for at least 5% of total CO2 emissions. Indeed, the production of 1 kg of Portland clinker releases nearly 1 kg of CO2 into the atmosphere [9]. The high levels of CO2 emissions associated with Portland cement production are primarily due to two factors: a total of 60% of the emissions result from the decarbonisation of limestone, which is used as a raw material, while the remaining 40% is attributed to the combustion of fuels required to heat the raw materials to a high temperature of 1450 °C [10].
To mitigate the environmental impacts associated with cement (and consequently concrete) production, the European Commission has advocated for improved production methods and formulations aimed at reducing CO2 emissions from cement manufacturing [11]. However, at present, PCC remains the only authorised option for structural applications to reduce cement-related CO2 emissions [12,13]. SCMs, such as fly ash, slag, limestone, silica fume, and natural pozzolans, are industrial by-products or widely available, low-cost natural materials. Their inclusion in cement reduces CO2 emissions by increasing the replacement of Portland clinker. SCMs generally react with calcium hydroxide in the presence of water to form additional cementitious compounds. However, concrete based on low-clinker cements (e.g., K < 65%) has historically faced challenges related to reduced strength and durability. This is due to differences in reactivity and grindability between SCMs and clinkers, as well as variability among the SCMs themselves [14].
Recently, further research efforts, particularly within the EnDurCrete Project (GA no. 760639) [14], have led to the development of two new sustainable ternary types of PCC. In response, in 2021, the European Technical Committee for Standardization introduced a new standard, EN 197-5 [15], to include the composition of these innovative cements. The new standard defines two additional cement classes:
  • CEM II/C-M: This class reduces the minimum K content of the previous CEM II from 65% to 50%;
  • CEM VI: A new cement class not included in EN 197-1, featuring a K content of 35–49%, 31–59% blast furnace slag (BFS), and 6–20% natural pozzolan, fly ash, or limestone.
In particular, the main component of the new CEM VI cement is BFS. BFS is an industrial by-product of steel production, composed primarily of silicates and aluminosilicates of calcium, aluminium, magnesium, and iron. Due to its pozzolanic and low hydraulic properties, BFS reacts with calcium hydroxide and water. Albeit slowly, additional cementitious compounds are formed, thereby enhancing the overall strength and durability of the resulting material [16,17]. According to Divsholi et al. [18], replacing 10%, 30%, and 50% of OPC with BFS increases workability and slightly improves the compressive strength of mortars. Additionally, the heat generated during the early stages of hydration is reduced, thanks to the slower hydration rate of slag [19,20,21]. This characteristic is particularly valuable in massive concrete structures, such as dams, where excessive heat generation during hydration can lead to cracking and reduced long-term durability [22,23]. Therefore, CEM VI not only reduces the environmental footprint of concrete but also has the potential to enhance its mechanical properties and durability [24,25].
However, the growing demand for BFS is leading to material scarcity and increasing costs. Incorporating limestone as an SCM offers a practical and sustainable solution to address the potential shortage of BFS [26,27]. Limestone (LS) is a sedimentary rock primarily composed of calcium carbonate (CaCO3). When used in combination with other SCMs, it improves workability [28,29] and enhances the long-term strength of concrete [30,31]. Its abundant availability, positive impact on concrete properties, and cost-effectiveness make it an excellent alternative for ensuring the continued production of high-quality and sustainable cementitious blends [32]. Notably, it has been estimated that adding 10 wt% LS to cement can reduce CO2 emissions by 60% and production costs by 21%, all while maintaining the same concrete strength [33]. LS powder influences binder properties through filler, nucleation, dilution, and chemical effects, depending on its particle size and quantity. The filler effect of LS contributes to microstructure refinement, reducing the porosity of cement-based materials when LS particle size is smaller than cement [34,35,36]. The nucleation effect [37,38] accelerates the early-stage hydration of tricalcium silicate (C3S) by providing favourable surfaces on LS particles for calcium silicate hydrate (C-S-H) deposition and growth. According to Li et al. [33], adding LS to slag concrete not only enhances early strength due to nucleation and filler effects but also significantly reduces slump loss, carbonation depth, and drying shrinkage. LS powder improves the microstructure of concrete by reducing the volume of large capillary pores and increasing early-age hydration. Conversely, the dilution effect of LS reduces the hydration peak of C3S, thereby decreasing the overall amount of hydration products and increasing the porosity of cement-based materials [39,40]. Briki et al. [41] investigated the impact of LS fineness on cement hydration and strength development. Replacing 20% of cement with fine LS does not affect mechanical strength after 7 days of curing but enhances C3S hydration, compensating for the dilution effect caused by the reduced clinker content. In contrast, replacing 20% of cement with coarse LS results in lower strength development due to its minimal impact on C3S hydration and dilution effect. Furthermore, LS chemically reacts with C3A and C4AF to form calcium carboaluminate (chemical effect). This prevents C3A and C4AF from reacting with ettringite, thereby stabilising ettringite formation. This stabilisation increases the production of hydration products and further reduces material porosity [42,43].
The existing literature already includes numerous studies on substituting OPC with BFS and LS. Elkhaldi et al. [44] present the durability parameters of resistance to carbonation, the electrical resistivity for concretes and the sustainability of multi-composite cements with ground-granulated blast furnace slag (GGBFS) and limestone according to EN 197-5. In particular, the ternary concretes seem to have a low CO2 efficiency indicator (CEI) coefficient. The combination of clinker, slag, and limestone offers new possibilities for reducing the CO2 emissions of building materials while meeting the required durability. However, the reported results are generally limited to replacing up to 35% of PC with LS for CEM II/B-LL, as per UNI EN 197-1, and replacing up to 20% of BFS with LS for CEM VI, as per UNI EN 197-5, under standard curing conditions.
This study goes further by replacing BFS with LS at higher levels, up to 30% and 40%, while using the minimum clinker content allowed by the standard (35%) to develop new cements: CEM II/B-LL and CEM VI. This makes the identification of alternative SCMs a critical priority. The newly developed blended cements were characterised both for their compliance with the properties required by EN 197-1 and EN 197-5 standards, such as strength class and setting times (at 20 °C) and their mechanical strength development under varying temperature conditions, including cold (10 °C) and warm (40 °C) climates. Additionally, since high rates of clinker substitution with SCMs can sometimes compromise the durability of concrete—particularly in harsh environmental conditions [45]—this study also investigates the impact of increasing LS content in place of PC (for CEM II) and BFS (for CEM VI) on key durability parameters. These parameters include pore size distribution, drying shrinkage, and capillary water absorption of the corresponding conglomerates. Finally, the environmental impacts of the studied blended cements, expressed as kilograms of CO2 equivalent per ton of cement and per cubic meter of mortar, were compared using a Life Cycle Assessment (LCA). This comparison provides insight into the carbon footprint and environmental benefits of these innovative cement formulations.

2. Experimental Program
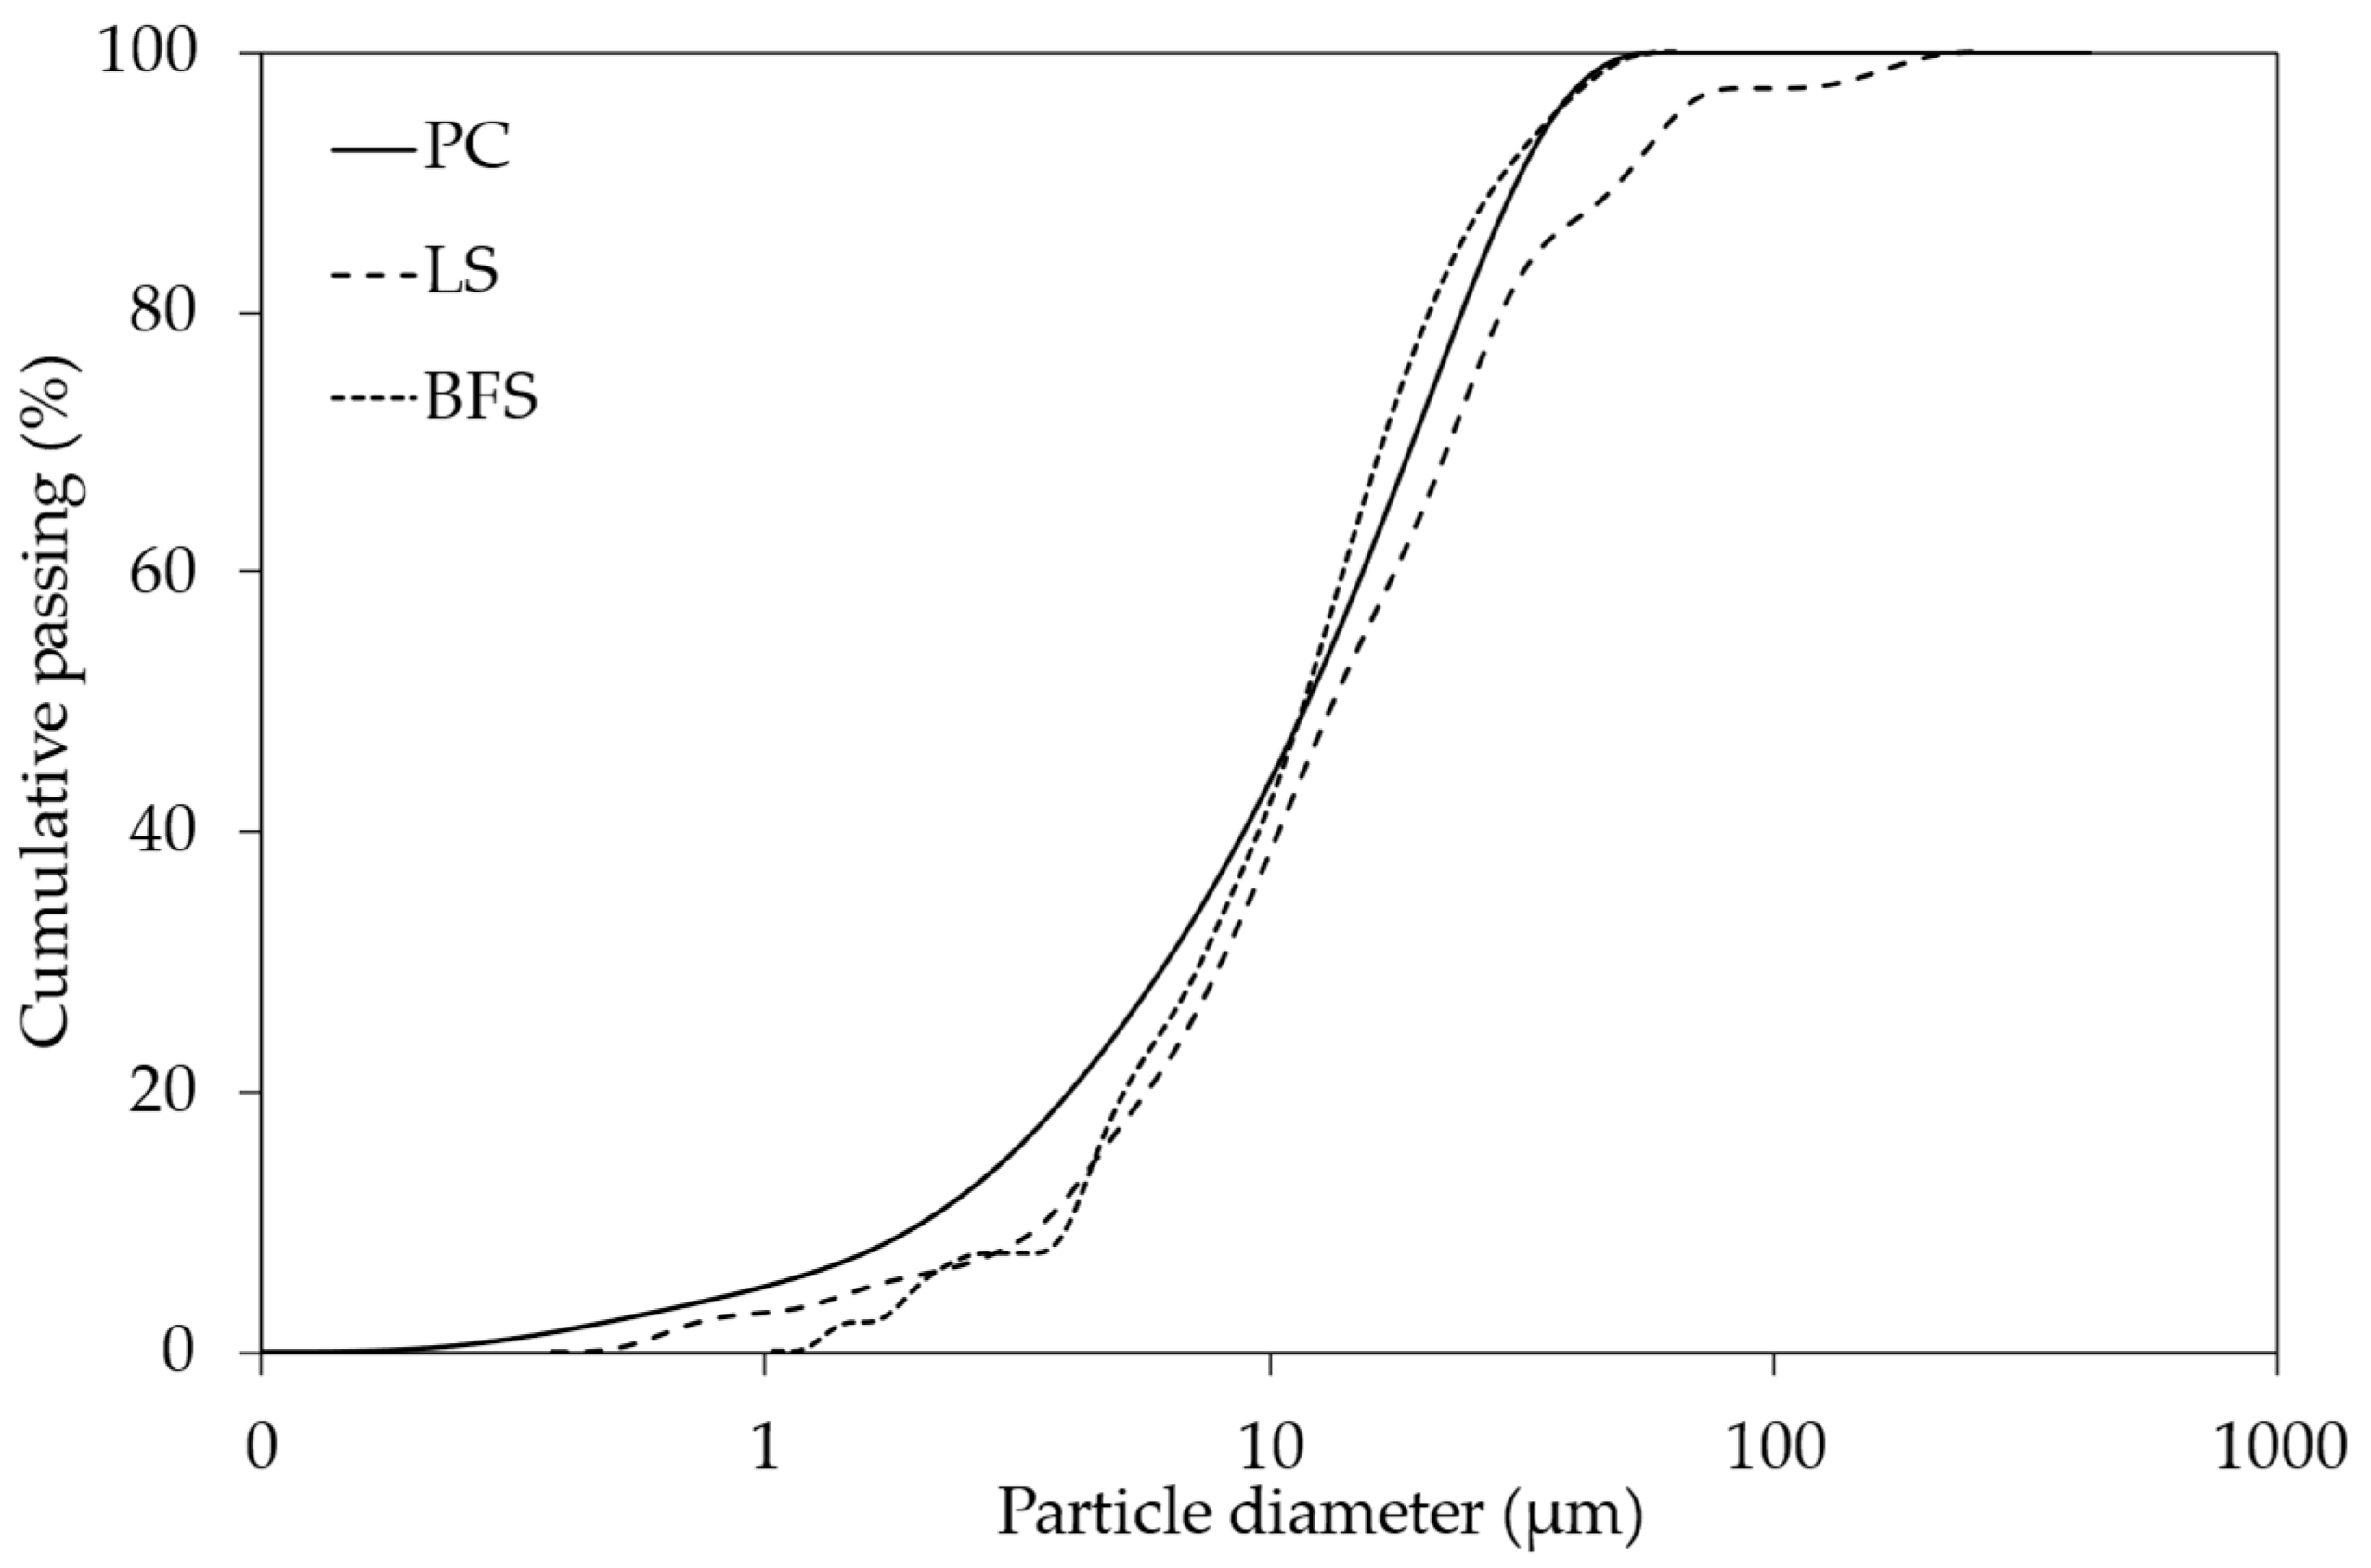
2.1. Materials

Portland cement CEM I 52.5R (PC), limestone powder (LS) and blast furnace slag (BFS), all supplied by the Cement Roadstone Holdings CRH plc [46], were used to manufacture the binders studied in this paper. PC consists of 95–100% clinker by mass. The chemical compositions of PC, LS and BFS are presented in Table 1. The mineral compositions of LS and BFS (Figure 1) were analysed via X-ray diffraction (XRD) using a Bruker AXS D8 Advance Diffractometer/Reflectometer, operating with radiation over a 2θ range of 5° to 70°. The results indicate that LS contains small amounts of quartz impurities, whereas BFS is entirely amorphous. The cumulative particle size distribution (PSD) of PC, LS, and BFS, measured with a Laser Granulometer Saturn Digisizer (Micromeritics Instrument Corporation, Norcross, GA, USA), is illustrated in Figure 2. Physical properties, including relative density, specific surface area, and mean particle size, are summarised in Table 2. Standard sand with a grain size smaller than 2 mm was used to produce standard mortars for classifying the blended cements, CEM II/B-LL and CEM VI, based on their strength classes in accordance with the UNI EN 197-1 standard.

2.2. Methods

2.2.1. Formulation of the Binders

To manufacture mortar mixes with CEM II/B-LL and CEM VI blended cements, it was essential to adhere to the requirements of the UNI EN 197-1 and UNI EN 197-5 standards. According to UNI EN 197-1, CEM II/B-LL should contain 0% to 35% LS replacement, while UNI EN 197-5 specifies that CEM VI should include 31% to 59% BFS replacement with 6–20% LS replacement. For CEM II/B-LL, in this study, LS replaces PC at dosage rates of 0% (reference mix), 15%, 25%, and 35%, which is the maximum replacement level allowed by UNI EN 197-1. In the case of CEM VI, BFS replacement is combined with LS at dosage rates of 0% (reference mix), 10%, 20%, 30%, and 40%. The reference mix for CEM VI corresponds to a classification of CEM III/A, as defined by UNI EN 197-1, achieved by mixing BFS with the minimum cement content of 35% by mass. While UNI EN 197-5 sets the maximum BFS substitution at 20%, this study also investigated substitutions at 30% and 40%, exceeding the standard’s limit. For CEM VI, the minimum proportion of PC was explored to align with the environmental sustainability goals of this research.

2.2.2. Setting Time

According to UNI EN 197-1, a binder can be classified as a cement if its initial setting time exceeds 45 min, 60 min, and 75 min for the 52.5 R/N/L, 42.5 R/N/L, and 32.5 R/N/L strength classes, respectively. The strength class of the blended cements is described hereafter (see Section 2.2.3). The limits for the final setting time, however, are based on best practices, requiring that it not exceed 12 h. Thus, the setting times of the newly manufactured binders were determined in accordance with the EN 196-3 standard [47], which outlines the procedures for assessing normalised consistency, setting times, and cement stability. The automatic Vicat device was programmed to measure penetrations at 5 min intervals from the start of the test. The initial setting time (in min) was defined as the period from time zero until the needle reached a gap of 6 mm ± 3 mm from the base plate. At this point, the machine was paused, and the truncated cone mould was inverted to test the paste surface that had been in contact with the base plate. The final setting time was determined by taking measurements at 15 min intervals until the needle penetration depth reached 0.5 mm. The final setting time was recorded as the elapsed time from zero to the point when the penetration depth was no longer measurable beyond 0.5 mm.

2.2.3. Standard Mortars Preparation and Classification

To classify the strength class of the blended cements in accordance with UNI EN 197-1, standard mortars were prepared using water-to-binder (w/b) and aggregate-to-binder (a/b) ratios of 0.5 and 3.0 by mass, respectively. The binder content consisted of the combined quantities of PC, LS, and BFS. The mix designs are detailed in Table 3. Following the EN 196-1 standard [48], the mortars were prepared by first dry mixing the powders, then adding the standard sand, and finally gradually introducing water. Mixing was performed using a laboratory planetary mixer, initially at a slow speed, followed by high-speed mixing for 120 s.
Workability, a critical property for ensuring ease of application, effective compaction, and reduced porosity in the hardened state, was evaluated. Greater workability reduces the need for vibration during moulding, resulting in improved homogeneity and mechanical resistance after curing. While not explicitly required by the UNI EN standards, the influence of BFS and LS additions on workability was assessed using a shaking table as per the EN 1015-3 standard [49]. The flow value was measured according to the EN 1015-6 standard [50], and the results are reported in Table 3.
The prepared mortars were poured into 40 mm × 40 mm × 160 mm moulds and vibrated to eliminate entrapped air. The specimens were then covered with plastic film to prevent water evaporation. Specimens assigned to standard curing were placed in a climate chamber at a relative humidity (RH) of 50 ± 5% and a temperature (T) of 20 ± 1 °C for the first 24 h. To assess the effect of temperature on the strength development of the new binders, additional specimens were cured in an oven at 40 ± 1 °C and in a refrigerator at 10 ± 5 °C. After 24 h, all specimens were demoulded and covered with plastic film again, maintaining the same RH and temperature conditions for 28 days. Subsequently, the plastic film was removed, and the specimens were allowed to cure until 90 days under three distinct conditions: climate chamber conditions (RH = 50 ± 5%, T = 20 ± 1 °C), high temperature (T = 40 ± 1 °C), and low temperature (T = 10 ± 5 °C).

2.2.4. Mechanical Characterisation

The mechanical strength development of the different standard mortars was tested not only at 2, 7, and 28 days, as required by the UNI EN 197-1 standard for cement strength classification, but also at earlier (1 day) and longer (90 days) curing times. Tests were conducted on 40 mm × 40 mm × 160 mm specimens using a Galdabini hydraulic press equipped with a load cell (maximum load capacity: 400 kN). Additionally, the same specimens prepared for mechanical strength tests were also used to measure the dynamic modulus of elasticity (Ed) after 28 days of curing. This measurement was performed by direct ultrasonic signal transmission using a Portable Ultrasonic Non-Destructive Digital Indicator Tester (PUNDIT) developed by Proceq (Schwerzenbach, Switzerland) in accordance with the UNI EN 12504-4 standard [51]. To ensure proper contact between the probes and the specimen, a thin layer of soft grease was applied to the probes and the end surfaces of the specimens (40 mm × 40 mm). The PUNDIT measures the ultrasonic pulse transit time (in μs) as it passes through the specimen. Given the specimen length of 160 mm, the velocity of the ultrasonic pulse was calculated using Equation (1)
v = l t
where v is the velocity of the ultrasonic pulse (m/s), l is the length of the samples (m), and t is the propagation time (s). By calculating the speed of the ultrasonic pulse, v, and the density of the sample, ρ, the dynamic modulus of elasticity can finally be measured with Equation (2):
E d = v 2 ρ   [ 1   +   γ d 1 2 γ d ] 1 γ d
where E d is the dynamic modulus of elasticity (GPa), ρ is the density of the sample (kg/m3), and γ d is the Poisson’s modulus (a dimensionless number taken equal to 0.20 for cement mortars) [52].

2.2.5. Microstructural Analysis

Mercury Intrusion Porosimetry (MIP) was conducted on small samples of each manufactured mortar after 90 days of curing to investigate the microstructure of the hardened mortars. MIP was performed using a Thermo Fisher 240 Pascal (Thermo Fisher, Waltham, MA, USA) (pressure range between 0.01 and 200 MPa) and a Thermo Fisher 140 Pascal (Thermo Fisher, Waltham, MA, USA) (pressure range between 0.1 and 400 kPa).

2.2.6. Capillary Water Absorption

A high propensity for capillary water absorption is detrimental to the durability of cement-based materials, as water acts as the primary carrier of aggressive ions [53]. To assess this, the water absorbed per unit area (Qi) and the capillary water absorption coefficient (AC) were determined according to the UNI EN 15801 standard [54]. After 28 days of curing, specimens were dried in an oven at 40 ± 1 °C until reaching a constant mass, then allowed to cool to room temperature for 2 h. Subsequently, the specimens (40 mm × 40 mm × 80 mm) were placed in a sealed container with wet absorbent paper at the bottom and weighed at specific intervals over eight days.

2.2.7. Drying Shrinkage

Drying shrinkage is a critical factor influencing the durability of cement-based materials, occurring during the curing process due to water evaporation. If restrained, drying shrinkage increases the likelihood of crack formation, facilitating the ingress of aggressive agents and compromising material durability. Free drying shrinkage and restrained drying shrinkage were measured starting from the first day of casting, and this was monitored for 60 days. Tests were conducted on prismatic specimens with dimensions of 40 mm × 40 mm × 160 mm and 50 mm × 50 mm × 250 mm, respectively, following the UNI EN 12617-4 and UNI EN 8147 standards [55,56]. The measurement of drying shrinkage, both free and restrained, involves comparing the longitudinal dimension of a steel reference bar with a known length (which remains constant over time) to the longitudinal dimension of the specimens, which undergo shrinkage. The coefficient of expansion of the reference bar is considered negligible.
The specimens are kept for 24 h of curing in moulds with plastic sheets at RH = 95 ± 5% and T = 20 ± 1 °C in a climate chamber and then demoulded and placed at RH = 50 ± 5% and T = 20 ± 1 °C (climate chamber condition) on two steel bars to minimise constraints on free shrinkage with uniform measurements on all sides of the samples. The specimen and the bar are inserted into the instrument. The measurement is made by keeping the specimen and the bar in the same position, with an accuracy of 0.005 mm. The procedure is repeated daily during the two weeks following the demoulding, when the shrinkage phenomenon is most intense, and then continues with two measurements per week until the 60th day. The difference between the measurement of the specimen and the measurement of the bar with a fixed length constitutes the shrinkage. Additionally, the percentage of water loss due to evaporation was recorded during the tests. For each mix, three specimens were tested, and the average results were reported.

2.2.8. Lyfe Cycle Assessment Analysis

To evaluate the environmental impact of producing the CEM II/B-LL and CEM VI cements, a Life Cycle Assessment (LCA) was performed in compliance with the ISO 14040 and ISO 14044 standards [57,58]. The functional unit (FU) was defined to provide a reference for comparing the LCA results across different systems. The chosen FUs for this process were 1 ton of cement and 1 m3 of standard mortar. To assess the complete life cycle of the products, the GCCA Industry EPD Tool for Cement and Concrete was utilised for the environmental self-certification of the blended cements. The data were entered into the EPD panel on the GCCA EPD Tool website [59], and the program calculated the total Global Warming Potential (GWP) in kg of CO2 equivalent. During the inventory phase, material quantifications were derived from the mix designs, expressed in kg/m3. Default transportation impacts from the GCCA database were used, representing the average environmental impact recorded by various companies. For the construction phase, an approximation of the energy contributions from machinery and climate-controlled environments was considered. For the end-of-life phase, only on-site demolition activities, being the most impactful, were accounted for, excluding material recycling. The LCA analysis results of both 1 ton of cement and 1 m3 of concrete were then further correlated to the compressive mechanical strength achieved after 28 days of curing.

3. Results and Discussion

3.1. Fresh State Properties

The workability results (Table 3) indicate that all CEM II/B-LL and CEM VI mortars achieve a plastic consistency, with flow values ranging between 140 and 200 mm, as per the UNI EN 1015-3 standard, regardless of the LS filler content. Even in CEM VI, where the replacement of PC is higher, the consistency of fresh mortars remains unaffected. Similarly, Courard et al. [60] analysed two cements (Portland cement and granulated blast furnace slag cement) with four substitution rates (0%, 15%, 23%, and 27% by mass) of LS filler. Their research demonstrated that workability remains consistent across the two types of mortars, irrespective of the mixture composition and LS filler content.
The initial and final setting times of CEM II/B-LL and CEM VI are reported in Table 4. The results indicate that for CEM II/B-LL, the setting times increase with higher PC substitution by LS, whereas for CEM VI, they are not significantly affected by the substitution of BFS with LS. In CEM II/B-LL, this increase is attributed to the reduction in binder content (CEM I) and the increase in inert material (LS), which does not participate in the setting phase. In this case, the average diameter (D50) of LS (13 µm) is higher than that of PC (12 µm). If the LS has larger particles than the PC, the hydration rate decreases compared to the reference mixture due to the reduced surface area available for interaction with water and fewer sites for initiating the hydration process. Essentially, larger particles limit nucleation opportunities and the formation of hydrated products, leading to slower and potentially lower strength development in the material. Wang et al. [61] also confirm that PC substitution with larger LS particles reduces hydration product content, causes a dilution effect, and increases setting time. In contrast, in CEM VI, BFS is a pozzolanic material that acts as a slow-reacting binder. As a result, it does not influence the setting reaction, and replacing BFS with LS does not significantly impact the setting time of the mixture.

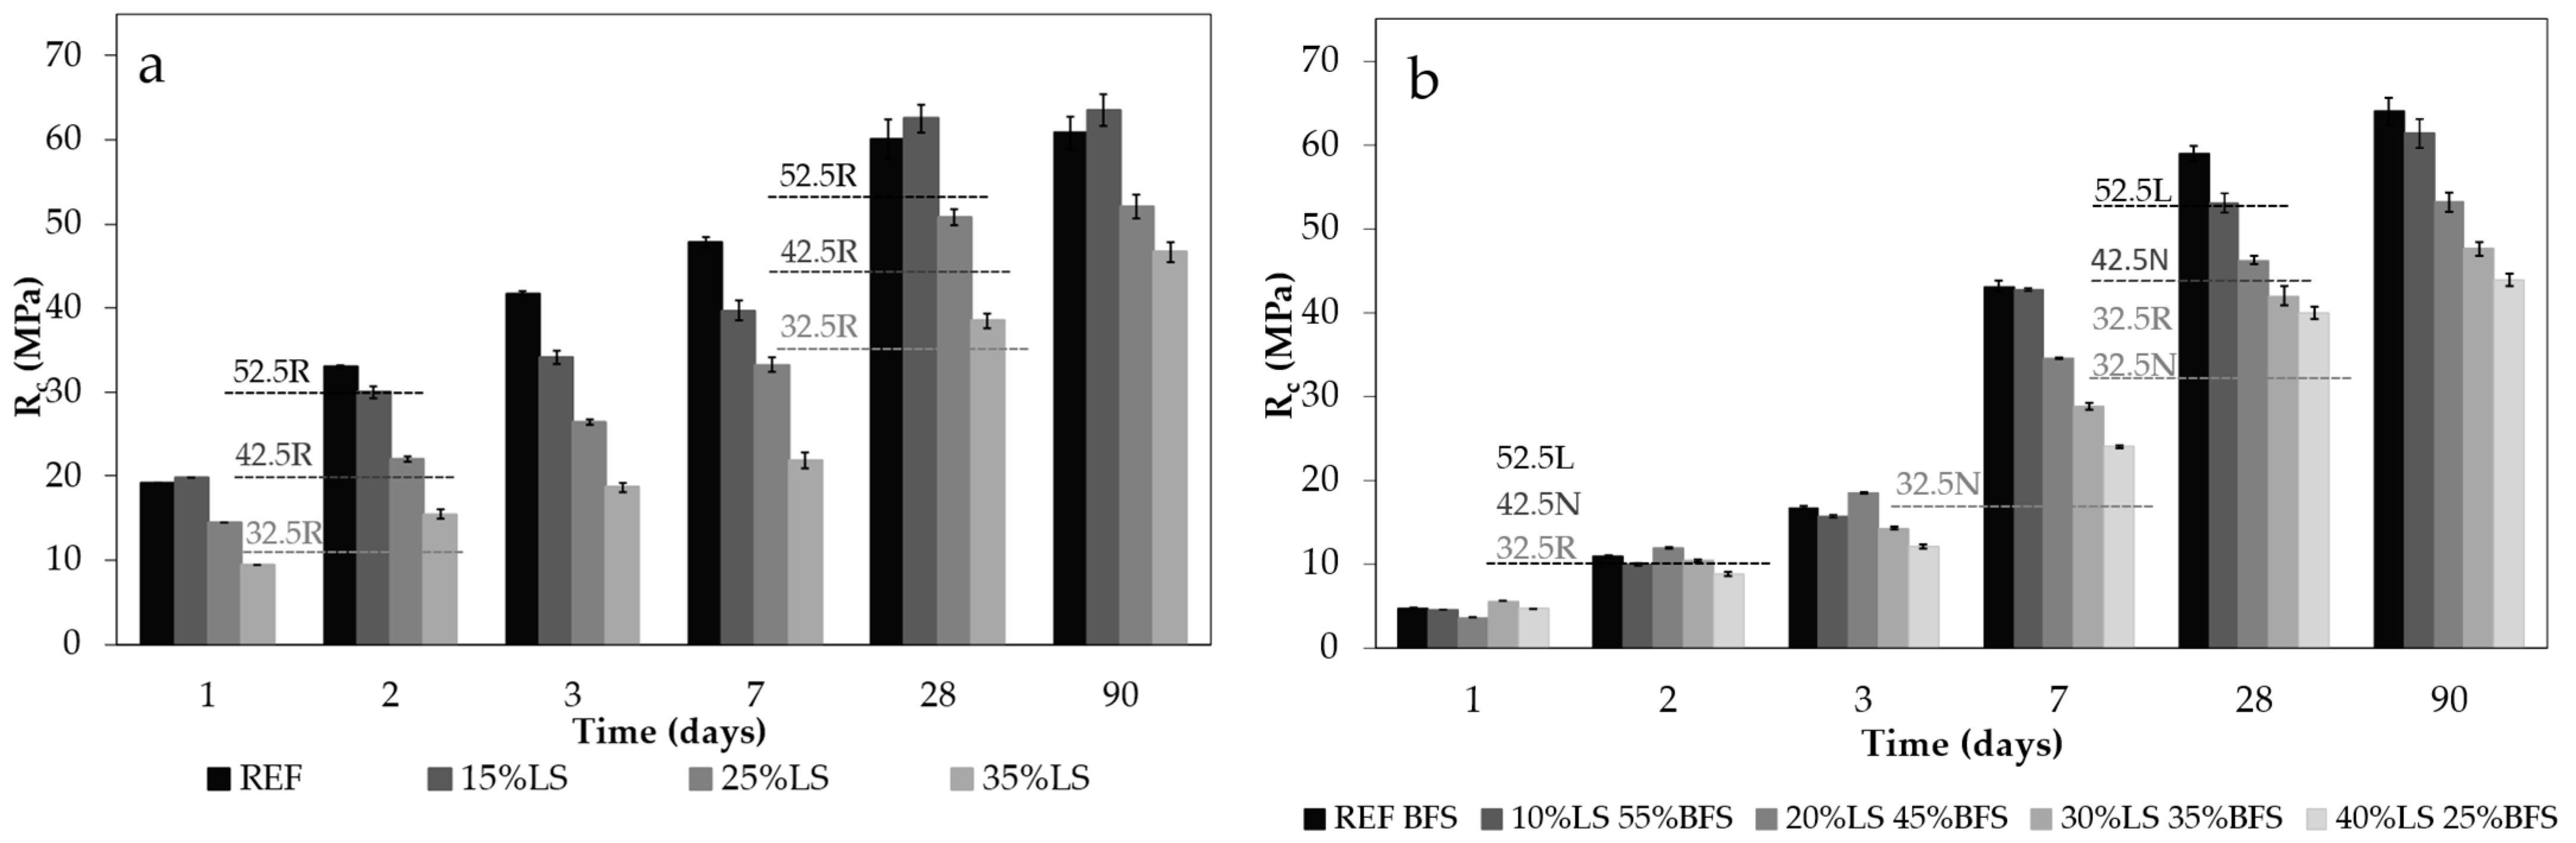
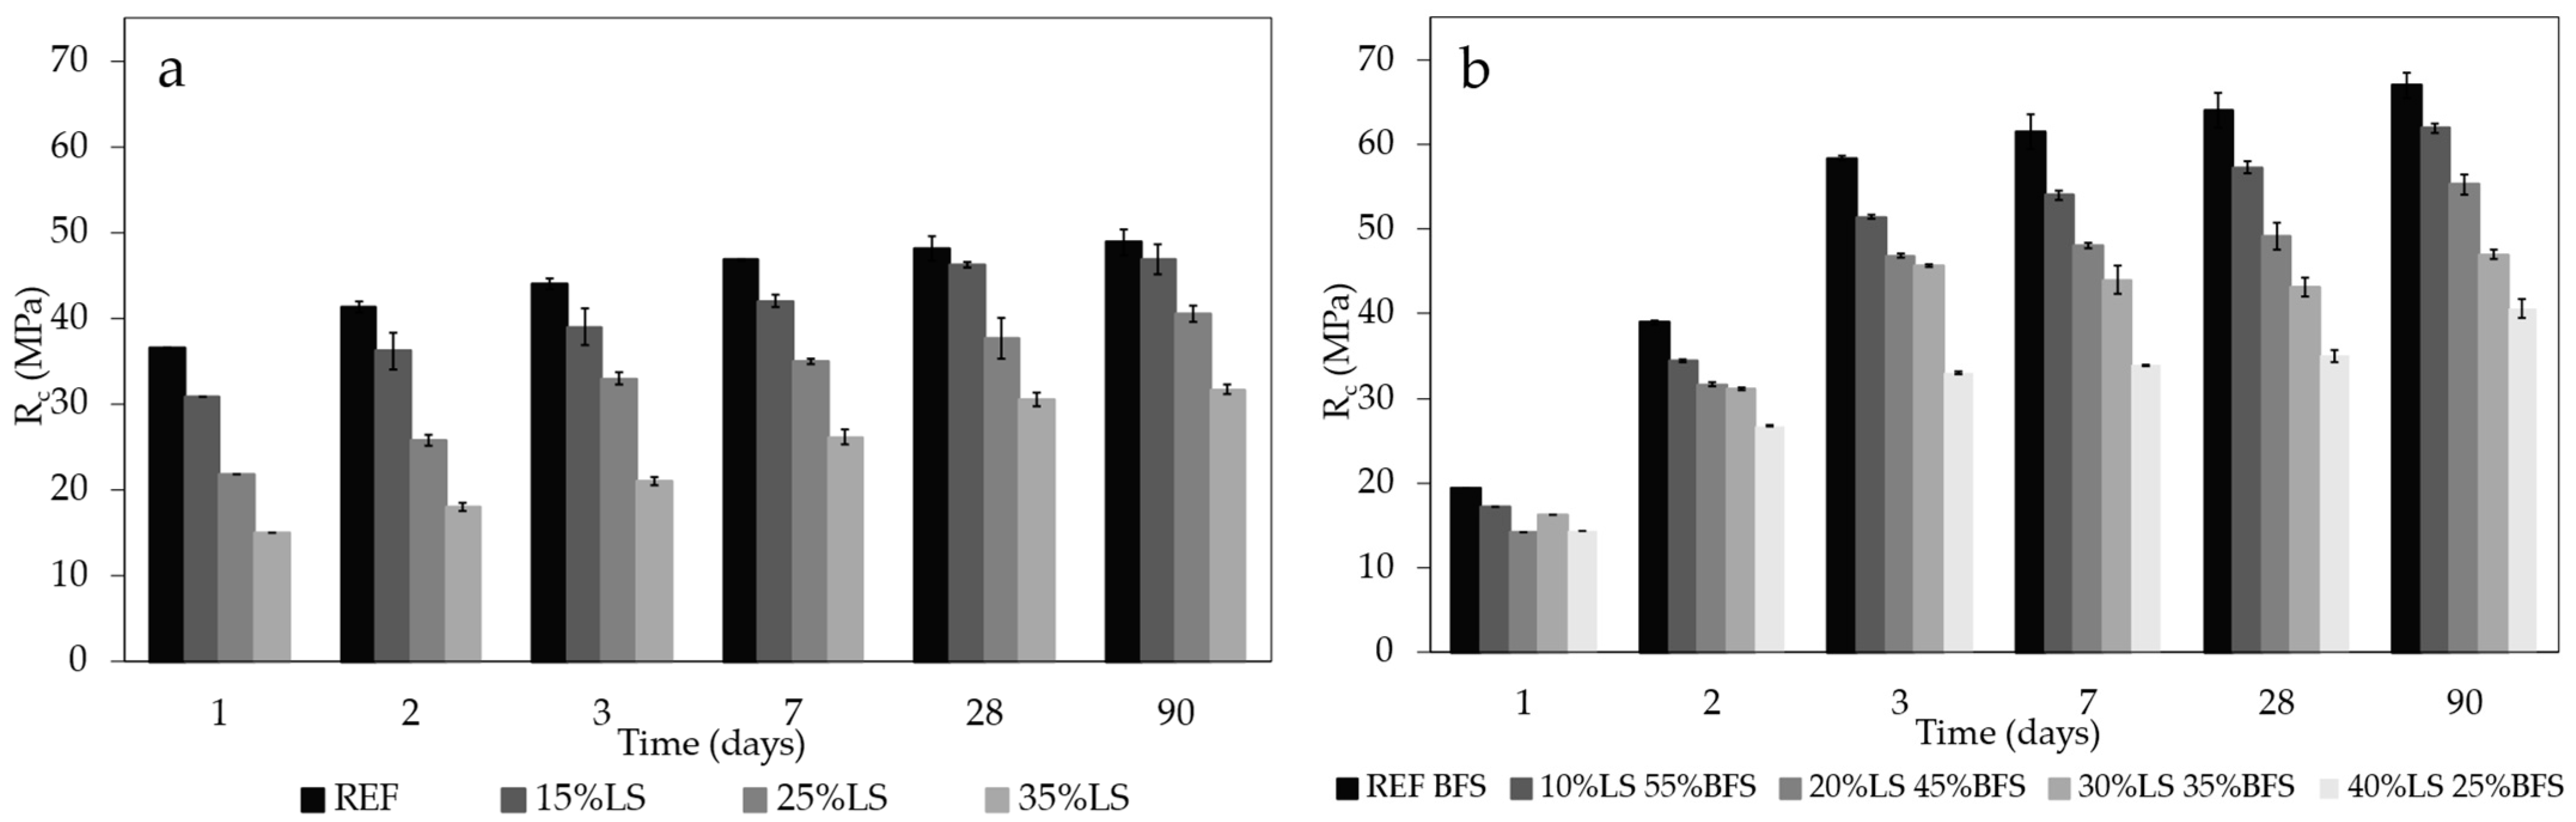
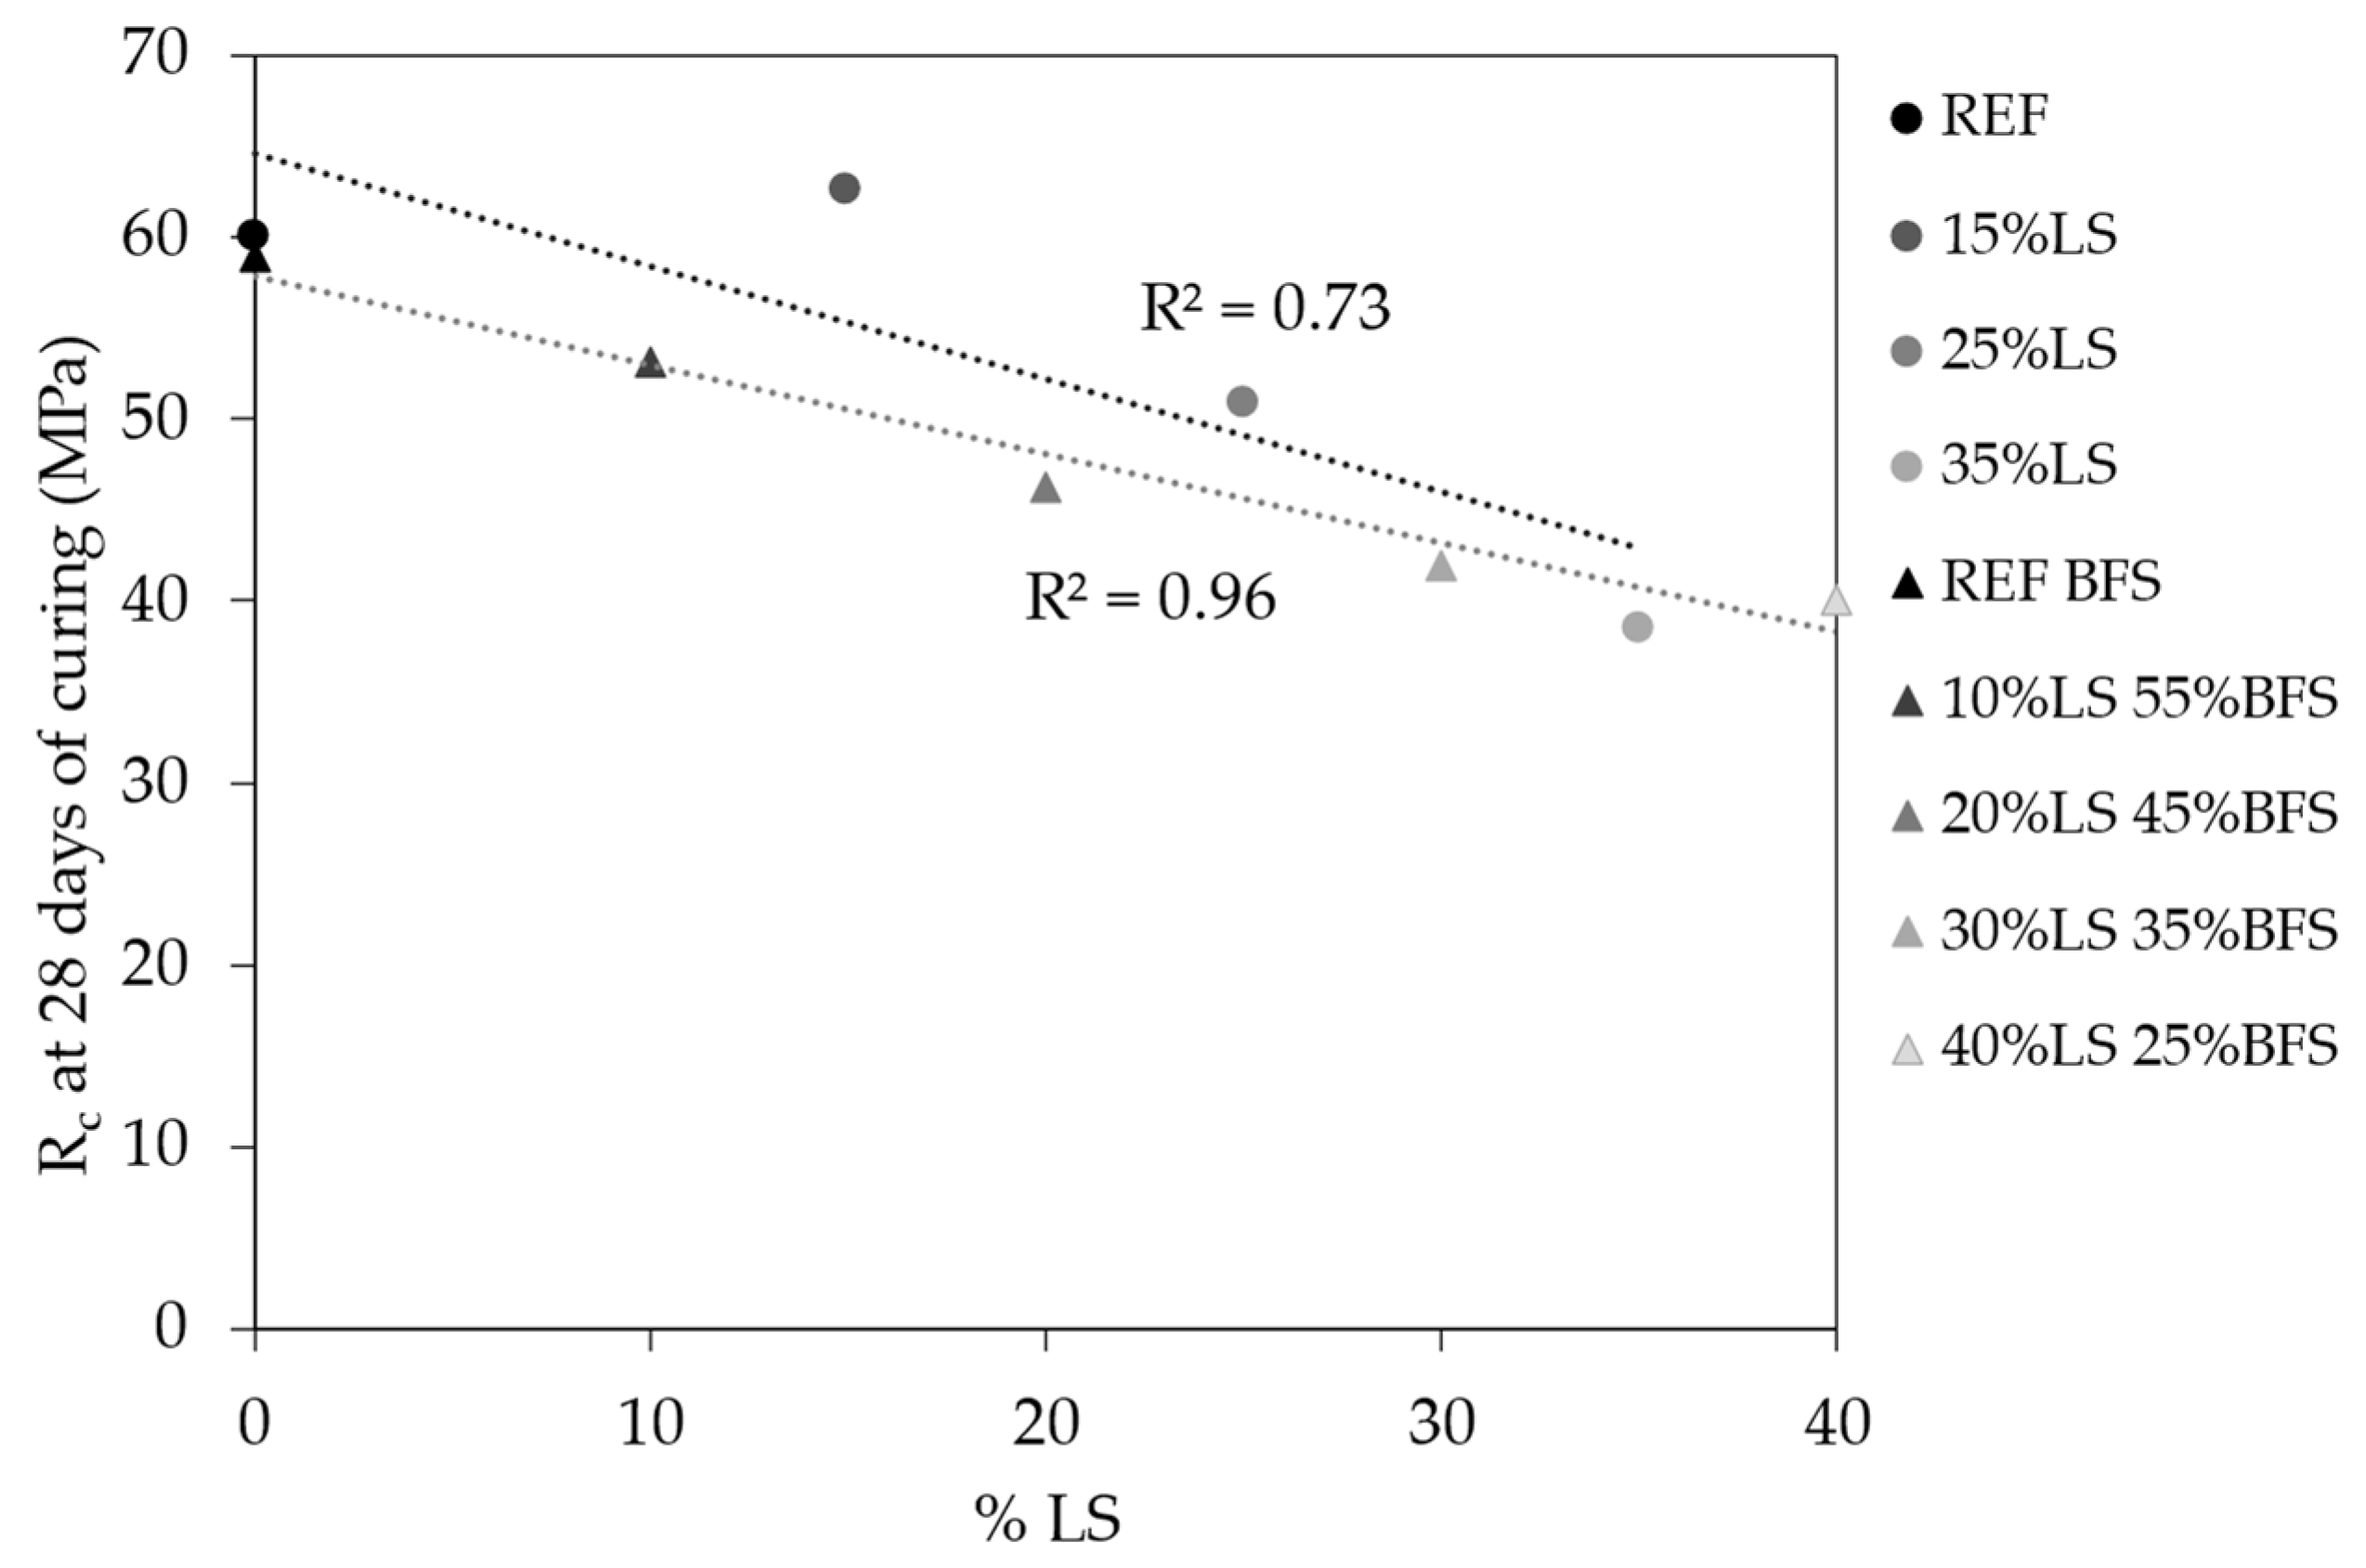
3.2. Strength Class and Mechanical Properties

The compressive strength at 20 °C for CEM II/B-LL and CEM VI mortars is shown in Figure 3a,b, respectively. The graph for CEM II/B-LL demonstrates that the development of mechanical strength over time follows a similar trend across all mixes but decreases as the amount of LS increases. Wang et al. [62] observed that increasing the LS content in place of cement caused a dilution effect, reducing the compressive strength of mortars. In Figure 3a, mortars with 25% and 35% LS exhibit a decrease in compressive strength of 15% and 36%, respectively, after 28 days of curing, and 14% and 23%, respectively, at 90 days of curing compared to the reference mix; this is probably due to the dilution effect caused by the reduced clinker content [41]. An exception is the 15% LS blend, which achieves a 4% higher compressive strength compared to the reference mix at both 28 and 90 days of curing since C3S hydration is enhanced by the LS nucleation effect [41]. For the CEM VI mortars, the minimum PC content, as required by the EN 197-1 standard, results in a general decrease in early-age compressive strength compared to the CEM II/B-LL blends. However, a 10% substitution of BFS with LS enables the mortar to reach almost similar compressive strength as the reference mix at 90 days of curing. The graph also reveals a compressive strength penalty of 20%, 33%, and 44% for BFS replacement levels of 20%, 30%, and 40%, respectively, at early 7 days of curing compared to the reference mortar. For BFS substitution levels exceeding the standard (>20%), a reduction in compressive strength of approximately 26–32% is observed at both 28 and 90 days of curing. For both types of blended cement mortars, LS addition reduces the compressive strength owing to the dilution effect. However, a slight increase is registered when PC is replaced by LS at 15%, thanks to the nucleation effect for C-S-H growth. The reduction in mechanical performance for CEM VI mortars is less pronounced than for CEM II/B-LL mortars due to the presence of slag, a weaker binder, which mitigates the impact of the inert LS material on compressive strength.
To classify the blended cements, the UNI EN 197-1 standard defines nine structural mechanical categories (three for R-high early strength, three for N-ordinary early strength, and three for L-low early strength, applicable only to CEM III cements), each with specific minimum compressive strength limits (in N/mm2). Figure 3a,b also show the strength class bands achieved by each mortar of the mixed cements. All the studied binders can be classified as cements since the corresponding standard mortars reach the minimum values of 39 MPa and 40 MPa at 28 days of curing for the 35% LS blend (CEM II/B-LL) and the 40% LS and 25% BFS blend (CEM VI), respectively. For CEM II/B-LL (Figure 3a), all mortars are classified under type R of the cement potential scale, with the REF and 15% LS mortars classified in the highest resistance class, 52.5R. The 25% LS blend is classified as 42.5R, and the 35% LS blend is classified as 32.5R. On the other hand, the CEM VI mortars (Figure 3b), due to the minimum PC content, exhibit overall lower mechanical resistance and, thus, belong to lower resistance classes compared to the CEM II/B-LL mixes. Specifically, the REF BFS and 10% LS 55% BFS mortars fall into the 52.5L strength class, the 20% LS and 45% BFS blend is classified as 42.5N, the 30% LS and 35% BFS blend as 32.5R, and the 40% LS and 25% BFS blend as 32.5N, despite the maximum BFS substitution with LS exceeding the limit established by the standard by 20%.
To study the effect of temperature on the development of mechanical strength, two additional curing temperatures were analysed: 40 °C (hot climates) and 10 °C (cold climates). The compressive strength at 40 °C and 10 °C for both CEM II/B-LL and CEM VI is shown in Figure 4a,b and Figure 5a,b, respectively. The development of the mechanical strength of the mortars is strongly dependent on temperature [63]. In warm climates, there is a tendency for rapid development of Rc, but with high formation of low-quality C-S-H fibres (quantitative effect). In contrast, in cold climates, the qualitative effect prevails due to the slower formation of C-S-H fibres, resulting in a slower increase in mechanical resistance during the early stages of curing.
For the CEM II/B-LL blends, at 40 °C (Figure 4a), there is an expected significant acceleration in mechanical performance, particularly at early curing times. However, at 10 °C (Figure 5a), there is a general delay in the development of compressive strength. Comparing the performance of CEM II/B-LL mixes at 40 °C and 10 °C, the reference mix maintains the best performance. The other mortars show a decrease in compressive strength as the substitution of PC with LS increases. For CEM VI (Figure 4b), mortars cured at 40 °C show accelerated mechanical performance, similar to CEM II/B-LL, particularly at 3 and 7 days of curing. However, CEM VI mortars cured at 40 °C experience a greater penalisation of mechanical strength as the BFS substitution with LS increases, compared to those cured at 20 °C (Figure 3b). This is because curing at higher temperatures activates and enhances the resistance of the pozzolanic binder, making it more susceptible to substitution with the inert material (LS) [64]. On the other hand, mortars cured at 10 °C (Figure 5b) achieve similar mechanical performance to the REF BFS mix at 90 days of curing. The 30% LS and 35% BFS blend and the 40% LS and 25% BFS blend are two exceptions, showing reductions of 8% and 24% in mechanical strength, respectively, compared to the reference mix. The CEM VI mortar with 10% LS cured at 10 °C reaches the same compressive strength as the respective reference mix after just 1 day of curing. The other mortars (with 20% and 30% LS) show a slight decrease in mechanical performance after 7 days of curing. The BFS in low-temperature curing slows down the development of mechanical strength in compression, reducing the impact of LS on BFS [64]. The obtained results show that the substitution of PC with LS is detrimental to strength development when curing is carried out at T = 40 °C. Conversely, the low curing temperature reduces the strength of all CEM II/B-LL mortars but is not so impactful on CEM VI mortars with low BFS replacement by LS. Therefore, for casting in warm climates, the most effective mix remains the reference mortar. In cold climates, all binders with LS content below 30% can be recommended, as they do not show significant deviations in mechanical strength from the reference.
Figure 6 shows the influence of the quantity of LS on compressive strength at 28 days of curing for the two types of blended cements. The trendline for CEM II/B-LL is more pronounced than that for CEM VI, with R2 values of 0.73 and 0.96, respectively. The mechanical strength of CEM VI mortars is less affected by the increase in the percentage of LS because the substitution is made with BFS, a weak pozzolanic binder, rather than cement. As a result, the CEM VI mixtures are more sustainable than CEM II/B-LL, as they maintain their mechanical performance even with a high replacement of LS.
Table 5 reports the dynamic modulus of elasticity (Ed) at 20 °C, 40 °C, and 10 °C after 28 days of curing for the CEM II/B-LL and CEM VI standard mortars. The Ed was calculated to assess the stiffness of the mortars, the uniformity of the mixtures, and the presence of defects (such as cracks or voids) [65]. In both types of blended cement, the Ed values at all curing conditions (20 °C, 40 °C, and 10 °C) follow the same trend of mechanical strength, decreasing with an increase in LS content, as expected [66]. For both types of mixed cements, the reference mix is stiffer than the others at all curing conditions, owing to its higher content of PC/BFS and the absence of LS in CEM II/B-LL and CEM VI, respectively. In particular, the Ed is lower overall for curing at 40 °C compared to that of the samples cured at 20 °C for both types of mixed cements; in contrast, the Ed of the specimens cured at 10 °C for CEM II/B-LL and CEM VI is higher and lower to that of the samples cured at 20 °C, respectively. These results are strictly related to the density of the materials and the ultrasonic pulse velocity, as reported in Equations (1) and (2). Indeed, after curing at 40 °C, specimens show a lower density and a lower ultrasonic pulse velocity value compared to those of the specimens cured at 20 °C, inducing a decrease in Ed values for all blended cement mortars. For the CEM II/B-LL specimens cured at 10 °C, both density and ultrasonic pulse velocity are higher than those cured at 20 °C, causing an increase in Ed values. Conversely, for the CEM VI specimens cured at 10 °C, density is similar, whereas the ultrasonic pulse velocity is lower than those cured at 20 °C, resulting in a decrease of Ed values.

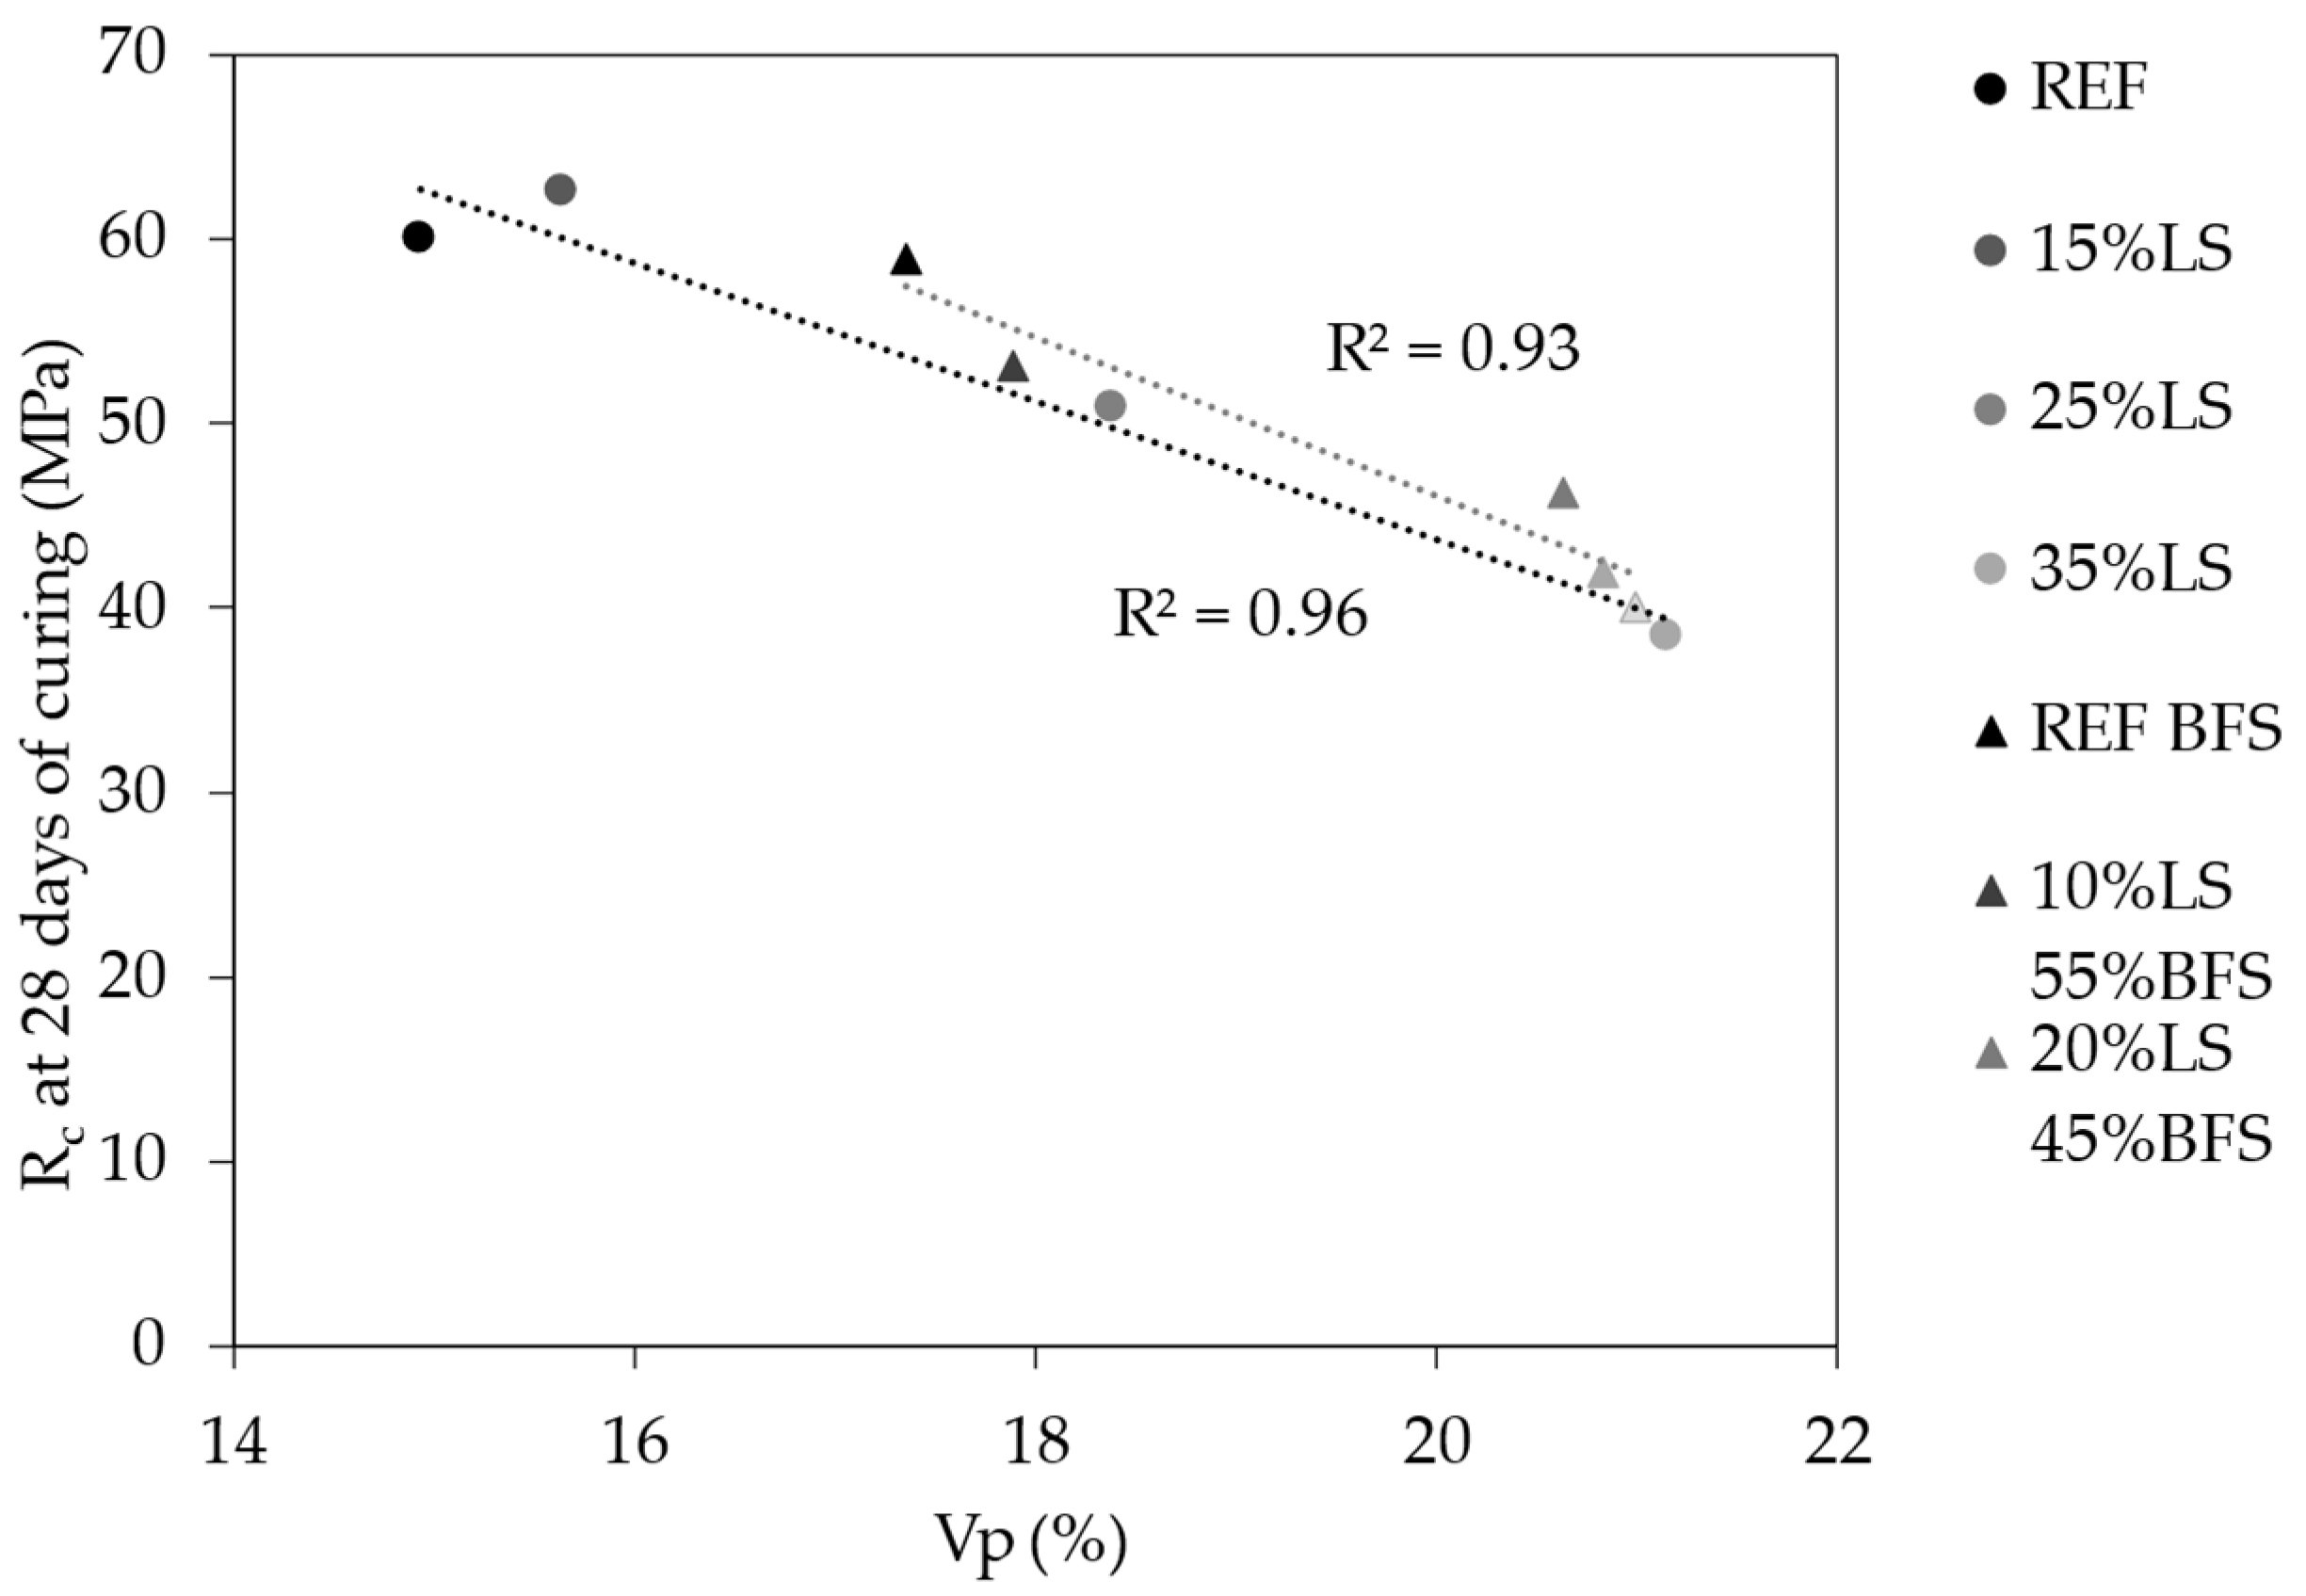
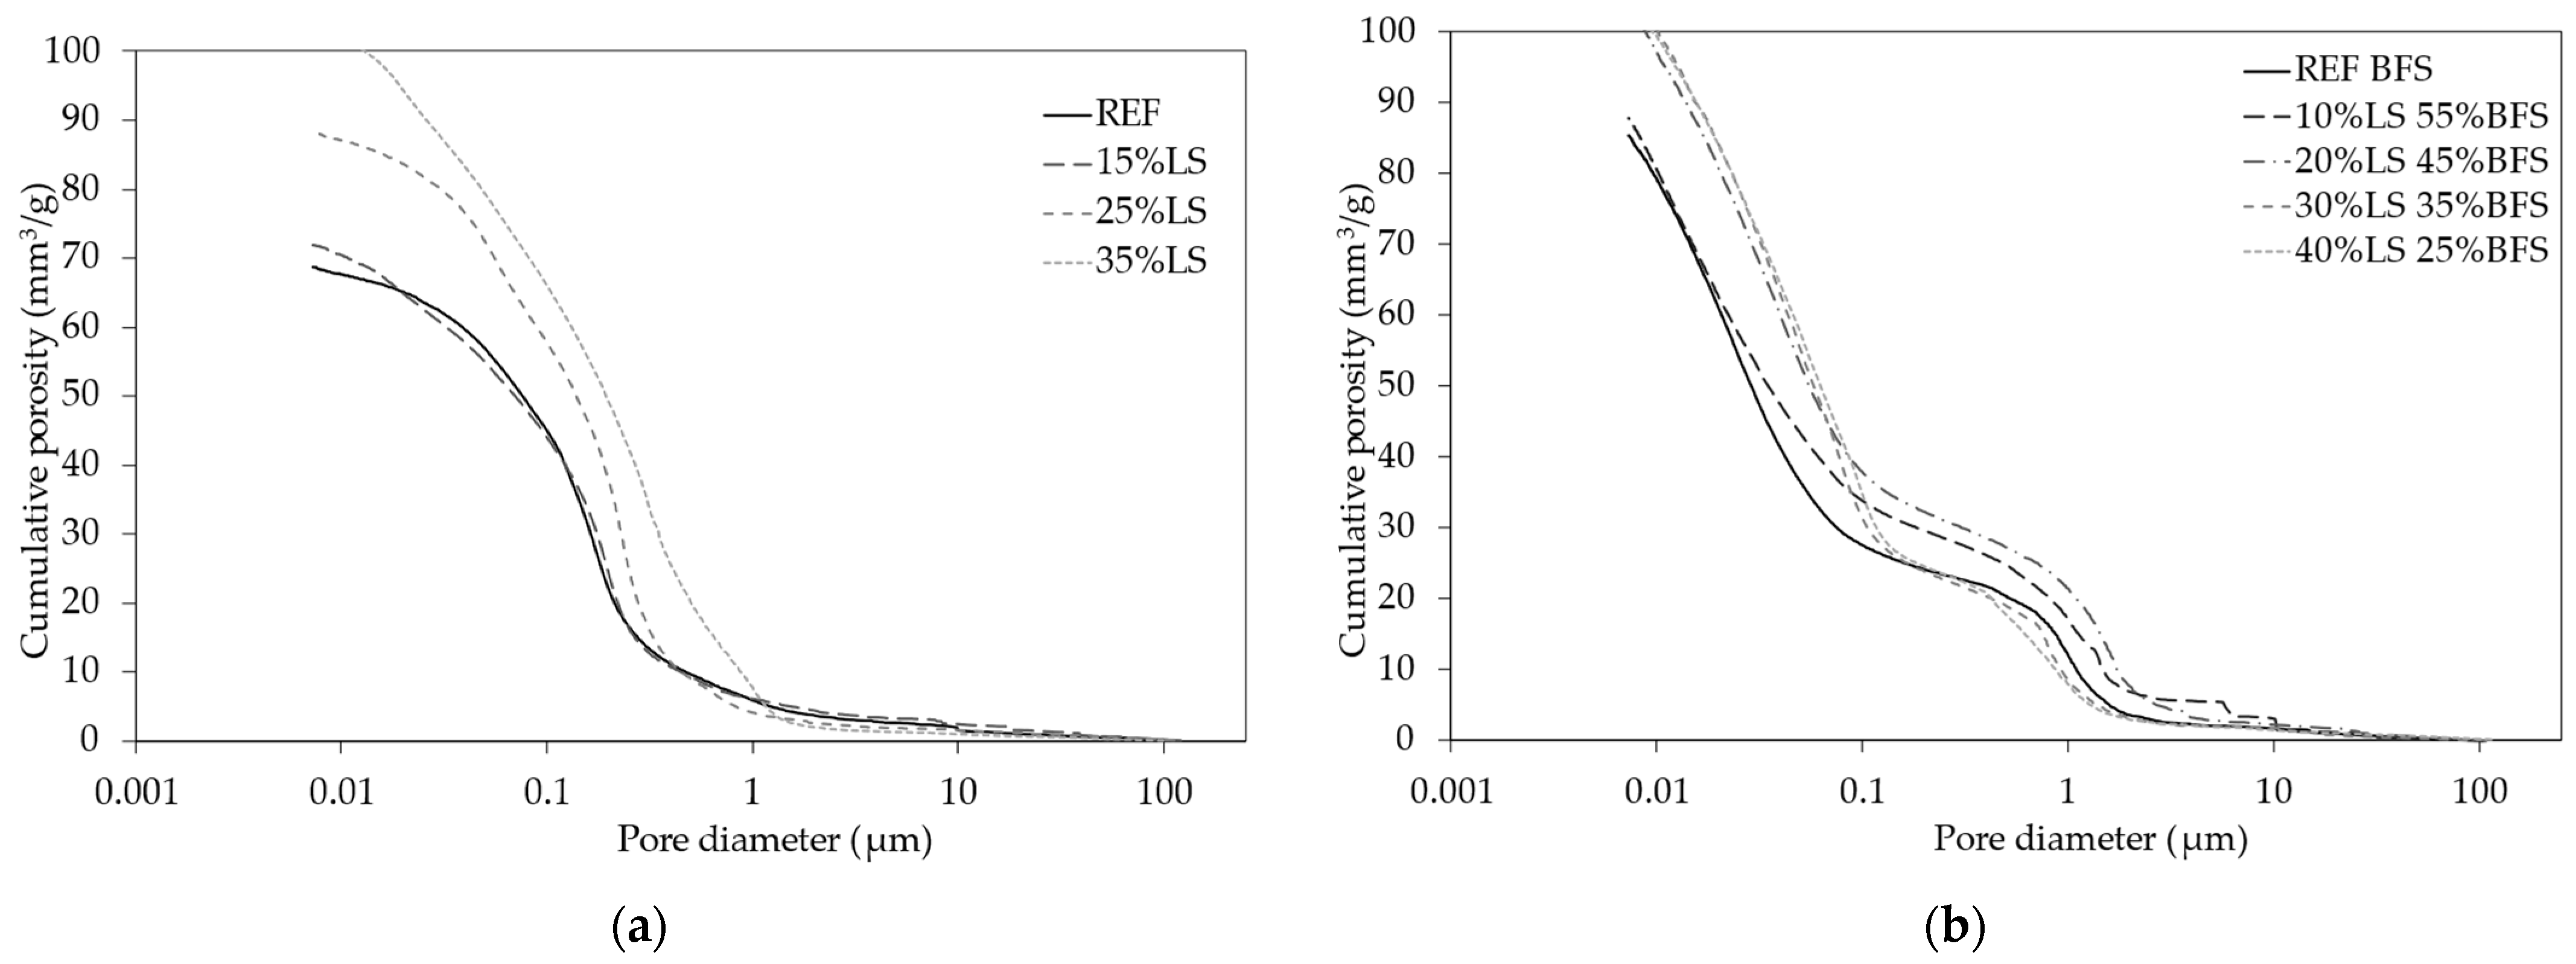
3.3. Microstructural Properties

The results of total porosity (Vp) for the mixed cements are presented in Table 6. The data indicate an increase in total porosity as the LS content rises. For CEM II/B-LL, the lower porosity is attributed to the higher PC content, which drives a greater degree of hydration in the binder paste [67]. In CEM VI, increasing the replacement of BFS with LS leads to a less pronounced increase in total porosity, as the reduction in BFS content has minimal impact on the hydration degree [60]. This is further explained by the fact that CEM VI mortars contain only 35% of PC, which primarily governs the hydration process. Additionally, beyond a 20% substitution of BFS with LS, the increase in total porosity stabilises. For the same mechanical resistance class, the blended cements exhibit similar total porosity. For instance, the 35% LS mortar of CEM II/B-LL and the 30% LS and 35% BFS mortar of CEM VI both achieve the 32.5R resistance class and display comparable Vp values. This similarity arises from the higher limestone content in the CEM II/B-LL mix (35% LS), coupled with the greater reduction in compressive strength and Ed compared to the respective reference blend.
Figure 7 categorises the mortars into three groups based on their compressive strength (Rc) at 28 days of curing and total porosity (Vp):
  • High Rc and low Vp: mortars with superior compressive strength and minimal porosity;
  • Medium Rc and Vp: mortars with moderate compressive strength and porosity;
  • Low Rc and high Vp: mortars with lower compressive strength and higher porosity.
The 35% LS mortar from CEM II/B-LL and the 30% LS and 35% BFS mortar from CEM VI belong to the third group, exhibiting lower compressive strength at 28 days of curing and higher porosity. This confirms similar behaviour between these blends, as they share the same resistance class and similar modulus of elasticity, reflecting the linear correlation between Rc and Vp. Both types of blended cements demonstrate a strong linear correlation (R2 > 0.90), as high total porosity significantly reduces mechanical compressive strength [63].
Pore sizes in mortars are classified based on the International Union of Pure and Applied Chemistry (IUPAC) standards [68]:
  • Macropores: width greater than 50 nm;
  • Mesopores: width between 2 nm and 50 nm;
  • Micropores: width of 2 nm or smaller;
  • Supermicropores: 0.7 nm to 2 nm;
  • Ultra-micropores: approximately 0.7 nm in width.
Mortar pores can also be categorised as open or closed. According to Quadri Simões da Silva et al. [69], open porosity constitutes 20–30% of the total porosity in cement paste. Figure 8a,b depict the pore size distribution of CEM II/B-LL and CEM VI mortars based on MIP analysis: for CEM II/B-LL, increasing LS content leads to higher total porosity and larger pore diameters since PC content decreases [70]. Mortars with LS ≤ 15% exhibit a unimodal pore distribution, and those with higher LS substitutions show a polymodal distribution. For CEM VI, all mortars display polymodal pore distributions. For LS substitutions higher than 20%, the pore distribution trend shifts notably [27] as the first curve inflection point moves to higher values. These findings highlight the impact of LS content on porosity and its influence on the mechanical performance of mortars. Indeed, for both types of mortars, increasing LS content causes an increase in total porosity and pore diameters.

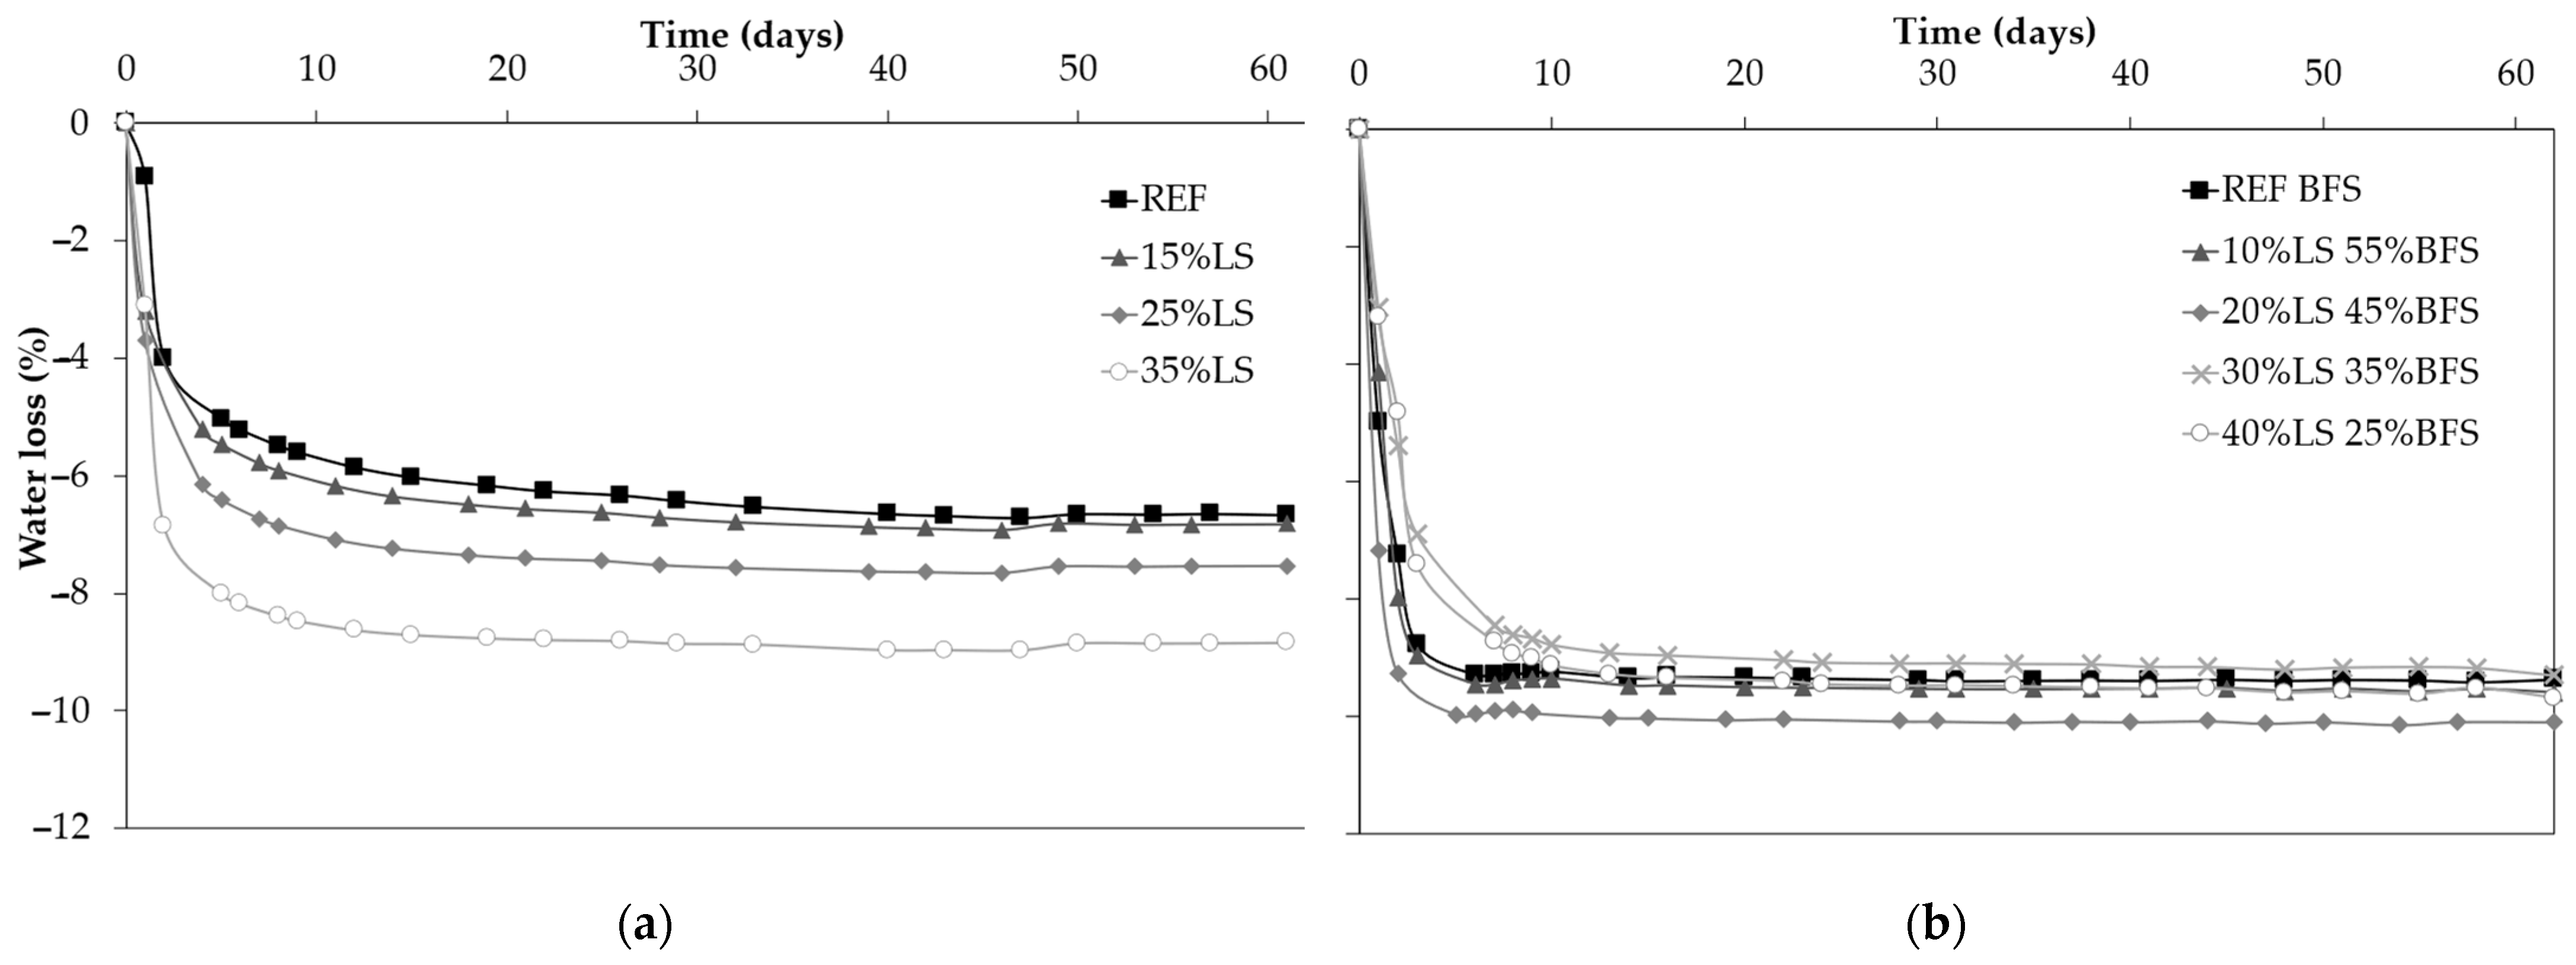
3.4. Capillary Water Absorption

Figure 9a,b illustrate the water absorbed per unit area (Qi) for CEM II/B-LL and CEM VI mortars, respectively. It can be observed that as the amount of LS in the mixtures increases, there is a rise in the amount of water absorbed per unit of the surface area. This is because LS has a very high absorption capacity.
From the CEM II/B-LL graph (Figure 9a), it is evident that the REF and 15% LS samples exhibit the same behaviour. This means that replacing up to 15% of cement with limestone, which still makes the mixture more sustainable, yields an excellent result in terms of water absorption. Additionally, in the CEM VI samples (Figure 9b), the small substitution of BFS with LS (10%) leads to similar capillary water absorption behaviour in the samples. Additionally, Table 6 presents the capillary water absorption coefficient (AC), which quantifies the mortar’s ability to absorb water during the initial linear phase of the Qi curve. The AC coefficient mirrors the trends observed in the Qi curves for both types of blended cements (Figure 9a,b). A higher Qi is directly associated with an increased AC value. For CEM II/B-LL mortars, the substitution of PC with LS increases the water absorption [71]. This result is strongly influenced by pore size distribution and total porosity. The mortar manufactured with 35% LS exhibits the highest water absorption due to its higher total porosity. Conversely, 15% LS mortar demonstrates comparable capillary water absorption to the reference (REF) mortar, attributable to a similar total pore volume and pore size distribution. In CEM VI mortars, capillary water absorption also increases with higher LS content. When BFS substitution with LS is ≤20%, water absorption is regulated by the increase in total porosity (Vp). Conversely, when LS exceeds 30%, water absorption increases more due to the combined effects of increased Vp and a greater proportion of capillary pores, which have higher absorption capacities than larger pores [72].

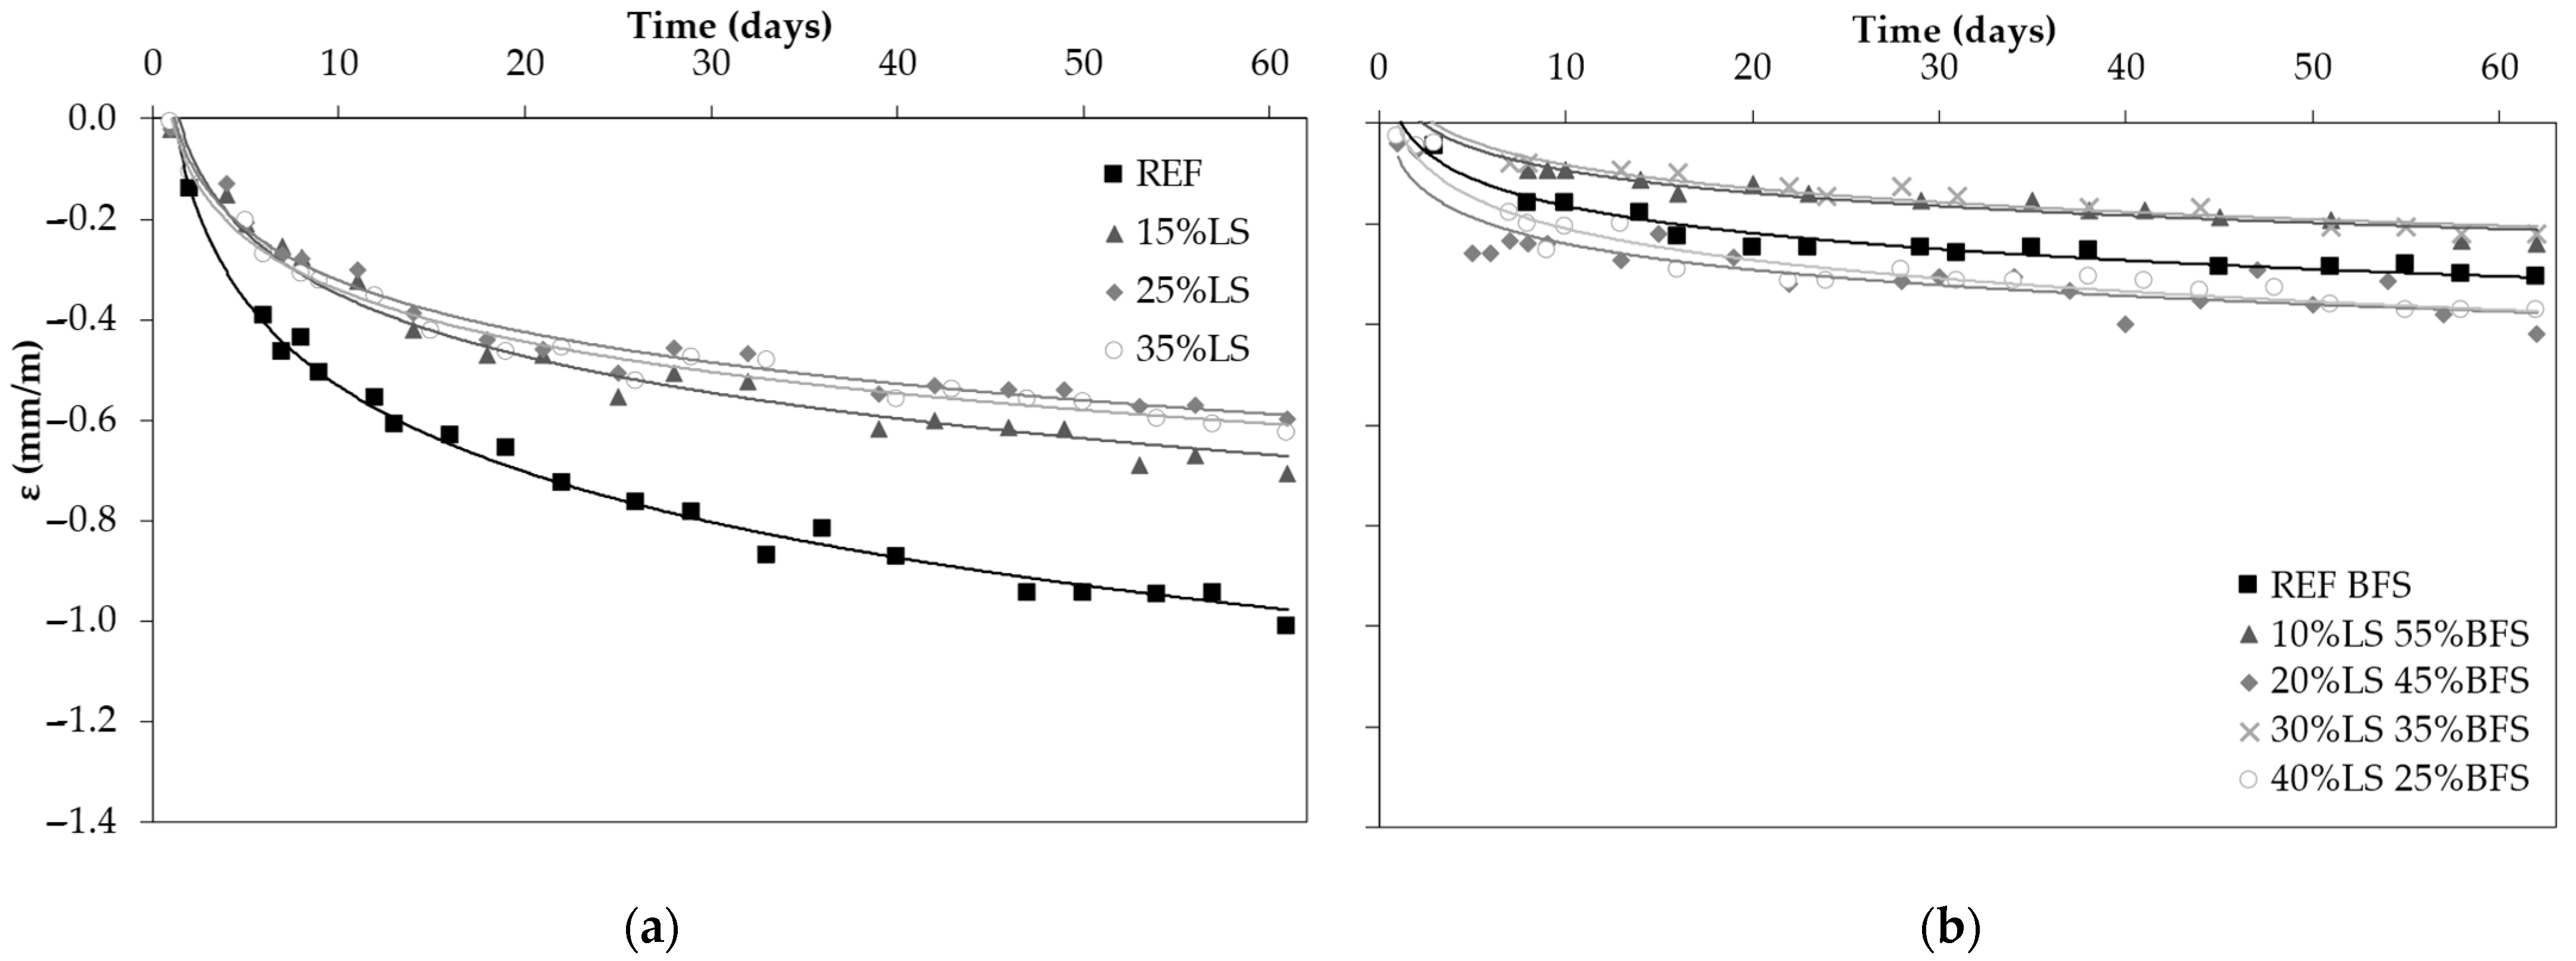
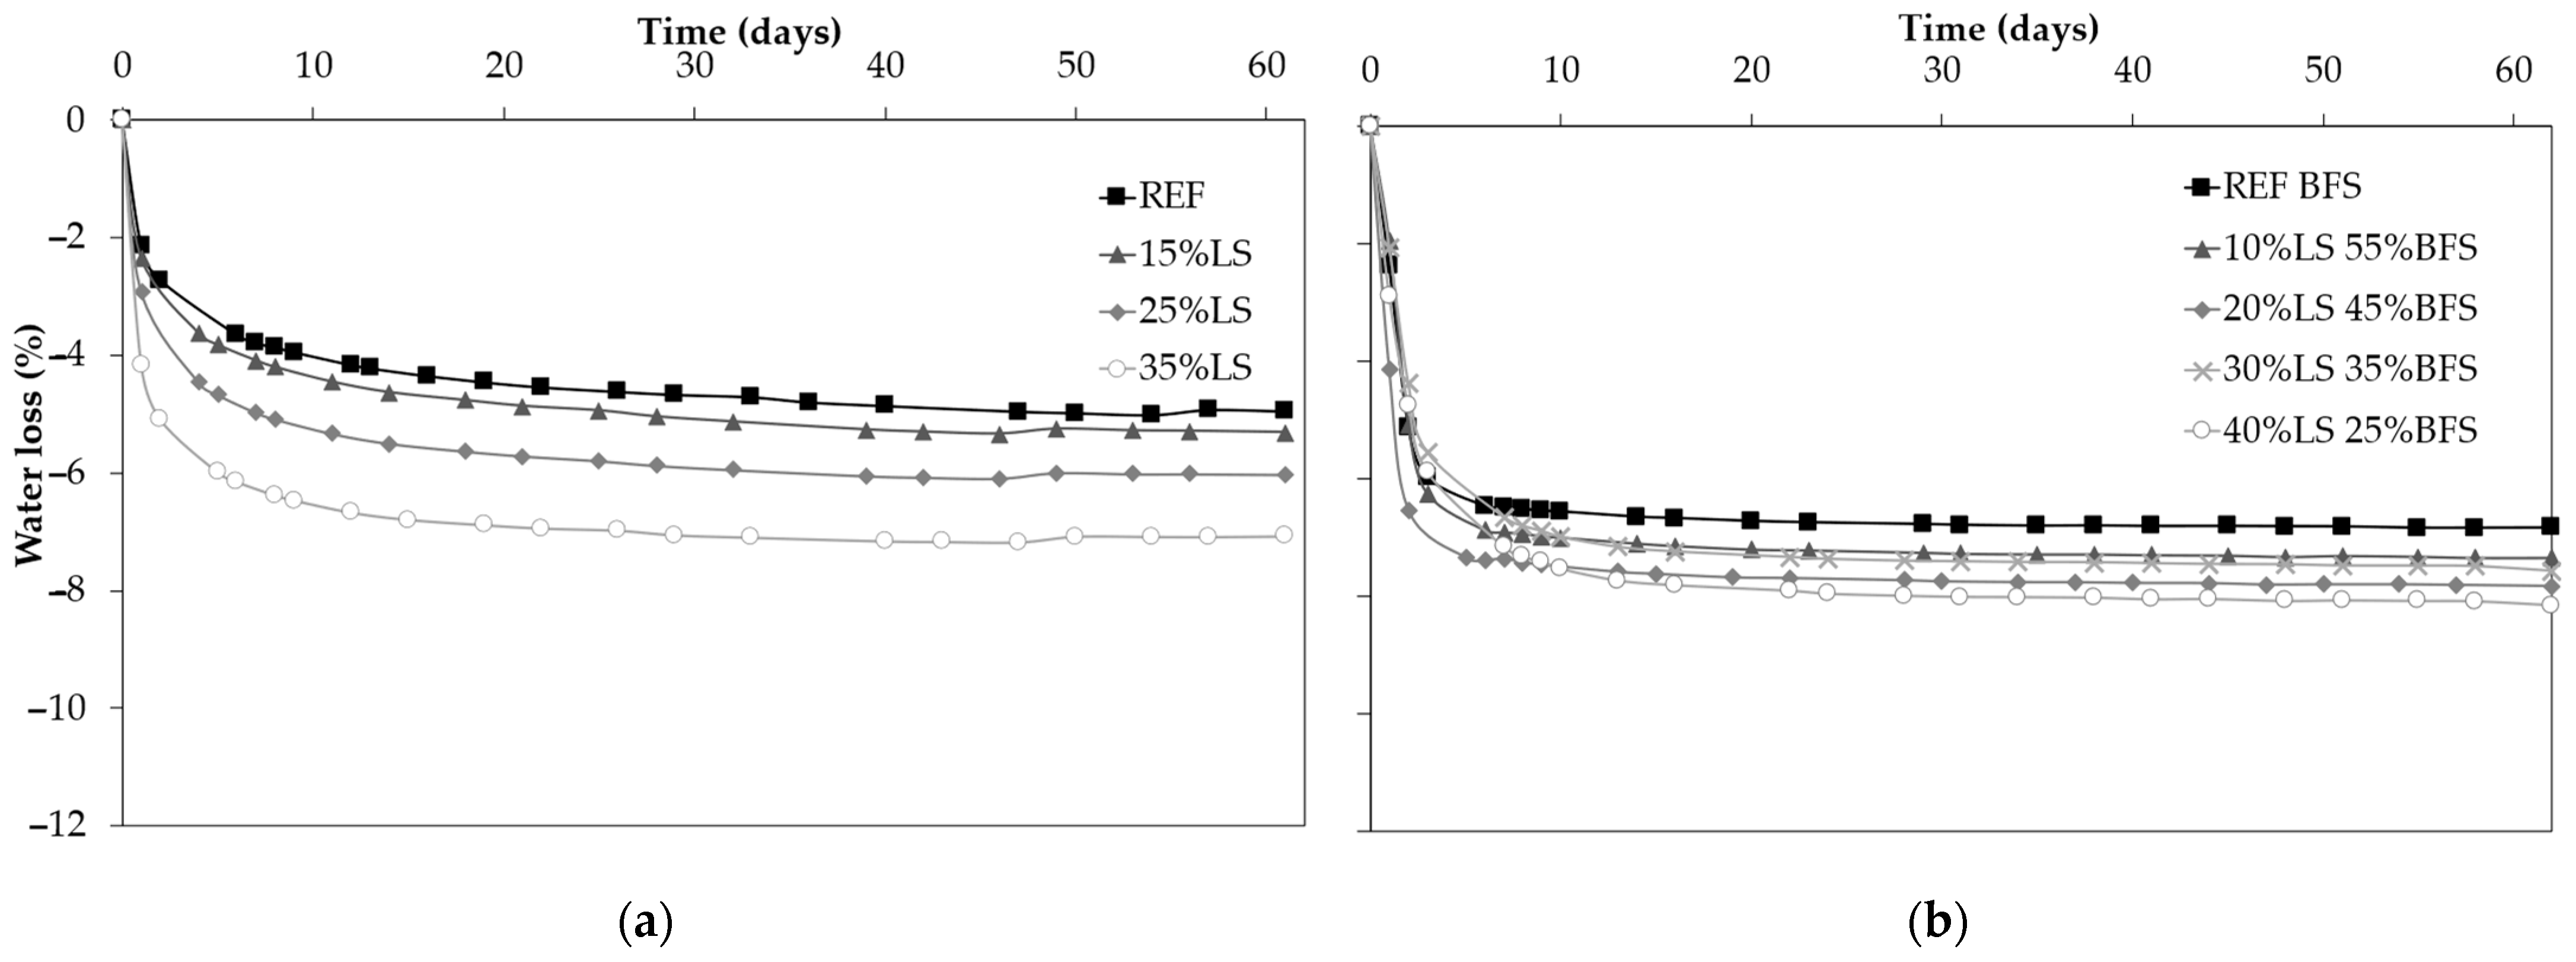
3.5. Drying Shrinkage
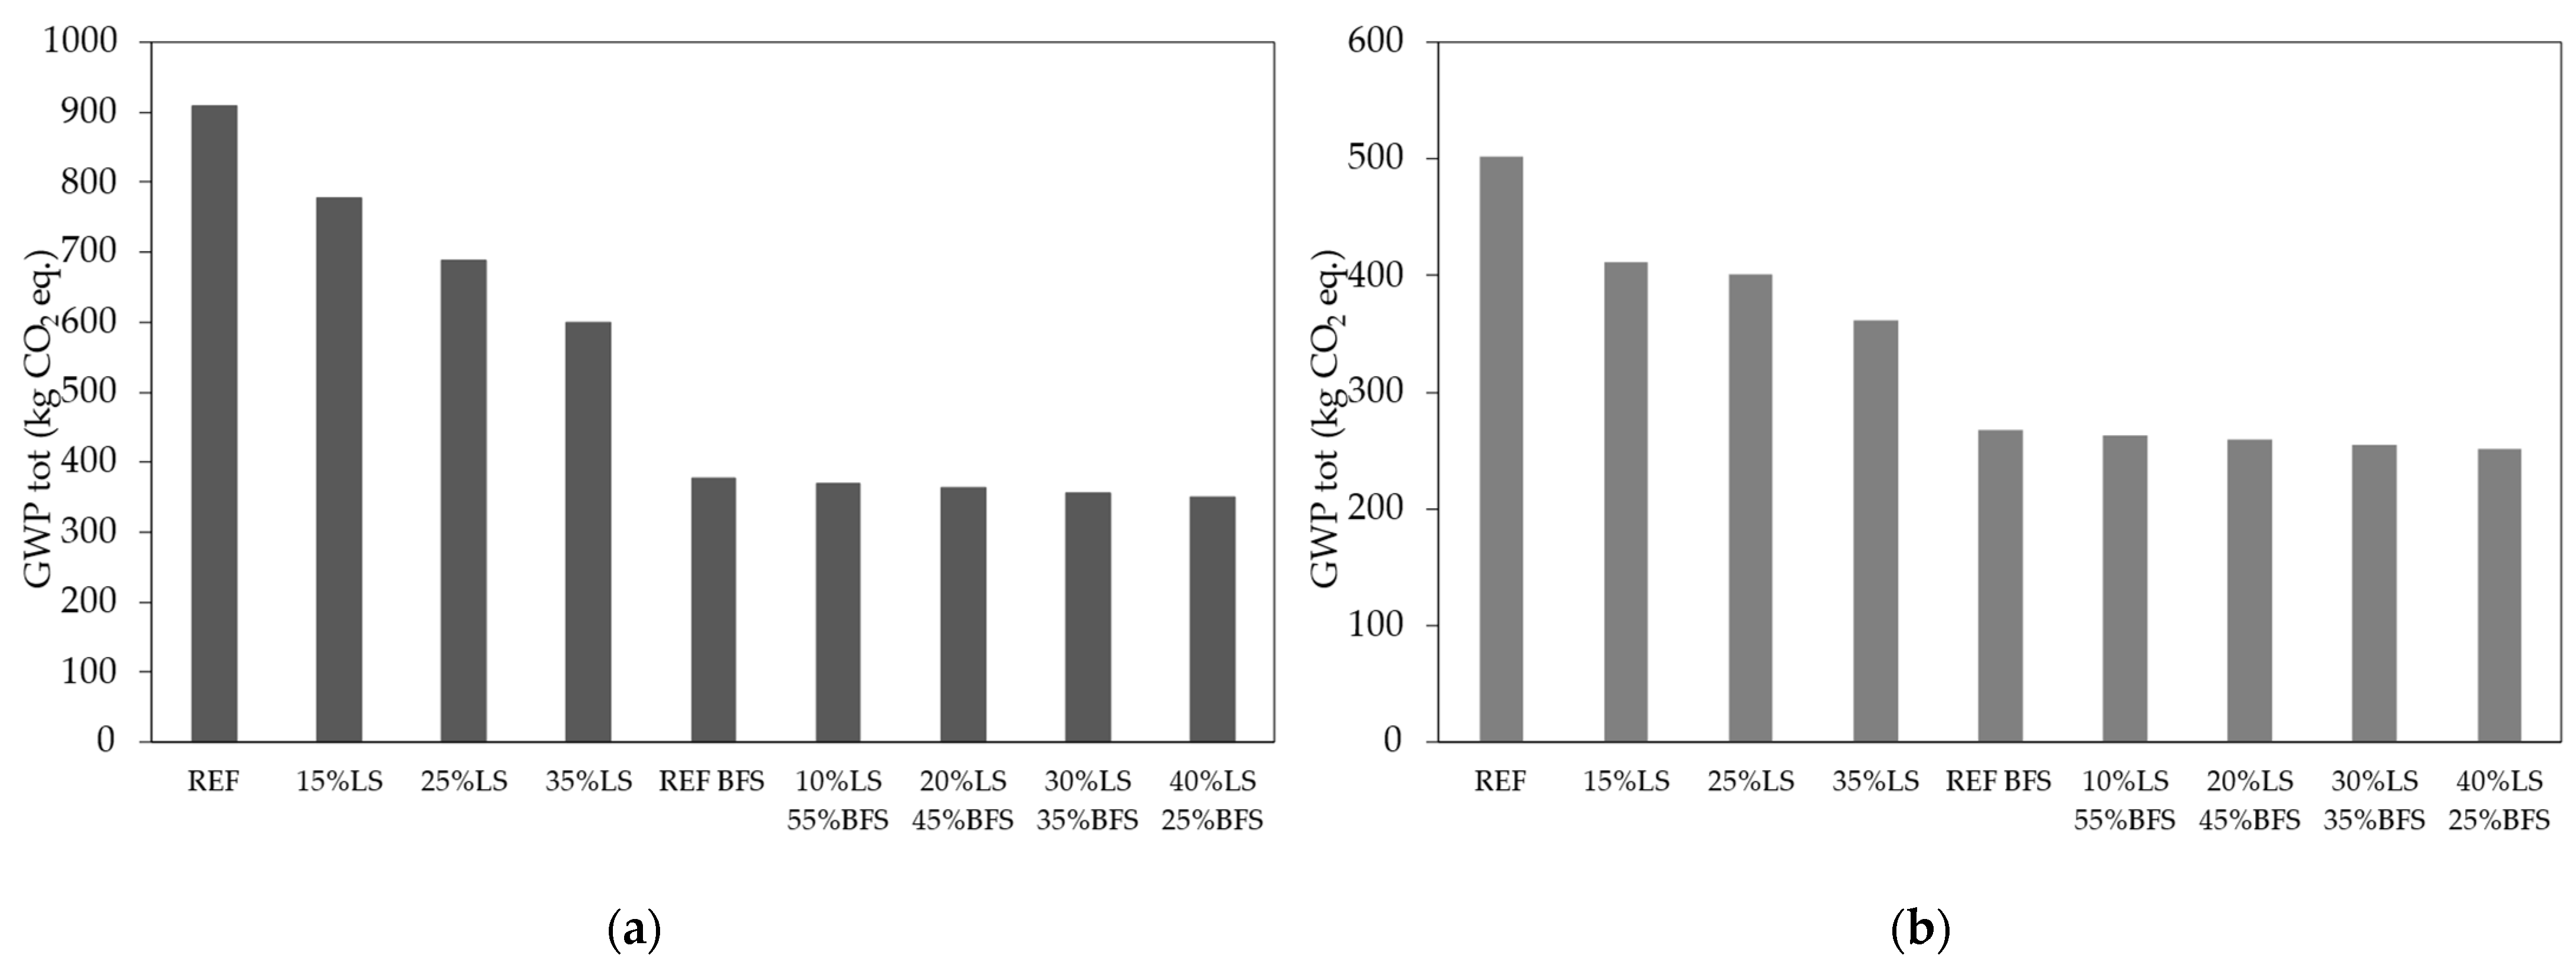
Drying shrinkage is a critical factor in the durability of mortars, as it significantly increases the likelihood of cracking in the hardened binder matrix [73]. This parameter is influenced by the porosity of the mortars—particularly the distribution of pores tending toward capillary pore networks and open porosity—which increases capillary tension inside the mortar and allows water to evaporate [70]. Additionally, drying shrinkage is affected by the modulus of elasticity [71], as a decrease in mix stiffness increases mortar deformability at a certain stress. Figure 10 and Figure 11 illustrate the free and restrained drying shrinkage of the CEM II/B-LL (Figure 10a and Figure 11a) and CEM VI blends (Figure 10b and Figure 11b), respectively. Furthermore, Figure 12 and Figure 13 show the water loss associated with free and restrained shrinkage in CEM II/B-LL (Figure 12a and Figure 13a) and CEM VI mortars (Figure 12b and Figure 13b). For CEM II/B-LL, free shrinkage decreases as the replacement of PC with LS increases. Mortars containing LS exhibit lower free shrinkage compared to the reference mortar. This is due to the reduced amount of binder paste, which is primarily responsible for shrinkage [74], and the higher content of LS, an inert material that counteracts shrinkage [71]. The results highlight the predominance of the binder paste content over the dynamic modulus of elasticity (Ed), water loss (Figure 12a), and total porosity (Vp). A lower amount of binder paste reduces free shrinkage, whereas a lower Ed, higher water loss, and increased Vp tend to amplify shrinkage [71]. As shown in Figure 12a, although water loss increases with higher LS content, the greater mechanical properties of mortars with higher PC content have a stronger impact on shrinkage, leading to a more pronounced shortening of the steel bar.
The same trend Is observed In Figure 11a for the restrained shrinkage of CEM II/B-LL, with a greater gap between the REF blend and the other blends. This difference is due to the combined effect of free shrinkage and Ed, which increases the mortar’s ability to shorten the embedded steel bar. Indeed, the greater mechanical properties of mortars manufactured with higher PC content contribute to a higher shrinkage of the embedded rebar. The water loss during restrained shrinkage (Figure 13a) follows the same trend as the water loss during free shrinkage presented in Figure 12a. For CEM VI, mortars with ≤20% substitution of BFS with LS exhibit higher free shrinkage than the REF mortar (Figure 10b). This behaviour is caused by a decrease in Ed (greater deformability) and an increase in total porosity, as seen in Figure 11b. At higher replacement levels, the mortars with 30% and 40% LS show lower free shrinkage, with trends diverging upward from those of the blends containing 20% LS. Therefore, when the percentage of limestone exceeds 20%, the shrinkage phenomenon is likely dominated by the reduction in binder paste [60], in this case, BFS. The REF BFS mortar of CEM VI shows lower free shrinkage than the REF mortar of CEM II/B-LL, mainly due to its lower PC content, as the cement percentage is fixed at 35% for all CEM VI blends. Additionally, the water loss of CEM VI mortars (Figure 13b) influences free shrinkage and follows a similar trend. The highest water loss value (10%) is recorded for the 20% LS mixture of CEM VI. However, the blends with 30% and 40% LS lose less water compared to the reference blends. This can be attributed to the filler effect of limestone, which reduces pore volume by filling voids. Indeed, the presence of LS promotes the formation of more hydrated products, leaving less free water available to evaporate. In Figure 11b the restrained shrinkage of CEM VI mortars is displayed. Overall, CEM VI blends (Figure 11b) exhibit lower restrained shrinkage values compared to CEM II/B-LL mortars (Figure 11a). This is because limestone-slag cement has a reduced capacity to shorten the embedded rebar due to higher total porosity (Vp) at equivalent LS content, lower compressive strength (Rc), and lower PC content (fixed at 35%, the minimum required according to EN 197-5). The increased Vp and higher BFS substitution cause a slight increase in water loss for these mixtures, as illustrated in Figure 13b.

3.6. LCA Analysis

Figure 14a,b illustrate the environmental impact (expressed in kg of CO2 equivalent) of 1 ton of cement and 1 m3 of mortar, respectively. The total Global Warming Potential (GWP) of CEM II/B-LL mortars decreases as the LS content increases. This is because LS is an inert material that does not require the high-temperature heating treatment necessary for PC. Specifically, for 1 ton of cement, substituting 15% of PC with LS reduces CO2 equivalent emissions by 15%. A 25% substitution leads to a 24% reduction, while a 35% substitution decreases the environmental impact by 34% compared to the reference (REF) cement environmental GWP. Similarly, for 1 m3 of mortar, replacing 15%, 25%, and 35% of PC with LS reduces CO2 equivalent emissions by 18%, 20%, and 28%, respectively, compared to the REF mortar environmental GWP. In the case of CEM VI, the total GWP is less affected by the substitution of BFS with LS. The environmental impact decreases by 2%, 4%, 6%, and 7% when replacing 10%, 20%, 30%, and 40% of BFS with LS in cement, respectively. For mortars, the reductions are 1%, 3%, 4%, and 6% for the same levels of BFS substitution with LS. Notably, CEM VI mortars are more sustainable than CEM II/B-LL blends [27]. This is because CEM VI is composed of only 35% of PC, BFS (a secondary raw material), and LS (an inert material). The environmental impact of CEM VI is approximately 60% of that of CEM II/B-LL for cement and around 50% for mortars.
Figure 15 presents the environmental impact in relation to the compressive strength (Rc) for 1 m3 of standard mortar. The data show that for CEM II mortars, replacing PC with LS significantly affects both GWP and Rc. As the LS content increases, CO2 emissions decrease, but so does Rc. In contrast, for CEM VI mortars, replacing BFS with LS primarily impacts Rc, while the GWP remains nearly unchanged. This difference arises because, in the first case, LS replaces PC, which is both the main contributor to compressive strength and the most environmentally impactful component. In the second case, LS replaces BFS, a by-product with no direct environmental cost but with hydraulic properties that contribute to Rc. Interestingly, for CEM II mortars with 15% LS content, there is both a reduction in GWP and an improvement in Rc, offering benefits for both mechanical performance and environmental sustainability.

4. Conclusions

In this study, two sustainable blended cements were developed according to UNI EN 197-1 and 197-5: CEM II/B-LL, replacing Portland cement with limestone at the dosage of 0, 15, 25, 35% by mass and CEM VI, replacing blast furnace slag with limestone at the dosage rate of 0, 10, 20, 30, 40% by mass.
The results obtained by the characterisation of the corresponding standard mortars concluded the following:
  • Both hydraulic binders can be classified as structural cements. In particular, for CEM II/B-LL the strength classes are: 52.5R with 0–15% LS, 42.5R with 25% LS, and 32.5R with 35% LS. For CEM VI the strength classes are: 52.5L with 0–10% LS, 42.5N with 20% LS, 32.5R with 30% LS, and 32.5N with 40% LS, despite the maximum BFS substitution with LS exceeding the limit established by the standard (20%);
  • LS substitution increases the setting time of CEM II/B due to the reduced PC content and the inert nature of LS but not that of CEM VI since BFS acts only as a slow-reacting pozzolanic binder;
  • When cured at a low temperature (10 °C), all CEM VI mortars maintain their mechanical properties, even at higher LS levels, making them particularly good in cold climates;
  • The total porosity and the capillary water absorption of the mortars increase with LS content but less in CEM VI;
  • In CEM II/B-LL, the free shrinkage of the mortars decreases with LS substitution due to the reduced binder paste and increased inert material content. In CEM VI mortars, free shrinkage increases with LS content up to 20% but decreases at higher LS levels (30–40%) due to the reduced BFS. Restrained shrinkage is lower in CEM VI mortars than in CEM II/B-LL, reflecting lower mechanical properties;
  • The total GWP of CEM II/B-LL decreases significantly with higher LS content due to the inert nature of LS and lack of energy-intensive processing. Substituting 15%, 25%, and 35% PC with LS reduces environmental impact by 12%, 20%, and 28%, respectively. CEM VI is less sensible to BFS replacement with LS since the GWP remains almost constant up to a 40% substitution. However, CEM VIs reach a 50% lower environmental impact than CEM II/B-LLs, highlighting their superior sustainability.
In conclusion, our key findings include that both blended cements maintain structural integrity, with CEM VI performing well even at low temperatures. Limestone substitution increases water absorption and porosity, but CEM VI is less sensitive to these changes. Shrinkage behaviour varies: CEM II/B-LL shows reduced free shrinkage with higher limestone content, while CEM VI shows a slight increase before decreasing at higher levels. CEM VI has a 50% lower environmental impact than CEM II/B-LL, highlighting its superior sustainability.

Author Contributions

Conceptualisation, A.M., E.C., F.T. and D.G.; methodology, A.M., E.C., F.T. and D.G.; software, E.B. and A.M.; validation, A.M., E.C., F.T. and D.G.; formal analysis, E.B.; investigation, E.B.; resources, E.C., F.T. and D.G.; data curation, E.B.; writing—original draft preparation, E.B. and A.M.; writing—review and editing, E.C., F.T. and D.G.; visualisation, A.M., E.C., F.T. and D.G.; supervision, A.M., E.C., F.T. and D.G.; project administration, E.C., F.T. and D.G.; funding acquisition, E.C., F.T. and D.G. All authors have read and agreed to the published version of the manuscript.

Funding

This research received no external funding.

Institutional Review Board Statement

Not applicable.

Informed Consent Statement

Not applicable.

Data Availability Statement

The original contributions presented in this study are included in the article. Further inquiries can be directed to the corresponding author.

Conflicts of Interest

The authors declare no conflicts of interest.

References

  1. Baek, C.; Park, S.-H.; Suzuki, M.; Lee, S.-H. Life cycle carbon dioxide assessment tool for buildings in the schematic design phase. Energy Build. 2013, 61, 275–287. [Google Scholar] [CrossRef]
  2. Reddy, B.V.V.; Jagadish, K.S. Embodied energy of common and alternative building materials and technologies. Energy Build. 2003, 35, 129–137. [Google Scholar] [CrossRef]
  3. Victoria University. Embodied Energy Coefficients. 2017. Available online: www.wgtn.ac.nz/architecture/centres/cbpr/resources/pdfs/ee-coefficients.pdf (accessed on 8 January 2025).
  4. Hammond, G.; Jones, C. Embodied Carbon. The Inventory of Carbon and Energy (ICE); Lowrie, F., Tse, P., Eds.; Version 2; University of Bath with BSRIA, iCAT: Bracknell, UK, 2011. [Google Scholar]
  5. Custom Market Insight. Available online: https://www.custommarketinsights.com/ (accessed on 8 January 2025).
  6. Coley, J. Global Concrete Report 2023. Available online: https://www.proids-online.com/products/reports/global-concrete-report-2023 (accessed on 8 January 2025).
  7. EN 197-1:2000; Cement-Part 1: Composition, Specifications and Conformity Criteria for Common Cements. European Committee for Standardization: Brussels, Belgium, 2000.
  8. Bharadwaj, K.; Isgor, O.B.; Weiss, W.J. Supplementary cementitious materials in Portland-limestone cements. ACI Mater. J. 2022, 119, 141–154. [Google Scholar] [CrossRef]
  9. Mapiravana, J. Building Materials for a Sustainable Future—Cement; Alive2green: Cape Town, South Africa, 2014; pp. 1–9. Available online: https://researchspace.csir.co.za/server/api/core/bitstreams/20597aea-ae7d-4073-908b-12aa482b6cfb/content (accessed on 8 January 2025).
  10. Tayebani, B.; Said, A.; Memari, A. Less carbon producing sustainable concrete from environmental and performance perspectives: A review. Constr. Build. Mater. 2023, 404, 133234. [Google Scholar] [CrossRef]
  11. European Commission. A New Circular Economy Action Plan for a Cleaner and More Competitive Europe. COM 98; European Commission: Brussels, Belgium, 2020. [Google Scholar]
  12. Juenger, M.C.G.; Snellings, R.; Bernal, S.A. Supplementary cementitious materials: New sources, characterization, and performance insights. Cem. Concr. Res. 2019, 122, 257–273. [Google Scholar] [CrossRef]
  13. Skibsted, J.; Snellings, R. Reactivity of supplementary cementitious materials (SCMs) in cement blends. Cem. Concr. Res. 2019, 124, 105799. [Google Scholar] [CrossRef]
  14. EnDurCrete Project. Available online: http://www.endurcrete.eu/ (accessed on 8 January 2025).
  15. EN 197-5; Cement-Part 5: Portland-Composite Cement CEM II/C-M and Composite Cement CEM VI. European Committee for Standardization: Brussels, Belgium, 2021.
  16. Zhao, J.; Li, Z.; Wang, D.; Yan, P.; Luo, L.; Zhang, H.; Zhang, H.; Gu, X. Hydration superposition effect and mechanism of steel slag powder and granulated blast furnace slag powder. Constr. Build. Mater. 2023, 366, 130101. [Google Scholar] [CrossRef]
  17. Zou, J.; Liu, Z.; Guo, Q. Comprehensive utilisation of blast furnace slag. Can. Metall. Q. 2024, 63, 927–934. [Google Scholar] [CrossRef]
  18. Divsholi, B.S.; Yang, T.; Lim, D.; Teng, S. Durability Properties and Microstructure of Ground Granulated Blast Furnace Slag Cement Concrete. Int. J. Concr. Struct. Mater. 2014, 8, 157–164. [Google Scholar] [CrossRef]
  19. Mohamad, N.; Muthusamy, K.; Embong, R.; Kusbiantoro, A.; Hanafi, M. Environmental impact of cement production and Solutions: A review. Mater. Today Proc. 2022, 48, 741–746. [Google Scholar] [CrossRef]
  20. Han, Y.; Lin, R.; Wang, X. Performance of sustainable concrete made from waste oyster shell powder and blast furnace slag. J. Build. Eng. 2022, 47, 103918. [Google Scholar] [CrossRef]
  21. Mostazid, I.; Medepalli, S.; Sakai, Y. Effect of thermal treatment on strengthening recycled compacted concrete incorporating iron, steel, and blast furnace slag. Constr. Build. Mater. 2022, 347, 128623. [Google Scholar] [CrossRef]
  22. Chen, G.; Li, S.; Zhao, Y.; Xu, Z.; Luo, X.; Gao, J. Hydration and microstructure evolution of a novel low-carbon concrete containing recycled clay brick powder and ground granulated blast furnace slag. Constr. Build. Mater. 2023, 386, 131596. [Google Scholar] [CrossRef]
  23. Azenha, M.; Kanavaris, F.; Schlicke, D.; Je, A.; Fairbairn, J.T.E.M.R.; Pesavento, F.; Philip, N.; Ragalwar, K. Recommendations of RILEM TC 287-CCS: Thermo-chemo- mechanical modelling of massive concrete structures towards cracking risk assessment. Mater. Struct. 2021, 54, 135. [Google Scholar] [CrossRef]
  24. Liu, Y.; Zhang, Z.; Hou, G.; Yan, P. Preparation of sustainable and green cement-based composite binders with high-volume steel slag powder and ultrafine blast furnace slag powder. J. Clean. Prod. 2021, 289, 125133. [Google Scholar] [CrossRef]
  25. Majhi, R.K.; Nayak, A.N. Production of sustainable concrete utilising high-volume blast furnace slag and recycled aggregate with lime activator. J. Clean. Prod. 2020, 255, 120188. [Google Scholar] [CrossRef]
  26. Zeraoui, A.; Maherzi, W.; Benzerzour, M.; Abriak, N.E.; Aouad, G. Development of Flash-Calcined Sediment and Blast Furnace Slag Ternary Binders. Buildings 2023, 13, 333. [Google Scholar] [CrossRef]
  27. Dhandapani, Y.; Santhanam, M.; Kaladharan, G.; Ramanathan, S. Towards ternary binders involving limestone additions—A review. Cem. Concr. Res. 2021, 143, 106396. [Google Scholar] [CrossRef]
  28. Wang, X.-Y. Optimal mix design of low-CO2 blended concrete with limestone powder. Constr. Build. Mater. 2020, 263, 121006. [Google Scholar] [CrossRef]
  29. Rashwan, M.A.; Al Basiony, T.M.; Mashaly, A.O.; Khalil, M.M. Self-compacting concrete between workability performance and engineering properties using natural stone wastes. Constr. Build. Mater. 2022, 319, 126132. [Google Scholar] [CrossRef]
  30. Scrivener, K.; Avet, F.; Maraghechi, H.; Zunino, F.; Ston, J.; Hanpongpun, W.; Favier, A. Impacting factors and properties of limestone calcined clay cements (LC3). Green Mater. 2019, 7, 3–14. [Google Scholar] [CrossRef]
  31. Argın, G.; Uzal, B. Enhancement of pozzolanic activity of calcined clays by limestone powder addition. Constr. Build. Mater. 2021, 284, 9–14. [Google Scholar] [CrossRef]
  32. Souza, A.T.; Barbosa, T.F.; Riccio, L.A.; Jose, W. Effect of limestone powder substitution on mechanical properties and durability of slender precast components of structural mortar. Integr. Med. Res. 2019, 9, 847–856. [Google Scholar] [CrossRef]
  33. Li, C.; Jiang, L. Utilization of limestone powder as an activator for early-age strength improvement of slag concrete. Constr. Build. Mater. 2020, 253, 119257. [Google Scholar] [CrossRef]
  34. Shao, Z.; Cao, M.; Zheng, X. Limestone particle sizes and sulfate impact on the early hydration of limestone calcined clay cement. J. Build. Eng. 2024, 97, 110848. [Google Scholar] [CrossRef]
  35. Hamdadou, M.N.; Bignonnet, F.; Deboucha, W.; Ranaivomanana, H.; Leklou, N.; Arroudj, K. Hydration, mechanical and transfer properties of blended cement pastes and mortars prepared with recycled powder or limestone filler. J. Build. Eng. 2023, 78, 107541. [Google Scholar] [CrossRef]
  36. Khatib, J.; Ramadan, R.; Ghanem, H.; Elkordi, A. Effect of using limestone fines on the chemical shrinkage of pastes and mortars. Environ. Sci. Pollut. Res. 2023, 30, 25287–25298. [Google Scholar] [CrossRef]
  37. Ji, G.; Chi, H.; Sun, K.; Peng, X.; Cai, Y. Effect of limestone waste on the hydration and microstructural properties of cement-based materials. Constr. Build. Mater. 2024, 443, 137784. [Google Scholar] [CrossRef]
  38. Zhang, Z.; Xiao, J.; Han, K.; Wang, J.; Hu, X. Study on the structural build-up of cement-ground limestone pastes and its micro-mechanism. Constr. Build. Mater. 2020, 263, 120656. [Google Scholar] [CrossRef]
  39. Hamza, A.; Nune, S.; Liebscher, M.; Köberle, T.; Willomitzer, A.; Noack, I.; Butler, M.; Mechtcherine, V. Exploring the role of dilutive effects on microstructural development and hydration kinetics of limestone calcined clay cement (LC3) made of low-grade raw materials. J. Clean. Prod. 2023, 428, 139438. [Google Scholar] [CrossRef]
  40. Liu, Y.; Zhuge, Y.; Duan, W.; Huang, G.; Yao, Y. Modification of microstructure and physical properties of cement-based mortar made with limestone and alum sludge. J. Build. Eng. 2022, 58, 105000. [Google Scholar] [CrossRef]
  41. Briki, Y.; Zajac, M.; Ben, M.; Scrivener, K. Impact of limestone fineness on cement hydration at early age. Cem. Concr. Res. 2021, 147, 106515. [Google Scholar] [CrossRef]
  42. Zhao, L.; He, T.; Niu, M.; Chang, X.; Wang, L.; Wang, Y. Effect of Limestone Powder Mixing Methods on the Performance of Mass Concrete. Materials 2024, 17, 617. [Google Scholar] [CrossRef]
  43. Li, X.; Cao, M. Recent Developments on the Effects of Micro- and Nano-Limestone on the Hydration Process, Products, and Kinetics of Cement. Materials 2024, 17, 2133. [Google Scholar] [CrossRef]
  44. Elkhaldi, I.; Roziere, E.; Turcry, P.; Loukili, A. Towards global indicator of durability performance and carbon footprint of clinker-slag-limestone cement-based concrete exposed to carbonation. J. Clean. Prod. 2022, 380, 134876. [Google Scholar] [CrossRef]
  45. Cyr, M. Influence of supplementary cementitious materials (SCMs) on concrete durability. In Eco Efficient Concrete; Pacheco-Torgal, F., Jalali, S., Labrincha, J., John, V.M., Eds.; Woodhead Publishing: Sawston, UK, 2013; pp. 153–197. [Google Scholar]
  46. Blasi, E.; Di Bella, C.; Choorackal, E.; Maqbool, Q.; Tittarelli, F.; Garufi, D.; Schmidt, T. Use of low-grade kaolinite clays in the production of limestone calcined clay cement. J. Sustain. Cem. Mater. 2024, 14, 209–221. [Google Scholar] [CrossRef]
  47. EN 196-3; Methods of Testing Cement—Part 3: Determination of Setting Times and Soundness. European Committee for Standardization: Brussels, Belgium, 2016.
  48. EN 196-1; Methods of Testing Cement—Part 1: Determination of Strength. European Committee for Standardization: Brussels, Belgium, 2016.
  49. EN 1015-3; Methods of Test for Mortar for Masonry—Part 3: Determination of Consistence of Fresh Mortar (by Flow Table). European Committee for Standardization: Brussels, Belgium, 1999.
  50. EN 1015-6; Methods of Test for Mortar for Masonry—Part 6: Determination of Bulk Density of Fresh Mortar. European Committee for Standardization: Brussels, Belgium, 1998.
  51. EN 12504-4; Testing Concrete in Structures—Part 4: Determination of Ultrasonic Pulse Velocity. European Committee for Standardization: Brussels, Belgium, 2021.
  52. Mobili, A.; Blasi, E.; Maqbool, Q.; Tittarelli, F. Copper mine tailings and metakaolin as precursors for sustainable alkali-activated mortars. J. Build. Eng. 2025, 103, 112134. [Google Scholar] [CrossRef]
  53. Cosoli, G.; Mobili, A.; Giulietti, N.; Chiariotti, P.; Pandarese, G.; Tittarelli, F.; Bellezze, T.; Mikanovic, N.; Revel, G.M. Performance of concretes manufactured with newly developed low-clinker cements exposed to water and chlorides: Characterization by means of electrical impedance measurements. Constr. Build. Mater. 2021, 271, 121546. [Google Scholar] [CrossRef]
  54. EN 15801; Conservation of Cultural Property—Test Methods—Determination of Water Absorption by Capillarity. European Committee for Standardization: Brussels, Belgium, 2009.
  55. EN 12617-4; Products and Systems for the Protection and Repair of Concrete Structures—Test Methods—Part 4: Determination of Shrinkage and Expansion. European Committee for Standardization: Brussels, Belgium, 2002.
  56. UNI EN 8147; Not Metallic Expansive Agents for Cement Mixings—Determination of Restrained Expansion of mortar. Ente Italiano di Normazione: Milan, Italy, 2017.
  57. ISO 14040; Environmental Management—Life Cycle Assessment—Principles and Framework. ISO: Geneva, Switzerland, 2006.
  58. ISO 14044; Environmental Management—Life cycle Assessment—Requirements and Guidelines. ISO: Geneva, Switzerland, 2006.
  59. GCCA EPD Tool. Available online: https://www.concrete-epd-tool.org (accessed on 13 December 2024).
  60. Courard, L.; Michel, F. Limestone fillers cement based composites: Effects of blast furnace slags on fresh and hardened properties. Constr. Build. Mater. 2014, 51, 439–445. [Google Scholar] [CrossRef]
  61. Wang, D.; Shi, C.; Farzadnia, N.; Shi, Z.; Jia, H.; Ou, Z. A review on use of limestone powder in cement-based materials: Mechanism, hydration and microstructures. Constr. Build. Mater. 2018, 181, 659–672. [Google Scholar] [CrossRef]
  62. Wang, D.; Shi, C.; Farzadnia, N.; Shi, Z.; Jia, H. A review on effects of limestone powder on the properties of concrete. Constr. Build. Mater. 2018, 192, 153–166. [Google Scholar] [CrossRef]
  63. Collepardi, M. The New Concrete 2010; Tintoretto: Castrette di Villorba, Italy, 2010. [Google Scholar]
  64. Jeong, D.-G.; Lee, H.-S. The effect of Pozzolanic reaction under different curing temperatures in strength development of RPC. In Proceedings of the International Conference on Sustainable Building Asia, Seoul, Republic of Korea, 8–10 July 2010; pp. 251–256. [Google Scholar]
  65. Concu, G.; Trulli, N. Concrete Defects Sizing by Means of Ultrasonic Velocity Maps. Buildings 2018, 8, 176. [Google Scholar] [CrossRef]
  66. Diab, A.M.; Abd Elmoaty, M.; Aly, A.A. Long term study of mechanical properties, durability and environmental impact of limestone cement concrete. Alexandria Eng. J. 2016, 55, 1465–1482. [Google Scholar] [CrossRef]
  67. Mobili, A.; Belli, A.; Giosuè, C.; Bellezze, T.; Tittarelli, F. Metakaolin and fly ash alkali-activated mortars compared with cementitious mortars at the same strength class. Cem. Concr. Res. 2016, 88, 198–210. [Google Scholar] [CrossRef]
  68. Zdravkov, B.D.; Čermák, J.J.; Šefara, M.; Janků, J. Pore classification in the characterization of porous materials: A perspective. Cent. Eur. J. Chem. 2007, 5, 385–395. [Google Scholar] [CrossRef]
  69. Quadri Simões da Silva, M.T.; Perretto, F.; do Rocio Cardoso, M.; Mazer, W. Porosity: Some characterization techniques. Mater. Today Proc. 2024. [Google Scholar] [CrossRef]
  70. Mobili, A.; Telesca, A.; Marroccoli, M.; Tittarelli, F. Calcium sulfoaluminate and alkali-activated fly ash cements as alternative to Portland cement: Study on chemical, physical-mechanical, and durability properties of mortars with the same strength class. Constr. Build. Mater. 2020, 246, 118436. [Google Scholar] [CrossRef]
  71. Mobili, A.; Giosuè, C.; Bitetti, M.; Tittarelli, F. Cement mortars and geopolymers with the same strength class. Proc. Inst. Civ. Eng. Constr. Mater. 2015, 169, 3–12. [Google Scholar] [CrossRef]
  72. Li, C. Relationship between water absorption and porosity in concrete with limestone powder addition. Struct. Concr. 2022, 23, 3284–3293. [Google Scholar] [CrossRef]
  73. Xu, W.; Tang, Z.; Song, Y.; Xie, Y.; Lei, B.; Yu, H.; Long, G.; Kai, M. Drying shrinkage of geopolymeric recycled aggregate concrete. Constr. Build. Mater. 2023, 395, 132220. [Google Scholar] [CrossRef]
  74. Collepardi, M. The New Concrete; Tintoretto: Castrette di Villorba, Italy, 2006. [Google Scholar]
Figure 1. XRD spectra of LS and BFS.
Sustainability 17 02402 g001
Figure 2. Cumulative PSD of PC, LS, and BFS.
Sustainability 17 02402 g002
Figure 3. Compressive strength and strength classification at T = 20 °C of (a) CEM II/B-LL standard mortars and (b) CEM VI standard mortars.
Sustainability 17 02402 g003
Figure 4. Compressive strength at T = 40 °C of (a) CEM II/B-LL standard mortars and (b) CEM VI standard mortars.
Sustainability 17 02402 g004
Figure 5. Compressive strength at T = 10 °C of (a) CEM II/B-LL standard mortars and (b) CEM VI standard mortars.
Sustainability 17 02402 g005
Figure 6. Influence of LS percentage on Rc at 28 days of curing for CEM II/B-LL and CEM VI standard mortars.
Sustainability 17 02402 g006
Figure 7. Correlation between total porosity Vp and Rc at 28 days of curing for CEM II/B-LL and CEM VI standard mortars.
Sustainability 17 02402 g007
Figure 8. Pore distribution of (a) CEM II/B-LL standard mortars and (b) CEM VI standard mortars.
Sustainability 17 02402 g008
Figure 9. Water absorbed per unit area (Qi) of (a) CEM II/B-LL standard mortars and (b) CEM VI standard mortars.
Sustainability 17 02402 g009
Figure 10. Free drying shrinkage of (a) CEM II/B-LL standard mortars and (b) CEM VI standard mortars.
Sustainability 17 02402 g010
Figure 11. Restrained shrinkage of (a) CEM II/B-LL standard mortars and (b) CEM VI standard mortars.
Sustainability 17 02402 g011
Figure 12. Loss of water related to free drying shrinkage of (a) CEM II/B-LL standard mortars and (b) CEM VI standard mortars.
Sustainability 17 02402 g012
Figure 13. Loss of water related to restrained shrinkage of (a) CEM II/B-LL standard mortars and (b) CEM VI standard mortars.
Sustainability 17 02402 g013
Figure 14. Total GWP results expressed in kg of CO2 equivalent of (a) 1 ton of cement and (b) 1 m3 of CEM II/B-LL and CEM VI standard mortars.
Sustainability 17 02402 g014
Figure 15. Total GWP results expressed in kg of CO2 equivalent related to compressive strength at 28 days of curing for 1 m3 of CEM II/B-LL and CEM VI standard mortars.
Sustainability 17 02402 g015
Table 1. Chemical composition (wt%) of PC, LS, and BFS.
MaterialSiO2Al2O3Fe2O3CaOMgOK2ONa2OTiO2SO3
PC17.44.43.368.11.90.80.20.33.2
LS1.30.00.098.20.50.00.00.00.0
BFS33.510.80.443.97.80.50.20.71.7
Table 2. Relative density, specific surface area, and mean particle size of PC, LS, and BFS.
MaterialRelative Density (g/cm3)Specific Surface Area (cm2/g)Mean Particle Size (µm)
PC3.48289912
LS2.75390013
BFS2.90401414
Table 3. Mix proportion of CEM II/B-LL and CEM VI standard mortars.
MortarsPC
(g/L)
LS
(g/L)
BFS
(g/L)
Water
(g/L)
Sand
(g/L)
w/c 1w/b 2Flow Value
(mm)
CEM II/B-LL
REF512--25615350.50.5170
15% LS43376-25515290.60.5157
25% LS381127-25415260.70.5156
35% LS330177-25415210.80.5171
CEM VI
REF BFS178-33025415241.40.5143
10% LS 55% BFS1785127925415221.40.5144
20% LS 45% BFS17710122825315201.40.5150
30% LS 35% BFS17715217725315181.40.5143
40% LS 25% BFS17720212625315161.40.5143
1 Water/cement ratio. 2 Water/binder ratio (where the binder is the sum of PC, LS, and BFS).
Table 4. Setting time of CEM II/B-LL and CEM VI standard mortars.
MortarsInitial Setting Time
(min)
Final Setting Time
(min)
CEM II/B-LL
REF205266
15% LS223296
25% LS222362
35% LS278395
CEM VI
REF BFS200417
10% LS 55% BFS205424
20% LS 45% BFS205421
30% LS 35% BFS215417
40% LS 25% BFS219425
Table 5. Dynamic modulus of elasticity (Ed) of CEM II/B-LL and CEM VI standard mortars at 20, 40, and 10 °C after 28 days of curing.
MortarsEd at 20 °C
(GPa)
Ed at 40 °C
(GPa)
Ed at 10 °C
(GPa)
CEM II/B-LL
REF45 ± 0.938 ± 1.544 ± 0.1
15% LS41 ± 0.135 ± 0.042 ± 0.0
25% LS39 ± 1.131 ± 0.042 ± 0.1
35% LS37 ± 0.128 ± 0.039 ± 0.0
CEM VI
REF BFS46 ± 0.340 ± 1.142 ± 0.7
10% LS 55% BFS45 ± 0.540 ± 0.641 ± 0.3
20% LS 45% BFS44 ± 1.140 ± 0.941 ± 0.7
30% LS 35% BFS43 ± 0.738 ± 0.440 ± 1.2
40% LS 25% BFS42 ± 1.335 ± 0.040 ± 0.1
Table 6. Hardened properties of CEM II/B-LL and CEM VI standard mortars.
MortarsVp
(%)
AC
(kg/(m2√s))
CEM II/B-LL
REF150.015
15% LS160.016
25% LS180.028
35% LS210.033
CEM VI
REF BFS170.013
10% LS 55% BFS180.014
20% LS 45% BFS210.015
30% LS 35% BFS210.020
40% LS 25% BFS210.024
Disclaimer/Publisher’s Note: The statements, opinions and data contained in all publications are solely those of the individual author(s) and contributor(s) and not of MDPI and/or the editor(s). MDPI and/or the editor(s) disclaim responsibility for any injury to people or property resulting from any ideas, methods, instructions or products referred to in the content.

