Abstract
With the intensification of climate change and urbanization, the impact of high-temperature disasters on urban resilience has become increasingly significant. Based on the “Pressure-State-Response” (PSR) model, this study proposes a novel assessment method for urban high-temperature disaster resilience. Through 15 evaluation indicators across 3 categories, we quantified the high-temperature disaster resilience level in Hangzhou and constructed a SOM-K-means second-order clustering algorithm to classify the study area into different resilience zones, exploring the spatial differentiation characteristics of high-temperature disaster resilience. The research results indicate the following: (1) Hangzhou exhibits a relatively low level of high-temperature disaster resilience, with a spatial distribution pattern showing a radial decrease from the main city area at the center, followed by a slight increase in the far periphery of the main city area. (2) The study area was divided into four distinct high-temperature disaster resilience zones, demonstrating significant spatial differentiation characteristics. This study innovatively integrates the PSR model with the SOM-K-means clustering method, providing a new perspective for the quantitative assessment and spatial zoning of urban high-temperature disaster resilience. The findings offer valuable decision-making support for enhancing urban resilience.
1. Introduction
The World Meteorological Organization (WMO) research report [1] and The Lancet studies [2] have identified high temperatures as one of the characteristic features of global climate change and an increasingly severe risk for urban areas worldwide, posing significant threats to urban development and causing substantial public health losses. The latest Sixth Assessment Report from the Intergovernmental Panel on Climate Change (IPCC) further indicates that global temperatures continue to rise, with an anticipated increase of 1.5 °C during 2021–2040, accompanied by a significant rise in the frequency of high-temperature events [3]. Research from the China Meteorological Administration’s National Climate Center and The Lancet’s China Special Report also demonstrates that China’s average temperature continues to reach record highs, with an increasing frequency of high-temperature events, making heat a growing and accelerating threat to urban areas and public health [4]. High temperatures impose additional burdens on urban infrastructure and socio-economic systems, disrupting healthy urban operations [5]. Consequently, high-temperature disasters have become an emerging non-traditional security governance issue for an increasing number of cities [6]. Given the uncertainty regarding the occurrence, intensity, and duration of high-temperature events, traditional passive disaster mitigation approaches have proven inadequate in addressing the escalating urban heat risks, necessitating new governance paradigms [7].
Early research on high-temperature disasters primarily focused on the relationship between heat and public health, particularly its adverse health consequences, with a predominant emphasis on pathological studies [8]. With the growing international attention on sustainability science, research on high-temperature disasters has gradually shifted toward vulnerability studies. Uejio et al. developed a comprehensive vulnerability assessment index system by integrating multiple factors, including heat exposure, the built environment, socio-economic conditions, and community stability, enabling a quantitative characterization of regional heatwave vulnerability and the spatial identification of vulnerable populations [9]. El-Zein et al. introduced new perspectives and methodological support for high-temperature vulnerability assessment through the application of Outranking methods [10]. In recent years, the acceleration of climate change and urbanization has exacerbated high-temperature issues, making the reduction in heat vulnerability and the enhancement of urban resilience against high temperatures a new research direction [11].
In 1973, the ecologist Holling first proposed the concept of “resilience”, defining it as “the ability of a system to absorb changes and disturbances while maintaining stable relationships between population and state variables”, laying the theoretical foundation for subsequent resilience theory. Since then, resilience research has gradually expanded from ecology to various fields, with its concept and connotation continuously enriched and developed. For instance, in the field of economics, Hill et al. defined resilience as “the ability of a regional economy to return to its pre-shock growth rate after experiencing exogenous shocks, and to transition rapidly from a low-level equilibrium to a ‘better equilibrium’” [12]. In the field of urban safety, UN-Habitat defined it as “enhancing urban resilience to the impacts of natural and human-induced crises, ensuring cities can withstand catastrophic events and recover quickly” [13]. In disaster studies, resilience refers to “the resistance, recovery, and adaptability of a system or community in the face of disasters” [14]. The United Nations International Strategy for Disaster Reduction (UNISDR) further defined disaster resilience as “the ability of a system, community, or individual to prevent, mitigate, respond to, and recover from the impacts or stresses of disasters” [15]. As disaster assessment forms the basis of proactive disaster prevention, mitigation, and relief, research on urban and community resilience to floods [16], earthquakes [17], hurricanes [18], and other disasters has emerged. However, studies on high-temperature disasters have primarily focused on disaster characteristics and risk assessment [19,20,21], with limited literature from a resilience perspective. During this process, significant achievements have been made in exploring disaster resilience assessment models and guiding urban disaster governance. However, these models tend to treat disaster resilience as a “static” coupling of urban (community) subsystems such as social, economic, environmental, institutional, technological, and organizational functions, lacking sufficient attention to the dynamic characteristics of disaster resilience and a process-oriented perspective, which limits their applicability in guiding urban disaster management.
The “Pressure-State-Response” (PSR) model provides a potential solution to these challenges. Initially proposed by Canadian statisticians David J. Rapport and Tony Friend to quantify and analyze the state of ecological systems [22], the PSR model posits that human activities exert pressure on the environment, leading to changes in ecological conditions, which in turn prompt societal responses to mitigate or prevent further degradation [23]. Promoted by the Organisation for Economic Co-operation and Development (OECD) and the United Nations Environment Programme (UNEP), the PSR model has become a key method in ecological system assessment research [24]. It has been widely applied in areas such as ecological security [25], ecosystem health [26], tourism ecological sustainability [27], and biodiversity [28], demonstrating high adaptability [22,29]. Moreover, the inherent “cause–effect–response” logic of the PSR model aligns with the resilience characteristics of urban systems and matches the entire process of disaster causation, bearing, and mitigation. Consequently, the integration of the PSR model with disaster resilience has yielded research outcomes in assessing urban waterlogging [30] and flood-landslide disasters [31,32], though studies on urban high-temperature disasters remain scarce.
In spatial zoning research, machine learning methods are widely used. Among them, Self-Organizing Maps (SOMs) have been extensively applied in geographic spatial zoning [33], land use classification [34], and ecological functional zoning [35]. However, SOM suffers from slow convergence, low classification accuracy, and comparability issues [36]. K-means, on the other hand, has been utilized in urban functional zoning [37], urban spatial morphology identification [38], and GI supply–demand spatial differentiation [39]. K-means is computationally simple and fast, and is capable of uncovering hidden patterns and organizational structures in data, but it requires pre-specifying the initial number of clusters to ensure accurate results. The SOM-K-means combined clustering algorithm leverages the complementary strengths of both methods. SOM performs initial clustering to determine the number of clusters and their centroids, which are then used as input for K-means to complete iterative calculations until convergence, yielding the final clustering results. The SOM-K-means approach has been applied in future drought mapping [40], regional carbon compensation zone identification and supply differentiation optimization [41], and groundwater pollution zone identification for precise regulation [42].
Hangzhou, a major coastal city in southern China, has experienced rising temperatures in recent years, with high-temperature risks severely constraining its healthy development. Therefore, this study selects Hangzhou as the research area. Given the current research progress, the objectives of this study include (1) developing a method based on the PSR model to measure urban high-temperature disaster resilience, providing a spatial differentiation profile of Hangzhou’s high-temperature disaster resilience; (2) applying the SOM-K-means clustering algorithm to multi-dimensional (criteria) and multi-indicator urban high-temperature disaster resilience spatial differentiation data to uncover underlying patterns and structures, obtaining spatial zoning of Hangzhou’s high-temperature disaster resilience and identifying dominant influencing factors for each zone; and (3) using mixed research analysis to derive targeted strategies for enhancing high-temperature disaster resilience in each zone.
Accordingly, this study first constructs a conceptual framework for high-temperature disaster resilience, providing a theoretical basis for resilience assessment and strategy development. Second, a high-temperature resilience assessment model and technical methodology are established based on the PSR model. Then, a second-order clustering model is constructed using SOM and K-means neural network algorithms. Finally, taking Hangzhou as a case study, the spatial characteristics of high-temperature resilience are assessed and analyzed, resulting in urban high-temperature resilience spatial zoning. Based on the conceptual framework and assessment results, strategies for enhancing high-temperature resilience are proposed. The findings can provide references for Hangzhou to address increasingly severe high-temperature disasters, and the methods explored in this study can offer insights for other cities in assessing and improving high-temperature disaster resilience.
2. Methodology
2.1. Study Area
Hangzhou is situated in the southern part of the Yangtze River Delta and the northern region of Zhejiang Province, downstream of the Qiantang River, which is characterized by a typical subtropical monsoon climate with mild, dry winters and hot, rainy summers. According to the World Meteorological Organization (WMO) standards, a high-temperature disaster is defined as a weather event with daily maximum temperatures exceeding 32 °C for more than three consecutive days. The China Meteorological Administration (CMA) defines a high-temperature day as one with a maximum temperature of 35 °C or higher, and a high-temperature disaster as such conditions persisting for more than three consecutive days. Meteorological data statistics reveal that over the past decade, Hangzhou has experienced a cumulative total of 319 days with extreme temperatures exceeding 35 °C. In 2020 alone, there were 68 days with temperatures above 32 °C, including 22 days with temperatures exceeding 35 °C, and a peak temperature of 39 °C (Figure 1). Hangzhou issued consecutive high-temperature orange alerts, with high-temperature disasters causing significant losses to forestry and agriculture, impacting urban socio-economic operations, and posing serious threats to public health. Conducting high-temperature disaster resilience research in Hangzhou is both representative and critically important. Considering data completeness, timeliness, availability, and the distribution characteristics of high-temperature periods in Hangzhou, the study period was selected from May to September 2020. The research area covers the central urban area of Hangzhou (3354 km2), including 8 administrative districts, Shangcheng, Xiacheng, Jianggan, Xihu, Gongshu, Yuhang, Binjiang, and Xiaoshan, encompassing a total of 96 streets/towns (Figure 1).
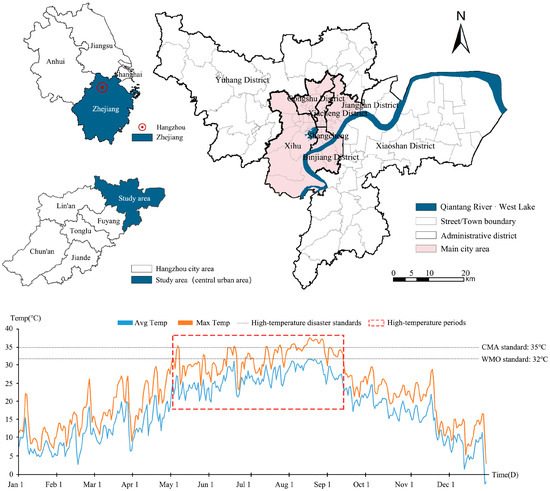
Figure 1.
Study area and temperature period distribution map.
2.2. Research Framework
This study aims to explore the spatial differentiation characteristics and underlying structures of high-temperature disaster resilience in Hangzhou (Figure 2). First, a resilience assessment model is constructed from three dimensions—pressure (P), state (S), and response (R)—and spatial mapping is conducted using a Geographic Information System (GIS). Second, a clustering algorithm combining SOM and K-means neural networks is employed to investigate the spatial combinations of various resilience features. By establishing spatial zoning and constructing “spatial linkages”, this study provides theoretical support for enhancing urban resilience and promoting regional sustainable development.
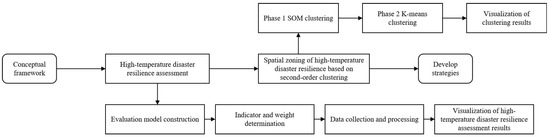
Figure 2.
Experimental flowchart.
2.3. High-Temperature Disaster Resilience Assessment
2.3.1. PSR-Based Assessment Model
The PSR model comprises three dimensions: pressure (P), state (S), and response (R). Pressure refers to external disturbances and stresses on the ecosystem, state represents the current condition of the ecosystem under pressure, and response denotes the ecosystem’s feedback to external pressures. In this study, high temperatures are considered to be disturbances and risks to the urban system. Urban high-temperature disaster resilience is defined as the ability of the urban system exposed to extreme high temperatures to absorb and mitigate the high-temperature disturbances, maintain normal functions, and rapidly recover from high-temperature disasters. The high-temperature disaster resilience process is divided into three temporal phases: pre-disturbance, during disturbance, and post-disturbance, corresponding to the pressure, state, and response elements of the PSR model, respectively. This framework characterizes the “Pressure-State-Response” process of urban systems under high-temperature disturbances (Figure 3).
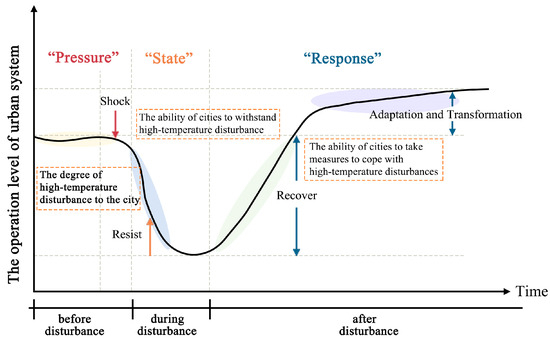
Figure 3.
The “Pressure-State-Response” process of a city disturbed by high temperature.
(1) A high-temperature disaster resilience evaluation index system for Hangzhou was established by selecting indicators from three criteria levels: “pressure resilience”, “state resilience”, and “response resilience”, thereby constructing a high-temperature disaster resilience assessment model. The specific function can be expressed as
where T is the high-temperature disaster resilience index; TP is the pressure resilience index; TS is the state resilience index; and TR is the response resilience index.
where is the weight value of criterion layer i; is the evaluation result of criterion layer i; and represents TP, TS, TR.
(2) The urban high-temperature disaster resilience assessment model and the Analytic Hierarchy Process (AHP) were used to determine the weight coefficients of the indicators. The evaluation indices (TP, TS, TR) for different evaluation layers were calculated using the following formula:
where is the weight value of evaluation indicator j under criterion layer i; is the standardized value of evaluation indicator j under criterion layer i; n is the number of indicators under criterion layer i.
(3) The evaluation results were classified into five levels using the natural break method: low, medium-low, medium, medium-high, and high.
(4) To eliminate differences in the dimensions and scales of the indicator values, the range method was applied to standardize each indicator before calculating the three resilience indices. The specific formulas are as follows:
Standardization formula for positive indicators:
Standardization formula for negative indicators:
where is the standardized value of evaluation indicator j, with a value range of [0, 1]; is the original value of evaluation indicator j; is the minimum value of evaluation indicator j; and is the maximum value of evaluation indicator j.
2.3.2. Assessment Indicators and Weights
(1) Indicator screening. Drawing on existing research and considering the natural, economic, and social characteristics of Hangzhou as well as data availability, an evaluation index system was constructed comprising 3 criterion layers—”pressure resilience”, “state resilience”, and “response resilience”—and 15 specific indicators (Table 1).

Table 1.
Resilience assessment indicators for high-temperature disasters in Hangzhou.
Pressure resilience: This dimension was determined from two perspectives: natural disaster factors (existing high-temperature pressures) and anthropogenic disaster factors (high-temperature pressures caused by human construction activities), including three indicators. Studies have shown that both air temperature and surface temperature can characterize urban thermal environments [43]. Due to the limited number of urban meteorological stations (for air temperature), this study selected surface temperature to reflect the degree of high-temperature pressure on the city. Higher surface temperatures indicate greater high-temperature stress and disaster risk [20,44,45]. Additionally, since air moisture content is negatively correlated with temperature, relative air humidity serves as a positive indicator for mitigating high temperatures [46]. Urban development intensity (floor area ratio and building density), as a major driver of the urban heat island effect, influences heat diffusion within cities. Areas with higher development intensity tend to have higher ambient temperatures and associated risks [47].
State resilience: This dimension represents the disaster-bearing capacity of urban social, economic, and ecological systems during high-temperature disturbances, including nine indicators. Research indicates that high temperatures are more likely to cause fatalities in areas with high population densities [48]. Vulnerable groups such as the elderly, children, women, and people with disabilities are more sensitive to high temperatures and face higher risks of heat-related mortality [49]. This study selected population density as well as the proportions of elderly, child, and female populations to differentiate the likelihood of and variation in high-temperature impacts on Hangzhou’s urban population. The per-land-area GDP and per-unit-area housing price were used to measure the disaster-bearing capacity of the local economic system [50]. Areas with lower economic income and poorer living conditions are often more susceptible to the impacts of heatwaves [51]. Furthermore, studies have shown that vegetation and water bodies significantly mitigate the urban heat island effect [52,53]. Thus, the Normalized Difference Vegetation Index (NDVI) and the Modified Normalized Difference Water Index (MNDWI) were selected to reflect the capacity of urban natural ecosystems to withstand high-temperature disasters.
Response resilience: This dimension represents the city’s ability to respond to high-temperature disasters and recover from their impacts, including four indicators. High-temperature disaster avoidance spatial density (including 11 types of urban spaces with cooling conditions: museums, libraries, art galleries, science and technology museums, exhibition centers, cultural palaces, convention centers, comprehensive gymnasiums, shopping malls, supermarkets, and subway stations) and the number of medical facilities were used to characterize urban high-temperature disaster response capabilities [50,54,55]. Road network density reflects the convenience of post-disaster rescue and evacuation for residents [56]. Additionally, since governments need to provide human, financial, material, and technical support for post-disaster recovery [57], per capita general public budget expenditure was selected to represent the government’s capacity to respond to high-temperature disasters.
(2) Weight determination. The Analytic Hierarchy Process (AHP) was employed to determine the weights. In urban resilience research, the method most widely used both domestically and internationally is AHP, which is concise and practical but requires more qualitative analysis and judgment compared with general quantitative methods [58,59]. Ten university professors, professional researchers, and government agency personnel were invited to comprehensively participate in the weight determination process, all of whom have extensive experience in research fields such as physical geography, socio-ecology, and urban planning. After averaging the scores provided by all the experts, the weights were compared with those from similar studies to ensure their reasonableness. Pairwise comparisons of the relative importance between the criterion layer and specific indicators were conducted, and judgment matrices were established. Valid matrices with satisfactory consistency (CR < 0.1) were identified, and the weights for each criterion and indicator were ultimately calculated (Table 1).
2.3.3. Data Sources and Calculations
Based on the spatial resolution of the primary data sources, the scale of the study area, and computational efficiency [60], a 1000 m × 1000 m grid cell system was constructed using ArcGIS 10.4 software. The mean values of each raster dataset were calculated and resampled to the corresponding grid cells, ensuring a balance between spatial detail and computational efficiency. This approach facilitated the integration of multi-source data into a unified framework.
(1) Pressure resilience: Surface temperature data were obtained through the inversion of Landsat series remote sensing images available on the Google Earth Engine (GEE) cloud platform (https://earthengine.google.com/ (accessed on 3 June 2024)). Specifically, the LANDSAT/LC08/C01/T1_SR surface reflectance dataset, processed using the official atmospheric correction algorithm (LaSRC), was selected, and the mono-window algorithm was applied to derive the temperature data [61]. Relative air humidity data were sourced from the National Tibetan Plateau Data Center (https://data.tpdc.ac.cn/), with a spatial resolution of 1000 m. Development intensity was calculated based on building footprint and height (using 3 m per floor as the standard) using the plot ratio calculation method in ArcGIS and further extracted for unit grid development intensity. Building foundation data were obtained from the Resource and Environment Data Cloud Platform of the Chinese Academy of Sciences (http://www.resdc.cn/DOI/).
(2) State resilience: Population density data were obtained from the dataset shared by Professor Chen Yuehong’s team on the figshare platform (with a resolution of 100 m), and they were resampled in ArcGIS to generate unit grid data. The proportions of elderly, child, and female populations were derived from the Seventh National Population Census. The per-land-area GDP data were sourced from the Resource and Environment Data Cloud Platform of the Chinese Academy of Sciences (with a resolution of 1000 m). The per-unit-area housing price data were collected from the Lianjia and Woaiwojia websites, resulting in a total of 29,405 filtered housing price records for Hangzhou in 2020. Inverse Distance Weighting (IDW) interpolation was applied in ArcGIS based on unit grid dimensions. NDVI and MNDWI data were calculated using the Google Earth Engine (GEE) cloud platform [62].
(3) Response resilience: High-temperature disaster avoidance space points of interest (POIs) and medical facility POIs were extracted from Amap (Gaode Map V15). The data underwent cleaning, filtering, and coordinate transformation, resulting in 3666 high-temperature disaster shelter points within the study area. Kernel density calculations were performed in ArcGIS at the unit grid scale. A total of 1513 medical facility points were identified (205 hospitals, 79 clinics, and 1229 health stations). Considering the varying service capacities (ranges) of the different levels of medical facilities, impedance distances were set at 2000 m for general hospitals, 1000 m for clinics, and 300 m for health stations. Buffer analysis in ArcGIS was used to determine the service ranges of each type of medical facility, and the number of accessible medical facilities for residents within each unit grid was calculated. Road network density was computed in ArcGIS as the ratio of road length within a unit grid to the grid area, with road network base data sourced from the OpenStreetMap (OSM) platform (www.openstreetmap.org). Per capita general public budget expenditure data were obtained from statistical bulletins published on the websites of Hangzhou’s districts and streets.
2.4. Second-Order Clustering-Based Spatial Zoning of High-Temperature Disaster Resilience
In this study, Matlab R2023a was utilized to perform the combined SOM-K-means clustering calculations, aiming to detect and identify potential characteristic zones of complex high-temperature disaster resilience factor combinations (Figure 4). The second-order clustering method was applied to identify and partition the spatial patterns of TP, TS, TR, and T. Additionally, the Davies–Bouldin Index (DBI) was employed to determine the optimal number of clusters, while the Silhouette Coefficient was used to validate the clustering results.
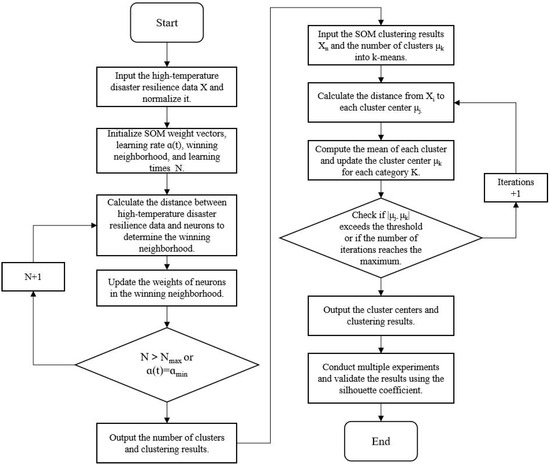
Figure 4.
Flow chart of spatial partitioning of high-temperature disaster resilience based on SOM-K-means.
2.4.1. Phase 1, SOM Clustering
(1) Initialization
Randomly initialize the weight vector of each neuron on the grid and normalize the initial weight (each neuron represents a grid unit). Set the learning rate, number of learning iterations, weights, and neighborhood radius of the SOM network. Obtain:
where is the weight vector of J, J is the output layer node, and m is the number of output neurons.
(2) Sample input
Normalize the four indicators TP, TS, TR, and T, and use them as input layers for SOM to train the neural network. Obtain:
where is the weight vector of p, p is the input layer node, and n is the number of input neurons.
(3) Optimal neuron
Calculate the distance between the and weight vectors, and select the neuron with the closest distance as the optimal neuron.
(4) Winning areas
Adjust the weight size at time t around the winning node, with as the initial domain. converges to a certain value during the algorithm implementation process.
(5) Update weight vector
Determine the nodes that will be included in the winning neighborhood based on its radius, and calculate the amplitude of their respective updates through the neighborhood range.
where is the weight vector of node (i, j), and α (t, N) is the learning rate of the superior domain N.
(6) Iterative training
Update the nodes within the winning neighborhood, complete one iteration (iteration count + 1), and return to the second step until the set iteration count is met.
2.4.2. Phase 2, K-Means Clustering
(1) Second-order transformation
Convert the SOM output layer into a two-dimensional coordinate form as the sample data for K-means clustering, and obtain the dataset .
(2) Initialization
Initialize the number of clusters K, randomly select K data points as initial centroid points, and obtain .
(3) Cluster allocation
Use the Euclidean distance method to calculate the distance between all samples and each cluster center , and divide each sample into the cluster represented by the center closest to it. The formula is as follows:
(4) Update centroid
Calculate the mean of within-class samples and update the cluster centers of k. The formula is as follows:
where is the point set of the j-th cluster, and has a value from 1 to k.
(5) Iterative training
Repeat steps 3 and 4 to iteratively train the centroids of each cluster until the distance between each centroid converges.
(6) Efficiency indicators
Use the Davies–Bouldin Index (DBI) to assist in verifying and selecting the most suitable number of clusters. The range of DBI index values is non-negative, and the smaller the DBI value, the better the clustering effect. The DBI calculation formula is as follows:
where is the number of clusters, is the Euclidean distance from the element in the i-th class to the center of the i-th class, and is the Euclidean distance between the centers of the i-th and j-th classes.
(7) Results validation
To ensure the quality and stability of the clustering results, the SOM-K-means algorithm was executed multiple times with different initializations. The Silhouette Coefficient was employed to validate the clustering outcomes. The obtained Silhouette Coefficient value was 0.56. This metric ranges from −1 to 1, with values closer to 1 indicating well-defined clusters. The result suggests that the clustering achieved a reasonable level of separation and cohesion, demonstrating the robustness of the SOM-K-means approach in this study.
3. Results
3.1. Spatial Differentiation of High-Temperature Disaster Resilience
The calculation and portrait of the 15 indicators in the urban high-temperature disaster resilience assessment model were completed (Figure 5). Based on the calculation formula for TIi (Formula (3)), the values of TP, TS, and TR were computed. Using the natural breaks method (divided into five levels: low, medium-low, medium, medium-high, and high), the portraits of pressure resilience, state resilience, and response resilience were completed, respectively (Figure 6a–c and Figure 7a–c). The portrait obtained is quite similar to the resilient urban zoning groups of Hangzhou, indicating that the experimental results are reliable.
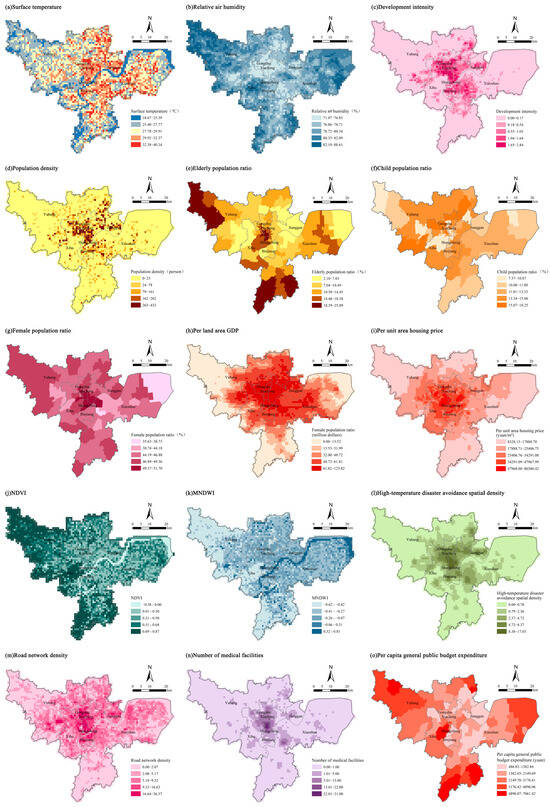
Figure 5.
Portrait of resilience assessment indicators for high-temperature disasters in Hangzhou.
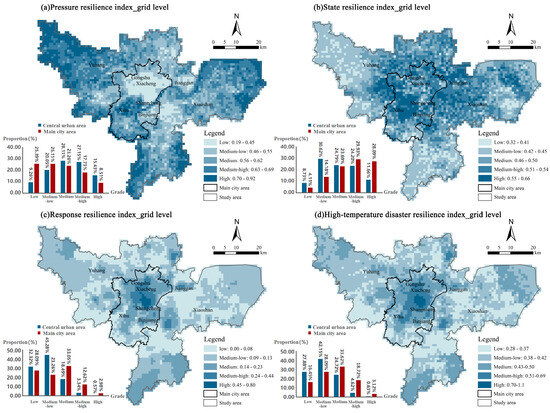
Figure 6.
Spatial distribution pattern of high-temperature disaster resilience in Hangzhou (grid level).
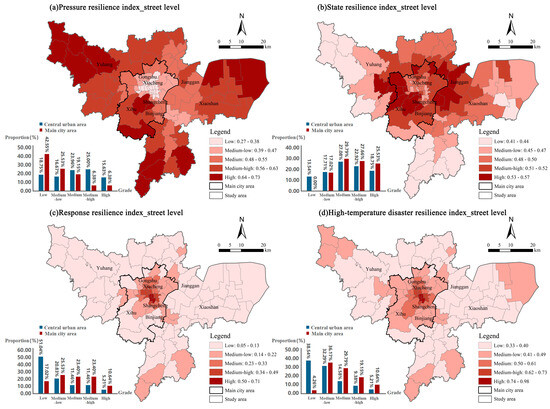
Figure 7.
Spatial distribution pattern of high-temperature disaster resilience in Hangzhou (street/town level).
3.1.1. Pressure Resilience
Overall, the pressure resilience of Hangzhou to high-temperature disasters is at a medium level (with low, medium-low, and medium resilience areas collectively accounting for 57.42% of the total area). The spatial differentiation of pressure resilience is significant, showing a general trend of gradual increase from the center of the main city area outward, with occasional local decreases. High-pressure resilience areas are primarily distributed in the far peripheral zones outside the main city area, mainly in the western and northwestern parts of Yuhang District, the eastern and southern parts of Xiaoshan District, and the southern part of Xihu District. Low-pressure resilience areas exhibit a “one surface, multiple points” distribution pattern, with the main city area (excluding the southern scenic area of Xihu District) being the largest low-pressure resilience zone. Smaller low-pressure resilience areas are distributed in the near-peripheral regions outside the main city area, mainly in the eastern part of Jianggan District, the northeastern and southwestern parts of Yuhang District, and the central and central-southern parts of Xiaoshan District.
3.1.2. State Resilience
Overall, the state resilience of Hangzhou to high-temperature disasters is at a medium level (with low, medium-low, and medium resilience areas collectively accounting for 64.14% of the total area). The spatial differentiation of resilience is significant, showing a general pattern of low resilience in the center of the main city area, gradually increasing outward, and then decreasing again. High-state resilience areas are mainly distributed in the inner and outer peripheral zones of the main city area, forming a concentric ring-like distribution. Low-state resilience areas exhibit a “one core, multiple surfaces” distribution pattern, with the center of the main city area being the low-state resilience zone. Larger low-state resilience areas are distributed in the far peripheral regions outside the main city area, mainly in the western and northwestern parts of Yuhang District, the eastern and southern parts of Xiaoshan District, and the southern part of Xihu District.
3.1.3. Response Resilience
Overall, the response resilience of Hangzhou to high-temperature disasters is relatively low (with low, medium-low, and medium resilience areas collectively accounting for 96.09% of the total area). The spatial differentiation of resilience is significant, showing a general pattern of high resilience in the main city area, radiating outward with a concentric ring-like feature of decreasing and then increasing resilience. High-response resilience areas exhibit a “one core, multiple points” distribution pattern, with the highest resilience in the main city area and smaller high-response resilience areas distributed in the near-peripheral regions outside the main city area, mainly including the eastern part of Jianggan District, the northeastern and southwestern parts of Yuhang District, and the central and central-southern parts of Xiaoshan District. Low response resilience areas form a “necklace-like” distribution in the near-peripheral zones outside the main city area.
3.1.4. High-Temperature Disaster Resilience
Finally, the T-value calculation was completed, and the natural breaks method (divided into five levels: low, medium-low, medium, medium-high, and high) was used to create a spatial differentiation portrait of high-temperature disaster resilience (Figure 6d and Figure 7d). Overall, Hangzhou exhibits a relatively low level of high-temperature disaster resilience (with low, medium-low, and medium resilience areas collectively accounting for 94.75% of the total area). The spatial differentiation is significant, showing a general pattern where high-resilience areas radiate outward from the main city area and decrease in resilience, with a slight increase in resilience in the far peripheral areas outside the main city area. High-resilience areas for high-temperature disasters (high and medium-high resilience areas account for only 5.25%) display a “one core, multiple points” pattern, with the highest resilience in the central part of the main city area and relatively small high-resilience areas distributed in the near-peripheral built-up areas (clusters) such as the eastern part of Jianggan District, the northeastern part of Yuhang District, and the central part of Xiaoshan District. Low-resilience areas for high-temperature disasters (low and medium-low resilience areas account for 70.03%) are mainly distributed in non-built-up areas in the near and far peripheral zones outside the main city area, showing a “scattered” distribution. Medium-resilience areas for high-temperature disasters account for 24.72% of the total area and are primarily located in the far peripheral regions outside the main city area. At the street (town) level, there are 5 high-resilience streets (accounting for 5.2% of the total streets), 9 medium-high resilience streets (9.4%), and 14 medium-resilience streets (14.6%), all located within the main city area. There are 31 medium-low resilience streets (towns) (33.3%) and 37 low-resilience streets (towns) (38.5%). Apart from a few streets with medium-low or higher resilience in Gongshu District, Xihu District, Jianggan District, and Binjiang District within the main city area, the rest are distributed in Yuhang District and Xiaoshan District. In terms of spatial distribution, high-resilience streets for high-temperature disasters are concentrated in the main city area, with resilience levels gradually decreasing outward and slightly increasing in the far peripheral areas outside the main city area.
3.2. Spatial Zoning of High-Temperature Disaster Resilience
In the clustering partitions calculated by SOM-K-means, the DBI value of the four-partition scheme is positive and the smallest, indicating that the spatial distribution of each partition demonstrates strong aggregation. Simultaneously matching one overall objective and three criteria structures of the high-temperature resilience assessment indicator system, the four-zone scheme was ultimately selected to complete the spatial zoning of high-temperature disaster resilience (Figure 8). Specifically, the four types of high-temperature disaster resilience spatial partitions are determined based on the high (H) and low (L) combinations of pressure resilience (criterion), state resilience (criterion), response resilience (criterion), and high-temperature disaster resilience (goal), namely H-L-L-L, L-L-L-L, L-H-L-L, and H-H-L-L, as the foundation for analyzing resilience enhancement strategies.
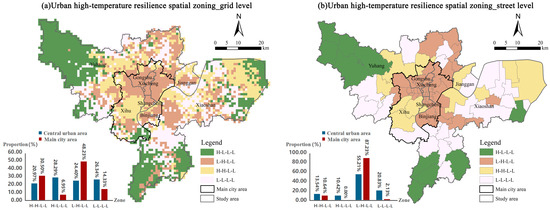
Figure 8.
Spatial zoning of high-temperature disaster resilience in Hangzhou.
The H-L-L-L zone accounts for 28.29% of the total area and is primarily distributed in the far peripheral areas of the main city area, such as the western and northwestern parts of Yuhang District and the eastern and southern parts of Xiaoshan District. Within this zone, urban–rural construction land and non-construction land (mainly forest land as well as cultivated land, garden land, wetlands, etc.) are intermixed, with non-construction land dominating. Administratively, towns and villages constitute the main part of this zone. The low resilience of this zone to high-temperature disasters is primarily attributed to low state resilience and low response resilience. The L-L-L-L zone accounts for 26.34% of the total area and is primarily distributed in the relatively far peripheral urban–rural transitional areas of the main city area, such as the northern and western parts of Yuhang District, the central-southern and central-eastern parts of Xiaoshan District, and the eastern part of Jianggan District. A small portion is also distributed in the urban–rural transitional areas of the southern part of Xihu District. Within this zone, urban–rural construction land and non-construction land (mainly cultivated land as well as garden land, wetlands, lakes, etc.) are intermixed. Administratively, towns and streets, as well as villages and communities, coexist. The mixed development characteristics and corresponding construction standards in the urban–rural transitional areas result in low levels of pressure resilience, state resilience, and response resilience, collectively contributing to the low resilience of this zone to high-temperature disasters. The L-H-L-L zone accounts for 24.40% of the total area and is primarily distributed in the main city area and its near-peripheral areas, such as the eastern part of Jianggan District, the northern and western parts of Yuhang District, and the central part of Xiaoshan District. This zone mainly encompasses the built-up areas of Hangzhou (the main city area and its surrounding contiguous built-up areas), characterized by high development intensity and complete facility support. The low resilience of this zone to high-temperature disasters is primarily determined by low pressure resilience and low response resilience. The H-H-L-L zone accounts for 20.97% of the total area and is primarily distributed in the central-western part of Xihu District in the main city area as well as in the ring-shaped areas of Yuhang District, Xiaoshan District, and Jianggan District that are close to the main city area. These areas are essentially located at the edges of the main urban built-up areas or the contiguous built-up areas of the outer urban districts. These spaces have not yet been fully developed, with some undeveloped land as well as forest land, cultivated land, garden land, etc., interspersed within them, resulting in incomplete facility support. The low resilience of this zone to high-temperature disasters is primarily determined by low response resilience.
4. Discussion
Compared with previous studies, this study adopts a novel approach by investigating high-temperature disasters through the lens of urban resilience, whereas the existing literature predominantly emphasizes the risks and vulnerabilities associated with such disasters. For instance, Salvatore et al. conducted a comprehensive investigation into the spatial distribution patterns of urban heat island effects and high-temperature-related risks, adopting a climate justice perspective [63]. In this study, a high-temperature disaster resilience assessment model was constructed based on the PSR framework, enabling a quantitative analysis of urban high-temperature resilience. Furthermore, an innovative second-order clustering methodology integrating SOM and K-means neural network algorithms was developed to systematically investigate the spatial differentiation patterns of high-temperature disaster resilience. The proposed methodologies offer several distinct advantages: (1) The high-temperature disaster resilience assessment model integrates urban resilience characteristics with the PSR model, decomposing the urban resilience process to quickly identify weak links in urban resilience. (2) The integrated SOM-K-means clustering approach capitalizes on the complementary strengths of both algorithms, facilitating efficient dimensionality reduction of complex high-dimensional datasets. This innovative methodology not only enables the quantitative characterization of spatial differentiation features across various regions but also supports rapid clustering analysis, thereby facilitating in-depth investigation of the spatial correlations in resilience patterns across different zones.
4.1. Enhancement Strategy
Using the mixed research methodology in conjunction with Hangzhou’s urban construction characteristics and the quantitative data presented in Figure 6, Figure 7 and Figure 8, four targeted strategies for enhancing high-temperature disaster resilience across different zones were developed.
4.1.1. H-L-L-L Zone
This region, characterized by its mountainous forests, farmland, abundant vegetation, and superior natural resources, is located far from urban built-up areas and has minimal human activity. As a result, it exhibits resilience spatial features dominated by high-pressure resilience. The area provides essential ecological products to the city and is less likely to experience high-temperature disasters. Therefore, it primarily relies on the natural system’s self-cooling capacity while emphasizing the enhancement of post-disaster recovery capabilities. Strategies for this region focus on maintaining pressure resilience and improving state and response resilience. Examples include the northwestern part of Yuhang District and the eastern and southern parts of Xiaoshan District.
(1) Maintaining pressure resilience: Implement rational control over construction land expansion, preserve the mountainous ecological space foundation (primarily woodland with integrated production spaces) within the zoning, and establish essential thresholds to sustain and reinforce pressure resilience levels.
(2) Enhancing state resilience: It can be observed that a high proportion of elderly and female populations, coupled with low per-land-area GDP and low housing prices, are factors contributing to the relatively low state resilience of this zone. Due to the complex underlying causes of local demographic and economic conditions, targeted strategies will not be discussed here. Additionally, it is important to actively leverage opportunities such as rural land consolidation and ecological restoration to optimize the spatial patterns of ecological and productive areas, thereby enhancing the state resilience of the zone.
(3) Enhancing response resilience: The limited response resilience capacity in this area primarily stems from insufficient high-temperature disaster avoidance spaces, inadequate road networks, and limited medical facilities. This challenge can be addressed through two primary approaches: First, based on the standards for urban living circles and future rural development, and in accordance with the construction and configuration standards for 5 min village (neighborhood) living circles, 15 min town (community) living circles, and 30 min town–village (town area) living circles, it is essential to adhere to the principle of town-level coordination and village-level implementation. This involves reasonably supplementing or improving the establishment of health clinics and health stations in villages and towns as well as enhancing public service facilities such as village neighborhood centers, town service centers, and childcare and elderly care services. These facilities should provide or integrate high-temperature disaster response services, thereby strengthening the response resilience of this type of zone. It is particularly important to note that, given the predominantly rural cluster-based settlement pattern in this zone, characterized by low population density and relatively underdeveloped road networks, localized high-temperature disaster response facilities need to be prioritized. Second, it is necessary to reasonably and moderately optimize the road network system to enhance its connectivity with external areas, thereby further improving the ability of rural areas to access high-temperature disaster mitigation services from neighboring regions.
4.1.2. L-H-L-L Zone
This region is primarily located within the main city area, where urban construction and supporting facilities are well developed. However, its natural conditions for coping with high-temperature disasters are relatively poor. Urbanization has led to an increase in the proportion of impervious surfaces, while high-density buildings and urban roads absorb substantial solar radiation during the day, acting as heat storage bodies. At night, this heat cannot be effectively dissipated, significantly increasing the likelihood of urban heat island effects. The emergency response and recovery capabilities following high-temperature disasters are insufficient to compensate for this inherent vulnerability. Therefore, this region should place greater emphasis on improving the efficiency of disaster response. Strategies should focus on enhancing pressure and response resilience while maintaining state resilience.
(1) Enhancing pressure resilience: The zoned land is nearing saturation in terms of development. Within the high-density urban built environment, it is essential to actively seize opportunities such as “urban dual repair” (ecological restoration and urban renovation) to reasonably increase green spaces [52] with cooling effects, including green roofs [64]. This approach aims to enhance urban “cool islands” to counteract urban “heat islands”, thereby improving the stress resilience of the zone. High-rise buildings can obstruct nocturnal longwave radiation and convective heat dissipation. Therefore, during the maintenance and renewal of urban high-rise structures, the application of eco-friendly materials and low-carbon technologies should be prioritized.
(2) Maintaining state resilience: Similarly, disregarding the complex demographic and economic factors within the zone, it is crucial to strictly preserve the existing quantity and spatial configuration of green (NDVI) and blue (MNDWI) “cool islands” in the zone. This will help maintain and consolidate the state resilience of the area. Additionally, leveraging “urban dual repair” initiatives to increase urban “cool islands” is recommended.
(3) Enhancing response resilience: Despite relatively low per capita general public budget expenditure, the zoning maintains superior infrastructure for high-temperature disaster mitigation, including high-temperature disaster avoidance spaces, road networks, and medical facilities, compared with other Hangzhou areas. Two strategic approaches can be implemented to enhance response resilience: First, from the perspective of urban management and operations, enhance the construction of high-temperature disaster early warning and response systems to prevent or mitigate the occurrence of such disasters. Second, scientifically and rationally increase the supply of high-temperature disaster avoidance spaces, road networks, and medical facilities to improve Hangzhou’s capacity to respond to high-temperature disasters and enhance the “response” capability of the disaster relief infrastructure.
4.1.3. H-H-L-L Zone
This region is primarily located on the fringe of the main city area and has not yet undergone comprehensive development. The land use pattern is characterized by a mix of developed and undeveloped areas with incomplete infrastructure, resulting in resilience spatial features dominated by low response resilience. This area serves as a flexible space for future development while also needing to prevent the disorderly expansion of built-up areas. Therefore, strategies should focus on maintaining pressure and state resilience while enhancing response resilience. Examples include parts of Yuhang District, Xiaoshan District, and Jianggan District.
(1) Maintaining pressure resilience: Zoned land faces intense development pressure, and it is often inevitable that such areas will be developed and constructed. Therefore, it is advisable to reasonably guide the renovation of existing buildings, incorporate “green roofs” in new construction, and appropriately reduce development intensity. These measures can offset and mitigate the “warming” effects induced by urbanization in the zoned areas, thereby maintaining their stress resilience.
(2) Maintaining state resilience: Disregarding the complex influences of demographic and economic factors within the zone on state resilience, it is crucial to strictly protect the scale and structure of ecological green corridors (green wedges) and large suburban parks as determined by the “Hangzhou Urban Master Plan (Territorial Space Master Plan)” and the “Urban Green Space System Special Plan”. These areas serve as “cool islands”. Additionally, ensuring reasonable green space allocation in urban expansion areas and optimizing green space provision in existing urban areas will further secure the state resilience of the zone.
(3) Enhancing response resilience: The low level of response resilience in this zone is primarily due to inadequate high-temperature disaster avoidance spaces, road networks, and medical facilities, which are typical manifestations of the “edge attenuation” phenomenon in the peripheries of urban built-up areas. To enhance the zone’s response resilience, two approaches can be adopted: firstly, improving the local infrastructure for high-temperature disaster avoidance spaces, road networks, and medical facilities; and secondly, enhancing the capacity to access high-temperature disaster prevention and mitigation services from adjacent urban built-up areas such as by optimizing the relevant road networks. These measures will ultimately improve the zone’s resilience to high-temperature disasters.
4.1.4. L-L-L-L Zone
This region is situated in the relatively remote urban–rural fringe of the main city area, predominantly characterized by rural spatial forms. It suffers from poor natural conditions, urban development, infrastructure, and policy support, resulting in low resilience across all dimensions. Therefore, strategies should focus on enhancing pressure, state, and response resilience. Examples include the northern and western parts of Yuhang District as well as the central-southern and central-eastern areas of Xiaoshan District.
(1) Enhancing pressure resilience: It can be observed that the development intensity of the zone is not high, but the relatively high surface temperatures (with extensive point-like and patchy distributions) reduce the stress resilience of the zone. The widespread distribution of various industrial parks within the zone is the direct cause of this situation. Therefore, for existing buildings in these industrial parks, it is necessary to reasonably guide renovations and the construction of “green roofs” to mitigate the urban heat island effect. For new construction, it is advisable to appropriately reduce the floor area ratio, promote the construction of “green roofs”, and lower surface temperatures, thereby enhancing the stress resilience of the zone.
(2) Enhancing state resilience: Disregarding the complex demographic and economic factors such as the relatively high proportions of children and elderly populations in the zone, it is essential to maintain and leverage opportunities such as land consolidation and ecological restoration to optimize the spatial patterns of production and ecological areas. This will help sustain and improve the state resilience of the zone.
(3) Enhancing response resilience: It is necessary to reasonably increase the number of medical facilities and high-temperature disaster avoidance spaces. Based on the construction and configuration standards for 5 min, 15 min, and 30 min town–village living circles, under the principle of coordination at the subdistrict (town) level and implementation at the community (village) level, public service facilities such as neighborhood (community) centers, health stations (clinics), and services for children’s education and elderly care should be established for communities (villages), streets (towns), and town areas. These facilities should provide or integrate high-temperature disaster response services, thereby enhancing the response resilience of the zone.
4.2. Multi-Domain Application Scenarios
The spatial differentiation results of high-temperature disaster resilience obtained from this study provide a scientific basis for urban planning, climate adaptation policies, disaster management, and public health management. These findings support the development of targeted intervention measures to enhance the overall resilience of cities. In terms of urban planning, the results can assist decision makers in optimizing urban layouts and resource allocation, adjusting functional zoning, and improving transportation networks to strengthen the city’s capacity to respond to high-temperature disasters. For climate adaptation policies, the study contributes to the establishment of region-specific high-temperature early warning systems, enabling differentiated warning strategies for various resilience zones. It also supports the formulation of green building policies and the optimization of water resource management. In the field of disaster management, the findings can help governments and emergency management departments develop efficient disaster response strategies including region-specific high-temperature disaster emergency plans, the rational allocation of emergency resources, and optimized evacuation route planning. Additionally, differentiated community education and training programs can be implemented based on the resilience characteristics of each zone. Regarding public health management, the study aids governments and medical institutions in formulating targeted health protection measures. It facilitates the establishment of region-specific health monitoring systems and the optimization of medical resource allocation, ensuring timely medical services during high-temperature periods.
4.3. Limitations and Future Research Directions
This study has achieved certain reference-worthy results in terms of methodological exploration and case studies; however, there are notable limitations that require attention and will serve as directions for further refinement and in-depth research. First, the method for determining weights needs improvement. The subjective weighting method, AHP, may be influenced by the subjective judgments of scoring experts and the difficulty in assessing the relative importance of numerous indicators, which can affect the weight results. Employing objective weighting methods (such as the entropy weight method) or a combination of subjective and objective weighting methods could further enhance the accuracy of the research findings. Second, the composition of evaluation indicators needs to be refined. Indicators related to vulnerable groups such as populations with low education levels, isolated individuals, and people with disabilities, as well as outdoor workers who are highly exposed to high-temperature environments, were not included in the study. Acquiring or identifying substitute data for these groups could more precisely depict the state resilience of cities facing high-temperature disasters, thereby improving the precision of the research results. Third, the research time series should be expanded. The study was conducted using data from a single year (2020). With access to more data, conducting multi-temporal studies could reveal spatiotemporal trends in urban high-temperature disaster resilience, more accurately analyze resilience enhancement strategies, and further explore the mechanisms of urban high-temperature disaster resilience regulation. Additionally, the impact of high temperatures on the resilience of urban development and its quantitative assessment is a highly significant research topic. Future studies could further explore this subject in greater depth.
5. Conclusions
This study explores the spatial differentiation of urban high-temperature disaster resilience. Based on the Pressure-State-Response (PSR) framework, a high-temperature disaster resilience assessment model was constructed, and 15 indicators across 3 categories were selected to quantitatively evaluate the high-temperature disaster resilience of Hangzhou in 2020. A second-order clustering model combining SOM and K-means was developed to investigate the spatial differentiation characteristics of high-temperature disaster resilience in Hangzhou. The results indicate the following: (1) The overall level of high-temperature disaster resilience in Hangzhou is relatively low. Spatially, it exhibits a radial pattern of decreasing resilience from the main city area outward, with a slight increase at the far edges of the main city area. (2) The study area is divided into four distinct spatial zones of high-temperature disaster resilience, showing clear spatial differentiation characteristics.
Author Contributions
Conceptualization, S.Z. and Y.X.; methodology, S.Z.; software, Y.X. and Y.L.; validation, S.Z. and Y.L.; formal analysis, S.Z.; investigation, Y.X. and Y.L.; resources, S.Z. and H.W.; data curation, Y.X.; writing—original draft preparation, Y.X.; writing—review and editing, S.Z., H.W. and W.W.; visualization, Y.X. and Y.L.; supervision, S.Z.; project administration, S.Z.; funding acquisition, S.Z. All authors have read and agreed to the published version of the manuscript.
Funding
This research was funded by the National Natural Science Foundation of China, grant number 32471930, and the Ministry of Education Humanities and Social Sciences Research Planning Fund Project of China, grant number 24YJAZH177.
Institutional Review Board Statement
Not applicable.
Informed Consent Statement
Not applicable.
Data Availability Statement
The data presented in this study are available on request from the corresponding author.
Acknowledgments
This work was supported by the National Natural Science Foundation of China (32471930) and the Ministry of Education Humanities and Social Sciences Research Planning Fund Project of China (24YJAZH177).
Conflicts of Interest
Author Y.L. was employed by the company Hangzhou Zhituo Space Planning and Design Co., Ltd. The remaining authors declare that the research was conducted in the absence of any commercial or financial relationships that could be construed as a potential conflict of interest.
Abbreviations
The following abbreviations are used in this manuscript:
| PSR | Pressure-State-Response |
| SOM | Self-Organizing Map |
| POI | Point of Interest |
| NDVI | Normalized Difference Vegetation Index |
| MNDWI | Modified Normalized Difference Water Index |
| GDP | Gross Domestic Product |
| AHP | Analytic Hierarchy Process |
| DBI | Davies–Bouldin Index |
References
- WMO. Atlas of Mortality and Economic Losses from Weather, Climate and Water-Related Hazards (1970–2019); World Meteorological Organization: Geneva, Switzerland, 2021; Available online: https://wmo.int/publication-series/atlas-of-mortality-and-economic-losses-from-weather-climate-and-water-related-hazards-1970-2021 (accessed on 18 December 2024).
- Feigin, V.L.; Stark, B.A.; Johnson, C.O.; Roth, G.A.; Bisignano, C.; Abady, G.G.; Abbasifard, M.; Abbasi-Kangevari, M.; Abd-Allah, F.; Abedi, V.; et al. Global, regional, and national burden of stroke and its risk factors, 1990–2019: A systematic analysis for the Global Burden of Disease Study 2019. Lancet Neurol. 2021, 20, 795–820. [Google Scholar] [CrossRef]
- Intergovernmental Panel on Climate Change. Climate Change 2023: Synthesis Report. 2023. Available online: https://www.ipcc.ch/report/ar6/syr/downloads/report/IPCC_AR6_SYR_LongerReport.pdf (accessed on 5 April 2024).
- Cai, W.; Zhang, C.; Zhang, S.; Ai, S.; Bai, Y.; Bao, J.; Chen, B.; Chang, N.; Chen, H.; Cheng, L.; et al. The 2021 China report of the Lancet Countdown on health and climate change: Seizing the window of opportunity. Lancet Public Health 2021, 6, e932–e947. [Google Scholar] [CrossRef]
- Li, X.; Wang, G.; Zaitchik, B.F.; Hsu, A.; Chakraborty, T. Sensitivity and vulnerability to summer heat extremes in major cities of the United States. Environ. Res. Lett. 2024, 19, 94039. [Google Scholar] [CrossRef]
- Akhtar, N.; Jan, I. Climate Change: Rising Security (Non-Traditional) Threat to Pakistan. J. Dev. Soc. Sci. 2023, 4, 991–1004. [Google Scholar] [CrossRef]
- Ruan, J.; Chen, Y.; Yang, Z. Assessment of temporal and spatial progress of urban resilience in Guangzhou under rainstorm scenarios. Int. J. Disaster Risk Reduct. 2021, 66, 102578. [Google Scholar] [CrossRef]
- Semenza, J.C.; Rubin, C.H.; Falter, K.H.; Selanikio, J.D.; Flanders, W.D.; Howe, H.L.; Wilhelm, J.L. Heat-Related Deaths during the July 1995 Heat Wave in Chicago. N. Engl. J. Med. 1996, 335, 84–90. [Google Scholar] [CrossRef]
- Uejio, C.K.; Wilhelmi, O.V.; Golden, J.S.; Mills, D.M.; Gulino, S.P.; Samenow, J.P. Intra-urban societal vulnerability to extreme heat: The role of heat exposure and the built environment, socioeconomics, and neighborhood stability. Heal. Place 2001, 17, 498–507. [Google Scholar] [CrossRef]
- El-Zein, A.; Tonmoy, F.N. Assessment of vulnerability to climate change using a multi-criteria outranking approach with application to heat stress in Sydney. Ecol. Indic. 2015, 48, 207–217. [Google Scholar] [CrossRef]
- Fu, Q.; Zheng, Z.; Sarker, N.I.; Lv, Y. Combating urban heat: Systematic review of urban resilience and adaptation strategies. Heliyon 2024, 10, e37001. [Google Scholar] [CrossRef]
- Holling, C.S. Resilience and Stability of Ecological Systems. Annu. Rev. Ecol. Syst. 1973, 4, 1–23. [Google Scholar] [CrossRef]
- UN-Habitat. An Urbanizing World: Global Report on Human Settlements; Oxford University Press: Oxford, UK, 1996. [Google Scholar]
- The World Bank. World Development Report 2009; The World Bank: Washington, DC, USA, 2008; pp. 73–78. Available online: http://documents.worldbank.org/curated/en/730971468139804495/World-development-report-2009-reshaping-economic-geography (accessed on 18 December 2024).
- United Nations Office for Disaster Risk Reduction. Report of the Open Ended Intergovernmental Working Group on Possible Measures to Improve the Treatment of Nominations to the Representative List by the Committee, Its Subsidiary Body and the Secretariat; United Nations General Assembly: New York, NY, USA, 2016. [Google Scholar]
- Campbell, K.A.; Laurien, F.; Czajkowski, J.; Keating, A.; Hochrainer-Stigler, S.; Montgomery, M. First insights from the Flood Resilience Measurement Tool: A large-scale community flood resilience analysis. Int. J. Disaster Risk Reduct. 2019, 40, 101257. [Google Scholar] [CrossRef]
- Atrachali, M.; Ghafory-Ashtiany, M.; Amini-Hosseini, K.; Arian-Moghaddam, S. Toward quantification of seismic resilience in Iran: Developing an integrated indicator system. Int. J. Disaster Risk Reduct. 2019, 39, 101231. [Google Scholar] [CrossRef]
- Frausto, O.; Vazquez, A.; Arroyo, L.; Castillo, L.; Hernández, M. Hurricane resilience indicators in mexican caribbean coastal cities. Int. J. Saf. Secur. Eng. 2016, 6, 755–763. [Google Scholar] [CrossRef]
- Aubrecht, C.; Özceylan, D. Identification of heat risk patterns in the U.S. National Capital Region by integrating heat stress and related vulnerability. Environ. Int. 2013, 56, 65–77. [Google Scholar] [CrossRef]
- Shan, Z.; An, Y.; Xu, L.; Yuan, M. High-Temperature Disaster Risk Assessment for Urban Communities: A Case Study in Wuhan, China. Int. J. Environ. Res. Public Health 2021, 19, 183. [Google Scholar] [CrossRef]
- Zheng, D.; Huang, X.; Yue, W. The spatiotemporal patterns and regional characteristics of extreme heat disaster risk in China at the county level. J. Clean. Prod. 2024, 474, 143605. [Google Scholar] [CrossRef]
- Rapport, D.J.; Singh, A. An EcoHealth-based framework for State of Environment Reporting. Ecol. Indic. 2006, 6, 409–428. [Google Scholar] [CrossRef]
- Hua, Y.; Yan, M.; Limin, D. Land Ecological Security Assessment for Bai Autonomous Prefecture of Dali Based Using PSR Model--with Data in 2009 as Case. Energy Procedia 2011, 5, 2172–2177. [Google Scholar] [CrossRef]
- Wu, J.; Wang, X.; Zhong, B.; Yang, A.; Jue, K.; Wu, J.; Zhang, L.; Xu, W.; Wu, S.; Zhang, N.; et al. Ecological environment assessment for Greater Mekong Subregion based on Pressure-State-Response framework by remote sensing. Ecol. Indic. 2020, 117, 106521. [Google Scholar] [CrossRef]
- Zhang, Y.; Zang, P.; Guo, H.; Yang, G. Wetlands ecological security assessment in lower reaches of Taoerhe river connected with Nenjiang river using modified PSR model. HydroResearch 2023, 6, 156–165. [Google Scholar] [CrossRef]
- Su, Y.; Li, W.; Liu, L.; Hu, W.; Li, J.; Sun, X.; Li, Y. Health assessment of small-to-medium sized rivers: Comparison between comprehensive indicator method and biological monitoring method. Ecol. Indic. 2021, 126, 107686. [Google Scholar] [CrossRef]
- Li, W.; Qi, J.; Huang, S.; Fu, W.; Zhong, L.; He, B.-J. A pressure-state-response framework for the sustainability analysis of water national parks in China. Ecol. Indic. 2021, 131, 108127. [Google Scholar] [CrossRef]
- Tu, J.; Wan, M.; Chen, Y.; Tan, L.; Wang, J. Biodiversity assessment in the near-shore waters of Tianjin city, China based on the Pressure-State-Response (PSR) method. Mar. Pollut. Bull. 2022, 184, 114123. [Google Scholar] [CrossRef]
- Fan, Y.; Fang, C. Evolution process and obstacle factors of ecological security in western China, a case study of Qinghai province. Ecol. Indic. 2020, 117, 106659. [Google Scholar] [CrossRef]
- Yuan, D.; Xue, H.; Du, M.; Pang, Y.; Wang, J.; Wang, C.; Song, X.; Wang, S.; Kou, Y. Urban waterlogging resilience assessment based on combination weight and cloud model: A case study of Haikou. Environ. Impact Assess. Rev. 2025, 111, 107728. [Google Scholar] [CrossRef]
- Chen, L.; Guo, H.; Gong, P.; Yang, Y.; Zuo, Z.; Gu, M. Landslide susceptibility assessment using weights-of-evidence model and cluster analysis along the highways in the Hubei section of the Three Gorges Reservoir Area. Comput. Geosci. 2021, 156, 104899. [Google Scholar] [CrossRef]
- Zhang, Y.; Shang, K. Cloud model assessment of urban flood resilience based on PSR model and game theory. Int. J. Disaster Risk Reduct. 2023, 97, 104050. [Google Scholar] [CrossRef]
- Song, S.; Yu, H.; Zhang, Q.; Zhang, L.; Zhong, Q.; Zhang, G. Functional regionalization of land resources considering eco-efficiency in Nanjing Metropolitan Area, China. Ecol. Indic. 2023, 155, 110964. [Google Scholar] [CrossRef]
- Xia, H.; Yuan, S.; Prishchepov, A.V. Spatial-temporal heterogeneity of ecosystem service interactions and their social-ecological drivers: Implications for spatial planning and management. Resour. Conserv. Recycl. 2023, 189, 106767. [Google Scholar] [CrossRef]
- Liu, H.; Chen, N.; Wang, X. Exploring spatial patterns of sustainability and resilience of metropolitan areas in the US using self-organizing maps. Cities 2024, 155, 105414. [Google Scholar] [CrossRef]
- Brentan, B.; Meirelles, G.; Luvizotto, E.; Izquierdo, J. Hybrid SOM+k-Means clustering to improve planning, operation and management in water distribution systems. Environ. Model. Softw. 2018, 106, 77–88. [Google Scholar] [CrossRef]
- Lawrimore, M.A.; Sanchez, G.M.; Cothron, C.; Tulbure, M.G.; BenDor, T.K.; Meentemeyer, R.K. Creating spatially complete zoning maps using machine learning. Comput. Environ. Urban Syst. 2024, 112, 102157. [Google Scholar] [CrossRef]
- Sützl, B.S.; Strebel, D.A.; Rubin, A.; Wen, J.; Carmeliet, J. Urban morphology clustering analysis to identify heat-prone neighbourhoods in cities. Sustain. Cities Soc. 2024, 107, 105360. [Google Scholar] [CrossRef]
- Dong, X.; Yang, R.; Ye, Y.; Yi, S.; Haase, D.; Lausch, A. Planning for green infrastructure by integrating multi-driver: Ranking priority based on accessibility equity. Sustain. Cities Soc. 2024, 114, 105767. [Google Scholar] [CrossRef]
- Zeng, P.; Sun, F.; Liu, Y.; Wang, Y.; Li, G.; Che, Y. Mapping future droughts under global warming across China: A combined multi-timescale meteorological drought index and SOM-Kmeans approach. Weather. Clim. Extremes 2021, 31, 100304. [Google Scholar] [CrossRef]
- Xia, S.; Yang, Y. Examining spatio-temporal variations in carbon budget and carbon compensation zoning in Beijing-Tianjin-Hebei urban agglomeration based on major functional zones. J. Geogr. Sci. 2022, 32, 1911–1934. [Google Scholar] [CrossRef]
- Yang, X.; Jia, C.; Yang, F.; Yang, H.; Yao, Y. Spatio-temporal variation of groundwater pollution in urban wetlands and management strategies for zoning. J. Environ. Manag. 2023, 342, 118318. [Google Scholar] [CrossRef]
- Cao, J.; Zhou, W.; Zheng, Z.; Ren, T.; Wang, W. Within-city spatial and temporal heterogeneity of air temperature and its relationship with land surface temperature. Landsc. Urban Plan 2021, 206, 103979. [Google Scholar] [CrossRef]
- Li, K.; Yang, H.; Chen, Q.; Chen, T.; Shen, R. Analysis of Urban Thermal Environment Evolution and Mechanisms Based on Multisource Data: A Case Study of Hangzhou, China. J. Urban Plan. Dev. 2024, 150, 5024026. [Google Scholar] [CrossRef]
- Huang, X.; Li, L.; Yan, X.; Ji, W.; Zhao, K.; Zhao, X. Assessment of heat exposure risk for urban populations and spatio-temporal patterns: A perspective of urban functional zones in Xi’an, China. Urban Clim. 2024, 55, 101992. [Google Scholar] [CrossRef]
- Park, K.; Baik, J.-J.; Jin, H.-G.; Tabassum, A. Changes in urban heat island intensity with background temperature and humidity and their associations with near-surface thermodynamic processes. Urban Clim. 2024, 58, 102191. [Google Scholar] [CrossRef]
- Savić, S.; Marković, V.; Šećerov, I.; Pavić, D.; Arsenović, D.; Milošević, D.; Dolinaj, D.; Nagy, I.; Pantelić, M. Heat wave risk assessment and mapping in urban areas: Case study for a midsized Central European city, Novi Sad (Serbia). Nat. Hazards 2018, 91, 891–911. [Google Scholar] [CrossRef]
- Campbell, S.; Remenyi, T.A.; White, C.J.; Johnston, F.H. Heatwave and health impact research: A global review. Heal. Place 2018, 53, 210–218. [Google Scholar] [CrossRef] [PubMed]
- Ballester, J.; Quijal-Zamorano, M.; Turrubiates, R.F.M.; Pegenaute, F.; Herrmann, F.R.; Robine, J.M.; Basagaña, X.; Tonne, C.; Antó, J.M.; Achebak, H. Heat-related mortality in Europe during the summer of 2022. Nat. Med. 2023, 29, 1857–1866. [Google Scholar] [CrossRef] [PubMed]
- Wu, H.; Xu, Y.; Zhang, M.; Su, L.; Wang, Y.; Zhu, S. Spatially explicit assessment of the heat-related health risk in the Yangtze River Delta, China, using multisource remote sensing and socioeconomic data. Sustain. Cities Soc. 2024, 104, 105300. [Google Scholar] [CrossRef]
- Harlan, S.L.; Brazel, A.J.; Prashad, L.; Stefanov, W.L.; Larsen, L. Neighborhood microclimates and vulnerability to heat stress. Soc. Sci. Med. 2006, 63, 2847–2863. [Google Scholar] [CrossRef]
- Norton, B.A.; Coutts, A.M.; Livesley, S.J.; Harris, R.J.; Hunter, A.M.; Williams, N.S.G. Planning for cooler cities: A framework to prioritise green infrastructure to mitigate high temperatures in urban landscapes. Landsc. Urban Plan. 2015, 134, 127–138. [Google Scholar] [CrossRef]
- Gunawardena, K.R.; Wells, M.J.; Kershaw, T. Utilising green and bluespace to mitigate urban heat island intensity. Sci. Total Environ. 2017, 584–585, 1040–1055. [Google Scholar] [CrossRef]
- Huang, H.; Ma, J.; Yang, Y. Spatial heterogeneity of driving factors for urban heat health risk in Chongqing, China: A new identification method and proposal of planning response framework. Ecol. Indic. 2023, 153, 110449. [Google Scholar] [CrossRef]
- Huang, X.; Qi, M.; Zhao, K.; Zheng, D.; Liu, M. Assessment of population vulnerability to heat stress and spatial differentiation in Xi’an. Geogr. Res. 2021, 40, 1684–1700. [Google Scholar] [CrossRef]
- Li, M.; Xu, J.; Li, J.; Liu, X.; Ru, H.; Sun, C. A model for phased evacuations for disasters with spatio-temporal randomness. Int. J. Geogr. Inf. Sci. 2019, 33, 922–944. [Google Scholar] [CrossRef]
- Saguansap, P.; Saguansap, V.; Mruksirisuk, P.; Thanvisitthpon, N.T. Assessment of urban heat Island vulnerability using sustainability-focused framework: A case study of Thailand’s Bangkok Metropolis. Curr. Res. Environ. Sustain. 2024, 8, 100262. [Google Scholar] [CrossRef]
- Li, Z.; Fu, D.; Wang, J.; Min, K.; Zhang, J. Urban resilience assessment model for waterlogging disasters and its application. J. Tsinghua Univ. 2022, 62, 266–276. [Google Scholar] [CrossRef]
- Qasim, S.; Qasim, M.; Shrestha, R.P.; Khan, A.N.; Tun, K.; Ashraf, M. Community resilience to flood hazards in Khyber Pukhthunkhwa province of Pakistan. Int. J. Disaster Risk Reduct. 2016, 18, 100–106. [Google Scholar] [CrossRef]
- Ma, L.; Luo, J. An Exploration of the study Method of Urban Geography Based Grid Computing. Trop. Geogr. 2007, 27, 25–28. [Google Scholar]
- Chen, W.; Liu, X.; Zeng, S.; Zhang, H.; Mao, Z. Research on the correlation betweenland cover and climatic status basedon Google Earth Engine. Bull. Surv. Mapp. 2021, 99–104. [Google Scholar] [CrossRef]
- Artis, D.A.; Carnahan, W.H. Survey of emissivity variability in thermography of urban areas. Remote Sens. Environ. 1982, 12, 313–329. [Google Scholar] [CrossRef]
- Pappalardo, S.E.; Zanetti, C.; Todeschi, V. Mapping urban heat islands and heat-related risk during heat waves from a climate justice perspective: A case study in the municipality of Padua (Italy) for inclusive adaptation policies. Landsc. Urban Plan. 2023, 238, 104831. [Google Scholar] [CrossRef]
- Santamouris, M. Cooling the cities–A review of reflective and green roof mitigation technologies to fight heat island and improve comfort in urban environments. Sol. Energy 2014, 103, 682–703. [Google Scholar] [CrossRef]
Disclaimer/Publisher’s Note: The statements, opinions and data contained in all publications are solely those of the individual author(s) and contributor(s) and not of MDPI and/or the editor(s). MDPI and/or the editor(s) disclaim responsibility for any injury to people or property resulting from any ideas, methods, instructions or products referred to in the content. |
© 2025 by the authors. Licensee MDPI, Basel, Switzerland. This article is an open access article distributed under the terms and conditions of the Creative Commons Attribution (CC BY) license (https://creativecommons.org/licenses/by/4.0/).