1. Introduction
The liberalization of the electricity market and the development of renewable energy technologies have enabled the rise of independent generation companies (GENCOs). In a restructured power system, GENCOs can participate and bid in both energy and ancillary services markets (ASM), such as regulation market, spinning reserve market (SRM), and others.
GENCOs are typically private companies managing portfolios that include one or more power plants. Nowadays, renewable energy sources are the most common types of generation facilities owned by GENCOs, with photovoltaic power stations (PVPSs), wind power stations (WPSs), as well as gas and biomass thermal power plants (TPPs) being the most prevalent. A GENCO’s investment policy and optimal operational strategy are heavily influenced by the regulatory framework established by the system operator to whom it offers services, as well as prevailing market trends. Investing in an energy storage system (ESS) in addition to participation in energy and ASM markets mitigates fluctuations associated with variable renewable energy sources (VRES), contributing to environmental sustainability and reducing carbon emissions. In recent years, there has been significant development in utility-scale battery storage systems (BSS), with lithium-ion, sodium-sulphur, lead-acid, and flow batteries as the most widely utilized technologies. The fast response and geographical independence of BSS enable a wide range of applications, ranging from power system stability enhancement and short-term power quality improvement to long-term energy management [
1]. However, pumped storage hydropower plants (PSHP) are still the prevailing storage technology, accounting for over 90% of the world’s installed storage capacity and stored energy available for power network demands [
2].
Numerous studies examine the joint operation of various generation facilities (especially PVPS or WPS) with various types of grid-scale storage. In [
3,
4,
5,
6,
7,
8,
9], the combined operation of ESS with WPS was observed in various markets and under different conditions. In [
3], the authors developed a deterministic mixed integer convex program model to optimize the operation of power plants in the day ahead market (DAM) and reserve market, considering various uncertainty parameters. The authors concluded that joint operation of the WPS and ESS may not be economically viable, but it remains economically feasible in the regulation market. In [
4], the authors proposed a model that optimizes the operation mode of the electric power system to maximize the profit of the system in the spot market. Additionally, the optimal size of ESS was obtained considering the reduction in wind generation and economic losses resulting from wind forecast errors. The results showed that the ESS effectively mitigates wind curtailment and reduces the adverse impact of wind forecast errors. In [
5], a model was developed to maximize the profit of a GENCO that participates in the DAM and ASM while accounting for the uncertainty in WPS production. The authors concluded that the joint operation of the WPS and PSHP reduced the uncertainty in WPS production and increased the GENCO’s profitability. In [
6], the developed model ensures a constant energy supply from a WPS and PSHP system. The model is suitable for system operators in deciding between minimizing the energy fluctuations of the power system and decreasing the abandoned rate. The results showed that the obtained system operation strategy can maintain reliable production, increase output power stability, and reduce abandoned rate. In [
7], the authors propose the market-based participation of an ESS to support large-scale renewable energy penetration. The results of the optimization problem show that the PSHPs can play a significant role in increasing the penetration of renewable energy for the procurement of energy and spinning reserve. In [
8,
9], the authors developed a model that maximizes the total profit of a GENCO, providing the optimal bidding strategy for a system consisting of the WPS and an air-based high-temperature heat and power storage (HTHPS). The results indicated that such a system combination is profitable in DAM, with profitability varying according to the different configurations of the HTHPS system.
In [
10,
11], the efficiency of energy storage operation with a TPP was proven, while in [
12,
13,
14,
15,
16] the authors dealt with GENCOs that, in addition to TPP and ESS, also own WPS. In [
12], a stochastic model was developed to optimize the daily profit of the aforementioned power system in the spot and regulation markets. In [
13], the authors proposed a model that optimizes the operation mode of a power system, simultaneously minimizing TPP emissions and maximizing the profit in the DAM and SRM. The results showed the SRM is more profitable for ESS, as well as for the entire GENCO. In [
14], a model was developed to maximize GENCO’s profit over a one-week period from the DAM and ASM (SRM and regulation market), while in [
15], a model maximizes GENCO’s profit over one day from the DAM and spinning reserve market. Additionally, CO
2 emission reduction and wind power uncertainty are considered. The results showed that the maximum power of the WPS and PSHP, along with the price of CO
2 emissions, significantly influence the optimal bidding strategy of the system. In [
16], a stochastic based method for the optimal bidding strategy of a GENCO participating in the DAM and spinning reserve markets is proposed. The considered ESS type is compressed air energy storage (CAES). The results indicated that CAES can generate higher profits in the energy and reserve markets due to their high ramp rates.
In [
17], the joint operation of a WPS, PVPS, PSHP, and a BSS in the DAM and ASM was observed over a one-day period. To model uncertainties related to WPS and PVPS production, as well as market prices, an autoregressive moving average model was used, and scenarios were generated using the Weibull distribution function. The results show that the joint operation of these power plants increases the system’s profitability and reduces risk compared to their uncoordinated operation.
In addition to deciding the optimal operation and bidding strategy, determining the optimal size of the ESS aligned with GENCO’s needs is significant for its market success and directly impacts technical and economic sustainability, reducing the risk of undelivered energy and enabling more efficient utilization of VRES and thereby contributing to the reduction of greenhouse gas emissions. An oversized ESS may result in excessive investment, as well as increased operation and maintenance (O&M) costs, while an undersized ESS may fail to fully leverage the potential of the existing generation portfolio. The purpose of the ESS significantly influences its size. The sizing criteria and sizing techniques for dimensioning utility-scale energy storage are significantly different from those used for sizing energy storage in small distributed renewable energy systems or microgrids operating in islanded mode [
1,
18]. Utility-scale ESS or grid-scale ESS is a large energy storage system designed to enable arbitrage in the power system, provide ancillary services, compensate for errors in forecasting the VRES production, perform peak shaving, decrease penalties for non-delivery bided energy, and mitigate renewable energy curtailment, among other functions. Several criteria concerning steady-state operation (with time horizons greater than 1 min) have been applied for sizing utility-scale ESSs in numerous studies. In [
19], a stochastic model for optimal sizing of ESS considers the fluctuation of wind production. The objective function aims to minimize the expected generation fuel costs plus ESS amortized daily capital cost. Key factors that affect the system cost-benefit are ESS amortized daily capital cost, charging/discharging efficiency, and lifetime. The influence of energy and ancillary services price fluctuations on the profitability of investment and payback period in ESS was shown in [
20]. In [
21], the optimal ESS management and sizing problem, considering the production from renewable energy sources and consumed energy from the grid, was addressed. The results showed that the marginal value of storage decreases with storage size and therefore the optimal size under the optimal management policy can be computed efficiently. Furthermore, energy storage can provide significant value and savings by integrating renewable energy and reducing reliance on grid-supplied electricity. In [
22], the impact of ESS capacity on power system reliability and congestion relief under N-1 contingency criteria were analyzed. The optimal ESS size is determined through a trade-off between investment cost and improvements in reliability metrics. In [
23], the optimal sizing of an ESS in large-scale power systems to minimize total investment costs while mitigating renewable energy curtailment, considering the network power flow, was investigated. In [
24], the authors presented the optimization problem of investing in an ESS (PSHP and hydrogen storage plant) for 30 years. A hydrogen storage plant uses electrolysis and fuel cells for the power-to-power process. A cost-benefit analysis of independent energy storage that performs energy arbitrage in market conditions was made. The results show that the PSHP is profitable under the observed conditions, while the hydrogen storage plant is not profitable without additional support. The sizing method for an integrated generation system (hydropower plant, PVPS, and PSHP), proposed in [
25], considers PVPS generation uncertainty, spot price volatility, and the deviation between day-ahead and real-time load. The authors of [
26] investigated a range of policies to reduce emissions and investment in renewable generation and BSS. The results show that, despite the decreasing price of BSS, a significant subsidy is still required to justify the investment in BSS. Additionally, modest investments in BSS can yield considerable benefits in terms of reducing system costs and CO
2 emissions. In [
27], the economic evaluation of integrating an ESS (CAES and BSSs) with a combined cycle power plant in a price taker GENCO was examined. It introduces a method for determining optimal storage technology options and capacities through a stochastic price-based unit and storage commitment model. The approach identifies the optimal participation of the power plant and ESS in DAM, spinning reserve markets, and bilateral contracts. In [
28], a stochastic model to determine the optimal sizes of gas turbines, natural gas storage, WPS, and BSS in a GENCO was proposed. The model aims to maximize the GENCO’s profit in electricity and natural gas markets while managing risks from market uncertainties and wind power generation. Technical constraints of the power transmission system, natural gas pipeline, and uncertainties in market prices and pipeline deliverability are incorporated.
This paper deals with the sizing of a utility-scale ESS suitable for a GENCO operating in a liberalized power system with possible penalties for undelivered energy. GENCO’s portfolio may include both renewable and non-renewable energy sources. The proposed method for calculating the optimal storage size, based on the daily optimization of GENCO operation, considers several stochastic phenomena such as uncertainty in the production of renewable energy sources (primarily PVPS and WPS), price fluctuations in energy markets, and fuel prices instability, among others. The problem is complex and extremely stochastic. None of the aforementioned references have addressed such a general approach to sizing a utility-scale ESS for a GENCO. The proposed model was developed and optimized in MATLAB R2022a using the Mixed Integer Linear Programming (MILP) optimization technique.
In contrast to the majority of previously described algorithms for calculating the optimal operation and storage size, which employ a probabilistic approach, we propose a deterministic method with numerous optimization calculations that use realized and recorded combinations of uncertain factors. Both approaches use the same historical data for predicting future trends. In addition to the well-known differences between probabilistic and deterministic approaches, it should be noted that the complexity of stochastic optimization increases significantly when multidimensional stochastic processes are considered. Therefore, the aforementioned references consider only a few uncertainties. Furthermore, none of these references account for correlations between uncertainty factors (e.g., electricity market price and production of renewables), but treat them as independent, which considerably simplifies calculation. The deterministic approach does not face the problem of the number of uncertain factors, as each calculation step is based on a new set of initial conditions. The interdependence of random factors is inherent for each realized set of initial conditions. Deterministic optimization is significantly simpler than stochastic optimization, allowing for the inclusion of additional conditions and constraints in the model of a GENCO operation. However, a notable disadvantage of the deterministic approach lies in managing a series of partial solutions and simultaneously handling a huge number of input data.
Numerical results validate the competencies of the presented optimization model of GENCO operation under the given conditions, despite various uncertainties. The optimal sizes for both BSS and PSHP suitable for a specified GENCO with a mixed portfolio were obtained.
The main contributions of the paper are the development of a detailed model of GENCO operation with a diversified portfolio and energy storage under market conditions, as well as a method for determining the optimal storage size.
The rest of the paper is organized as follows:
Section 2 presents the concept for calculating the optimal size of a GENCO energy storage with a description and mathematical formulation of the GENCO operation model to be optimized.
Section 3 provides the simulations results for the optimal operation of a GENCO with a mixed portfolio, based on the proposed model, along with a cost-benefit analysis used to determine the optimal sizes for both BSS and PSHP storage systems. Conclusions are presented in
Section 4.
3. Numerical Examples
In numerical examples, the influence of energy storage on the optimal operation of GENCO, which has PVPS, WPS, and TPP in its portfolio, was examined. It was assumed that GENCO participates in the DAM and ASM (reg-up, reg-down, spinning reserve). Additionally, for the specific GENCO, the optimal size of BSS and PSHP energy storage was determined.
The selected simulation period in all presented cases was the year 2023. One year is the minimum period that includes the complete seasonal variability of consumption and complete seasonal variability of VRES production. The production data of PVPS and WPS, as well as the ESS inflow data in the case of PSHP, were based on actual measured data for the selected year [
31]. Electrical market prices were chosen from real power exchange data for the same year [
32]. The fuel and start-up prices of TPP were taken according to [
10,
14,
16].
3.1. Input Data
The input data (variables limits, coefficient values, recorded renewables production, and DAM prices) used in all numerical examples are presented below.
The upper (superscript u) and lower (superscript l) limits of the variables, as well as the coefficient values used in the numerical examples for modelling the energy storage system, are given in
Table 1.
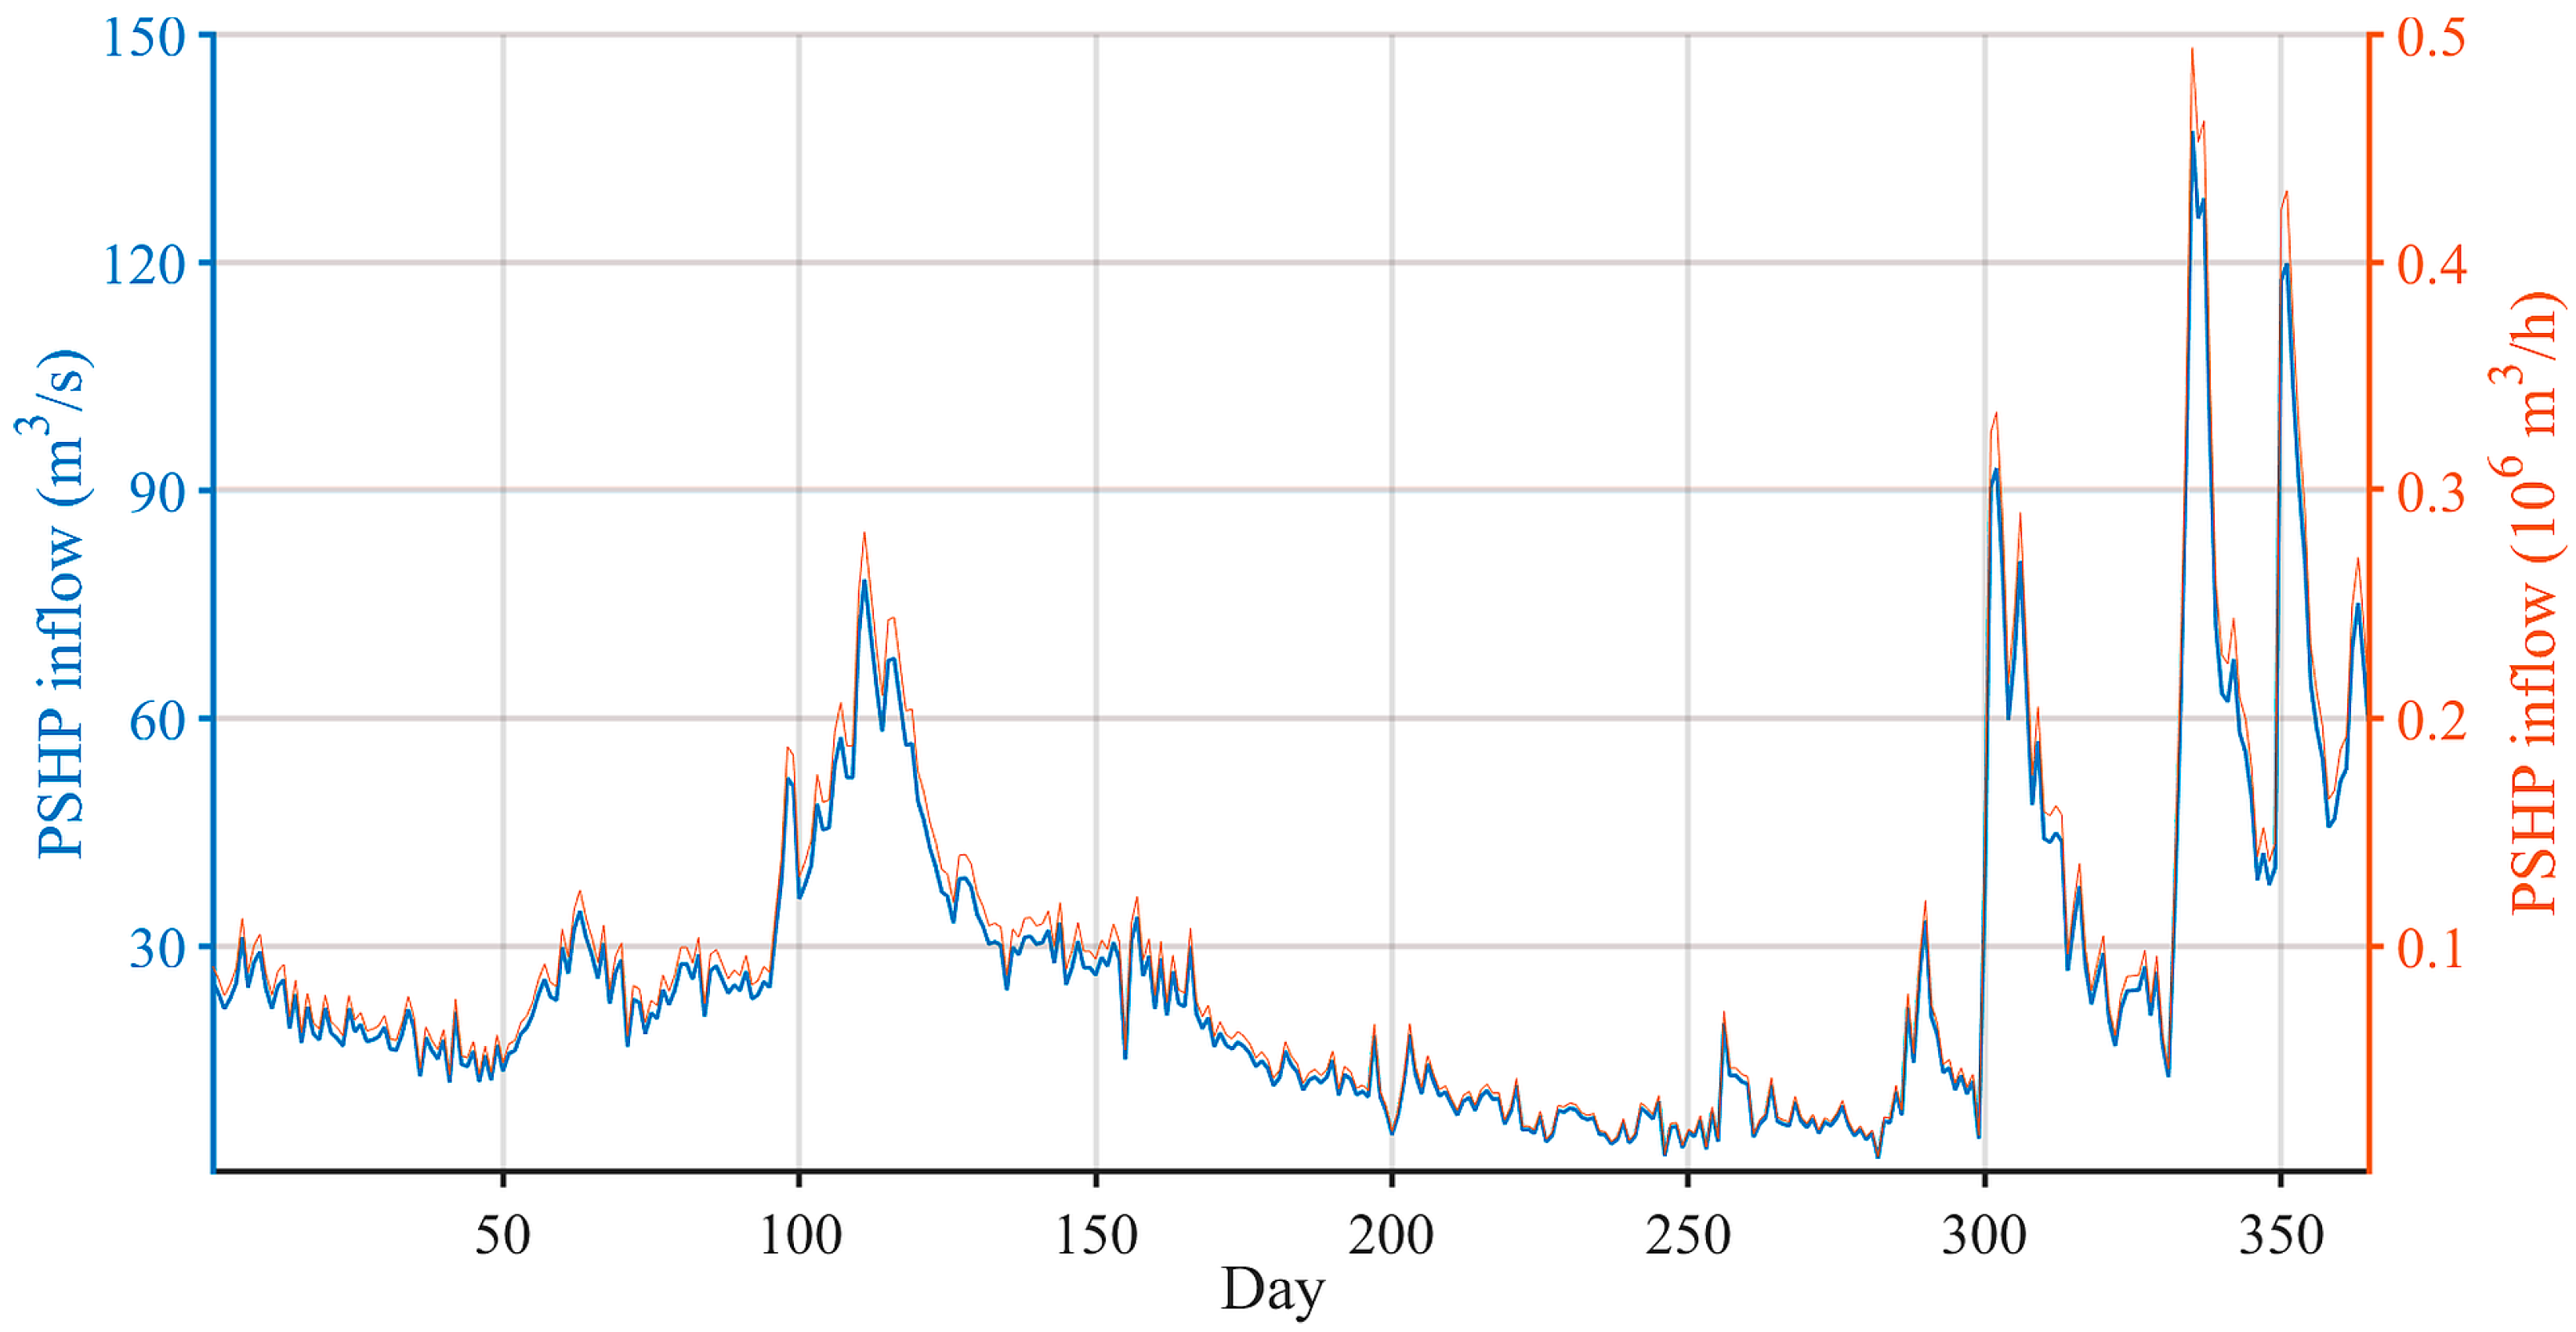
Figure 2 shows the inflow in the upper basin of PSHP in the observed period according to the measured daily data [
31]. It was assumed that the hourly inflows in the upper and lower basin are equal over 24 h.
The upper and lower limits of the variable
terpln,t, as well as the coefficients values used in all numerical cases for modelling thermal power plant, are shown in
Table 2.
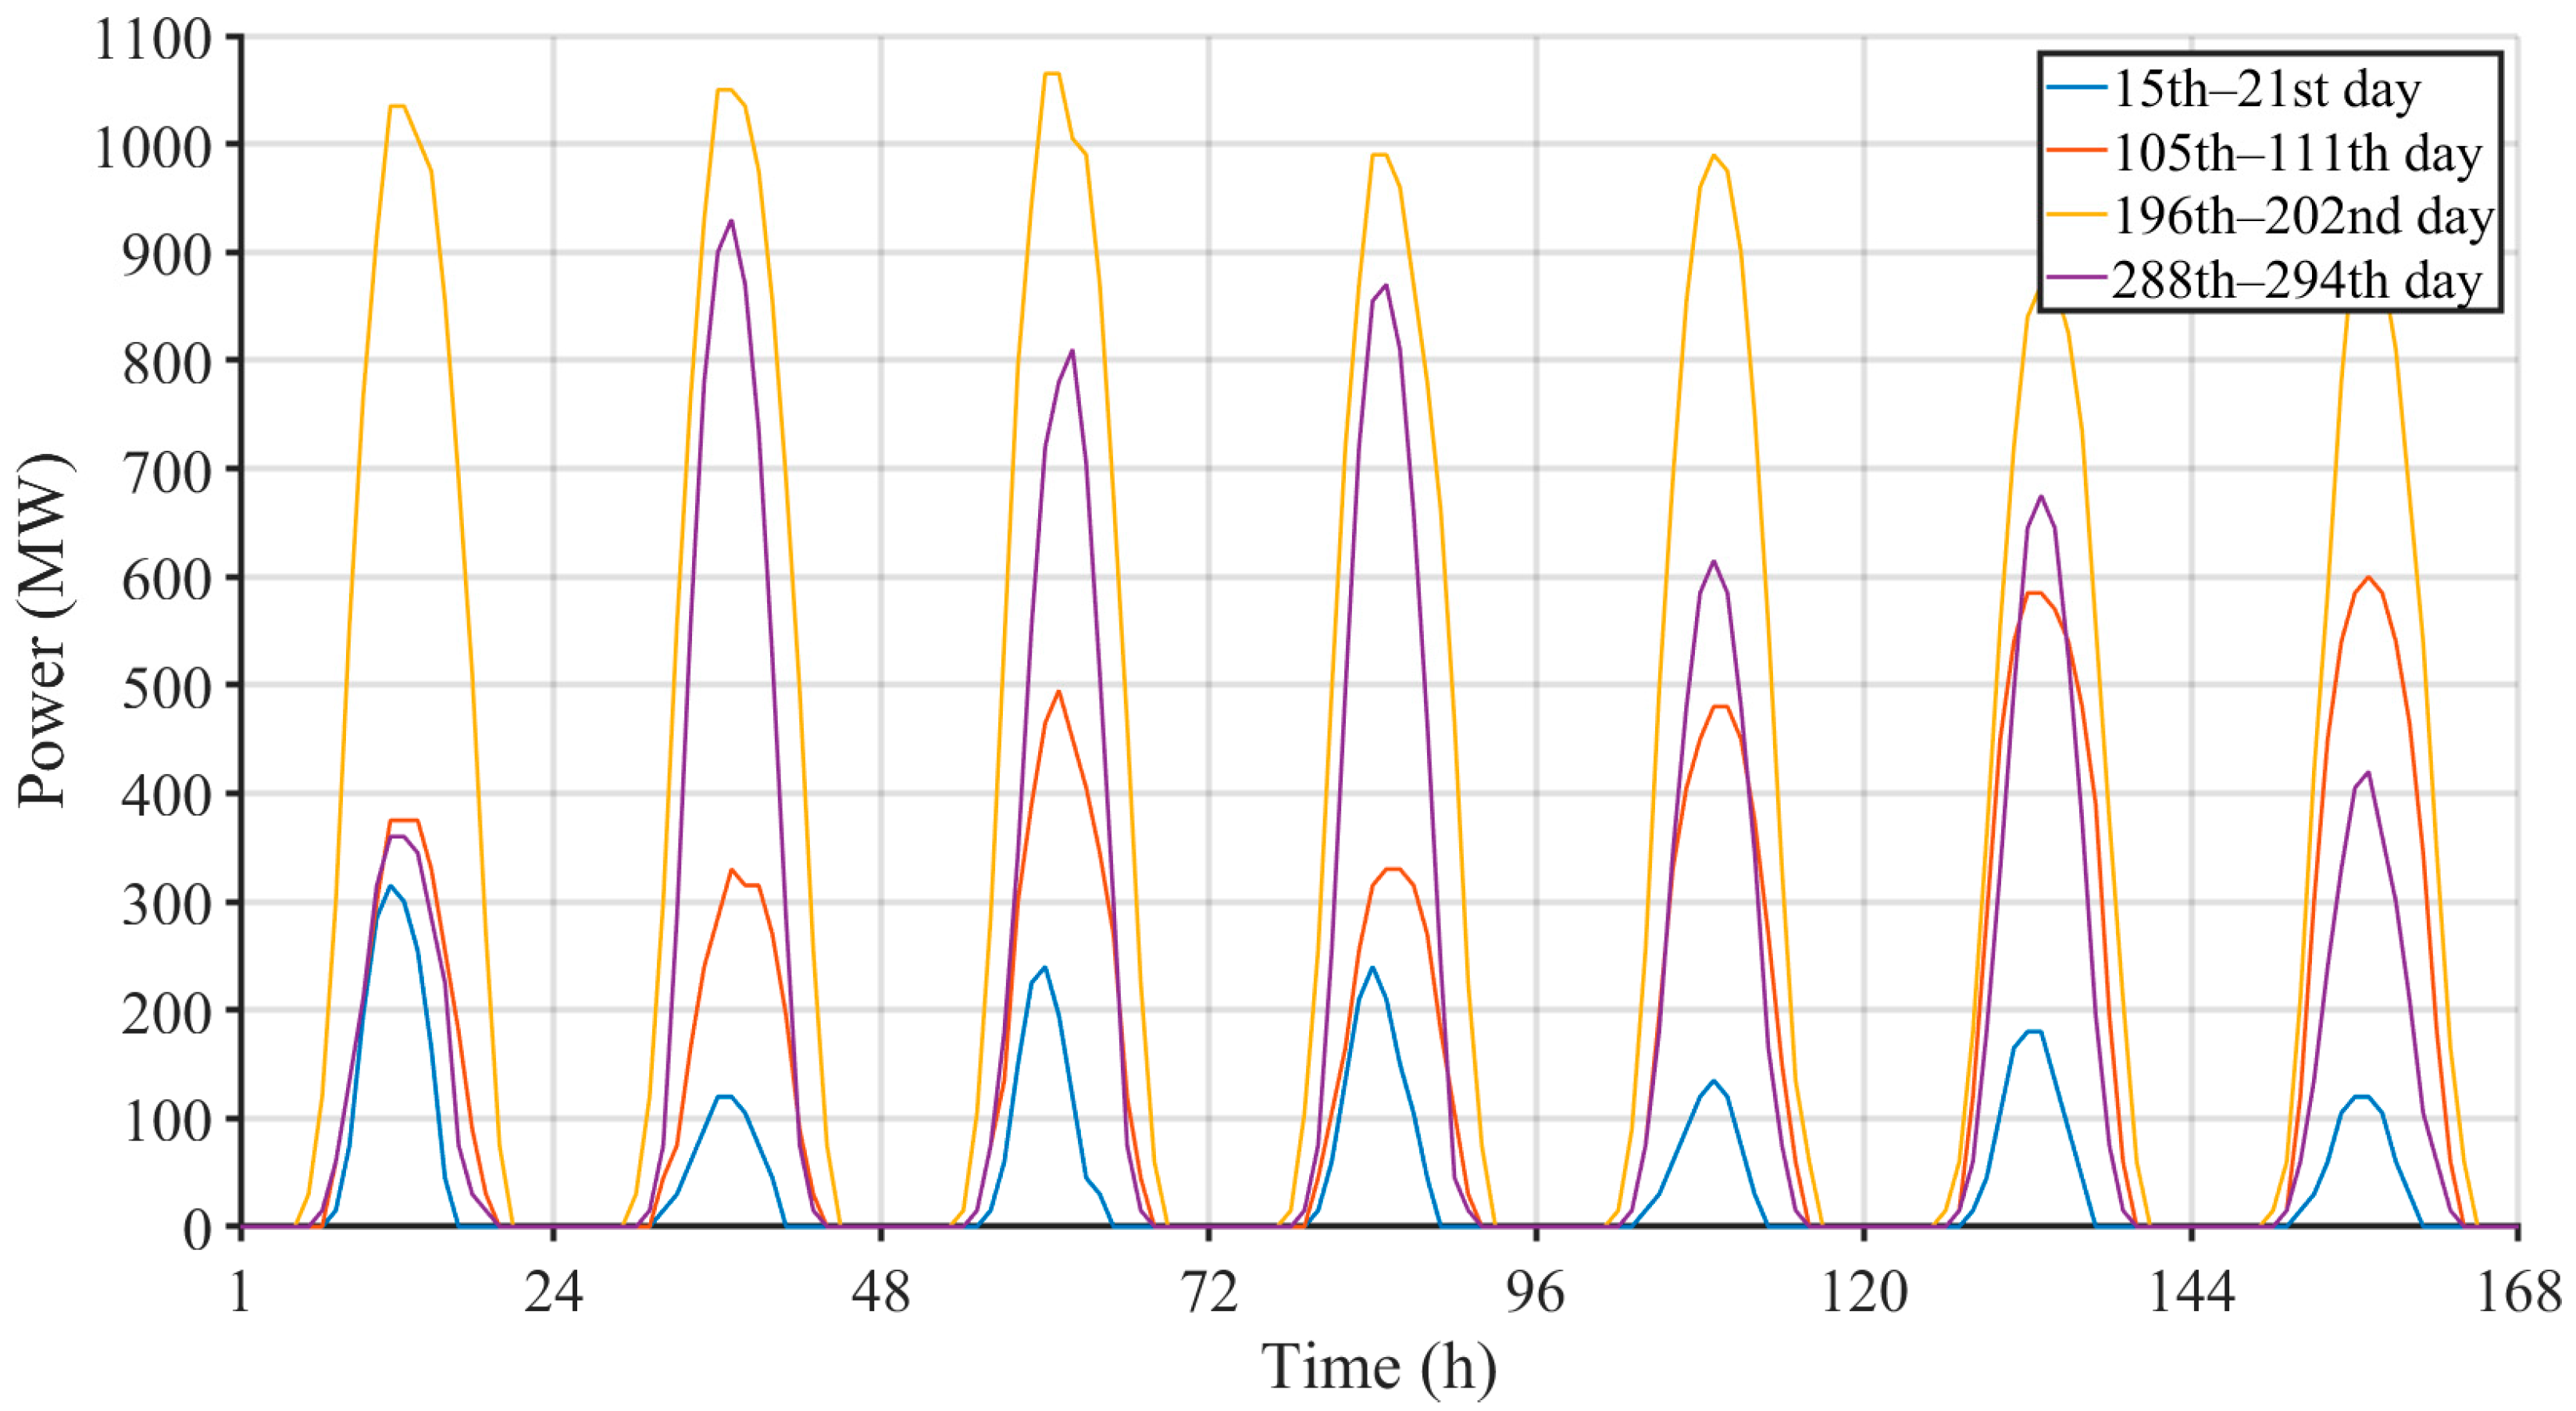
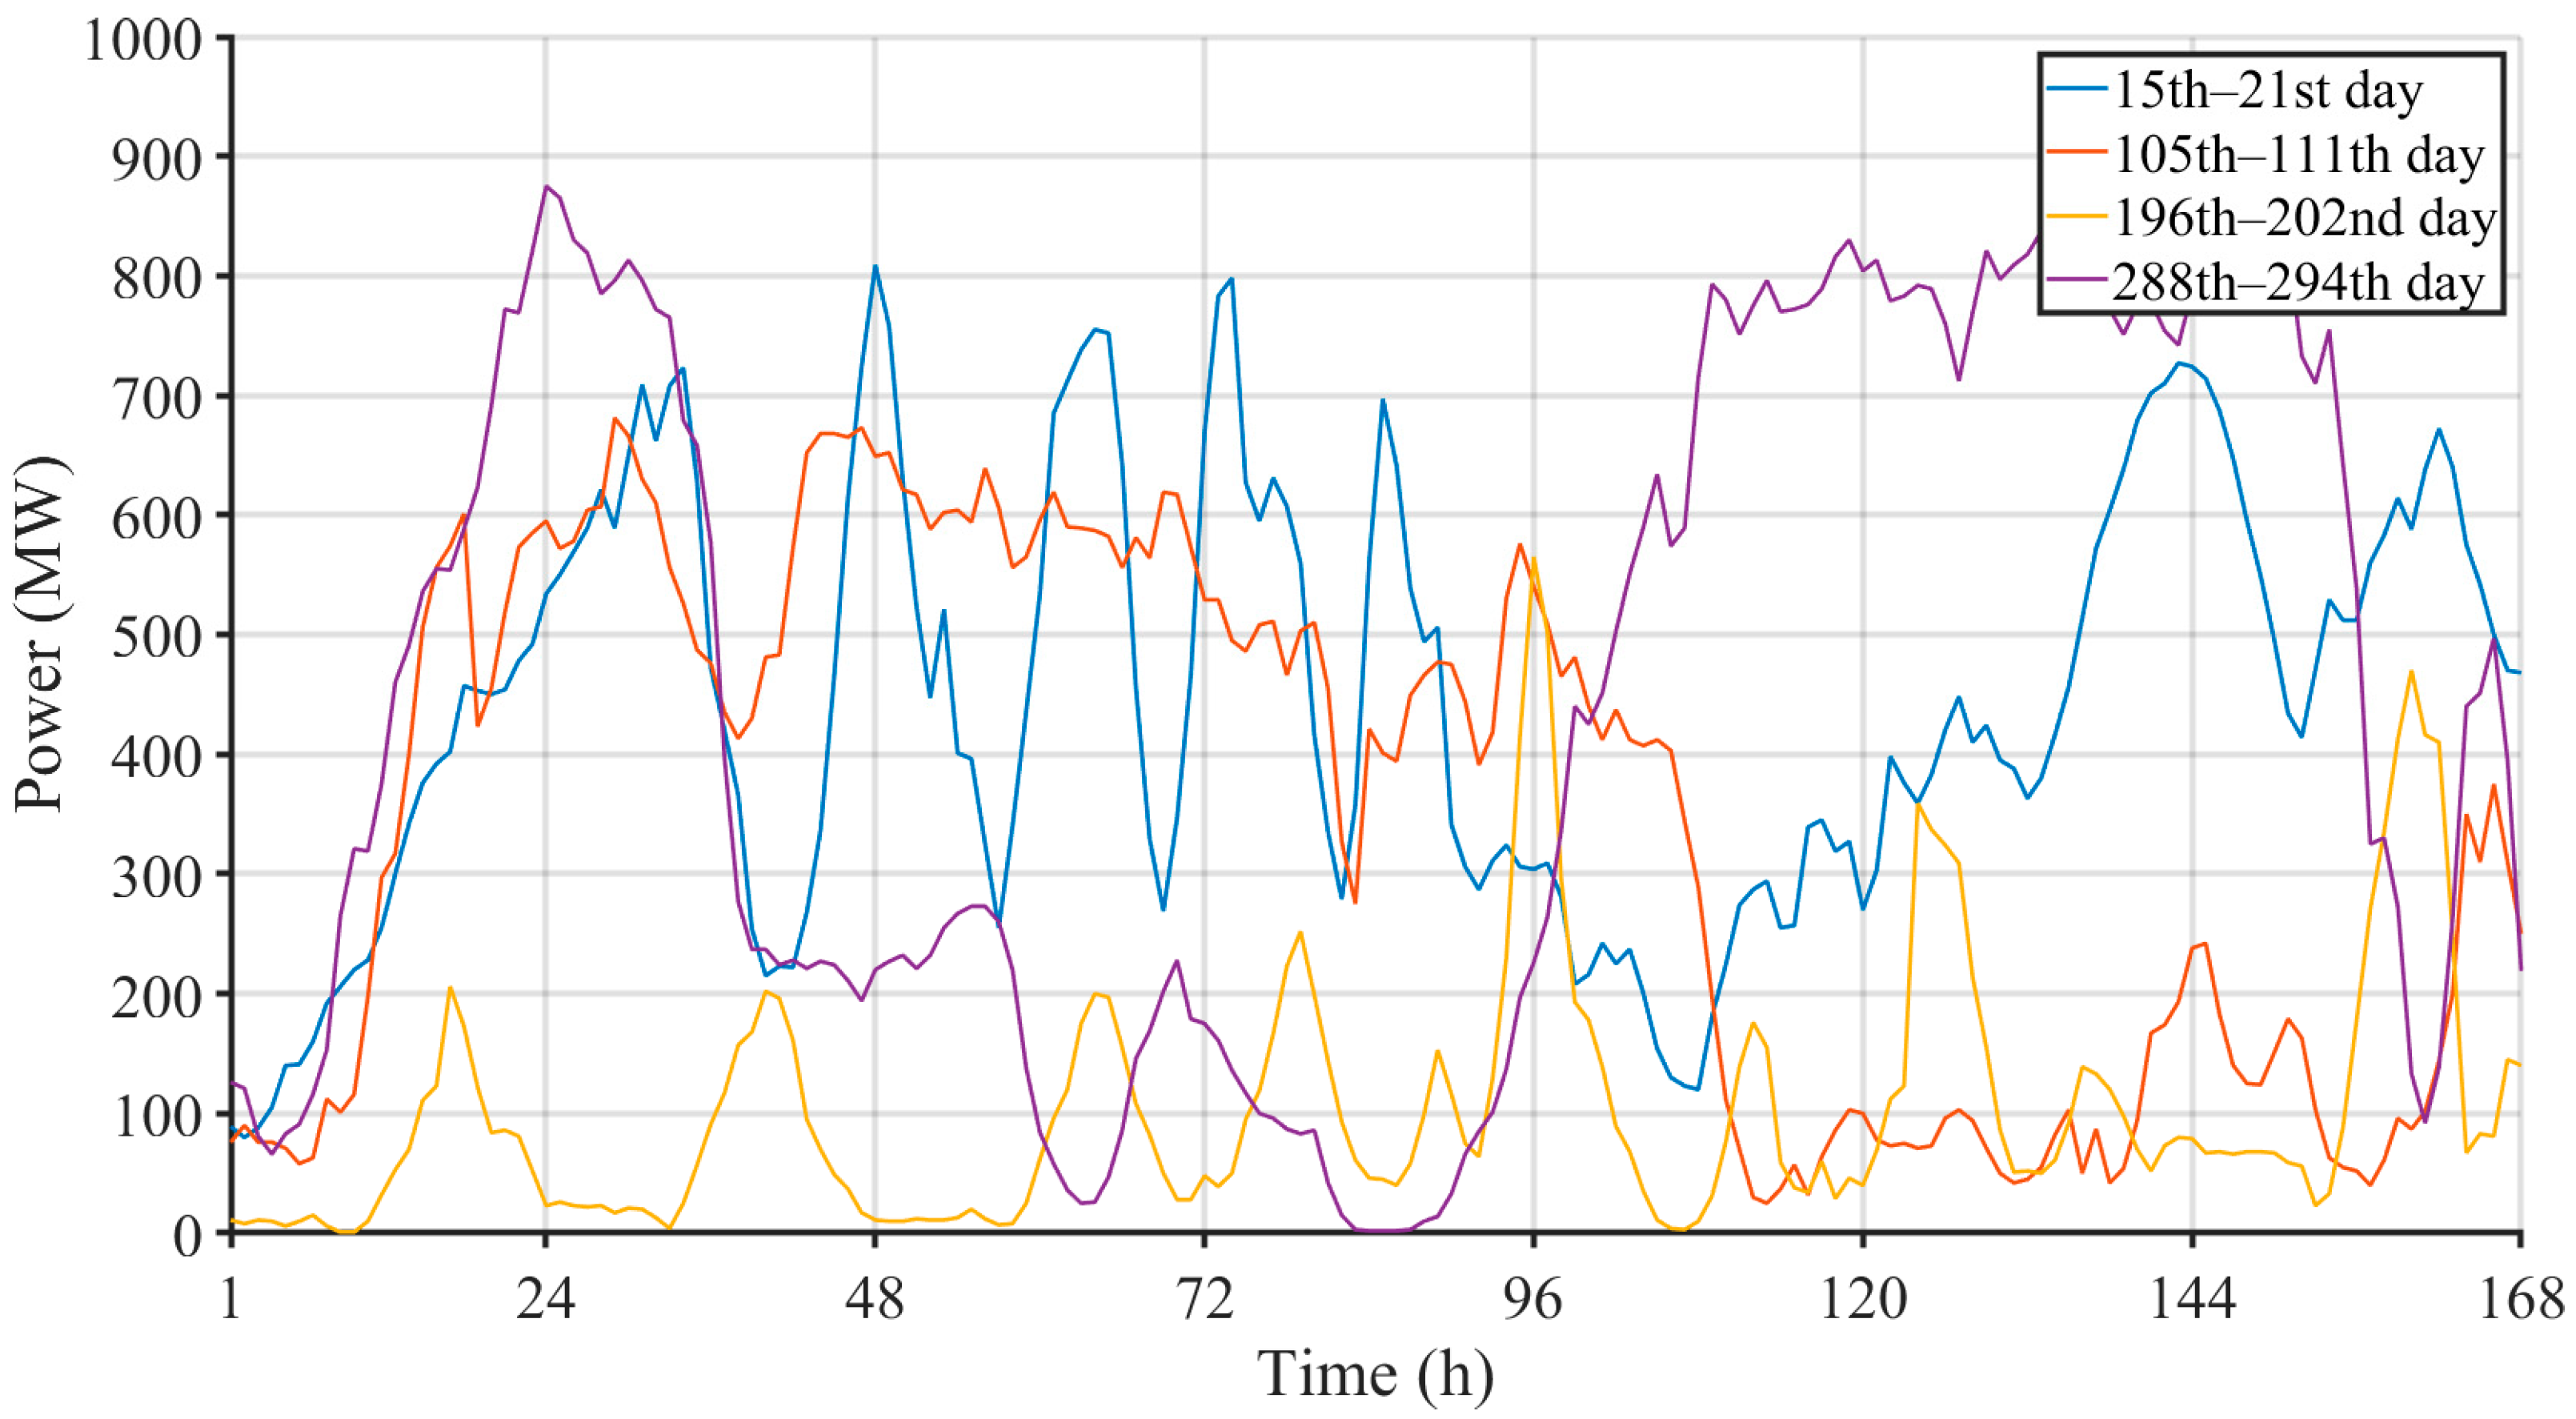
Since it would be illegible to show the measured production of the PVPS and WPS for each hour of the year according to [
31],
Figure 3 and
Figure 4 show the production of one week in the 1st, 4th, 7th, and 10th months. By selecting these specified months, the weekly production of the mentioned generation sources in four different seasons is shown.
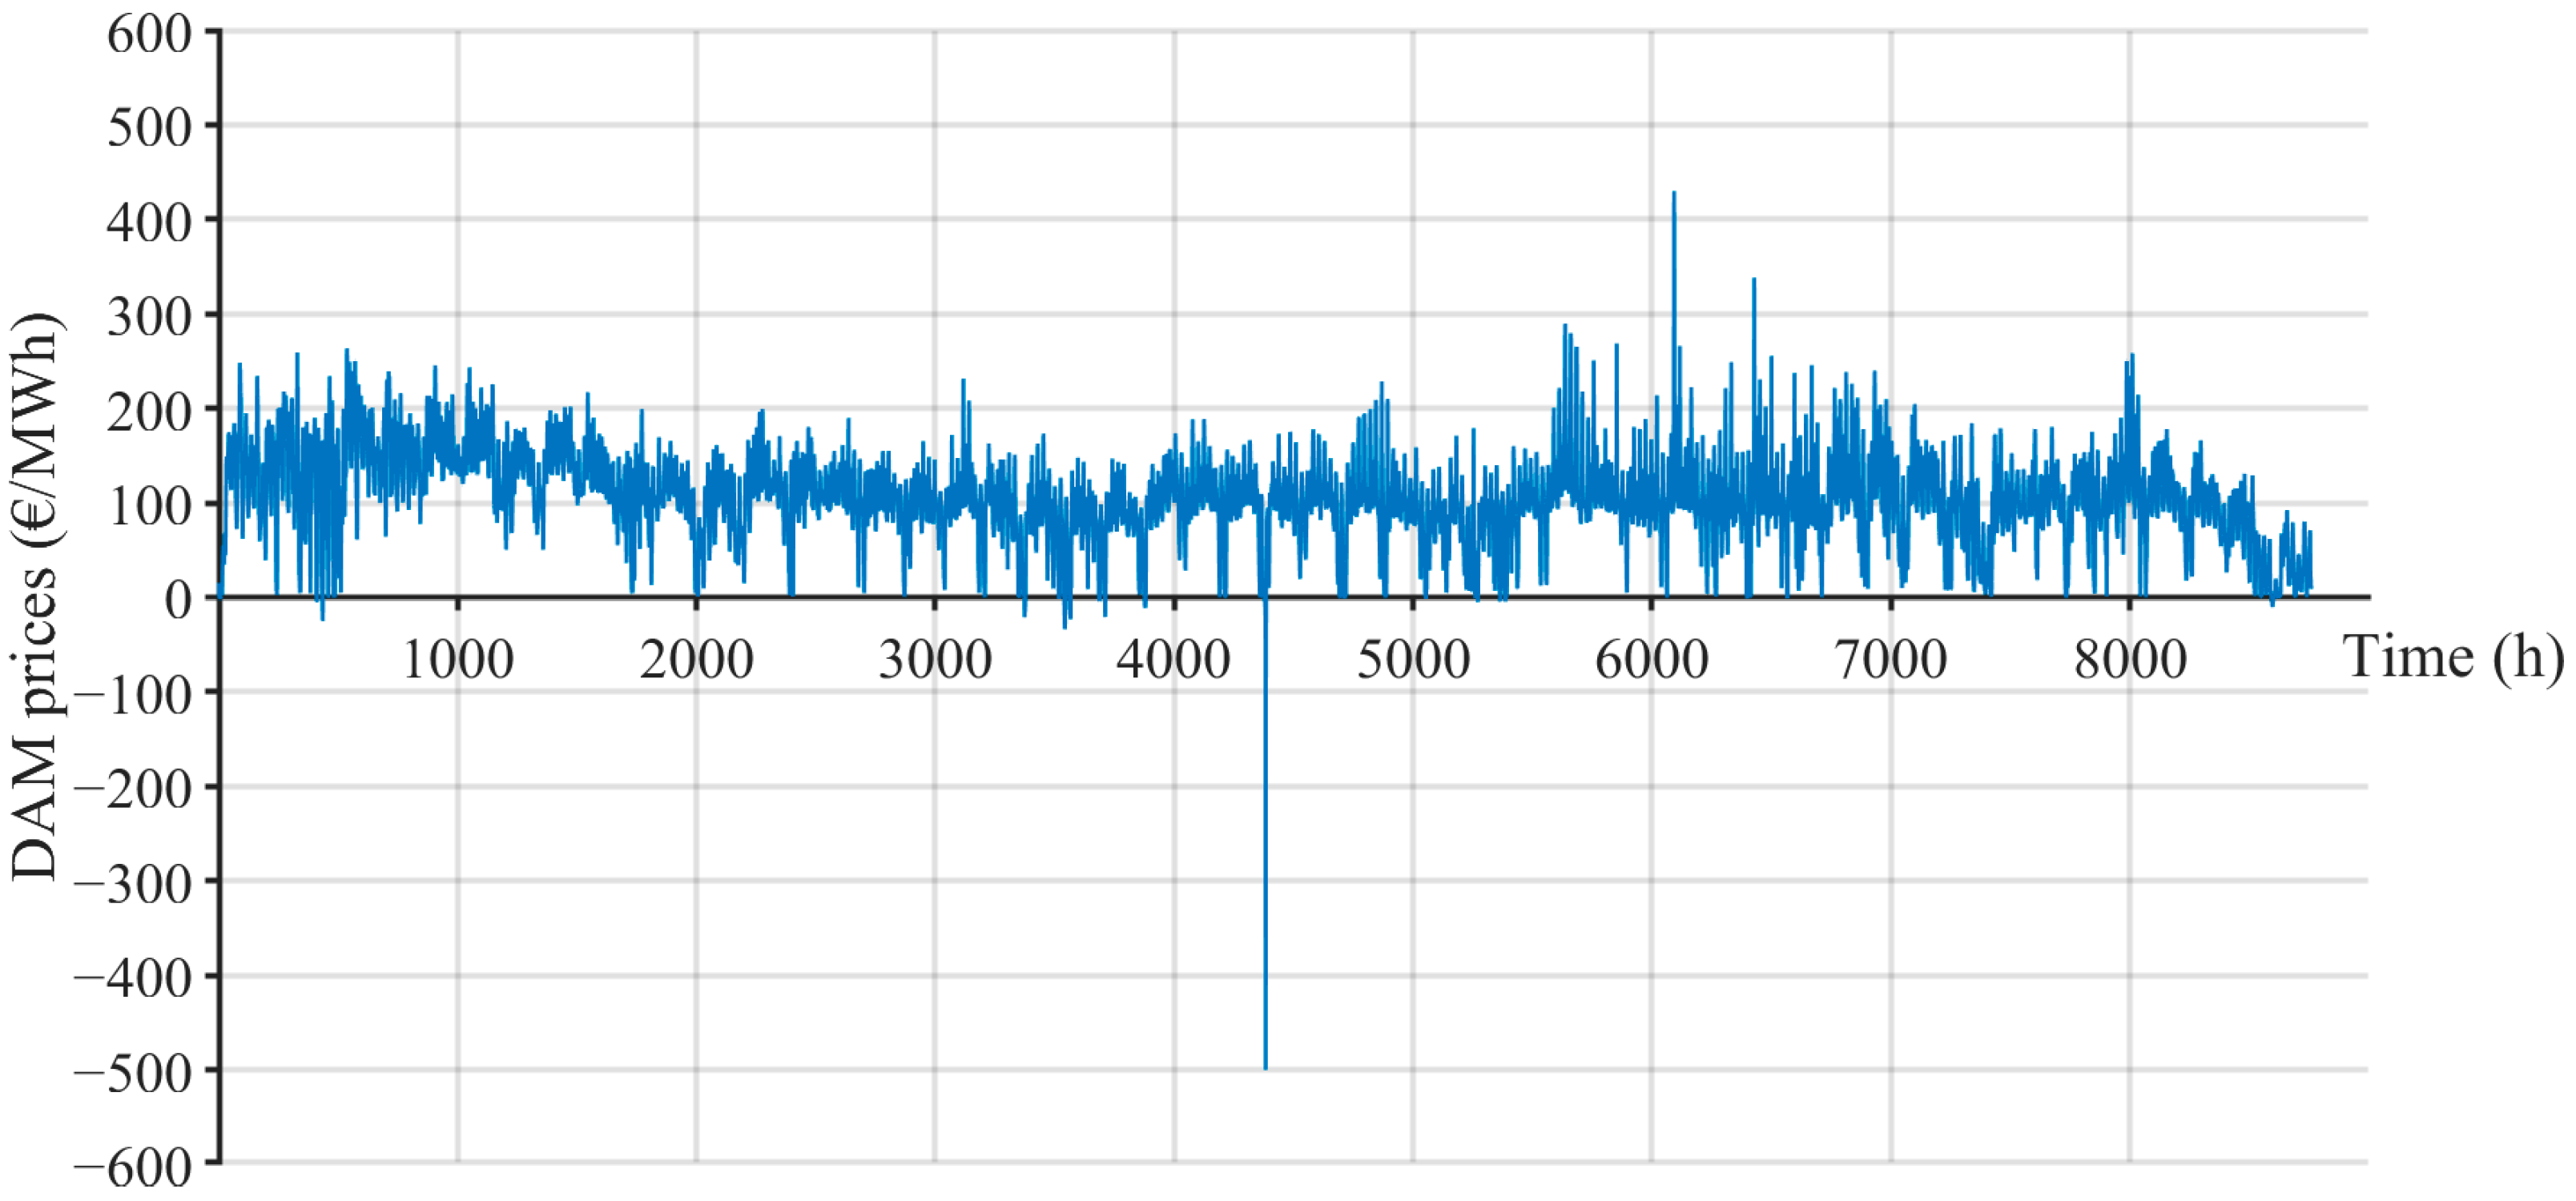
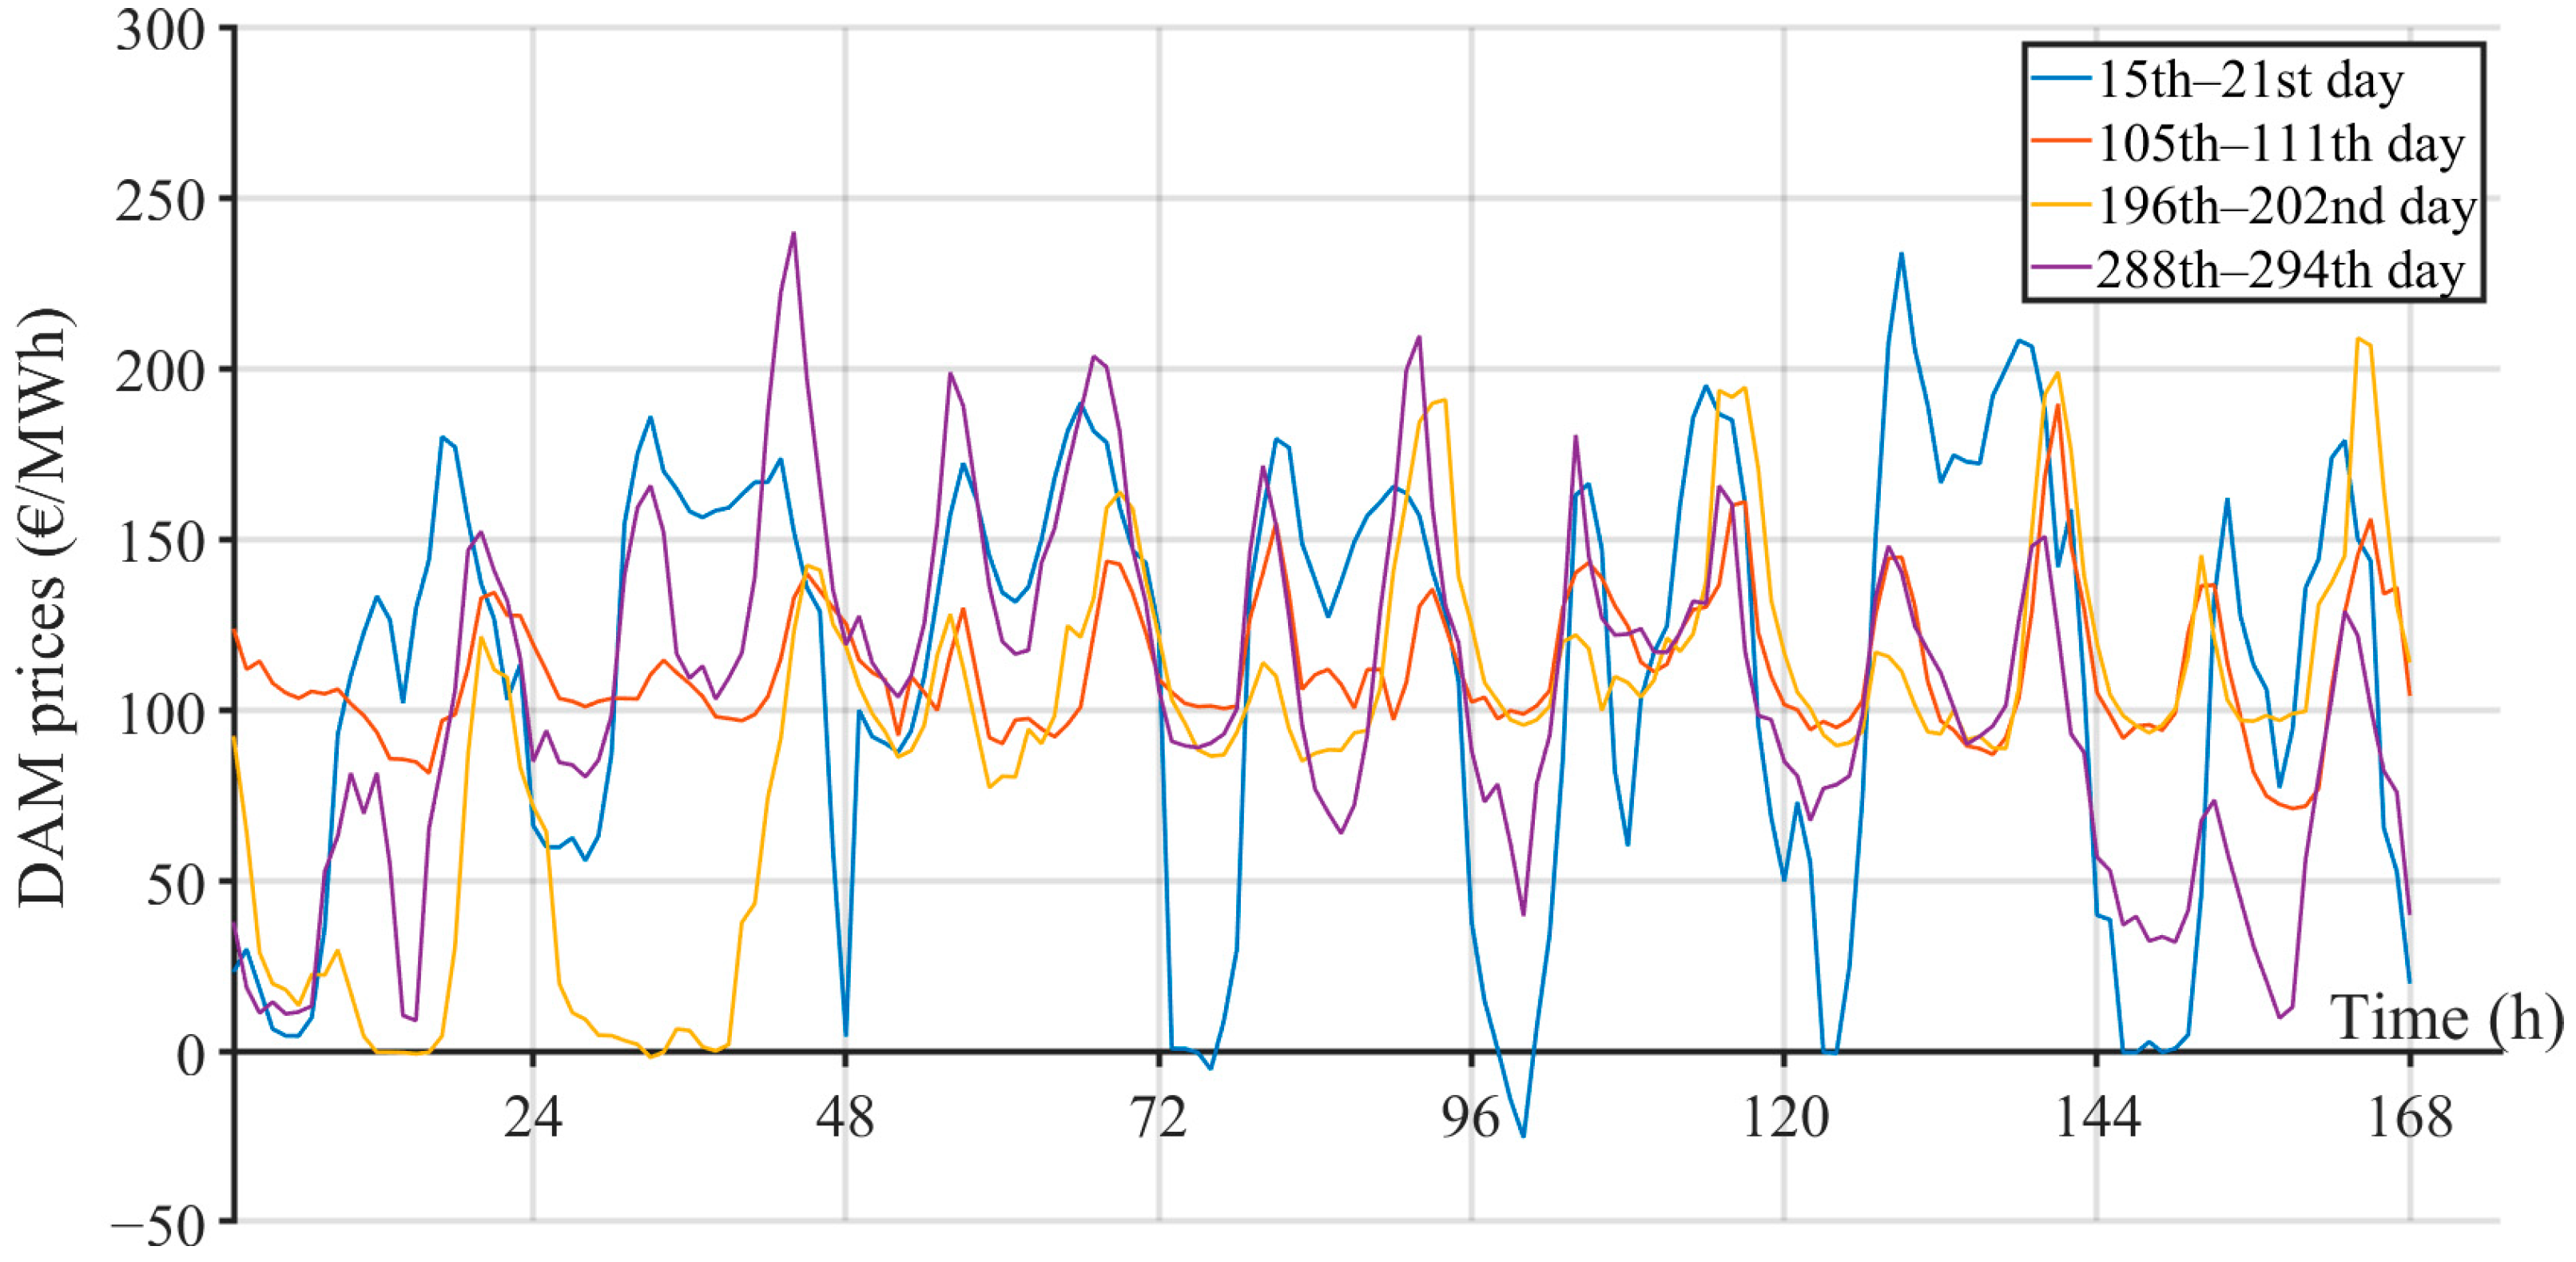
Figure 5 shows the realized prices at DAM in the observed year (
), while
Figure 6 shows the aforementioned DAM prices in the same weeks as in
Figure 3 and
Figure 4 according to [
32]. Both figures confirm the unpredictability of DAM prices and the occurrence of negative prices.
The capacity prices of ancillary services (cn,t,1 − cn,t,3) are assumed to be 40% higher than prices from DAM (), while the energy prices of ancillary services () are taken to be equal to 8 €/MWh, 6 €/MWh, and 8 €/MWh for reg-up, reg-down, and spinning reserve, respectively.
In the examples with included penalties, it was assumed that the GENCO must constantly deliver 300 MW of power (E_contrn,t = 300 MWh). Delivered energy up to E_contrn,t is paid at the full market price, delivered energy greater than the contracted amount is paid for at 70% of the market spot price (kc = 0.7), while the GENCO pays a penalty of € 100 for each undelivered MWh (c_penn,t = 100 €/MWh).
3.2. Numerical Results
3.2.1. The Influence of ESS and the Penalty Clause on the Optimal Operation of the GENCO
Six cases of annual operation of the GENCO with previously defined parameters were simulated. Case 1, case 2, and case 3 refer to the operation of the GENCO without a storage system, with BSS, and with PSHP, respectively. In all these cases, the penalty clause is ignored, while in case 1p, case 2p, and case 3p, the penalty clause is considered. Cases 2 and 2p consider a battery with a charge and discharge power of 100 MW and with an efficiency coefficient of η = 0.85. Cases 3 and 3p consider a PSHP with 100 MW pumping power, 110 MW generating power, and η = 0.8. When choosing the parameters of both energy storage facilities, the intention was that the facilities have approximately the same, but realistic, characteristics. If equal η and zero inflow to the upper accumulation were used for both facilities, similar results would be obtained. However, the aim of the research is not to compare storage technologies but to consider the impact of both types of energy storage system on the optimal operation of the GENCO in a market-oriented power system.
Table 3 and
Table 4 show the optimal energy production and the optimal operating hours of the specified GENCO for DAM and ASM participation, respectively. Production in
Table 3 along with operating hours in
Table 4 are listed by facilities for DAM and by services for ASM. In addition, in
Table 3, the total production of the GENCO is divided into production up to the contracted amount (
E1) and above the contracted amount (
E2). From these tables, it can be concluded that:
Significant differences in the results obtained of BSS and PSHP production for DAM, as well as consumption (for pumping or charging) from DAM, are mostly the consequence of the PSHP upper basin inflow;
A comparison between the cases with and without the penalty clause reveals that the production of TPP is significantly lower in the penalty clause cases, because production at degraded energy prices is not profitable for TPP;
The negative energy prices, recorded during several hours of the observed year (
Figure 5 and
Figure 6), contribute to the small differences observed in the produced energy and operating hours of VRES, as presented in
Table 3 and
Table 4. In all cases involving a penalty clause, the GENCO will suspend production during periods of negative energy prices;
The total energy produced by the GENCO in Case 2p is lower than in Case 1p due to charge/discharge energy losses of BSS, but the placement of energy at the nominal price (E1) is still higher;
As expected, the energies for providing ancillary services, along with the operating hours, are approximately identical for BSS and PSHP. The duration of providing ancillary services is high in all cases. It is obvious that the GENCO tends to participate in the ASM more than in the DAM.
The undelivered (penalized) energy and the penalty cost for optimal GENCO operation are shown in
Table 5. As expected, both values are lower in cases with ESS.
Table 6 presents the structure of the GENCO’s annual income. DAM and ASM incomes represent the revenue generated from participation in these markets. GENCO’s net income is the result of the optimization calculation given by the objective function (1), i.e., it is the sum of DAM and ASM income minus the fuel and start-up costs of the TPP, storage O&M costs, and penalty costs. The results clearly demonstrate that the GENCO with both types of ESS generates higher net incomes regardless of the penalty clause.
The annual net income of the considered ESS, shown in
Table 7, can be extracted from the annual net income of GENCO with the given portfolio (last row in
Table 6). For example, the net income of the BSS in the power system (PS) without penalty clause is the difference of the net income in case 2 and the net income in case 1, while the net income of the BSS in the system with penalty clause is obtained by subtracting the net income in cases 1p from that in case 2p. The net incomes for PSHP were determined analogously. As expected, the contribution of both ESS types is slightly higher in the PS with the penalty clause.
3.2.2. Optimal Size of ESS
The optimal size of the ESS for the GENCO with the above production portfolio (PVPS, WPS, TPP) was analyzed through a series of simulation calculations of the optimal GENCO operation in which the storage size was varied. The storage power capacity of both BSS and PSHP types was varied, falling in the range from 50 to 500 MW with a step of 50 MW. Subsequently, upon analyzing the results, it was observed that the optimal BSS size was in the smaller range, so additional simulations were conducted with BSS power capacity of 25 MW and 75 MW. Simultaneously, with the increase in the storage power capacity, some storage parameters, such as energy capacity, O&M costs, etc., have also increased linearly. The limits of all variables and coefficient values for both storage types varied in the calculations are shown in
Table 8. The other constants of ESSs are equal to the initial values already shown in
Table 1. In the calculations, BSS maximum discharge power was equal to the maximum charging power, while in the cases of PSHP, the maximum production power was always 10% higher than the maximum pumping power.
According to
Table 9, which shows the unit cost of power rating and the unit cost of storage capacity for both types of storage, the investment cost of the storage systems was calculated.
The investment cost of the storage systems was calculated based on
Table 9, which shows the unit cost of power rating and the unit cost of storage capacity for both types of storage. Unit prices of energy storage systems were taken from [
33]. These prices were increased by 50% due to inflation in the case of PSHP, while in the case of BSS, they were decreased by 10% due to the advancement of technology resulting in lower prices.
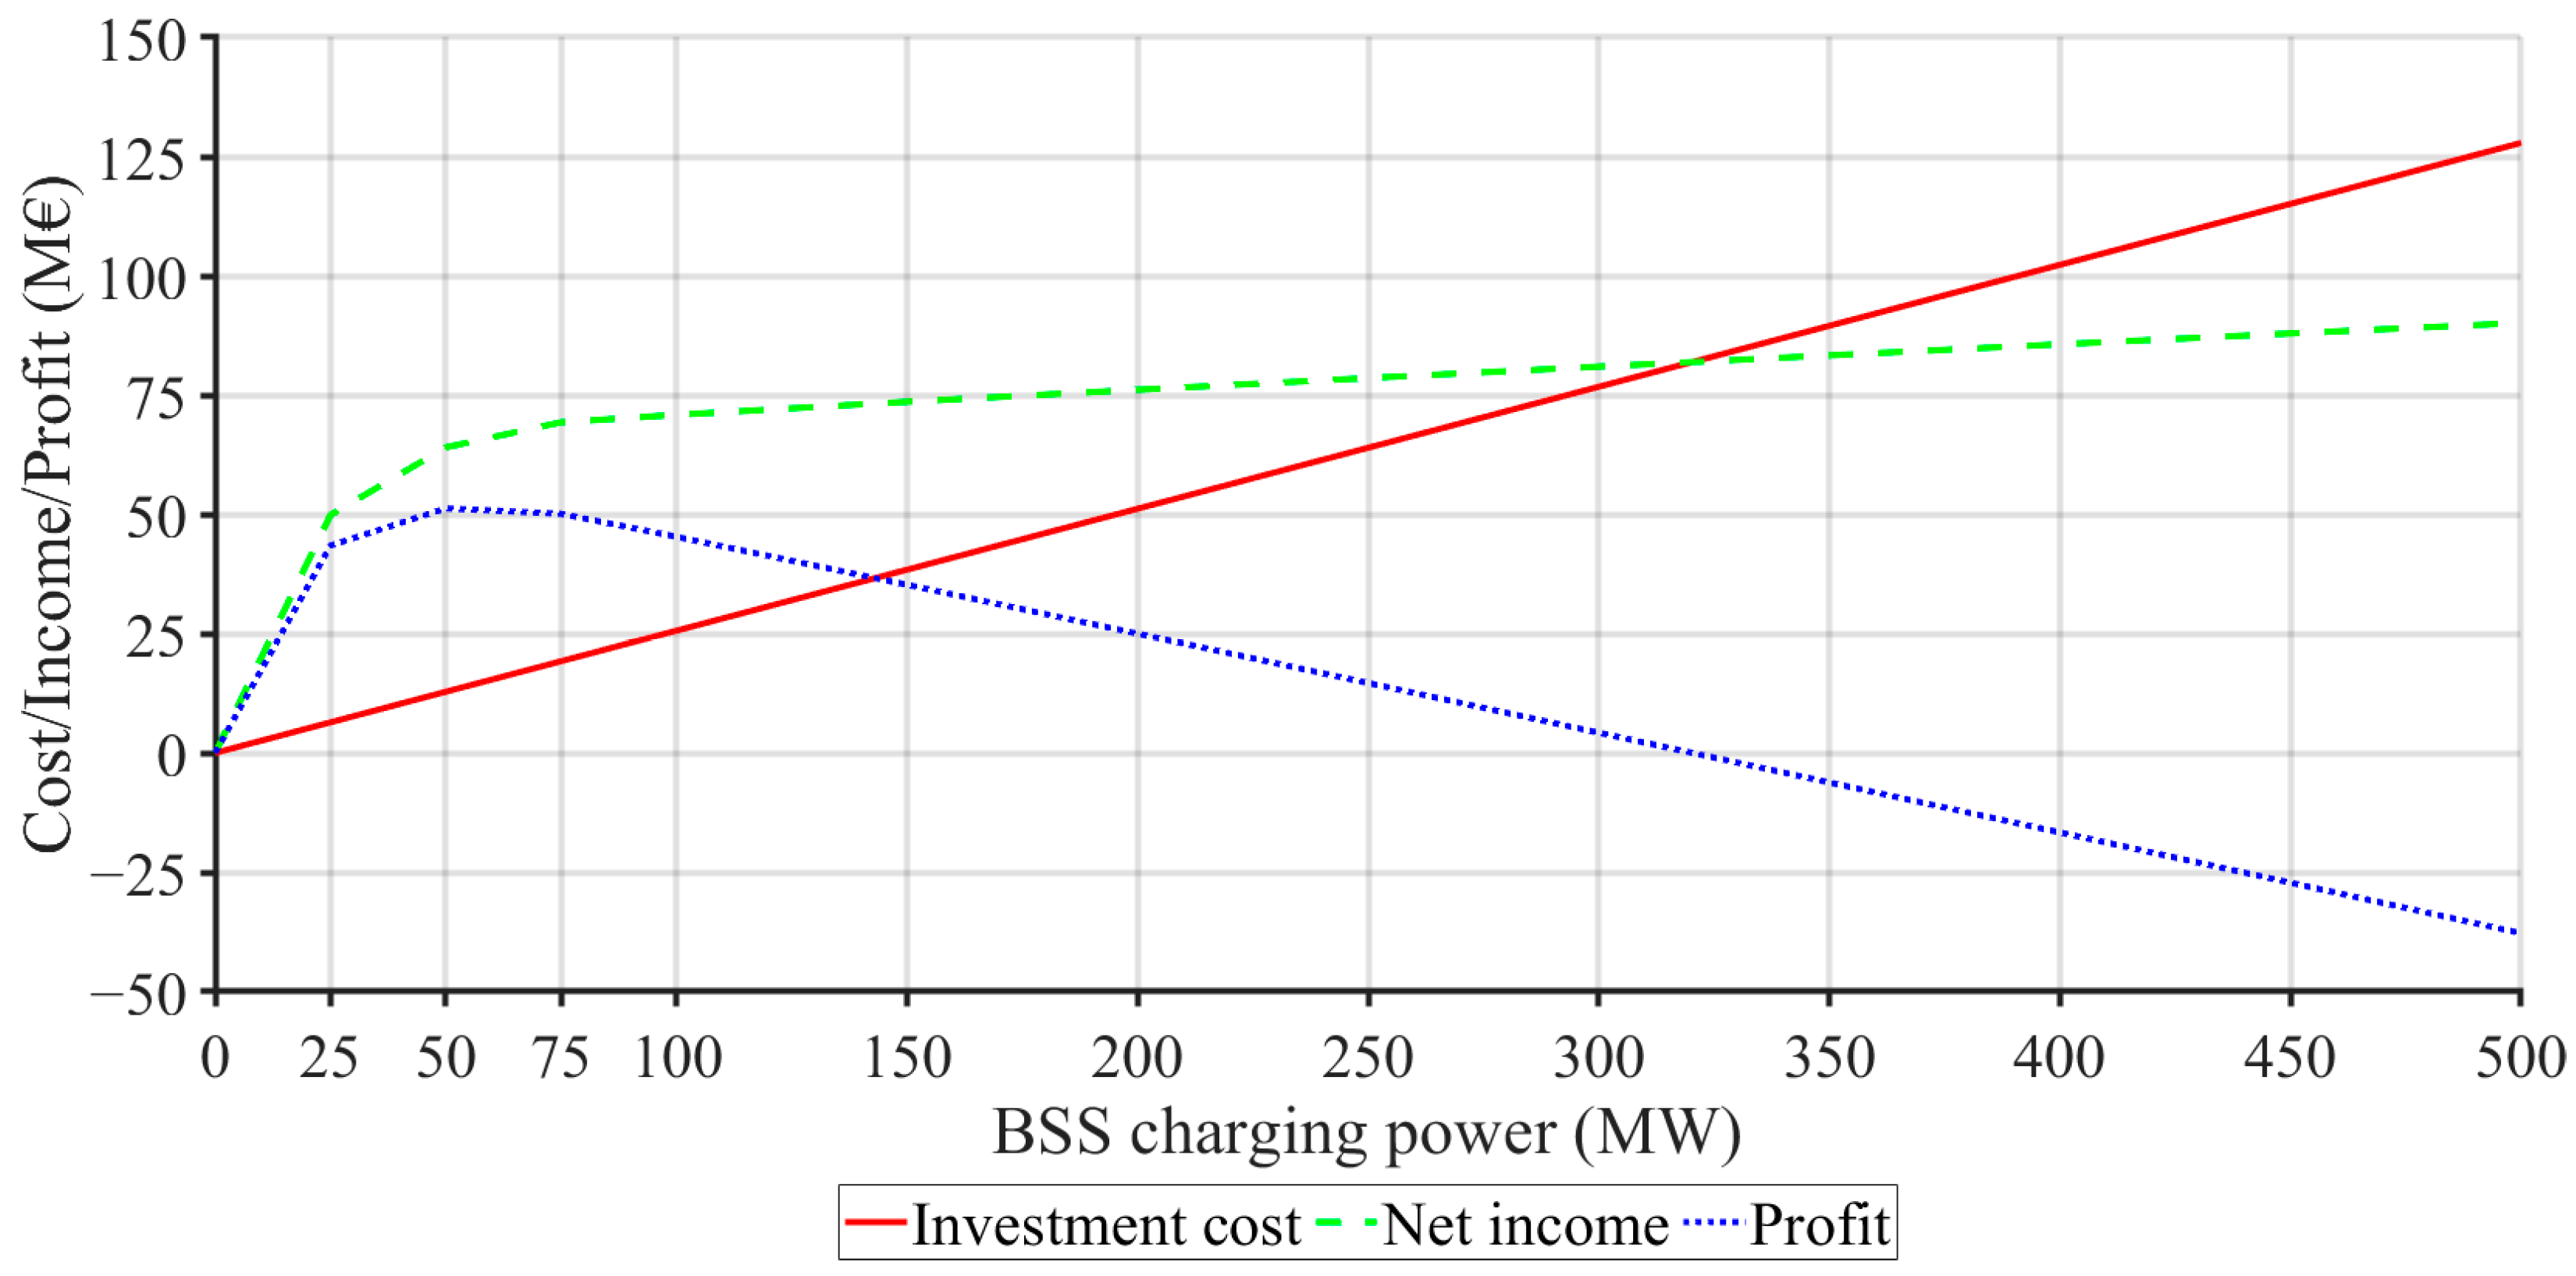
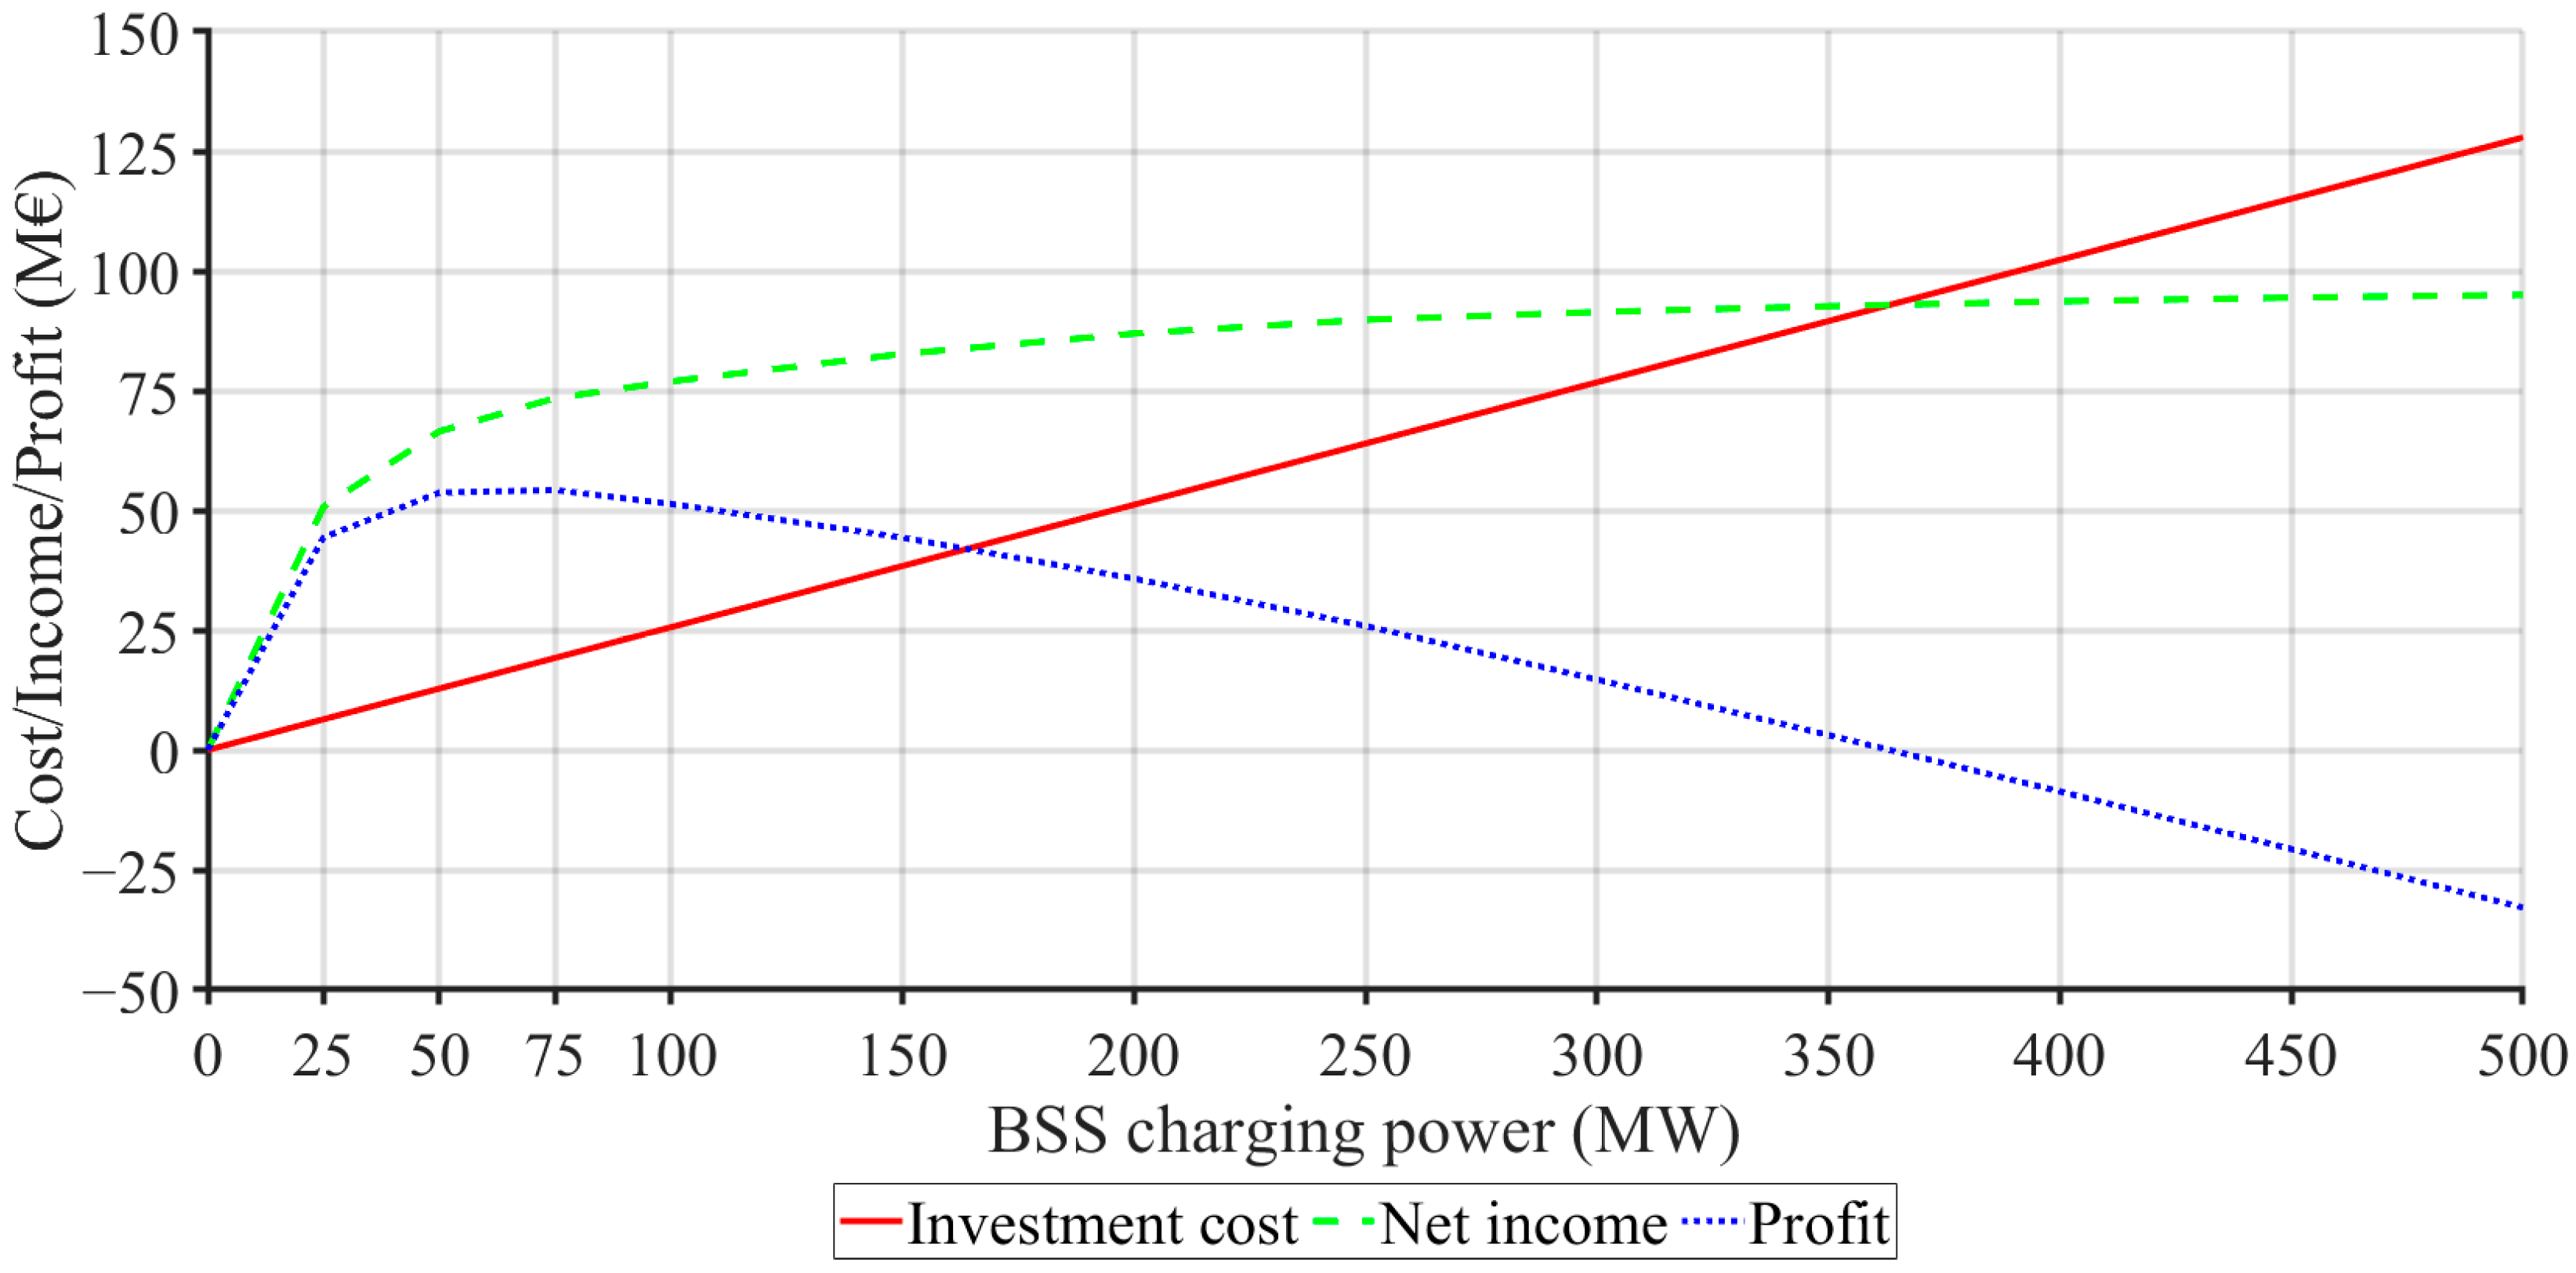
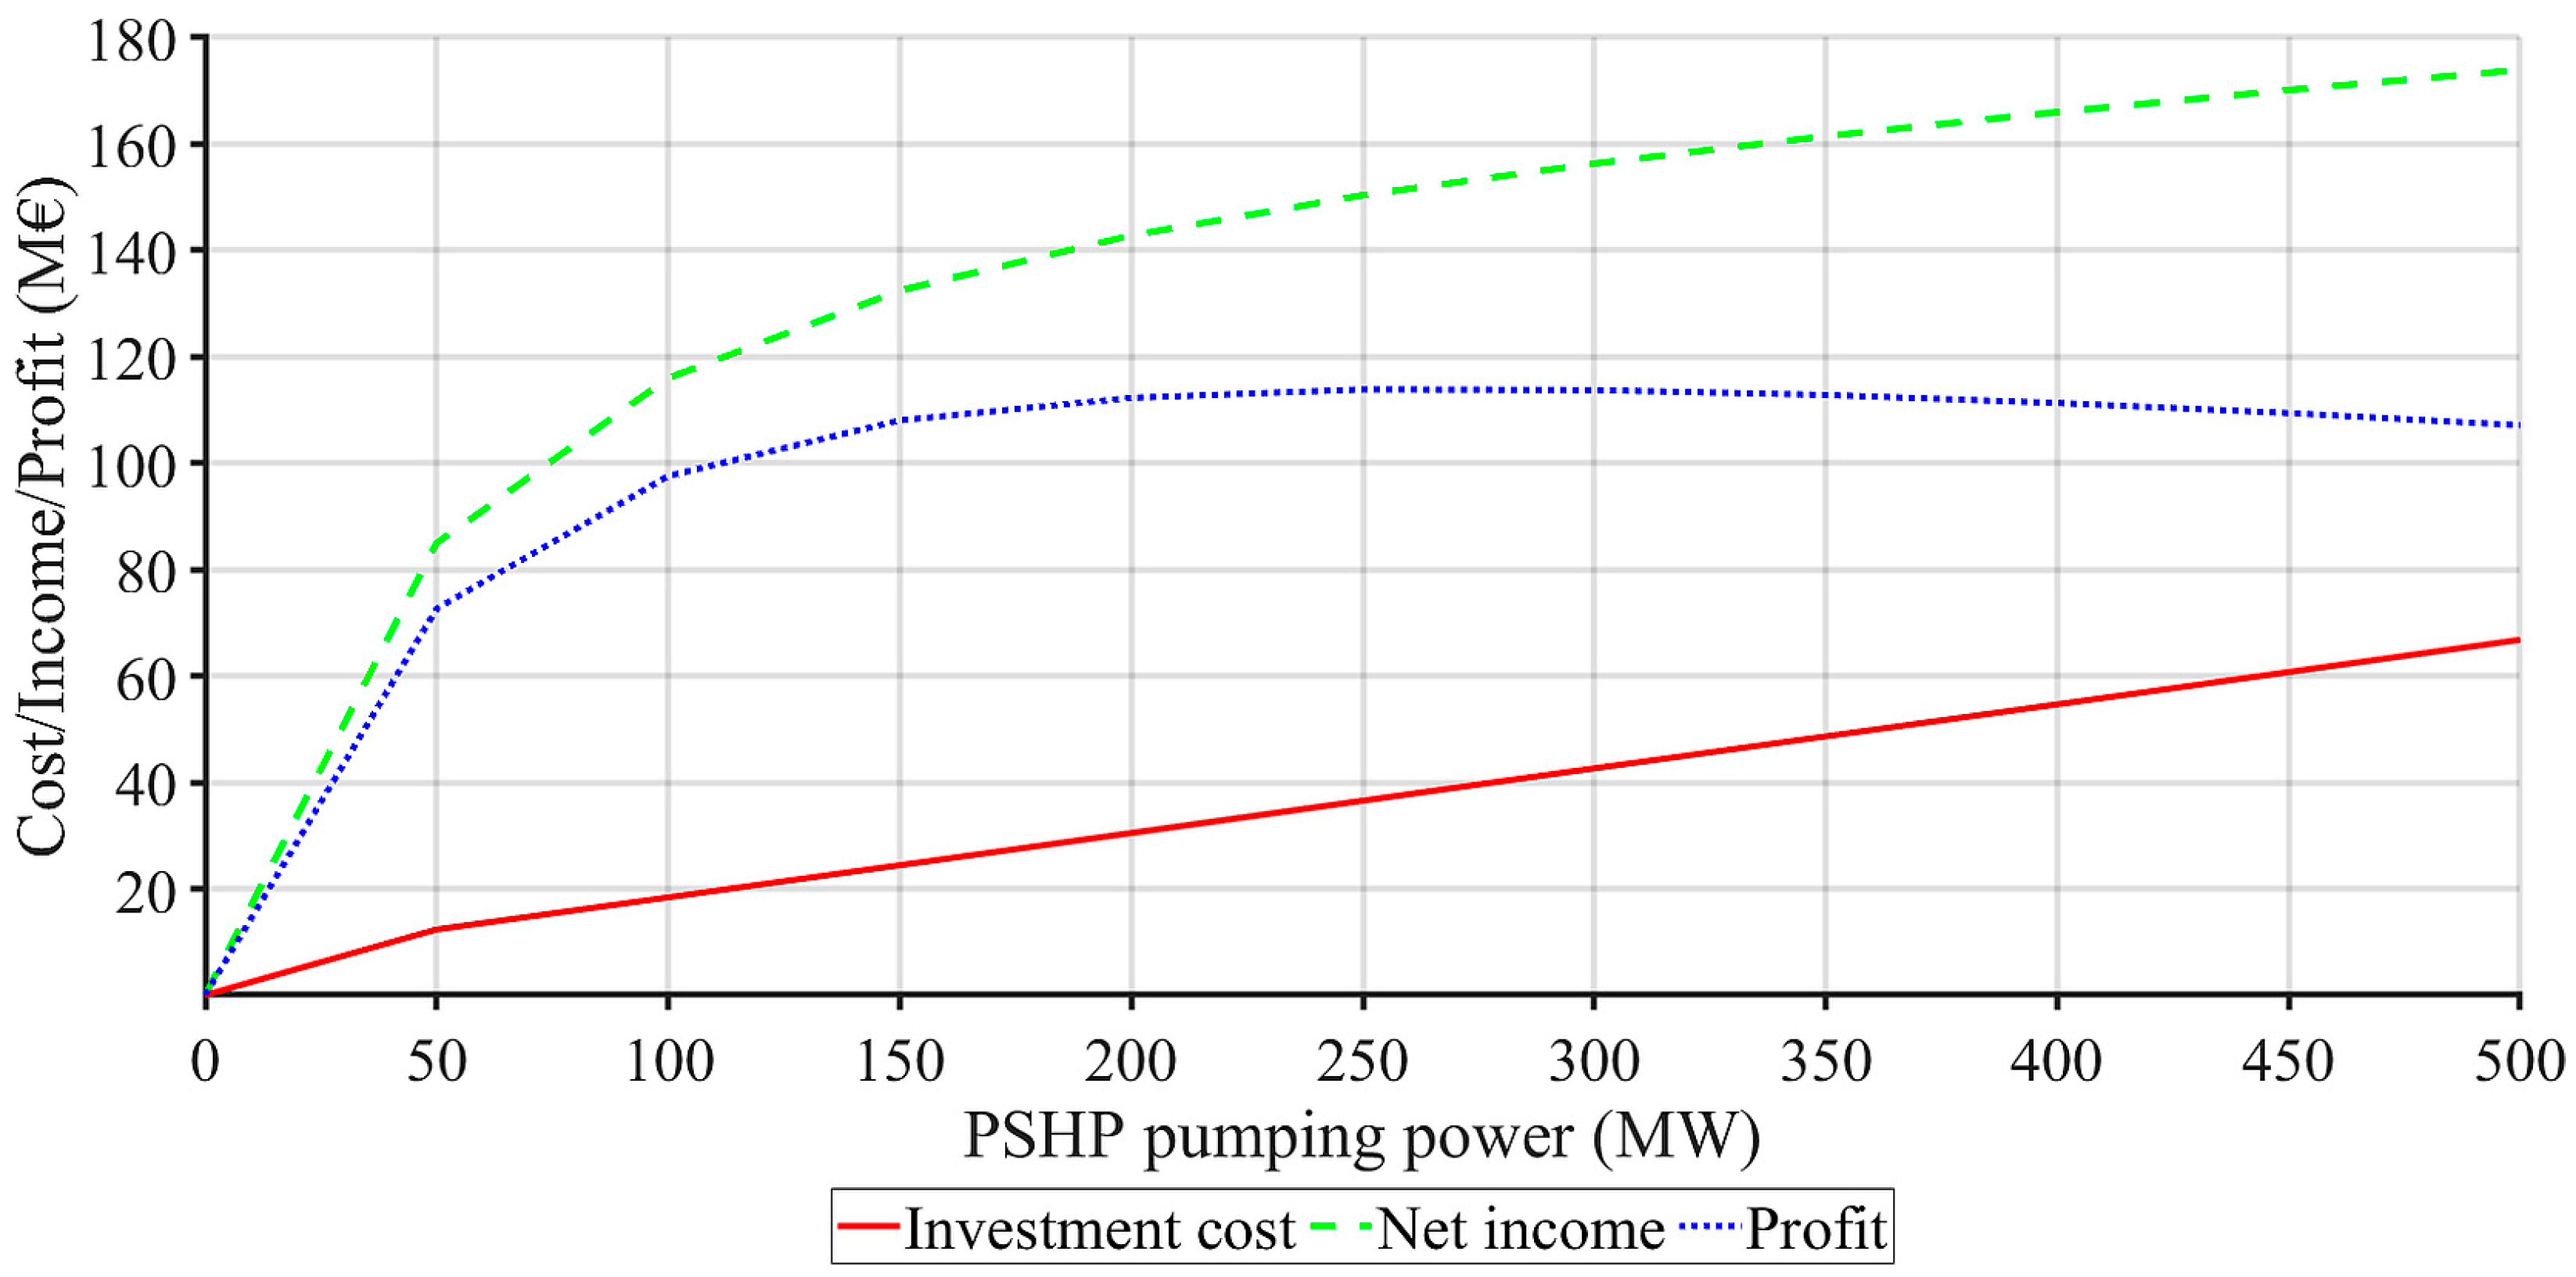
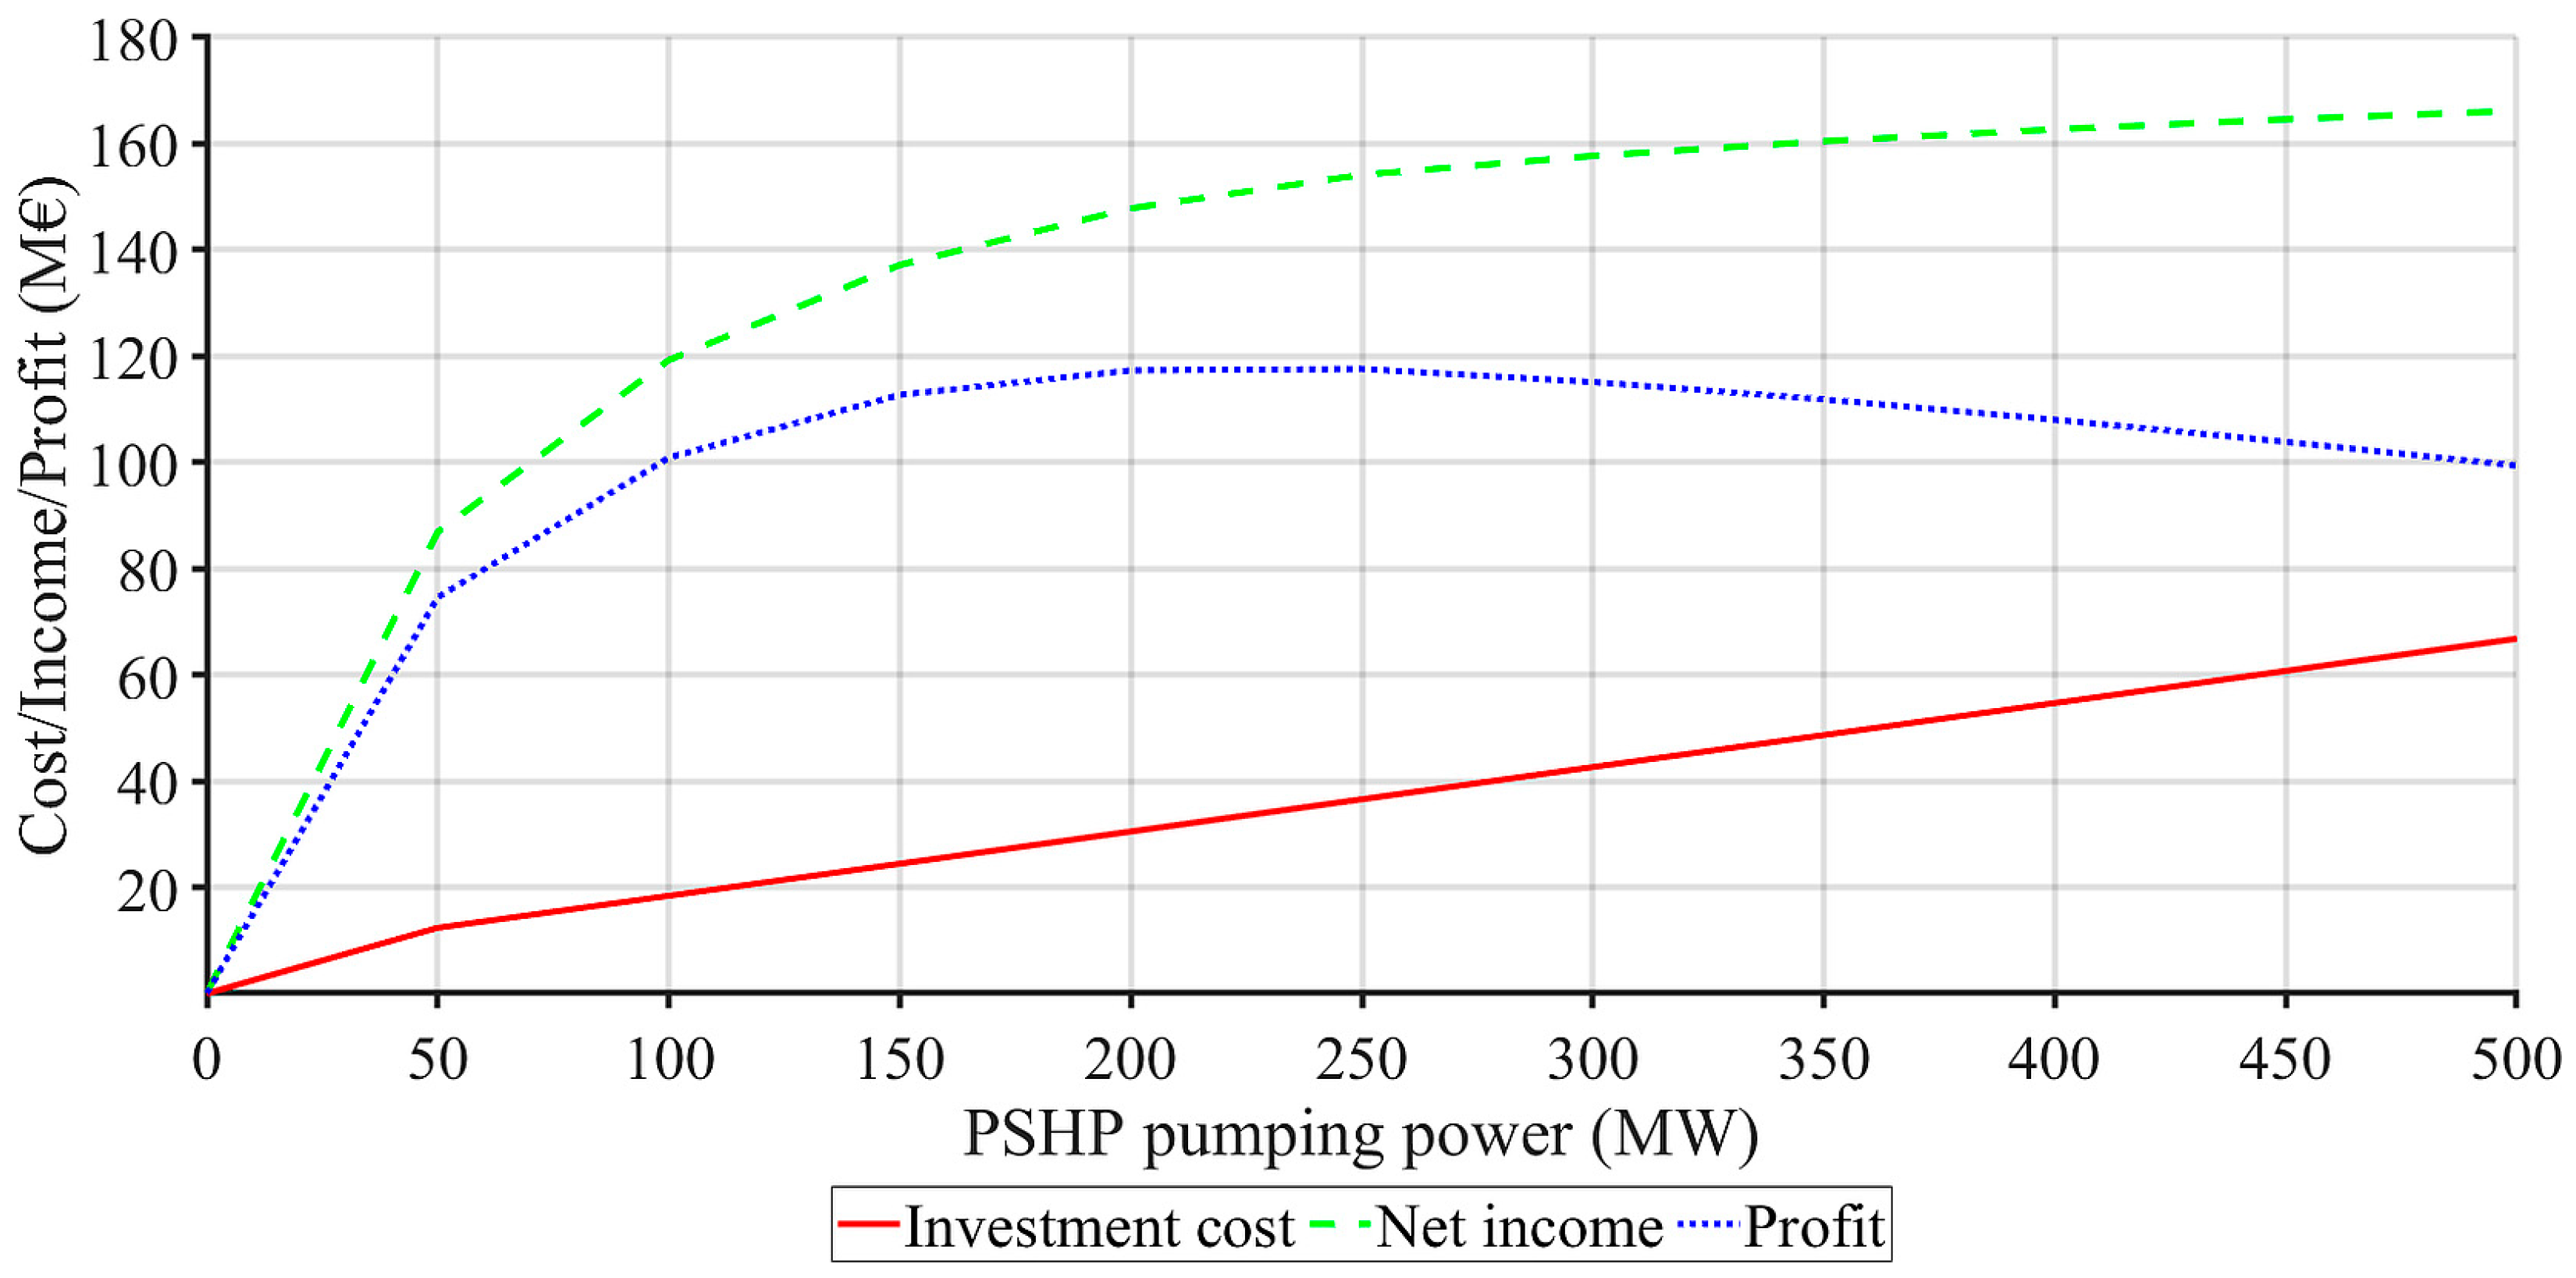
The results of the optimal storage size calculation for GENCO with the above defined portfolio in the power system without and with penalties for the BSS, as well as for the PSHP, are graphically presented in
Figure 7,
Figure 8,
Figure 9 and
Figure 10, respectively. In the presented diagrams:
The investment cost is the sum of the ESS cost per power and the ESS cost per stored capacity divided by the storage life in years. The lifetime for BSS was estimated at 20 years and for PSHP at 40 years. So, the investment cost represents the annual ESS investment cost. As the size of the ESS increases, the investment costs rise linearly;
The ESS net income represents the annual contribution of ESS operation, calculated as the difference between the operation of the GENCO with and without storage. In the same way as the net incomes of the 100 MW ESS were calculated in
Table 7, the net incomes of the EES of both types were calculated for the specified power range. As the size of the ESS increases, the net income also rises, initially at a rapid rate, and subsequently at a significantly slower pace;
Profit refers to the annual profit of EES, calculated as the difference between its annual net income and its annual investment costs. The profit curves are concave with a determinable maximum. For an extremely oversized ESS, the profit may even become negative.
The results of ESS annual profit calculations around the optimal storage size are additionally presented in
Table 10 and
Table 11 for BSS and PSHP, respectively.
Figure 7 and
Figure 8, as well as
Table 10, show that the optimal size of the BSS of GENCO with a given portfolio in the power system without the penalty clause is around 50 MW, and with the penalty clause in the power range from 50 to 75 MW. Analogously, it can be seen from
Figure 9 and
Figure 10, as well as
Table 11, that the optimal size of PSHP of the same GENCO in the power system without the penalty clause is in the power range of 250 to 300 MW, and with the penalty clause in the power range of 200 to 250 MW. It should be noted that the obtained values of the optimal storage size are highly dependent on the assumed ESS unit investment costs, as well as on the ESS estimated lifetime.
4. Conclusions
The sizing of a utility scale energy storage suitable for a mixed-portfolio GENCO operating in a market-oriented power system with high penetration of renewables is important for its market success. The proposed method considers several uncertain parameters, such as the production of renewable sources, spot market energy prices, ancillary services prices, and fuel prices, among others. It may also consider a penalty to the GENCO for non-delivered energy. By efficiently managing these uncertainties, the approach contributes to economic and environmental sustainability, supporting the transition towards cleaner and more resilient energy systems.
Numerical examples showed that the profit curves, calculated as the difference between the ESS annual net income and the EES annual investment costs, are concave in all study cases. Hence, the maximum of the profit curve or the optimal EES size for GENCO operation under the given conditions can be determined. Further investment in larger storage only reduces the profit, which may even become negative if ESS is extremely oversized. The influence of the ESS characteristics, as well as the power system operation rules on the optimal operation of a given GENCO and the optimal ESS size, are presented in several tables and diagrams.
The proposed GENCO optimal operation model and the proposed ESS sizing method can be used to calculate the profitability of GENCO investments in energy storage technologies, determine the optimal size and characteristics of a certain type of energy storage, compare different ESSs or variant solutions of an ESS, optimize the joint operation of production units and ESS, and more. The optimal storage size for a GENCO in the coming years can be investigated by simulating assumed future trends in market prices of energy, ancillary services, fuels, etc. This approach not only enhances the economic viability of VRES integration but also promotes sustainable development by optimizing resource utilization and reducing greenhouse gas emissions.


