Article

Temporal–Spatial Variations in Physicochemical Factors and Assessing Water Quality Condition in River–Lake System of Chaohu Lake Basin, China

1
School of Biological and Food Engineering, Hefei Normal University, Hefei 230061, China
2
Freshwater Fisheries Research Center, Chinese Academy of Fishery Sciences (CAFS), Wuxi 214081, China
3
Scientific Observing and Experimental Station of Fishery Resources and Environment in the Lower Reaches of the Changjiang River, Ministry of Agriculture and Rural Affairs, Wuxi 214081, China
*
Authors to whom correspondence should be addressed.
Sustainability 2025, 17(5), 2182; https://doi.org/10.3390/su17052182
Submission received: 9 January 2025 / Revised: 25 February 2025 / Accepted: 25 February 2025 / Published: 3 March 2025

Abstract

:
Eutrophication and algal blooms have frequently occurred in Chaohu Lake. Water parameters interact with eutrophication and algal blooms. However, there are few studies on the spatial–temporal characteristics of water parameters in the Chaohu Lake Basin. To assess the water quality of Chaohu Lake and its seven surrounding rivers, 132 samples from 33 sites were collected seasonally from September 2019 to July 2020, and 14 physicochemical parameters were detected. Our results showed that urban rivers had the highest nutrients, chemical oxygen demand (CODMn, 6.30 ± 0.80 mg/L), five-day biological oxygen demand (BOD5, 4.51 ± 0.42 mg/L), and chlorophyll a concentration (Chl a, 54.88 ± 39.81 μg/L); forested rivers had higher water transparency (137.83 ± 18.52 cm), lowest nutrients, CODMn (4.02 ± 0.20 mg/L), BOD5 (1.42 ± 0.14 mg/L), and Chl a (7.18 ± 1.41 μg/L); and agricultural and mixed rivers intermediate. Generally, the water quality was “good” and “light-eutrophic” according to the water quality index and trophic level index. The water quality order from good to worst in the season was spring > autumn and summer > winter. These results implied that urban rivers are still the main source of eutrophic nutrients in Chaohu Lake, and the control of urban pollutants is still the core of water quality management in Chaohu Lake.

1. Introduction

With the development of industry and agriculture, synthetic nutrient pollutants such as nitrates and phosphates are eventually discharged into natural rivers and lakes, aggravating the threat of freshwater quality, especially eutrophication [1,2]. The deterioration of freshwater quality has become a serious problem for global rivers, lakes, and coastal waters [3,4]. Adequate amounts of high-quality water resources are a prerequisite for economic development and ecological integrity. Freshwater resources are likely to become scarce in the future, threatening water resource use, especially for drinking water, and economic development [5,6]. Freshwater quality deterioration causes significant changes in the ecological structure and function of rivers and lakes, which leads to ecosystem degradation and water shortages, and seriously restricts the sustainable development of the river basin economy [1,7,8,9].
As the channel of material exchange and energy flow between terrestrial and lake ecosystems, rivers are the main drivers of lake eutrophication, receiving large amounts of domestic sewage, industrial wastewater, and agricultural runoff. Due to the central role of rivers in ecological and human health as well as economic development, it is necessary to collect reliable information on water quality variations for effective pollution control and resource management [10,11]. Therefore, highly heterogeneous water quality variations in rivers should be analyzed at a sufficient spatial scale [12,13].
Chaohu Lake, the fifth largest freshwater lake in China [14,15], plays an important role in commercial fishing, water supply, irrigation, navigation, tourism, and recreational activities throughout the region [15]. The precipitation in the Chaohu Lake Basin is unevenly distributed annually, with the most precipitation in summer and the least precipitation in winter [16]. Since the 1980s, with the development of industry, agriculture, and urbanization in the Chaohu Lake Basin, eutrophication and algal blooms have frequently occurred in the different areas of Chaohu Lake [17,18]. Therefore, it is one of the most eutrophic lakes in China and has attracted considerable attention. The change in water parameters not only provided essential conditions for the outbreak of algal blooms but also resulted from the outbreak of algal blooms [17]. Many studies on Chaohu Lake Basin have focused on physical (e.g., water temperature and SD), chemical (e.g., nutrients, dissolved organic matter, and toxic metals) [19,20,21,22,23], and biological (e.g., phytoplankton, zooplankton, and benthic macroinvertebrates) parameters [24,25,26]. However, there are few studies on the temporal and spatial distribution characteristics of water parameters in the Chaohu Lake Basin, especially on a large scale and in multiple sections. Exploring the spatial–temporal characteristics of water parameters in the Chaohu Lake Basin and their relationship to occurrence of algal blooms offers great theoretical and practical value for guiding water quality management in the Chaohu Lake Basin to avoid water quality deterioration and algal blooms [27].
The water quality index (WQI) was initially proposed by Horton [28] and Brown et al. [29] to evaluate water quality. The WQI has been widely used in surface and groundwater quality assessments, particularly in river and lake water quality assessments [30,31]. Compared with traditional water quality evaluation methods, the WQI effectively integrates multiple physical and chemical parameters into a single value that reflects the overall situation [32,33,34] and is widely used to detect the overall water quality status and water quality trends over time and space [30,35,36,37]. The trophic level index (TLI), calculated based on physicochemical and biological indices, is commonly used to evaluate the eutrophication state of lakes and reservoirs [38,39,40].
Cross-seasonal and regional monitoring data are vital for exploring the factors that lead to eutrophication [41,42] and managing freshwater resources [43,44,45]. For instance, water temperature (WT) is an essential factor affecting various physical and chemical processes and dynamic phenomena of aquatic systems and defines the aquatic type, biological community structure, and aquatic ecosystem productivity [45]. WT is mainly influenced by seasons, which are synchronous and highly correlated with the regional temperature [46]. Moreover, affected by seasonal differences in rainfall, the hydrology, water quality, and eutrophication of rivers and lakes also change [47]. To identify the key water parameters affecting eutrophication in the Chaohu Lake Basin and the main rivers that cause the eutrophication, this study evaluated the water quality of the river–lake system in the Chaohu Lake Basin using TLI and WQI across different seasons, and compared the evaluation results of TLI and WQI. The water parameters, TLI, and WQI of the Chaohu Lake and its seven surrounding rivers were systematically investigated across seasons in this study, and our results provide an important scientific basis for comprehensive water environment management and protection in the Chaohu Lake Basin.

2. Materials and Methods

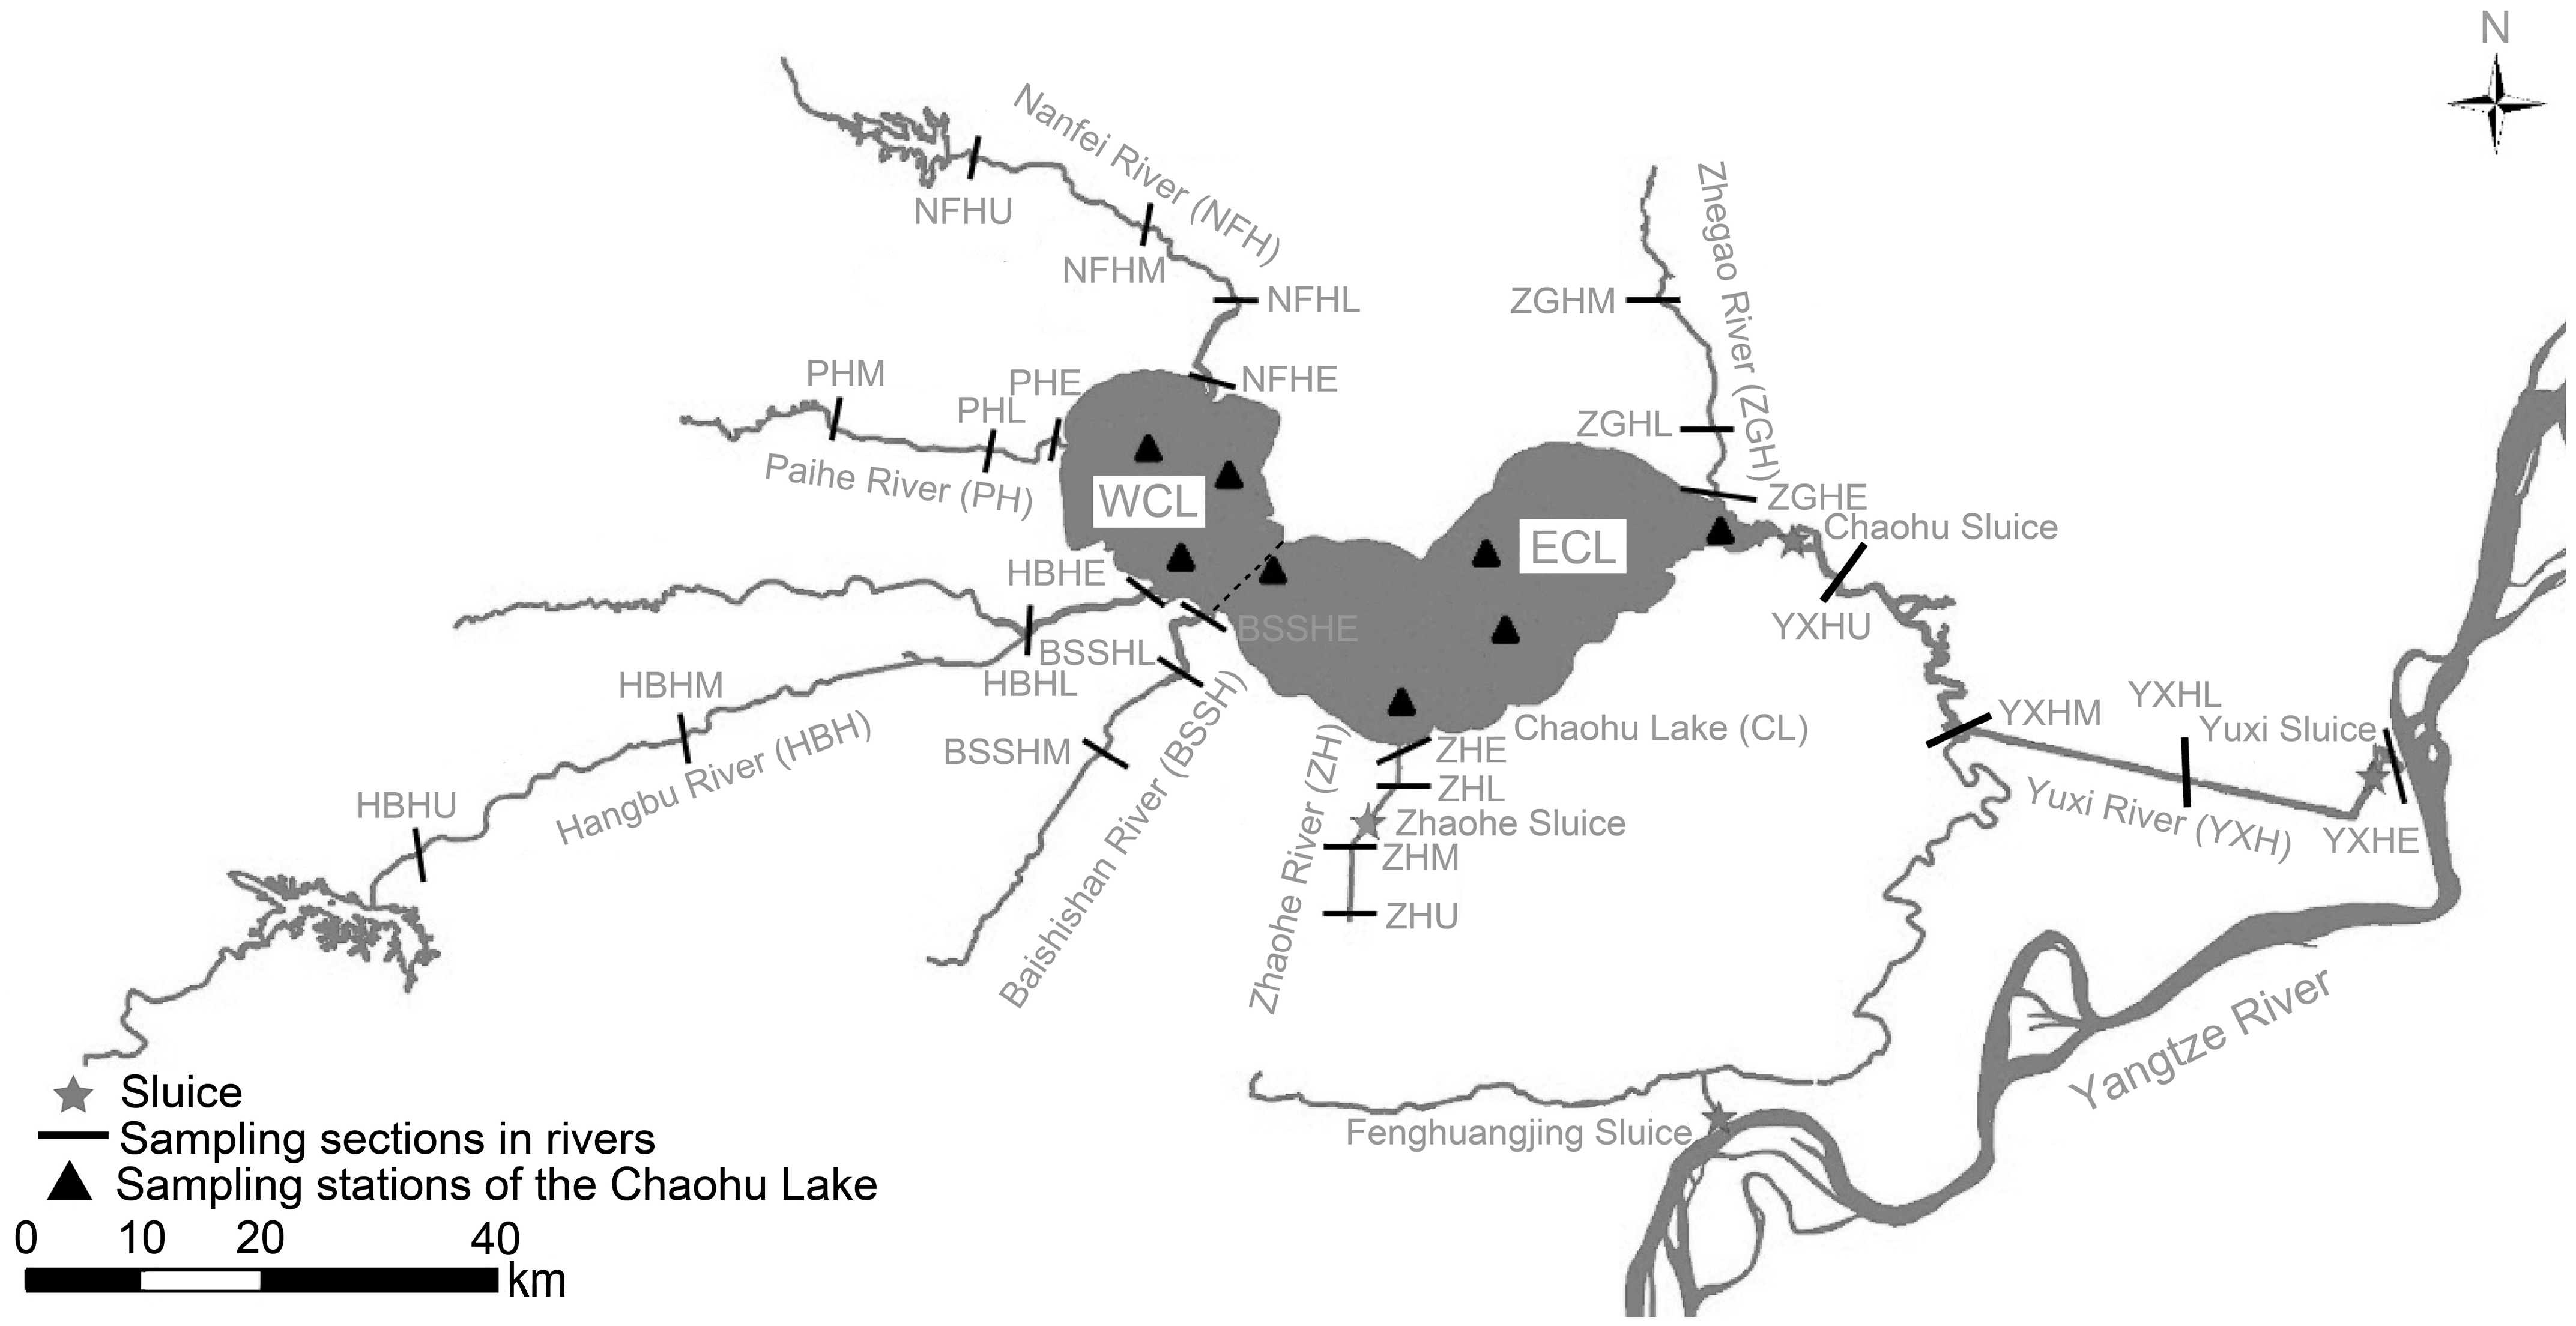
2.1. Study Area and Sample Collection

The Chaohu Lake Basin (30°58′–32°06′ N, 116°24′–118°00′ E) is located in the middle of the Anhui Province, China, and covers a total area of 13,350 km2. The annual average temperature in the Chaohu Lake Basin is 15–16 °C, which corresponds to the transitional subtropical monsoon climate between subtropical and warm temperate zones. The total population in the basin has reached 15.4 million [48]. The Chaohu Lake is separated into Eastern Chaohu Lake and Western Chaohu Lake from Zhongmiao Temple to Qitouzui Cape. Because Hefei City, the capital of Anhui Province, discharges industrial and municipal effluents there as its final destination, the pollution of the Chaohu Lake diminishes from west to east. Thirty-three rivers feed on Chaohu Lake primarily, and the majority are connected to it. These rivers can generally be split into seven river systems: Nanfei, Paihe, Hangbu, Baishishan, Zhaohe, Yuxi, and Zhegao river systems. The water from the lake enters the Yangtze River through the Yuxi River. The characteristics of the Chaohu Lake and seven rivers in the Chaohu Lake Basin are listed in Table S1. The land use varies among the seven river systems [49]. Land use in the catchment is mainly dominated by farmland (approximately 70%), followed by urban land to the west and east of the lakeshore [14]. The Nanfei River and Paihe River flowed through Hefei City and Feixi County, respectively. The Nanfei River and Paihe River are severely polluted. Farmlands primarily surround the upper reaches of the two rivers, whereas cities and towns envelop the middle and lower reaches. Thus, the middle and lower reaches are stressed from multiple anthropogenic sources, including untreated domestic and industrial wastewater discharge, built-up areas dominate in the Nanfei River and Paihe River, and their water quality is mainly controlled by urban pollution. The water quality of the Hangbu River and Baishishan River, which are both in the southwest mountain region, is mostly regulated by soil and water conservation. Forestland is primarily present in the Hangbu River. The water quality in the Zhegao River and Zhaohe River, which are located east of the Chaohu Lake, is mostly regulated by non-point source pollution. The four principal rivers (Baishishan River, Hangbu River, Paihe River, and Nanfei River) that flow into the Chaohu Lake from the west account for more than 80% of the total volume among the six rivers that flow into the lake [50].
Zhang et al. [49] divided the river reaches into urban, agricultural, forested, and mixed reaches. Distinctions were made according to the landscape composition of the watersheds draining into the sampling sites. Four categories—forested (forests > 50%), agricultural (cropland > 60%), urban (urban > 20%), and mixed (forest ≤ 50%, cropland ≤ 60%, and urban ≤ 20%) watersheds—were sorted in this study, and their main streams were identified as corresponding riverine types. The Nanfei River and Paihe River were designated as urban reaches, the Hangbu River as a forested reach, the Baishishan River and Zhaohe River as agricultural reaches, the Zhegao River as a mixed reach, entrance and upper reaches of the Yuxi River as mixed reaches, and the middle and lower reaches of the Yuxi River as forested reaches.
Water samples were collected at 0.2 m below the water surface in September 2019 (autumn), January 2020 (winter), April 2020 (spring), and July 2020 (summer). A total of 33 sampling sites were set in the Western Chaohu Lake (n = 4), Eastern Chaohu Lake (n = 4), Nanfei River (n = 4), Paihe River (n = 3), Hangbu River (n = 4), Baishishan River (n = 3), Zhaohe River (n = 4), Yuxi River (n = 4), and Zhegao River (n = 3; Figure 1 and Table S2).

2.2. Laboratory Analyses of Water Physicochemical Parameters

WT (°C), conductivity (Cond, μS/cm), dissolved oxygen (DO, mg/L), and pH were measured in situ using a portable multiparameter water quality meter (YSI Professional Plus, Yellowspring, OH, USA). Water transparency was measured as Secchi depth (SD, cm) using a Secchi disk with a diameter of 25 cm. An amount of 1.5 L of surface water samples was collected at each sampling site using a 2.5 L plexiglass sampler, stored in an incubator filled with ice, and then transported to the laboratory for further analysis within 48 h. Total nitrogen (TN, mg/L), ammonia (NH4-N, mg/L), nitrate (NO3-N, mg/L), nitrite (NO2-N, mg/L), total phosphorus (TP, mg/L), orthophosphate (PO4-P, mg/L), chemical oxygen demand (CODMn, mg/L), five-day biological oxygen demand (BOD5, mg/L), and chlorophyll a concentration (Chl a, μg/L) were measured at the Taihu Laboratory for Lake Ecosystem Research (Wuxi, China) according to standard methods [51]. Details of the analytical methods are presented in Table S3.

2.3. Evaluation Method of Nutritional Status of Rivers and Lakes

The TLI was calculated as follows:
T L I ( Σ ) = j = 1 m W j × T L I ( j )
W j = r i j 2 / j = 1 m r i j 2
where Wj is the correlative weight of the TLI of j, TLI(j) is the TLI of j, rij is the correlation coefficient between the reference Chl a and each parameter j (i.e., Chl a, 1; TP, 0.84; TN, 0.82; SD, −0.83; and CODMn, 0.83), and m is the number of water parameters [52,53].
Each TLI(j) is established as follows:
T L I ( C h l . a ) = 10 × ( 2.5 + 1.086 × l n C h l . a )
T L I ( T P ) = 10 × ( 9.436 + 1.624 × l n T P )
T L I ( T N ) = 10 × ( 5.453 + 1.694 × l n T N )
T L I ( S D ) = 10 × ( 5.118 1.94 × l n S D )
T L I ( C O D M n ) = 10 × ( 0.109 + 2.661 × l n C O D M n )
where the units of Chl a and SD are µg/L and cm, respectively, and the units of TP, TN, and CODMn are mg/L [52,53].
The TLI (∑) ranged from 0 to 100, with high values indicating high eutrophication. Based on the TLI (∑) value, the trophic status was classified as oligotrophic (TLI (∑) < 30), mesotrophic (30 ≤ TLI (∑) < 50), light-eutrophic (50 ≤ TLI (∑) < 60), mid-eutrophic (60 ≤ TLI (∑) < 70), or hypereutrophic (TLI (∑) ≥ 70) [53].
WT, DO, pH, Cond, TN, TP, PO4-P, NH4-N, NO3-N, NO2-N, CODMn, and BOD5 were normalized and used to calculate the WQI as follows:
W Q I = i = 1 n C i P i i = 1 n P i
where n is the total number of water parameters, Ci is the normalized value of water parameter i, and Pi is the weight of the water parameter i. The Pi values used in this study ranged from 1 to 4 (Table S4) [28,41,54]. Based on the WQI, the water quality was classified as very poor (0–25), poor (26–50), moderate (51–70), good (71–90), and excellent (91–100). A higher WQI value indicates a better water quality.

2.4. Statistical Analysis

The results are expressed as mean ± standard error. The Shapiro–Wilk normality test and Bartlett test were conducted using R 4.2.3 to test data normality and homogeneity of variance, respectively. One-way ANOVA with post hoc Duncan’s test was conducted using R 4.2.3, when the data were normally distributed and the variances were homogeneous. Otherwise, the Kruskal–Wallis rank sum test with Dunn’s post hoc test was conducted using the R FSA package. Principal component analysis (PCA) was used to detect water quality patterns and relationships among individual parameters using “FactoMineR” and “factoextra” functions. Pearson’s correlation analysis was performed to identify the key water quality parameters contributing to the WQI and TLI [36]. Differences were considered statistically significant at p < 0.05.

3. Results

3.1. Spatiotemporal Distribution Pattern of Water Quality Parameters

Except for CODMn, BOD5, and Chl a, the other water parameters were significantly different among seasons (Two-way ANOVA, p < 0.05; Table 1). The WTs in winter and summer were significantly lower and higher, respectively, than those in the other seasons (p < 0.05; Figure 2A). In the Eastern Chaohu Lake, Western Chaohu Lake, and Hangbu River, DO concentrations in winter were significantly higher than in other seasons, whereas in the Paihe River, the DO concentrations in winter were significantly lower than in other seasons. In the Baishishan River, the DO concentrations in autumn were significantly lower than those in the other seasons (p < 0.05; Figure 2B). The Chaohu Lake and seven rivers were mildly alkaline, and the pH was the highest in the Chaohu Lake (Figure 2C). Conductivities in winter and spring were significantly higher than those in summer and autumn in the Chaohu Lake and rivers, except for the Nanfei River and Paihe River, which had the highest values compared to the Chaohu Lake and the other rivers (Figure 2D). TN and NH4-N were the highest in the Paihe River and Nanfei River, followed by the Zhaohe River, Baishishan River, Yuxi River, Zhegao River, Western Chaohu Lake, and Eastern Chaohu Lake, and the lowest values were observed in the Hangbu River (Figure 2E,H). NO3-N was also the highest in the Paihe River and Nanfei River. TN, NH4-N, and NO3-N were generally higher in winter than in the other seasons, particularly in the Nanfei River and Paihe River (p < 0.05; Figure 2E,H,I). The highest NO2-N values were observed in the Paihe River, Nanfei River, and summer samples in the Zhaohe River, whereas the lowest average values were observed in the Western Chaohu Lake and Eastern Chaohu Lake. Generally, NO2-N concentrations were higher in summer than in winter or autumn (Figure 2J). TP concentrations showed a similar trend to TN at these stations, whereas TP concentrations in autumn were generally higher than those in other seasons (Figure 2F). PO4-P concentrations were significantly higher in the Nanfei River (0.079 ± 0.086 mg/L) and the Paihe River (0.064 ± 0.038 mg/L) than in the Chaohu Lake and other rivers, and PO4-P concentrations in summer (Eastern Chaohu Lake, Hangbu River, Yuxi River, and Zhegao River) and autumn (Western Chaohu Lake, Baishishan River, and Zhaohe River) were significantly higher than those in the other three seasons (Figure 2G). In the Paihe River, the mean concentration of CODMn was 7.34 ± 6.20 mg/L. This value was higher than the CODMn concentrations in the Chaohu Lake and six other rivers, which had mean values ranging from 3.81 mg/L to 5.75 mg/L (Figure 2K). Chl a showed a trend similar to that of CODMn at these stations (Figure 2M). The seasonal variation trends in BOD5 concentrations in the Eastern Chaohu Lake and Western Chaohu Lake were opposite to those in the Paihe River and Hangbu River (Figure 2L). The SD in the Hangbu River (annual mean 176.76 ± 87.88 cm) was significantly higher than that in the Chaohu Lake and other rivers (p < 0.005; Figure 2N).

3.2. Water Quality Patterns Based on Water Parameters

According to Zhang et al. [49], the river reaches in the Chaohu Lake Basin were divided into urban, agricultural, forested, and mixed reaches. Generally, urban rivers exhibited the highest nutrients (5.35 ± 0.35 mg/L of TN, 2.36 ± 0.24 mg/L of NO3-N, 0.23 ± 0.03 mg/L of NO2-N, 1.75 ± 0.32 mg/L of NH4-N, 0.20 ± 0.02 mg/L of TP, and 0.073 ± 0.013 mg/L of PO4-P; p < 0.05; Figure S1), CODMn (6.30 ± 0.80 mg/L, p < 0.05; Figure S1N), BOD5 (4.51 ± 0.42 mg/L, p < 0.05; Figure S1O), and Chl a (54.88 ± 39.81 μg/L, p < 0.05; Figure S1P); forested rivers had the highest water transparency (137.83 ± 18.52 cm, p < 0.05; Figure S1F), and lowest nutrients (1.55 ± 0.13 mg/L of TN, 0.56 ± 0.09 mg/L of NO3-N, 0.05 ± 0.01 mg/L of NO2-N, 0.34 ± 0.04 mg/L of NH4-N, 0.06 ± 0.01 mg/L of TP, and 0.021 ± 0.004 of PO4-P; Figure S1), CODMn (4.02 ± 0.20 mg/L, p < 0.05; Figure S1N), BOD5 (1.42 ± 0.14 mg/L, p < 0.05; Figure S1O), and Chl a (7.18 ± 1.41 μg/L, p < 0.05; Figure S1P); and agricultural and mixed rivers intermediated between the two former groups.
PCA profiles indicated that, generally, the correlations between samples were similar across seasons, especially the correlations between the samples collected in the Paihe River and Nanfei River and other samples. In spring, the first two principal components (PCs, denoted as Dims) explained 66.1% of the total variance in the water quality. Except for the samples collected from the Paihe River, the other samples overlapped. PC1 was positively correlated with TN (0.92), TP (0.89), BOD5 (0.88), NO3-N (0.82), NO2-N (0.79), and Chl a (0.78). PC2 was negatively correlated with pH (−0.85), DO (−0.68), and WT (−0.61). The Nanfei River and Paihe River were distinct from the Chaohu Lake and the rest of the rivers (Figure 3A). Specifically, the Nanfei River had distinctive water quality with relatively high TN, TP, PO4-P, NO3-N, NO2-N, Cond, BOD5, and CODMn, whereas the Paihe River had relatively high water quality parameters (except SD). The Hangbu River was distinguished from the others with relatively high SD. The Chaohu Lake and the other rivers had similar water quality characteristics (Figure 3A).
In summer, the first two PCs explained 61.4% of the total variance. Although the samples collected from the Paihe River were not completely separated from those collected from the Nanfei River, the samples collected from the Paihe River were still clearly distinguished from the other samples. Moreover, the samples collected from the Hangbu River were distinguished from the other samples. TN (−0.93), TP (−0.91), BOD5 (−0.79), Cond (−0.75), CODMn (−0.73), and NH4-N (−0.69) were highly correlated with PC1. DO (0.72), Chl a (0.67), and PO4-P (−0.62) were correlated with PC2. The water quality patterns of the Chaohu Lake and seven rivers were similar to those of the spring (Figure 3B).
In autumn, the first two PCs explained 69.7% of the total variance in the water quality. TN (−0.92), TP (−0.85), BOD5 (−0.79), Cond (−0.79), NH4-N (−0.72), NO2-N (−0.72), and CODMn (−0.71) were correlated with PC1. pH (0.90), Chl a (0.76), and DO (0.70) were correlated with PC2. The first two PCs divided the Chaohu Lake and rivers into four groups: the group including the Nanfei River, Paihe River, and Baishishan River, which were distinguished from others with relatively high TN, TP, PO4, NO3-N, and NO2-N; the group containing the Hangbu River, which had relatively high SD; the group including the Zhaohe River, Western Chaohu Lake, and Eastern Chaohu Lake, which were relatively high in TP, BOD, CODMn, pH, DO, and Chl a; and the Yuxi River and Zhegao River, which were intermediate between the groups (Figure 3C).
In winter, the first two PCs explained 79.9% of the total variance in the water quality. NH4-N (0.97), WT (0.90), NO3-N (0.89), NO2-N (0.86), TN (0.85), TP (0.85), BOD5 (0.82), PO4-P (0.81), DO (-0.87), and pH (-0.78) correlated with PC1, whereas CODMn (0.70), Chl a (0.81), and SD (−0.83) correlated with PC2. The first two PCs divided the Chaohu Lake and rivers into four groups: the first group included the Nanfei River and Paihe River; the second group included the Hangbu River; the third group included the Yuxi River, Baishishan River, Zhaohe River, and Zhegao River; and the fourth group included the Western Chaohu Lake and Eastern Chaohu Lake. Similarly to the other seasons, the Nanfei River and Paihe River in winter were clearly distinct from the Chaohu Lake and other rivers, which had relatively high TN, TP, PO4-P, NH4-N, NO3-N, NO2-N, Cond, BOD5, WT, and CODMn; the Hangbu River had relatively high SD, and the Western Chaohu Lake and Eastern Chaohu Lake had high DO, pH, and Chl a (Figure 3D). The Baishishan River, Yuxi River, Zhegao River, and Zhaohe River were intermediate among the other groups.

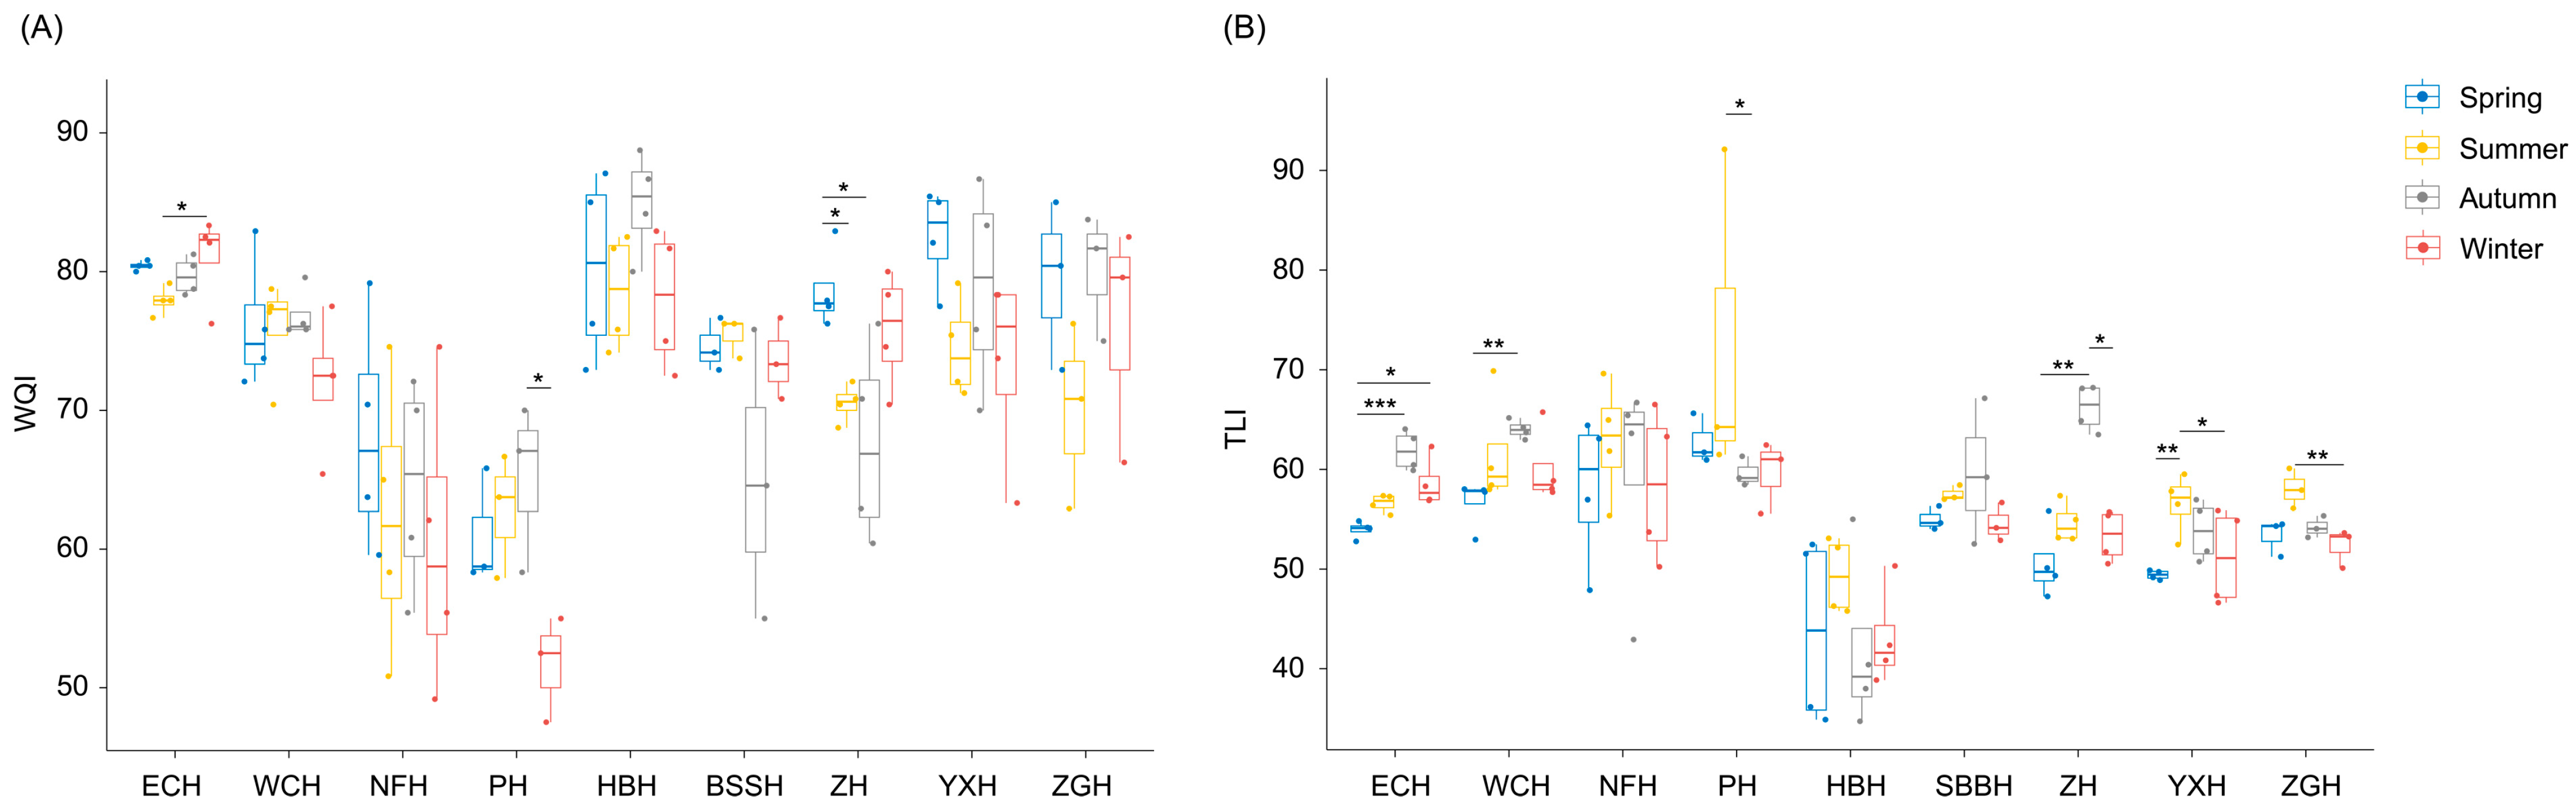
3.3. TLI and WQI of the Chaohu Lake and River Water

According to the WQI, among the 132 samples collected from 33 sampling sites in four seasons, the water qualities of 99 (75%), 31 (23.5%), and 2 (1.5%) samples were classified as good, moderate, and poor, respectively. Percentages of 85%, 76%, 67%, and 73% of the samples were classified as good water in spring, summer, autumn, and winter, respectively (Figure 4A). According to the WQI, samples collected from the Nanfei River and Paihe River were classified as moderate water, and samples collected from the Chaohu Lake and other rivers were classified as good. The order of water quality was as follows: Hangbu River (80.44) > Eastern Chaohu Lake (79.77) > Yuxi River (77.34) > Zhegao River (76.42) > Western Chaohu Lake (75.23) > Zhaohe River (73.15) > Baishishan River (72.19) > Nanfei River (63.83) > Paihe River (60.14). For the seasons, the order of water quality was spring (76.06) > autumn (73.99) > summer (72.21) > winter (71.72).
According to the TLI, the water qualities of 20 (15.15%), 76 (57.58%), 35 (26.52%), and 1 (0.75%) samples were classified as mesotrophic, light-eutrophic, mid-eutrophic, and hypereutrophic, respectively. The water qualities of 84.8%, 72.7%, 51.5%, and 81.8% of the samples were classified as light-eutrophic in spring, summer, autumn, and winter, respectively (Figure 4B). The samples collected from the Hangbu River were classified as mesotrophic water, those collected from the Western Chaohu Lake and Paihe River were classified as mid-eutrophic water, and those collected from the Eastern Chaohu Lake and other rivers were classified as light-eutrophic water. The order of water quality was the Hangbu River (44.55) > Yuxi River (52.75) > Zhegao River (54.48) > Zhaohe River (56.20) > Baishishan River (56.69) > Eastern Chaohu Lake (57.77) > Nanfei River (59.79) > Western Chaohu Lake (60.59) > Paihe River (63.68). For the seasons, the order of water quality was spring (53.44) > winter (54.51) > autumn (57.90) > summer (58.53).
For the seven rivers, the evaluation results based on WQI were highly consistent with the results based on TLI, i.e., the water quality of Hangbu River was the best, followed by the Zhegao River, Yuxi River, Zhaohe River, and Baishishan River, and Paihe River and Nanfei River were the worst; the water quality of the Zhegao River and Yuxi River were better than those of the Zhaohe River and Baishishan River. The water quality of the Eastern Chaohu Lake was better than that of the Western Chaohu Lake. However, for seasons, although both water quality indices showed that spring had the best water quality, there were differences in the other three seasons.
Water quality parameters that were predominant in determining the WQI or TLI scores varied among the seasons. In spring, summer, autumn, and winter, the key contributing parameters to the WQI were TN (−0.90), BOD5 (−0.86), TP (−0.84), NO2-N (−0.76), NO3-N (−0.75), PO4-P (−0.74), NH4-N (−0.72), CODMn (−0.71), and Cond (−0.70); DO (0.74), BOD5 (−0.87), NO2-N (−0.69), Cond (−0.67), PO4-P (−0.66), NH4-N (−0.65), TP (−0.62), and TN (−0.59); TN (−0.79), NO2-N (−0.76), TP (−0.74), NH4-N (−0.73), BOD5 (−0.68), PO4-P (−0.60), and DO (0.42); and TN (−0.87), TP (−0.86), NH4-N (−0.86), NO3-N (−0.85), BOD5 (−0.84), NO2-N (−0.82), WT (−0.81), DO (0.77), PO4-P (−0.75), Cond (−0.72), and pH (0.71), respectively (Figure 5). However, the key parameters contributing to TLI were TP (0.79), CODMn (0.75), and SD (−0.75); TN (0.86), CODMn (0.85), TP (0.83), and SD (−0.59); CODMn (0.90), TP (0.73), and SD (−0.86); and CODMn (0.78), TP (0.65) and SD (−0.82), respectively (Figure 5).

4. Discussion

4.1. Water Qualities and Patterns Based on Water Parameters

According to the individual parameters, the water quality in the Chaohu Lake and seven rivers exhibited clear spatial and temporal patterns (Figure 2). The WT in winter was lower than that in the other seasons, whereas DO, SD, Cond, BOD5, TN, NH4, and NO3-N exhibited a reverse seasonal pattern. TP, PO4-P, NO2-N, CODMn, and Chl a had the highest value in the summer. In all seasons, Cond, CODMn, BOD5, Chl a, and most nutrients exhibited a clear declining trend from the urban rivers to agricultural and mixed rivers, and finally to forest rivers, whereas SD exhibited an increasing trend. In winter, the Chaohu Lake was distinguished from the Baishishan River, Zhaohe River, Zhegao River, and Yuxi River. This pattern was similar to previous findings in the Chaohu Lake Basin [14,19,55].
Zhang et al. [55] identified urban rivers as emission hotspots in the Chaohu Lake Basin. Several studies have documented that the highest greenhouse gas emissions (N2O, CH4, and CO2) are often observed in rivers surrounded by highly urbanized regions [56,57,58,59]. Their areal greenhouse gas emissions can be several tens of times those reported in nearby less-urbanized rivers, such as forested and zero-order agricultural rivers [60,61]. In the present study, the Chaohu Lake and two urban rivers, the Nanfei River and Paihe River, had higher WT than other rivers, which was generally consistent with these previous studies.
Nutrients, such as the bioavailable forms of phosphorus (PO4-P) and inorganic nitrogen (NH4-N, NO3-N, and NO2-N), are important factors that affect water quality [62]. Moreover, they play an important role in the eutrophication of natural freshwater bodies [63]. PO4-P can be quickly absorbed by plants and generally has a greater influence on eutrophication than does nitrogen [64]. TN, NH4-N, NO3-N, NO2-N, TP, and PO4-P were the highest in the Nanfei River and Paihe River, followed by the Zhaohe River, Baishishan River, Yuxi River, Zhegao River, Western Chaohu Lake, and Eastern Chaohu Lake, and the lowest values were observed in the Hangbu River. Urban rivers usually receive large amounts of nutrients from various sources. The Nanfei River and Paihe River flowed through the main urban areas of Hefei City and Feixi County, respectively. Multiple anthropogenic pollutants were discharged into the two rivers, so the Nanfei River and Paihe River were the difficult points of pollution control in the Chaohu Lake Basin [65]. The conductivities of the Nanfei River and Paihe River were also the highest. High conductivity values usually indicate that water has a stronger current conduction capacity, which may indicate that it is more suitable for the rapid decomposition of organic matter produced by microorganisms [66,67]. BOD5 and CODMn tests predict oxygen requirements during the decomposition of organic matter and oxidation of inorganic chemicals [68]. The Nanfei River and Paihe River had higher values of CODMn and BOD5 than those in the Chaohu Lake and other rivers.
Synoptic and seasonal variations in water parameters have been widely reported [14,69]. For instance, Wu et al. [14] indicated that the WQI in autumn was highest in the Chaohu Lake Basin, Yang et al. [48] indicated that the concentrations of NH4-N, TN, and TP ranked highest in winter and spring, followed in summer and lowest in autumn in the Chaohu Lake Basin. In this study, TN, NH4-N, and NO3-N were generally higher in winter (dry season) than in spring, summer, and autumn. It is generally considered that water fluidity is poor, and the water nutrition level is high during the dry season. These seasonal variations are probably caused by seasonal fluctuation in water temperature and precipitation [69].
Based on the survey data from 2012 to 2018, Zhang et al. [70] showed that the spatial distribution pattern of eutrophication in the Chaohu Lake still exhibited a trend of gradual decrease from west to east, but this trend has obviously slowed down because the nutrient level in the middle and east increased significantly, which reduced the spatial difference in eutrophication in the Chaohu Lake, and pointed out that the TP loads of the Zhaohe River and Zhegao River increased, which was the most direct factor leading to the increase in nutrient levels in the central and eastern lake areas in the Chaohu Lake. Consistent with the above study, our results indicated that the concentrations of Chl a, CODMn, and nutrients in the Western Chaohu Lake were higher than those in the Eastern Chaohu Lake. The main reason was that the nutrients in the Western Chaohu Lake were mainly imported from the Nanfei River, Paihe River, and Baishishan River, whereas the nutrients in the Eastern Chaohu Lake were mainly imported from the Zhegao River and Zhaohe River, and exported from the Yuxi River.
The Hangbu River and Baishishan River are located in the clear water-producing area of the southwest mountainous area of the Chaohu Lake and are the main sources of clear water in the Chaohu Lake. The cultivated land area accounted for 81.12% of the total area of the basin. A large amount of phosphorus fertilizer is applied to the river through rainwater scouring and surface runoff, resulting in a higher TP content in the Baishishan River than in other rivers [19]. The water quality of these two rivers is controlled mainly by soil and water conservation [19]. The water qualities of the Zhegao River and Zhaohe River were mainly controlled by non-point source pollution [19]. The pollution grades of the Baishishan River, Zhegao River, and Zhaohe River are higher than those of the Hangbu River but lower than those of other rivers around the lake [19]. In this study, nitrogen and phosphorus nutrients in the Baishishan River, Zhegao River, and Zhaohe River were followed only to the Nanfei River and Paihe River. This indicated that the Baishishan River and Zhaohe River have been polluted to some extent. The Zhaohe River is an artificial river located in Lujiang County. The Zhaohe River flows through Baihu farm, and there are large areas of agricultural fields around it; the excessive application of pesticides and chemical fertilizers to the Zhaohe River through farmland irrigation, rain erosion, and surface runoff causes serious water pollution.
The three rivers with low nutrient contents in this study were the Hangbu River, Zhegao River, and Yuxi River. The Hangbu River is a forest reach, which has the largest amount of water, longest length, and widest drainage area in the Chaohu Lake Basin, accounting for approximately 55.5% of the total runoff in the Chaohu Lake Basin. The zonal vegetation type is north subtropical mixed forest, with high vegetation coverage on both sides of the river, less industrial and agricultural wastewater and domestic sewage discharge around the open river surface, and a strong self-purification ability of water bodies [71]. Therefore, the Hangbu River had the highest SD and lowest concentrations of Chl a, CODMn, BOD5, and nutrients. The Yuxi River is the only channel for the Chaohu Lake Basin to enter the Yangtze River. The estuary and upper reaches are mixed river sections, while the middle and lower reaches are forest river sections. The industrial and agricultural pollution on both banks was lower, and that on the artificial embankment was higher. The Zhegao River is a mixed river. The upper reaches are mainly farmland, the middle reaches of the river pass through Zhegao Town, and there are a lot of aquatic plants growing in the lower reaches of the river [72].
To improve water quality in agricultural river basins, farmland nitrogen management and wastewater treatment are essential for reducing water pollution [73]. Wang et al. [20] pointed out that the total amount of TN input into the Chaohu Lake can be controlled firstly. In accordance with the above results, our study indicated that the management and control of nitrogen sources in the Chaohu Lake Basin should be strengthened. Mooney et al. [74] quantitatively studied the nutrient input of 253 tributaries of Lake Michigan, and found that the input load, concentration, N/P stoichiometric ratio and bioavailability (the ratio of dissolved inorganic nutrients) showed multiple-order-of-magnitude differences among tributaries of different scales, and the N/P input of 6 large tributaries accounted for 70% of the total input. However, compared with large tributaries, the water transported by small tributaries contains higher concentrations of nutrients, and most of them are dissolved inorganic forms; that is, the bioavailability is high, and algae can easily obtain these nutrients. Therefore, small tributaries have a greater potential contribution to algal bloom outbreaks in receiving water. In this study, three small tributaries, the Paihe River, Zhaohe River, and Baishishan River, had greater input loads of nitrogen and phosphorus nutrients. Therefore, it is necessary to strengthen the continuous monitoring of small watersheds and to understand the role of small tributaries in nutrient transport.
Because of its obvious influence on element dissolution, and pollutant toxicity and biological availability, pH is considered as one of the most important physical and chemical indices of freshwater [75,76]. Except in extreme cases, more than 95% of surface freshwaters globally are between pH 6 and 9 [77], and the pH of most surface freshwaters are more than 7 [75,76,78]. Our results also showed that the pH of most samples was more than 7 (Figure 2C). The freshwater pH is impacted in numerous ways. It has been proven that temperature rise has a weak direct impact on the increase in pH. It can also increase pH by promoting the growth of phytoplankton and strengthening lake stratification [76]. Furthermore, excessive use of chemical fertilizers in catchment areas raises the seasonal pH in natural freshwater lakes of the subtropical monsoon climate region [76].

4.2. Water Quality Assessment Based on the WQI and TLI

Although the Chaohu Lake Basin has attracted considerable attention as it is one of the most eutrophic lakes in China [18,19], based on both WQI and TLI, our study indicated that the water quality was rated as “good.” Based on the WQI, 99 (75%) and 31 (23.5%) samples were classified as “good” and “moderate”, respectively. Based on the TLI, 20 (15.15%) and 76 (57.58%) samples were classified as mesotrophic and light-eutrophic water, respectively. These results indicated that the water quality of the Chaohu Lake Basin has been improved recently. Simultaneously, they implied that the occurrence of algal bloom is not only affected by WQI or TLI, so the follow-up research should pay more attention to the relationship between WQI, TLI, water parameters, and algal bloom in the Chaohu Lake Basin. The water quality of Hangbu River was the highest, followed by that of the Zhegao River, Yuxi River, Zhaohe River, and Baishishan River, and those of the Paihe River and Nanfei River were the worst. The water quality of the Zhegao River and Yuxi River was better than that of the Zhaohe River and Baishishan River, consistent with previous reports [14,19]. Wang et al. [19] pointed out that water qualities were ordered by the Hangbu River and Baishishan River > Zhegao River and Zhaohe River > Nanfei River and Paihe River. Wu et al. [14] found that the water quality from good to worse is ordered by the Hangbu River and Zhegao River > Baishishan River, Zhaohe River, Yuxi River > Nanfei River and Paihe River according to WQI. Zhang et al. [55] indicated that the N and P forms were also significantly different between rivers flowing through urban and rural areas, and there were higher P and N levels in urban rivers (including the Nanfei River and Paihe River) than in rural rivers (including the Hangbu River, Baishishan River, Zhaohe River, and Zhegao River).

4.3. Comparison of TLI and WQI

Zou et al. [38] reported that lake hydrological morphological factors (such as lake water exchange cycle), physicochemical factors (such as light conditions), biological factors (such as macrozooplankton community structure), and climate change could have a great impact on the response relationship between Chl a and physicochemical indices (TN, TP, SD, and CODMn), and affect the reliability of the evaluation results. Yang et al. [48] used five methods to evaluate the water quality of the Chaohu Lake Basin and indicated that the comprehensive water quality identification index method could better assess the water quality than the other methods by providing qualitative and quantitative analysis. In this study, the evaluation results of the TLI for the seven rivers and the Chaohu Lake were generally consistent with the WQI. Zhang et al. [79] further demonstrated that the TLI method is more suitable for evaluating the nutritional status of lakes. The evaluation of the TLI is largely dependent on some singular indices, which lack the consideration of multiple indicators to evaluate the overall water quality condition, and it is also unable to overcome uncertainties such as calculation errors and spatial heterogeneity of evaluation indicators [39]. Therefore, compared with the TLI, our study indicated that the WQI can evaluate water quality more realistically.

5. Conclusions

All water parameters varied significantly among the Chaohu Lake and seven rivers. Cond, CODMn, BOD5, Chl a, and nutrients exhibited a clear declining trend, whereas SD exhibited an increasing trend from urban rivers to agricultural and mixed rivers to forest rivers in all four seasons. Nitrogen and phosphorus nutrients in the Chaohu Lake were mainly imported from the Nanfei River, Paihe River, Baishishan River, and Zhaohe River. The Baishishan River and Zhaohe River changed from a clean river to a seriously polluted river, and the degree of pollution increased. The water quality was generally “good” and “light-eutrophic” according to both the WQI and TLI. Significant differences in WQI and TLI were detected among the Chaohu Lake and seven river systems with better water quality in the Hangbu River, followed by the Zhegao River, Yuxi River, Zhaohe River, and Baishishan River. The water quality of the Paihe River and Nanfei River was the lowest. Water quality presented distinct seasonal variation, with the highest WQI in spring, followed by autumn and summer, and the lowest values in winter. Exogenous inputs from the watersheds were still the main source of pollution in the Chaohu Lake, and especially urban rivers are still the main source of eutrophic nutrients in the Chaohu Lake. The control of nitrogen sources in the rivers surrounding the Chaohu Lake should be strengthened, and continuous monitoring of small watersheds should be strengthened. These results greatly improve the understanding of the spatiotemporal water quality patterns of the Chaohu Lake Basin and are beneficial for water quality management in this basin. Additionally, our results suggest that the WQI can be used to evaluate water quality more realistically than the TLI, and the control of urban pollutants is still the core of water quality management in the Chaohu Lake. These results provide important data support for water quality management in the Chaohu Lake.

Supplementary Materials

The following supporting information can be downloaded at: https://www.mdpi.com/article/10.3390/su17052182/s1, Figure S1: Differences in water parameters among different landscape compositions in the Chaohu Lake Basin; Table S1: Geomorphometric variables of Chaohu Lake and seven rivers in Chaohu Lake Basin; Table S2: Geographic coordinates and sampling dates of each sampling site of the Chaohu Lake and seven rivers in Chaohu Lake Basin; Table S3: Water quality parameters measured and relevant analytical methods in this study; Table S4: Weights and normalization factors of the parameters used in the calculation of the water quality index. References [80,81] cited in Supplementary Files.

Author Contributions

Conceptualization, L.W. and K.L.; methodology, L.W., K.L. and Z.W.; software, L.W.; validation, Q.W. and F.L.; formal analysis, L.W., K.L. and Y.Y.; investigation, L.W., K.L., Z.W., Y.Y., R.S., H.Z., X.W., Y.P., J.T., X.L., M.M., Q.W., K.M. and F.L.; resources, L.W.; data curation, M.M.; writing—original draft preparation, L.W.; writing—review and editing, K.L.; visualization, L.W., Z.W., R.S., Y.P. and X.L.; supervision, J.T.; project administration, K.L.; funding acquisition, L.W. All authors have read and agreed to the published version of the manuscript.

Funding

This research was funded by the Monitoring of Aquatic Biological Resources in Key Water Areas of Anhui Province (ZF2022-18-0399), the Anhui Provincial Natural Science Foundation (No. 2308085MC105), and the National Natural Science Foundation of China (No. 51909051).

Institutional Review Board Statement

Not applicable.

Informed Consent Statement

Not applicable.

Data Availability Statement

The raw measurements are available in the Supplementary Files Tables S1–S4.

Acknowledgments

The authors would like to thank Jiajia Ni at Guangdong Meilikang Bio-Science Ltd. (Foshan, China) for his assistance with data analysis and visualization.

Conflicts of Interest

The authors declare no conflicts of interest.

References

  1. Huisman, J.; Codd, G.A.; Paerl, H.W.; Ibelings, B.W.; Verspagen, J.M.H.; Visser, P.M. Cyanobacterial blooms. Nat. Rev. Microbiol. 2018, 16, 471–483. [Google Scholar] [CrossRef] [PubMed]
  2. Payen, S.; Cosme, N.; Elliott, A.H. Freshwater eutrophication: Spatially explicit fate factors for nitrogen and phosphorus emissions at the global scale. Int. J. Life Cycle Assess. 2021, 26, 388–401. [Google Scholar] [CrossRef]
  3. Beaulieu, J.J.; DelSontro, T.; Downing, J.A. Eutrophication will increase methane emissions from lakes and impoundments during the 21st century. Nat. Commun. 2019, 10, 1375. [Google Scholar] [CrossRef] [PubMed]
  4. Paerl, H.W.; Hall, N.S.; Hounshell, A.G.; Luettich, R.A., Jr.; Rossignol, K.L.; Osburn, C.L.; Bales, J. Recent increase in catastrophic tropical cyclone flooding in coastal North Carolina, USA: Long-term observations suggest a regime shift. Sci. Rep. 2019, 9, 10620. [Google Scholar] [CrossRef]
  5. Vörösmarty, C.J.; McIntyre, P.B.; Gessner, M.O.; Dudgeon, D.; Prusevich, A.; Green, P.; Glidden, S.; Bunn, S.E.; Sullivan, C.A.; Liermann, C.R.; et al. Global threats to human water security and river biodiversity. Nature 2010, 467, 555–561. [Google Scholar] [CrossRef]
  6. Bernauer, T.; Böhmelt, T. International conflict and cooperation over freshwater resources. Nat. Sustain. 2020, 3, 350–356. [Google Scholar] [CrossRef]
  7. Zhang, Y.; Liu, X.; Qin, B.; Shi, K.; Deng, J.Z.Y. Aquatic vegetation in response to increased eutrophication and degraded light climate in Eastern Lake Taihu: Implications for lake ecological restoration. Sci. Rep. 2016, 6, 2867. [Google Scholar] [CrossRef]
  8. Zhang, Y.; Cheng, L.; Li, K.; Zhang, L.; Cai, Y.; Wang, X.; Heino, J. Nutrient enrichment homogenizes taxonomic and functional diversity of benthic macroinvertebrate assemblages in shallow lakes. Limnol. Oceanogr. 2019, 64, 1047–1058. [Google Scholar] [CrossRef]
  9. Cook, S.C.; Housley, L.; Back, J.A.; King, R.S. Freshwater eutrophication drives sharp reductions in temporal beta diversity. Ecology 2018, 99, 47–56. [Google Scholar] [CrossRef]
  10. Behmel, S.; Damour, M.; Ludwig, R.; Rodriguez, M.J. Water quality monitoring strategies—A review and future perspectives. Sci. Total Environ. 2016, 571, 1312–1329. [Google Scholar] [CrossRef]
  11. Huang, J.; Zhang, Y.; Bing, H.; Peng, J.; Dong, F.; Gao, J.; Arhonditsis, G.B. Characterizing the river water quality in China: Recent progress and on-going challenges. Water Res. 2021, 201, 117309. [Google Scholar] [CrossRef] [PubMed]
  12. Chapman, D.V.; Bradley, C.; Gettel, G.M.; Hatvani, I.G.; Hein, T.; Kovács, J.; Liska, I.; Oliver, D.M.; Tanos, P.; Trásy, B.; et al. Developments in water quality monitoring and management in large river catchments using the Danube River as an example. Environ. Sci. Policy 2016, 64, 141–154. [Google Scholar] [CrossRef]
  13. Zy Harifidy, R.; Zy Misa Harivelo, R.; Hiroshi, I.; Jun, M.; Kazuyoshi, S. A systematic review of water resources assessment at a large river basin scale: Case of the major river basins in Madagascar. Sustainability 2022, 14, 12237. [Google Scholar] [CrossRef]
  14. Wu, Z.; Lai, X.; Li, K. Water quality assessment of rivers in Lake Chaohu Basin (China) using water quality index. Ecol. Indic. 2021, 121, 107021. [Google Scholar] [CrossRef]
  15. Wang, Y.; Liu, G.; Zhu, S.; Hu, W.; Zhang, H.; Zhou, X.; Peng, Z. Assessment of impacts of water transfer on lake flow and water quality in Lake Chaohu using a three-dimensional hydrodynamic-ecological model. J. Hydrol. Reg. Stud. 2023, 46, 101333. [Google Scholar] [CrossRef]
  16. Cheng, Y.; Guo, Y.; Qi, P.; Wan, N.; Lai, X. Analysis of accuracy of GPM IMERGE precipitation data in Chaohu Basin. Res. Soil Water Conserv. 2020, 27, 188–193. [Google Scholar]
  17. Tang, X.; Shen, M.; Duan, H. Temporal and spatial distribution of algal blooms in Lake Chaohu, 2000–2015. J. Lake Sci. 2017, 29, 276–284. [Google Scholar] [CrossRef]
  18. Wang, Y.; Kong, X.; Peng, Z.; Zhang, H.; Liu, G.; Hu, W.; Zhou, X. Retention of nitrogen and phosphorus in Lake Chaohu, China: Implications for eutrophication management. Environ. Sci. Pollut. Res. 2020, 27, 41488–41502. [Google Scholar] [CrossRef]
  19. Wang, S.; Jiang, X.; Jin, X. Classification and pollution characteristic analysis for inflow rivers of Chaohu Lake. Environ. Sci. 2011, 32, 2834–2839. [Google Scholar]
  20. Wang, S.; Jiang, X.; Jin, X. Spatial-temporal variations of aquatic environmental factors and their influences to algal blooming in Lake Chaohu. J. Lake Sci. 2011, 23, 873–880. [Google Scholar] [CrossRef]
  21. Li, G.; Liu, G.; Jiang, M.; Wang, R.; Zheng, L. Partition characteristics and correlation of heavy metal between sediment and surface water from Lake Chaohu. J. Univ. Sci. Technol. China 2011, 41, 9–15. [Google Scholar] [CrossRef]
  22. Ye, L.; Wu, X.; Liu, B.; Yan, D.; Zhang, M.; Zhou, Y. Temporal and spatial distribution characteristics of dissolved organic matter and influencing factors in Lake Chaohu. Environ. Sci. 2015, 36, 3186–3193. [Google Scholar] [CrossRef]
  23. Xi, S.; Zhou, C.; Liu, G.; Wu, L.; Wang, P. Spatial and temporal distributions of nitrogen and phosphate in the Chaohu Lake. Environ. Sci. 2016, 37, 542–547. [Google Scholar] [CrossRef]
  24. Lu, N.; Yin, H.; Deng, J.; Gao, F.; Hu, W.; Gao, J. Spring community structure of phytoplankton of Lake Chaohu and its relationship to environmental factors. J. Lake Sci. 2010, 22, 950–956. [Google Scholar]
  25. Ning, Y.; Gao, F.; Deng, J.; Hu, W.; Gao, J.; Zhao, Z. Biological assessment of water quality in Chaohu Lake watershed: A case study of benthic macroinvertebrate. Chin. J. Ecol. 2012, 31, 916–922. [Google Scholar]
  26. Wu, L.; Zhou, M.; Shen, Z.; Geng, M.; Feng, W. Characteristics of zooplankton community and water quality Assessment in Chaohu Lake and its tributaries. Chin. J. Zool. 2017, 52, 792–811. [Google Scholar] [CrossRef]
  27. Wei, Z.; Yu, Y.; Yi, Y. Analysis of future nitrogen and phosphorus loading in watershed and the risk of lake blooms under the influence of complex factors: Implications for management. J. Environ. Manag. 2023, 345, 118662. [Google Scholar] [CrossRef]
  28. Horton, R.K. An index number system for rating water quality. J. Water Pollut. Control Fed. 1965, 37, 300–306. [Google Scholar]
  29. Brown, R.M.; McClelland, N.I.; Deininger, R.A.; Tozer, R.G. A water quality index-Do we dare? Water Sew. Works 1970, 117, 339–343. [Google Scholar]
  30. Uddin, M.G.; Nash, S.; Olbert, A.I. A review of water quality index models and their use for assessing surface water quality. Ecol. Indic. 2021, 122, 107218. [Google Scholar] [CrossRef]
  31. Wu, L.; Ji, L.; Chen, X.; Ni, J.; Zhang, Y.; Geng, M. Distribution of zooplankton functional groups in the Chaohu Lake Basin, China. Water 2022, 14, 2106. [Google Scholar] [CrossRef]
  32. Pesce, S.; Wunderlin, D.A. Use of water quality indices to verify the impact of Córdoba City (Argentina) on Suquía River. Water Res. 2000, 34, 2915–2926. [Google Scholar] [CrossRef]
  33. Mohebbi, M.R.; Saeedi, R.; Montazeri, A.; Azam Vaghefi, K.; Labbafi, S.; Oktaie, S.; Abtahi, M.; Mohagheghian, A. Assessment of water quality in groundwater resources of Iran using a modified drinking water quality index (DWQI). Ecol. Indic. 2013, 30, 28–34. [Google Scholar] [CrossRef]
  34. Nong, X.; Shao, D.; Zhong, H.; Liang, J. Evaluation of water quality in the South-to-North Water Diversion Project of China using the water quality index (WQI) method. Water Res. 2020, 178, 115781. [Google Scholar] [CrossRef] [PubMed]
  35. Hurley, T.; Sadiq, R.; Mazumder, A. Adaptation and evaluation of the Canadian Council of Ministers of the Environment Water Quality Index (CCME WQI) for use as an effective tool to characterize drinking source water quality. Water Res. 2012, 46, 3544–3552. [Google Scholar] [CrossRef]
  36. Qu, X.; Chen, Y.; Liu, H.; Xia, W.; Lu, Y.; Gang, D.-D.; Lin, L.-S. A holistic assessment of water quality condition and spatiotemporal patterns in impounded lakes along the Eastern Route of China’s South-to-North Water Diversion Project. Water Res. 2020, 185, 116275. [Google Scholar] [CrossRef]
  37. Wu, H.; Yang, W.; Yao, R.; Zhao, Y.; Zhao, Y.; Zhang, Y.; Yuan, Q.; Lin, A. Evaluating surface water quality using water quality index in Beiyun River, China. Environ. Sci. Pollut. Res. 2020, 27, 35449–35458. [Google Scholar] [CrossRef]
  38. Zou, W.; Zhu, G.; Cai, Y.; Xu, H.; Zhu, M.; Gong, Z.; Zhang, Y.; Qin, B. The limitations of comprehensive trophic level index (TLI) in the eutrophication assessment of lakes along the middle and lower reaches of the Yangtze River during summer season and recommendation for its improvement. J. Lake Sci. 2020, 32, 36–47. [Google Scholar] [CrossRef]
  39. Ding, Y.; Zhao, J.; Peng, W.; Zhang, J.; Chen, Q.; Fu, Y.; Duan, M. Stochastic trophic level index model: A new method for evaluating eutrophication state. J. Environ. Manag. 2021, 280, 111826. [Google Scholar] [CrossRef]
  40. Bai, Y.; Wang, Y.; Wu, D.; Zhu, J.; Zou, B.; Ma, Z.; Xu, J.; Li, L. Identify the seasonal differences in water quality and pollution sources between river-connected and gate-controlled lakes in the Yangtze River Basin. Mar. Pollut. Bull. 2024, 206, 116760. [Google Scholar] [CrossRef]
  41. Wu, Z.; Wang, X.; Chen, Y.; Cai, Y.; Deng, J. Assessing river water quality using water quality index in Lake Taihu Basin, China. Sci. Total Environ. 2018, 612, 914–922. [Google Scholar] [CrossRef] [PubMed]
  42. Ajloon, F.H.; Dong, X.; Ayejoto, D.A.; Ayeni, E.A.; Sabo, M.Y. Seasonal assessment of water quality and water quality index (WQI) variations, in Jiangsu Kunshan Tianfu National Wetland Park, China. Int. J. Environ. Anal. Chem. 2024, 104, 5444–5463. [Google Scholar] [CrossRef]
  43. Zhang, H.; Cao, X.; Huo, S.; Ma, C.; Li, W.; Liu, Y.; Tong, Y.; Wu, F. Changes in China’s river water quality since 1980: Management implications from sustainable development. npj Clean Water 2023, 6, 45. [Google Scholar] [CrossRef]
  44. Chen, H.; Zhao, S.; Li, J.; Zeng, L.; Chen, X. Seasonal and interannual changes (2005–2021) of lake water quality and the implications for sustainable management in a rapidly growing metropolitan region, central China. Environ. Sci. Pollut. Res. 2024, 31, 36995–37009. [Google Scholar] [CrossRef] [PubMed]
  45. Zeng, Y.; Chang, F.; Wen, X.; Duan, L.; Zhang, Y.; Liu, Q.; Zhang, H. Seasonal variation in the water quality and eutrophication of Lake Xingyun in Southwestern China. Water 2022, 14, 3677. [Google Scholar] [CrossRef]
  46. Van Vliet, M.T.H.; Ludwig, F.; Zwolsman, J.J.G.; Weedon, G.P.; Kabat, P. Global river temperatures and sensitivity to atmospheric warming and changes in river flow. Water Resour. Res. 2011, 47, W02544. [Google Scholar] [CrossRef]
  47. Yin, Y.; Xia, R.; Liu, X.; Chen, Y.; Song, J.; Dou, J. Spatial response of water level and quality shows more significant heterogeneity during dry seasons in large river-connected lakes. Sci. Rep. 2024, 14, 8373. [Google Scholar] [CrossRef]
  48. Yang, X.; Cui, H.; Liu, X.; Wu, Q.; Zhang, H. Water pollution characteristics and analysis of Chaohu Lake Basin by using different assessment methods. Environ. Sci. Pollut. Res. 2020, 27, 18168–18181. [Google Scholar] [CrossRef]
  49. Zhang, W.; Li, H.; Xiao, Q.; Li, X. Urban rivers are hotspots of riverine greenhouse gas (N2O, CH4, CO2) emissions in the mixed-landscape Chaohu Lake Basin. Water Res. 2021, 189, 116624. [Google Scholar] [CrossRef]
  50. Gao, R.; Tang, X.; Jiang, C.; Ye, R.; Qian, X. Study of the response of water quality to the inflows in the water source region of Chaohu Lake. Environ. Prot. Sci. 2018, 44, 103–107. [Google Scholar] [CrossRef]
  51. APHA. Standard Methods for the Examination of Water and Wastewater, 21st ed.; American Public Health Association, American Water Works Association, Water Environment Federation: Washington, DC, USA, 2005. [Google Scholar]
  52. Li, N.; Li, J.X.; Li, G.W.; Li, Y.; Xi, B.D.; Wu, Y.W.; Li, C.L.; Li, W.; Zhang, L.Y. The eutrophication and its regional heterogeneity in typical lakes of China. Acta Hydrobiol. Sin. 2018, 42, 854–864. [Google Scholar] [CrossRef]
  53. Liu, D.; Du, Y.; Yu, S.; Luo, J.; Duan, H. Human activities determine quantity and composition of dissolved organic matter in lakes along the Yangtze River. Water Res. 2020, 168, 115132. [Google Scholar] [CrossRef] [PubMed]
  54. Koçer, M.A.T.; Sevgili, H. Parameters selection for water quality index in the assessment of the environmental impacts of land-based trout farms. Ecol. Indic. 2014, 36, 672–681. [Google Scholar] [CrossRef]
  55. Zhang, L.; Shao, S.; Liu, C.; Xu, T.; Fan, C. Forms of nutrients in rivers flowing into Lake Chaohu: A comparison between urban and rural rivers. Water 2015, 7, 4523–4536. [Google Scholar] [CrossRef]
  56. Yu, Z.; Deng, H.; Wang, D.; Ye, M.; Tan, Y.; Li, Y.; Chen, Z.; Xu, S. Nitrous oxide emissions in the Shanghai River network: Implications for the effects of urban sewage and IPCC methodology. Glob. Chang. Biol. 2013, 19, 2999–3010. [Google Scholar] [CrossRef]
  57. He, Y.; Wang, X.; Chen, H.; Yuan, X.; Wu, N.; Zhang, Y.; Yue, J.; Zhang, Q.; Diao, Y.; Zhou, L. Effect of watershed urbanization on N2O emissions from the Chongqing Metropolitan River Network, China. Atmos. Environ. 2017, 171, 70–81. [Google Scholar] [CrossRef]
  58. Wang, X.; He, Y.; Chen, H.; Yuan, X.; Peng, C.; Yue, J.; Zhang, Q.; Zhou, L. CH4 concentrations and fluxes in a subtropical metropolitan river network: Watershed urbanization impacts and environmental controls. Sci. Total Environ. 2018, 622–623, 1079–1089. [Google Scholar] [CrossRef]
  59. Wang, R.; Zhang, H.; Zhang, W.; Zheng, X.; Butterbach-Bahl, K.; Li, S.; Han, S. An urban polluted river as a significant hotspot for water–atmosphere exchange of CH4 and N2O. Environ. Pollut. 2020, 264, 114770. [Google Scholar] [CrossRef]
  60. Smith, R.M.; Kaushal, S.S.; Beaulieu, J.J.; Pennino, M.J.; Welty, C. Influence of infrastructure on water quality and greenhouse gas dynamics in urban streams. Biogeosciences 2017, 14, 2831–2849. [Google Scholar] [CrossRef]
  61. Liu, T.; Wang, X.; Yuan, X.; Gong, X.; Hou, C. Spatial-temporal characteristics and driving factors of greenhouse gas Emissions from rivers in a rapidly urbanizing area. Environ. Sci. 2019, 40, 2827–2839. [Google Scholar] [CrossRef]
  62. Şener, Ş.; Davraz, A.; Karagüzel, R. Evaluating the anthropogenic and geologic impacts on water quality of the Eğirdir Lake, Turkey. Environ. Earth Sci. 2013, 70, 2527–2544. [Google Scholar] [CrossRef]
  63. Soulsby, C.; Langan, S.J.; Neal, C. Environmental change, land use and water quality in Scotland: Current issues and future prospects. Sci. Total Environ. 2001, 265, 387–394. [Google Scholar] [CrossRef] [PubMed]
  64. Sharpley, A.N.; McDowell, R.W.; Kleinman, P.J. Phosphorus loss from land to water: Integrating agricultural and environmental management. Plant Soil 2001, 237, 287–307. [Google Scholar] [CrossRef]
  65. Zhang, D.; Tian, X.; Wu, S. Analysis of pollution flux in the Nanfeihe River and its treatment. Water Resour. Prot. 2020, 36, 99–103. [Google Scholar] [CrossRef]
  66. Şener, Ş.; Şener, E.; Davraz, A. Evaluation of water quality using water quality index (WQI) method and GIS in Aksu River (SW-Turkey). Sci. Total Environ. 2017, 584–585, 131–144. [Google Scholar] [CrossRef]
  67. Quick, A.M.; Reeder, W.J.; Farrell, T.B.; Tonina, D.; Feris, K.P.; Benner, S.G. Nitrous oxide from streams and rivers: A review of primary biogeochemical pathways and environmental variables. Earth-Sci. Rev. 2019, 191, 224–262. [Google Scholar] [CrossRef]
  68. Amneera, W.A.; Najib, N.W.A.Z.; Yusof, S.N.M.; Ragunathan, S. Water quality index of Perlis River, Malaysia. Int. J. Civ. Environ. Eng. 2013, 13, 1–6. [Google Scholar]
  69. Peng, Z.; Zhang, Y.; Zhu, J.; Hu, W.; Liu, G.; Zhang, H.; Gao, R. Large lake sluice operations during an extreme rainfall season greatly affect circulation and water quality dynamics of a shallow eutrophic lake. Sci. Total Environ. 2021, 781, 146756. [Google Scholar] [CrossRef]
  70. Zhang, M.; Shi, X.; Yang, Z.; Chen, K. The variation of water quality from 2012 to 2018 in Lake Chaohu and the mitigating strategy on cyanobacterial blooms. J. Lake Sci. 2020, 32, 11–20. [Google Scholar] [CrossRef]
  71. Zhou, H.; Wu, L.; Ma, C.; Guan, H.; Sun, X.; Lu, S.; Shang, G.; Wang, Y.; Xu, Y.; Xu, J.; et al. Holocene environmental evolution recorded by multi-proxies from Lacustrine sediments of the Hangbu River Valley, Lake Chaohu Basin, East China. J. Lake Sci. 2020, 32, 1869–1881. [Google Scholar] [CrossRef]
  72. Chu, Y.; Zhu, J.; Xia, S.; Ma, Y.; Wang, L.; Li, Y.; Li, X. Temporal and spatial variation of water pollution in Zhegao River of Chao Lake Basin. J. Soil Water Conserv. 2011, 25, 243–248. [Google Scholar]
  73. Yu, C.; Huang, X.; Chen, H.; Godfray, H.C.J.; Wright, J.S.; Hall, J.W.; Gong, P.; Ni, S.; Qiao, S.; Huang, G.; et al. Managing nitrogen to restore water quality in China. Nature 2019, 567, 516–520. [Google Scholar] [CrossRef] [PubMed]
  74. Mooney, R.J.; Stanley, E.H.; Rosenthal, W.C.; Esselman, P.C.; Kendall, A.D.; McIntyre, P.B. Outsized nutrient contributions from small tributaries to a Great Lake. Proc. Natl. Acad. Sci. USA 2020, 117, 28175–28182. [Google Scholar] [CrossRef] [PubMed]
  75. Pinheiro, J.P.S.; Windsor, F.M.; Wilson, R.W.; Tyler, C.R. Global variation in freshwater physico-chemistry and its influence on chemical toxicity in aquatic wildlife. Biol. Rev. 2021, 96, 1528–1546. [Google Scholar] [CrossRef]
  76. Li, A.; Shi, Z.; Yin, Y.; Fan, Y.; Zhang, Z.; Tian, X.; Yang, Y.; Pan, L. Excessive use of chemical fertilizers in catchment areas raises the seasonal pH in natural freshwater lakes of the subtropical monsoon climate region. Ecol. Indic. 2023, 154, 110477. [Google Scholar] [CrossRef]
  77. Hartmann, J.; Lauerwald, R.; Moosdorf, N. GLORICH—Global river chemistry database [dataset]. PANGAEA 2019, 10, 23–27. [Google Scholar] [CrossRef]
  78. Guerin, A.J.; Weise, A.M.; Chu, J.W.F.; Wilcox, M.A.; Greene, E.S.; Therriault, T.W. High-resolution freshwater dissolved calcium and pH data layers for Canada and the United States. Sci. Data. 2024, 11, 370. [Google Scholar] [CrossRef]
  79. Zhang, R.; Gao, L.; Xi, B.; Su, J.; Huo, S.; Ji, D.; Lü, N.; Zhu, J. Improved TLI index method and its application in nutritional states evaluation in Chaohu Lake. Chin. J. Environ. Eng. 2013, 7, 2127–2133. [Google Scholar]
  80. Editorial Committee of Encyclopedia of Rivers and Lakes in China. Encyclopedia of Rivers and Lakes in China. Section of Changjiang River Basin; China Water Power Press: Beijing, China, 2014. [Google Scholar]
  81. Kannel, P.R.; Lee, S.; Lee, Y.S.; Kanel, S.R.; Khan, S.P. Application of water quality indices and dissolved oxygen as indicators for river water classification and urban impact assessment. Environ. Monit. Assess. 2007, 132, 93–110. [Google Scholar] [CrossRef]
Figure 1. Distribution of sampling sites in the Chaohu Lake Basin. WCL, Western Chaohu Lake; ECL, Eastern Chaohu Lake; NFHU, upstream of Nanfei River; NFHM, midstream of Nanfei River; NFHL, lower reach of Nanfei River; NFHE, estuary of Nanfei River; PHM, midstream of Paihe River; PHL, lower reach of Paihe River; PHE, estuary of Paihe River; HBHU, upstream of Hangbu River; HBHM, midstream of Hangbu River; HBHL, lower reach of Hangbu River; HBHE, estuary of Hangbu River; BSSHM, midstream of Baishishan River; BSSHL, lower reach of Baishishan River; BSSHE, estuary of Baishishan River; ZHU, upstream of Zhaohe River; ZHM, midstream of Zhaohe River; ZHL, lower reach of Zhaohe River; ZHE, estuary of Zhaohe River; YXHU, upstream of Yuxi River; YXHM, midstream of Yuxi River; YXHL, lower reach of Yuxi River; YXHE, estuary of Yuxi River; ZGHM, midstream of Zhegao River; ZGHL, lower reach of Zhegao River; ZGHE, estuary of Zhegao River.
Sustainability 17 02182 g001
Figure 2. Seasonal patterns of water temperature (A), dissolved oxygen (B), pH (C), conductivity (D), total nitrogen (E), total phosphorus (F), orthophosphate (G), ammonia (H), nitrate (I), nitrite (J), chemical oxygen demand (K), biological oxygen demand (L), (m) chlorophyll a (M), and transparency (N) in Chaohu Lake Basin. WT, water temperature; DO, dissolved oxygen; Cond, conductivity; TN, total nitrogen; TP, total phosphorus; PO42−-P, orthophosphate; NH4-N, ammonia; NO3-N, nitrate; NO2-N, nitrite; CODMn, chemical oxygen demand; BOD5, five-day biological oxygen demand; Chl a, chlorophyll a concentration. * p < 0.05; ** p < 0.01; *** p < 0.001.
Sustainability 17 02182 g002
Figure 3. Principal component analysis (PCA) profiles showing water quality patterns in the Chaohu Lake Basin in spring (A), summer (B), autumn (C), and winter (D). (i) PCA profile of Chaohu Lake and seven rivers, (ii) PCA loading plot of water quality parameters, and (iii) scree plot for variances explained by the principal components.
Sustainability 17 02182 g003
Figure 4. Seasonal patterns of water quality index (WQI) (A) and trophic level index (TLI) (B) in Chaohu Lake Basin. * p < 0.05; ** p < 0.01; *** p < 0.001.
Sustainability 17 02182 g004
Figure 5. Correlations between water quality parameters and WQI and TLI in the Chaohu Lake Basin in spring (A), summer (B), autumn (C), and winter (D). WT, water temperature; DO, dissolved oxygen; Cond, conductivity; TN, total nitrogen; TP, total phosphorus; PO42−-P, orthophosphate; NH4-N, ammonia; NO3-N, nitrate; NO2-N, nitrite; CODMn, chemical oxygen demand; BOD5, five-day biological oxygen demand; Chl a, chlorophyll a concentration; Trans, Secchi depth. * p < 0.05; ** p < 0.01; *** p < 0.001.
Sustainability 17 02182 g005
Table 1. Two-way ANOVA results on both individual water quality parameters, water quality index (WQI), and trophic level index (TLI) among seasons and stations in the Chaohu Lake Basin. P values than are less than 0.05 are in bold. WT, water temperature; DO, dissolved oxygen; Cond, conductivity; TN, total nitrogen; TP, total phosphorus; PO42−-P, orthophosphate; NH4-N, ammonia; NO3-N, nitrate; NO2-N, nitrite; CODMn, chemical oxygen demand; BOD5, five-day biological oxygen demand; Chl a, chlorophyll a concentration; SD, Secchi depth.
Water ParameterSeasonStation
FpFp
WT (°C)2902.85<0.0015.909<0.001
DO (mg/L)20.991<0.0014.752<0.001
pH26.588<0.0019.561<0.001
Cond (μS/cm)17.293<0.00120.039<0.001
TN (mg/L)4.7770.003834.092<0.001
TP (mg/L)5.7310.00129.912<0.001
PO42−-P (mg/L)4.7330.00406.806<0.001
NH4-N (mg/L)4.3610.00638.067<0.001
NO3-N (mg/L)7.2050.000226.646<0.001
NO2-N (mg/L)4.3280.00669.223<0.001
CODMn (mg/L)1.4650.228953.4720.0015
BOD5 (mg/L)0.2110.88828612.714<0.001
Chl a (mg/L)1.3560.26097.765<0.001
SD (cm)4.7620.003923.979<0.001
WQI4.0550.00921.569<0.001
TLI7.5140.00016.477<0.001
Disclaimer/Publisher’s Note: The statements, opinions and data contained in all publications are solely those of the individual author(s) and contributor(s) and not of MDPI and/or the editor(s). MDPI and/or the editor(s) disclaim responsibility for any injury to people or property resulting from any ideas, methods, instructions or products referred to in the content.

