Article

The Influence of Environmental Knowledge and Religiosity on Public Preferences for Ecosystem Services in Urban Green Spaces—An Example from China

1
School of Environment and Geography, Qingdao University, Qingdao 266071, China
2
Department of Management, Haworth College of Business, Western Michigan University, Kalamazoo, MI 49008, USA
3
School for Environment and Sustainability, University of Michigan, Ann Arbor, MI 48109, USA
4
School of Tourism and Geography Science, Qingdao University, Qingdao 266071, China
5
Guangdong Provincial Key Laboratory of Marine Disaster Prediction and Prevention, Institute of Marine Sciences, Shantou University, Shantou 515063, China
*
Authors to whom correspondence should be addressed.
These authors contributed equally to this work.
Sustainability 2025, 17(5), 2166; https://doi.org/10.3390/su17052166
Submission received: 2 February 2025 / Revised: 18 February 2025 / Accepted: 24 February 2025 / Published: 3 March 2025

Abstract

:
Ecosystem services (ES) are key benefits that humans derive from natural ecosystems, including provisioning, regulating, and cultural services. As urbanization accelerates globally, urban green spaces (UGS), increasingly recognized for their role in improving environmental quality and enhancing human well-being, provide essential ES that help mitigate the effects of urbanization. However, the factors influencing public preferences for these services, particularly environmental knowledge and religiosity, remain underexplored. This study seeks to bridge this gap by examining how environmental knowledge and religiosity shape public preferences for ecosystem services, with a particular focus on regulating services (e.g., air quality improvement, carbon sequestration) and cultural services (e.g., outdoor recreation, aesthetic enjoyment). A survey of 1236 respondents conducted in China reveals that both environmental knowledge and religiosity significantly enhance preferences for regulating services, especially in relation to air quality improvement (M = 4.33) and carbon sequestration (M = 4.26). Furthermore, higher education levels correlate with stronger preferences for ecosystem services, and coastal residents exhibit greater preferences for these services compared with inland residents. This study emphasizes that disseminating environmental knowledge through education and religious practices can significantly enhance public awareness of ecosystem services and foster greater support for green infrastructure investments. Policy recommendations include the adoption of targeted communication strategies in urban green space planning to enhance public engagement and support.

1. Introduction

Ecosystem services (ES) encompass a wide range of benefits that humans derive from ecosystems, including provisioning, regulating, cultural, and supporting services [1]. These services play a critical role in ensuring the health and stability of both natural and urban environments. As urbanization accelerates, the demand for sustainable green spaces that provide these services has grown significantly, making ES a focal point of global research on urban sustainability. As urbanization and environmental challenges increase globally, ESs are becoming increasingly recognized for their role in urban sustainability. They are now seen as a crucial component of city planning, especially in providing essential services such as air and water regulation, climate mitigation, and cultural well-being. This growing recognition has led governments to prioritize investments in green infrastructure, integrating ecological restoration efforts into urban planning and policy [2,3]. Current research highlights a shift in societal preferences, with increasing public demand for green spaces that support regulating services, cultural services like recreation, and aesthetics. These preferences shape government investment strategies, aiming to create green spaces that balance ecological benefits with social and cultural needs [4,5]. Enhancing public understanding of ESs is critical to ensuring broad community support for urban green space initiatives. With increasing awareness, individuals are more likely to engage in environmentally responsible behaviors, fostering stronger participation in the planning and maintenance of urban green spaces [1,6,7].
Understanding the factors that shape public preferences for ecosystem services, referred to as Ecosystem Service Social Preferences (ESSP), is crucial for informing policy-related decisions and optimizing resource allocation [8,9,10]. These preferences influence resource allocation and are shaped by a variety of socio-demographic, environmental, and cultural factors, which need to be carefully considered to optimize green space investments. ESSP can be quantified by evaluating individuals’ perceived importance of various ES types [10,11,12,13]. Previous studies have indicated that these preferences are influenced by a multitude of socio-demographic factors, including age, gender, education, and residential location [14,15]. For instance, research has shown that women generally prefer regulating and cultural services, whereas men tend to prioritize provisioning services [16,17]. Similarly, older individuals are more inclined to value provisioning services, while younger respondents favor regulating services [18,19]. Research consistently finds a positive correlation between educational attainment and ESSP, with higher education levels leading to a greater appreciation for ecosystem services, particularly those related to environmental sustainability and long-term ecological benefits [16,20,21].
Despite the extensive exploration of socio-demographic determinants of ESSP, the roles of policy-manageable factors such as Environmental and Ecological Knowledge (KEE) and religiosity remain under-investigated. KEE, disseminated through educational programs and media channels, has been shown to profoundly impact public attitudes toward ecosystem services [22,23,24]. Similarly, religiosity—defined by individuals’ spiritual beliefs and practices—may also play a role in shaping preferences for certain ecosystem services by influencing environmental values and priorities, especially in relation to stewardship and cultural practices [25,26]. However, the interplay between KEE, religiosity, and socio-demographic factors in determining ESSP has not been sufficiently examined, leaving a gap in understanding the potential for policy-driven interventions aimed at enhancing public preferences through targeted educational and outreach programs.
Moreover, the rapid urbanization of the global population, expected to reach 66% by 2050 [27], highlights the growing importance of urban green spaces (UGS) in providing accessible ecosystem services to urban residents [28,29]. As urban areas face land scarcity, which limits the availability of UGSs, it becomes increasingly important for governments to enhance public understanding of UGS-derived ESs to justify and optimize investments in green infrastructure [19,30,31]. Effective communication strategies that consider the diverse socio-demographic profiles of urban populations are essential for maximizing the benefits of UGSs.
This study aims to bridge the existing research gaps by examining public ESSPs in relation to UGS and investigating how individual characteristics, including socio-demographic factors, KEE, and religiosity, influence these preferences. Specifically, this study focuses on the following objectives:
Identify the most valued ecosystem services provided by UGSs.
Assess how KEE, religiosity, and other demographic factors influence ESSPs across various service categories.
Evaluate how KEE moderates ESSPs across diverse stakeholder groups.
To achieve these objectives, this research integrates KEE and religiosity into the theoretical framework alongside traditional socio-demographic factors.
H1: 
Higher levels of educational attainment are positively correlated with greater ecosystem service social preferences (ESSP) across all ecosystem service categories.
The existing literature suggests that higher educational attainment is linked to greater environmental awareness, which can influence the prioritization of ecosystem services (ESSP). For example, research in Tanzania highlighted that secondary school students who participated in environmental education programs showed increased awareness and understanding of ecosystem services and biodiversity, leading to a greater emphasis on services such as biodiversity conservation and natural resource management [21]. Additionally, local communities’ knowledge about ecosystem services tends to be enhanced through educational programs, fostering more positive attitudes toward conservation practices and the prioritization of services like pollination and pest control [32]. “Green education”, which advocates for environmentally sustainable behaviors, could also raise awareness about ecosystem services and promote their preservation [33]. While these studies highlight education’s role in specific services like biodiversity, fewer studies have examined how educational attainment correlates with ESSPs across a broader range of ecosystem services. Furthermore, while some research connects education with factors like income and local conservation practices, limited studies have explored ESSPs across all service categories simultaneously.
H2: 
Increased environmental and ecological knowledge (KEE) moderates the relationship between educational level and ecosystem service social preferences (ESSP), enhancing the preference for regulating and cultural services.
A growing body of research underscores the role of environmental knowledge in shaping preferences for regulating and cultural ecosystem services (ESSP). Zoderer et al. (2016) found that environmental awareness had a greater influence than formal education on the perceived importance of regulating services like climate regulation and flood protection [34]. This suggests that environmental knowledge may moderate the relationship between educational attainment and preferences for regulating services. Similarly, Zhang et al. (2016) found that local communities generally have limited awareness of regulating and supporting services, implying that environmental knowledge could enhance the appreciation of these services [35]. Further research by Sy et al. (2021) demonstrated that familiarity with ecosystem services and academic information influenced preferences for both regulating and cultural services [36]. These studies suggest that environmental knowledge is crucial in moderating the relationship between educational attainment and ESSPs, especially in enhancing preferences for regulating and cultural services. However, a gap exists in the literature regarding how environmental and ecological knowledge (KEE) specifically moderates this relationship, particularly with respect to cultural and regulatory services.
H3: 
Religiosity influences ecosystem service social preferences (ESSP) by reinforcing the importance of cultural and provisioning services, particularly among highly devout individuals.
Religiosity has been associated with a heightened sense of responsibility toward the environment, with many religious beliefs emphasizing the protection of nature as a moral obligation. Research shows that individuals with higher religiosity tend to exhibit stronger environmental concerns and are more likely to engage in pro-environmental behaviors, such as supporting green products, due to their belief in nature as a divine creation deserving protection. Moreover, religiosity moderates the relationship between environmental knowledge and pro-environmental actions, suggesting that religious individuals may prioritize ecosystem services that directly support human life, such as food and water, in their consumption patterns [37]. Additionally, religiosity influences attitudes toward cultural ecosystem services, such as sacred natural sites, where religious norms often align with conservation efforts and community-based environmental practices [38]. Despite these insights, there is a notable gap in the literature regarding the direct relationship between religiosity and specific ecosystem services, particularly provisioning and cultural services. More focused research is needed to explore how religiosity affects preferences for these services across different cultural and religious contexts.
Through empirical analysis, this study seeks to provide a nuanced understanding of the complex interactions between knowledge, belief systems, and educational backgrounds in shaping public preferences for ecosystem services. The findings aim to inform policy design by identifying strategies for delivering the most valued ecosystem services to specific demographic groups and enhancing ESSPs through targeted KEE dissemination initiatives.

2. Methods

2.1. Questionnaire Design and Pilot Tests

A structured questionnaire was developed and administered in China to collect primary data for this research. The questionnaire was structured into three main sections:
  • Perceived Significance of Ecosystem Services Provided by UGSs: This section evaluated respondents’ perceptions regarding the importance of 11 ecosystem services offered by UGSs, as presented in Table 1. Respondents rated the significance of each ecosystem service using a five-point Likert scale, with values ranging from 1 (not important at all) to 5 (extremely important).
  • Socio-Demographic Information: This section collected data on respondents’ socio-demographic characteristics, including age, gender, educational attainment, occupation, and residential location. The residential location was further classified into coastal versus inland and urban versus rural areas to assess potential geographic influences on perceptions of UGS services.
  • Ecological and Environmental Knowledge: This section evaluated respondents’ levels of KEE, which were classified into three categories: no knowledge, moderate knowledge, and professional knowledge. Furthermore, respondents’ religiosity levels were assessed on a scale from 0 (no religious beliefs) to 7 (highly devout), with the aim of exploring the potential influence of religious beliefs on environmental perceptions.
The questionnaire was initially developed in Mandarin Chinese to ensure cultural and linguistic relevance. Adhering to Brislin and Leibowitz’s (1970) translation and back-translation method [39], the questionnaire was subsequently translated into English to ensure cross-linguistic accuracy. A pilot test was conducted to evaluate the validity and clarity of the questionnaire. A sample of twenty undergraduate students, none of whom were majoring in ecology or environmental science, participated in the pilot test. Participants were asked to review the survey items and provide feedback on the clarity of the questions, specifically focusing on identifying any ambiguous or confusing language. The results of the pilot test revealed no significant issues with ambiguity or misunderstanding, indicating that the questionnaire was clear and comprehensible. As a result, no revisions were necessary, and the survey was subsequently distributed to a larger sample for data collection.

2.2. Sampling Procedure

The survey was administered online via Questionnaire Star, a widely utilized survey platform in China (www.wjx.cn, accessed on 24 October 2024). The survey link was disseminated through WeChat, a widely used instant messaging application with extensive user penetration in China. A snowball sampling technique was employed, whereby initial respondents were asked to forward the survey link to their contacts via WeChat, thus recruiting additional participants. Eligibility for participation was restricted to individuals aged 18 years and older. Upon completing the survey, participants received compensation of RMB 2.00 via WeChat Pay as an incentive. Data collection took place from September to October 2019, yielding a final sample of 1236 respondents (Table 2).
While this sampling method may introduce some bias, such as restricting participation to individuals with access to mobile phones and the WeChat platform, it is important to note that mobile phone penetration in China exceeds 96%. Additionally, WeChat had more than 1.4 billion global users as of May 2018, making it the most widely used social media platform in China [40]. Therefore, it can be reasonably inferred that the snowball sampling method captured a diverse range of respondents in terms of socio-demographic characteristics.

2.3. Statistical Analysis

Data were analyzed using the Statistical Package for the Social Sciences (SPSS, version 20.0), a widely used software for statistical analysis in social science research. The primary dependent variable, “perceived importance”, was employed to represent the respondents’ ESSPs. This variable reflected participants’ perceptions regarding the importance of each UGS ecosystem service, with higher scores indicating a stronger preference for that specific service. To evaluate preferences for each UGS ecosystem service, the mean score for each service was calculated based on respondents’ perceived importance of that service. Furthermore, principal component factor analysis was conducted to determine whether ecosystem service items with similar characteristics were grouped together on the same factor. This analysis facilitated the reduction of data dimensionality and the identification of underlying patterns in respondents’ preferences.
PCA is used to reduce the dimensionality of the data by identifying underlying factors. The basic formula for PCA involves the eigenvalue decomposition of the covariance matrix. The equation for principal components is as follows:
X = T P T + E
where X is the original data matrix; T is the matrix of scores (the transformed data); P is the matrix of loadings (eigenvectors); E is the matrix of residuals (errors).
The principal components are derived from the covariance matrix ∑:
= 1 n 1   i = 1 n ( x i x ¯ )   ( x i x ¯ ) T
The eigenvectors and eigenvalues of the covariance matrix are used to identify the principal components. Preference scores for each ES dimension were calculated by averaging the scores of the individual ES items assigned to that dimension. Independent sample t-tests and one-way analysis of variance (ANOVA) were performed to examine whether the ESSPs for each ES dimension varied across different socio-demographic variables, including gender, age, education level, occupation, and residential location. The t-test compares the means of two independent groups (e.g., male vs. female). The formula for the t-statistic is as follows:
t = x ¯ 1 x ¯ 2 s 1 2 n 1 + s 2 2 n 2
where x ¯ 1 and x ¯ 2 are the sample means; s 1 2 and s 2 2 are the sample variances; n 1 and n 2 are the sample sizes.
ANOVA is used to compare the means of more than two groups (e.g., comparing ESSPs across multiple education levels). The F-statistic is calculated as follows:
F = M S b e t w e e n M S w i t h i n
where M S b e t w e e n is the mean square between the groups (variance due to the interaction between groups); M S w i t h i n is the mean square within the groups (variance within groups).
The formula for the mean square between and within groups:
M S b e t w e e n = S S b e t w e e n d f b e t w e e n ,     M S w i t h i n = S S w i t h i n d f w i t h i n
where S S b e t w e e n and S S w i t h i n are the sums of squares between and within groups, and d f b e t w e e n and d f w i t h i n are the degrees of freedom.
To explore the predictive power of environmental knowledge and religiosity on ESSPs, regression analyses were conducted. These analyses aimed to assess whether KEE and religiosity had a stronger influence on ESSPs than socio-demographic variables, which have been the focus of numerous studies (e.g., gender, age, education, occupation, and residence). Stepwise regression analyses were also employed to identify which specific socio-demographic variable had the most significant impact on ESSPs for each ES factor.
Regression analysis is used to understand the relationships between variables (e.g., the influence of socio-demographic characteristics on ESSPs). The basic formula for a linear regression model is as follows:
Y = β 0 + β 1 X 1 + β 2 X 2 + + β k X k + ϵ
where Y is the dependent variable (perceived importance of UGSs); β 0 is the intercept; β 1 , β 2 ,…, β k are the regression coefficients; X 1 , X 2 ,…, X k are the independent variables (e.g., socio-demographic factors); ϵ is the error term.
For stepwise regression, the process involves adding or removing variables based on certain criteria (e.g., AIC, BIC). The formula for the stepwise method is as follows:
A I C = 2 ln L + 2 k
where L is the likelihood function of the models; k is the number of parameters in the model.
The variance inflation factor (VIF) method was used to check for multicollinearity among the independent variables. Two-way ANOVA analyses were conducted to explore how different levels of KEE moderated the relationship between socio-demographic factors and ESSPs. This analysis provided deeper insight into how environmental knowledge and religiosity interact with socio-demographic variables to influence preferences for UGS ecosystem services.
The VIF method accesses multicollinearity. For each independent variable, the VIF is calculated as follows:
V I F = 1 1 R 2
where R2 is the R-squared value from the regression of that variable on all other variables.
Two-way ANOVA examines how two independent variables (e.g., socio-demographics and environmental knowledge) interact in influencing a dependent variable. The F-statistic for two-way ANOVA is calculated as follows:
F = M S A B M S e r r o r
where M S A B is the mean square for the interaction between the two factors; M S e r r o r is the mean square for the error term.

3. Results

3.1. Demographic Profile of Survey Respondents

The demographic characteristics of the 1236 survey respondents are summarized in Table 2, providing a comprehensive overview of key socio-demographic variables. The gender distribution was nearly equal, with 49.9% identifying as male and 50.1% as female, indicating a balanced representation of both sexes in the sample. The chosen age range for respondents, spanning from under 25 years to over 51 years, ensures a diverse and representative sample across different life stages. This range captures perspectives from younger individuals, such as students and early professionals, to those with more career and life experience. The distribution provides valuable insights into the needs and challenges faced at various ages, making the findings more comprehensive and reflective of the broader population. By including both younger and older groups, the survey ensures a balanced view across different socio-economic stages, enhancing the robustness of the results. Regarding age distribution, 36.7% (n = 454) were under 25 years old, while 24.8% (n = 307) fell within the 31–40 age range, providing insights into the age composition of the sample. With regard to monthly income, 30.6% (n = 378) of respondents reported earning less than RMB 2000, while 23% (n = 284) earned between RMB 5001 and RMB 8000, reflecting the income distribution of the sample. Coastal residents constituted 56.3% of the sample, representing a slight majority from coastal regions, highlighting the regional composition of the respondent pool. A substantial proportion of participants (88%, n = 1088) resided in urban areas, underscoring the urban-centric nature of the sample. Educational attainment was notably high, with 67.8% (n = 838) of respondents possessing at least a bachelor’s degree, highlighting the sample’s generally high level of education. Regarding environmental education knowledge, 67.1% (n = 829) reported possessing a moderate level of knowledge, illustrating the general awareness of environmental issues among respondents. In terms of religiosity, 65.3% (n = 807) of respondents reported no religious affiliation, while 10.8% (n = 133) identified as devout believers, reflecting the religious composition of the sample. The sample also included representatives from sixteen distinct occupational categories, emphasizing the diversity of the respondent pool (Figure 1).

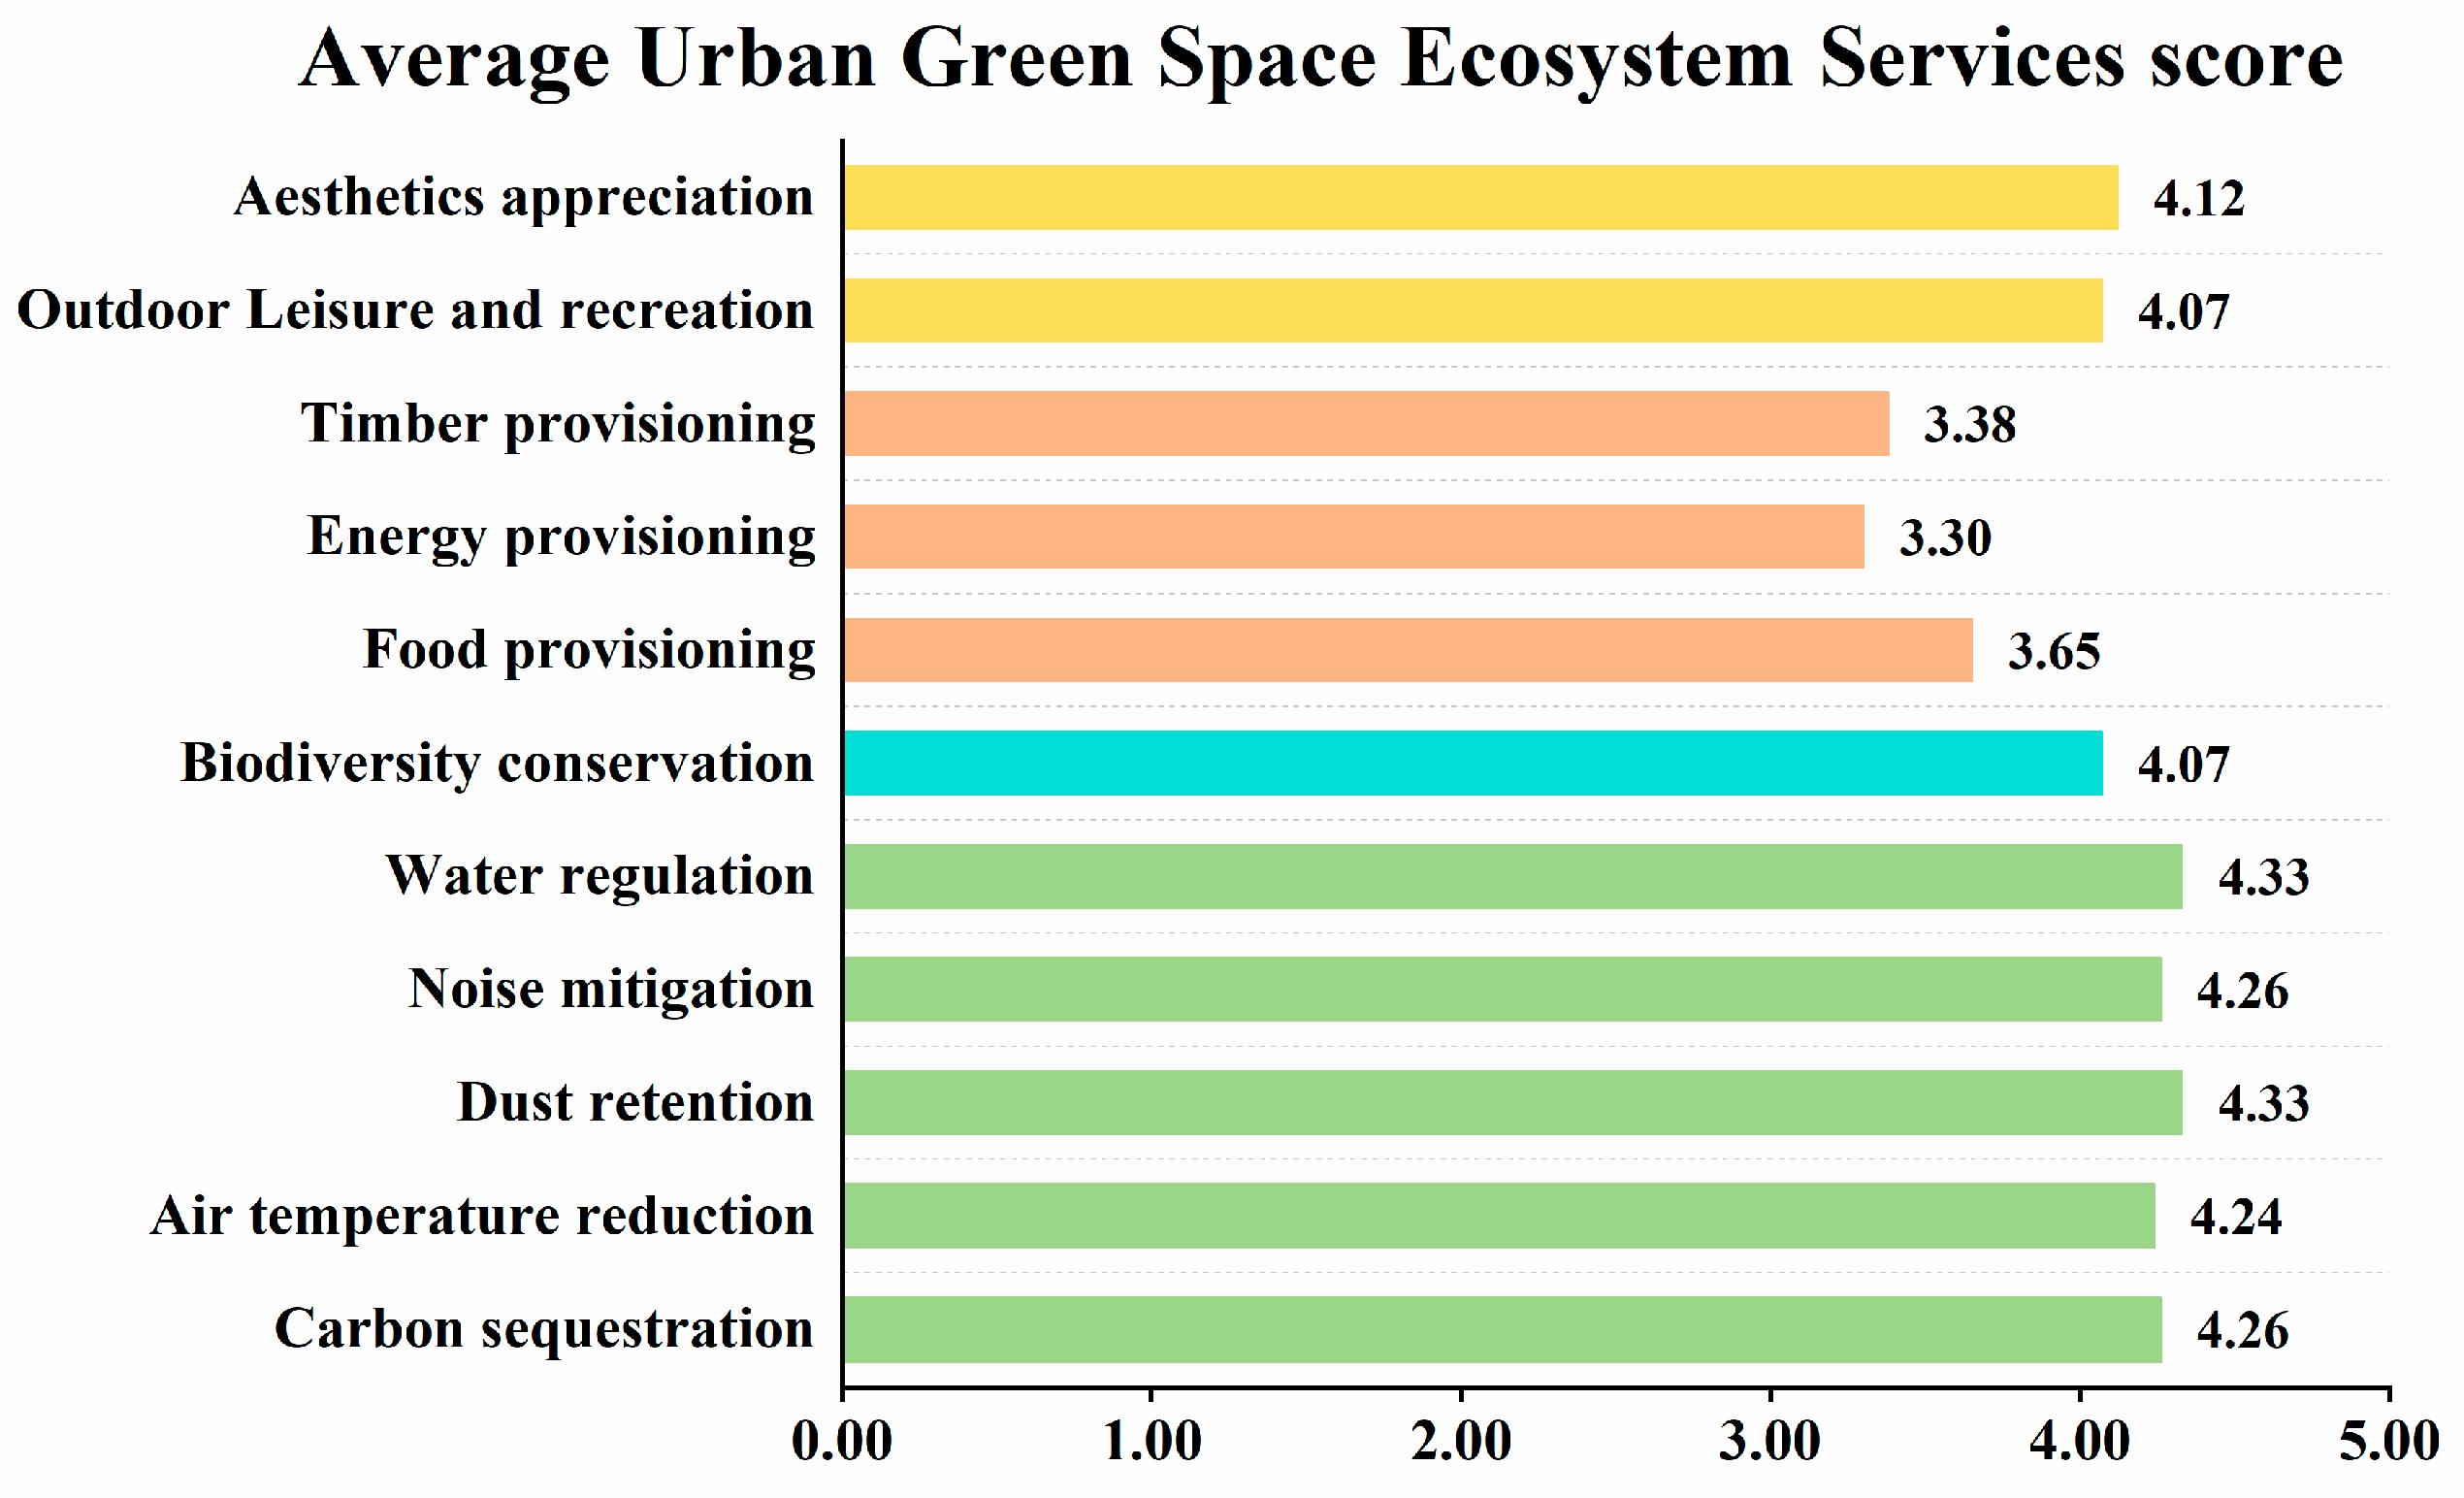
3.2. Overall Ranking of ESSPs Provided by UGSs

The preferences for ecosystem services among the 1236 respondents were assessed using a 5-point Likert scale, with 1 indicating “not important” and 5 representing “very important” (Figure 2). The results reveal that regulating services received the highest ratings among the ecosystem services provided by UGSs, underscoring their significant importance to respondents. Water regulation and dust retention emerged as the most highly valued services, each receiving a mean score of 4.33, indicating their critical role in enhancing the functionality of UGSs. These services were closely followed by noise mitigation and carbon sequestration, both of which received mean scores of 4.26, reflecting their considerable importance in urban green spaces. Air temperature reduction was similarly highly valued, receiving a mean score of 4.24, highlighting its significance in regulating the urban microclimate. Cultural services, including aesthetic appreciation and outdoor leisure and recreation, received moderately high ratings, with mean scores of 4.12 and 4.07, respectively, suggesting their positive impact on quality of life. Biodiversity conservation, classified as a supporting service, similarly received a mean score of 4.07, indicating its recognized importance in maintaining ecological balance within UGSs. In contrast, provisioning services were perceived as relatively less important, receiving lower ratings compared with other service categories. The production of food, timber, and energy received mean scores of 3.65, 3.38, and 3.30, respectively, suggesting that these services were viewed as less critical in the context of urban green spaces.

3.3. Factor Groupings Associated with UGS ES

A factor analysis of the UGS ecosystem services identified three primary factors, which collectively account for a cumulative variance of 77.51%, providing a comprehensive understanding of the underlying structure of respondents’ preferences. These factors exhibit strong reliability, with an overall reliability coefficient of 0.94 (Table 3), indicating the robustness and consistency of the factor structure. The first factor, termed regulating services, accounts for 54.82% of the total variance and shows the highest reliability (α = 0.91, M = 4.28), underscoring the importance of these services in shaping respondents’ preferences. This factor includes services associated with environmental regulation, with the highest loadings observed for stormwater attenuation (0.90), dust reduction (0.85), and carbon sequestration (0.82), emphasizing the relevance of these services. Moreover, noise mitigation (0.80) and temperature mitigation (0.59) also exhibit high loadings on this factor, underscoring a strong social preference for ecosystem services that address pressing environmental challenges, such as pollution and climate regulation.
The second factor, termed provisioning services and habitat, accounts for 15.74% of the variance and also demonstrates strong reliability (α = 0.88, M = 3.60), further confirming the robustness of this factor structure. This factor primarily includes services related to the provision of energy (0.93), timber (0.91), and food (0.83), with biodiversity conservation contributing to a lesser degree (0.55). These results suggest a moderate social preference for provisioning services and habitat conservation, although they were rated lower than regulating services, indicating that respondents place more value on environmental regulation. The third factor, identified as cultural services, accounts for 6.95% of the variance and shows good reliability (α = 0.84, M = 4.10), reinforcing the validity of this dimension in the context of UGS ecosystem services. The primary services within this factor include outdoor leisure and recreation (0.79) and aesthetic appreciation (0.77), emphasizing the importance respondents attach to cultural and recreational benefits provided by UGSs. The factor analysis indicates that respondents prioritize regulating services above all, followed by cultural services, with provisioning services and habitat conservation being assigned relatively lower importance. This suggests that, while environmental regulation and cultural benefits are highly valued by respondents, provisioning services (such as food, timber, and energy) occupy a secondary role in the social valuation of UGSs.

3.4. ES Groups and Demographic Factors

The analysis revealed that respondents’ social preferences for various ecosystem service (ES) categories differed significantly according to several socio-demographic factors, including age, income, formal education level, occupation, and place of residence (urban vs. rural and coastal vs. inland) (Table 4). Among these factors, education level and place of residence (coastal vs. inland) had significant effects on all three ES categories. In general, respondents with higher levels of education demonstrated greater ESSP scores. Similarly, individuals residing in coastal areas reported higher ESSP scores than those living inland. These findings suggest that educational attainment and geographical location play key roles in shaping social preferences for ecosystem services offered by urban green spaces.
The patterns of ESSPs among respondents from diverse occupational backgrounds were intricate and multifaceted (Table 5). Respondents in leadership positions, including those from government, business, and other organizations, consistently assigned the highest preference scores across all three dimensions of ecosystem services. In contrast, respondents working in the service sector and university students majoring in natural sciences and medicine demonstrated a strong preference for regulating services. Additionally, individuals from the service sector, professionals, and those in mid-level occupations placed greater value on cultural services compared with respondents from other occupational fields. Leaders in government, corporations, and similar organizations also exhibited significantly stronger preferences for provisioning and habitat services compared with respondents from other occupational groups.
Significant effects of age, income, and residential location (urban vs. rural) on ESSPs were observed across two ecosystem service dimensions (Table 4). Younger respondents and those with lower incomes generally placed greater importance on regulating services as well as provisioning and habitat services. In contrast, no significant differences in preferences for cultural services were observed across different ages or income groups. Urban residents exhibited stronger preferences for regulating and cultural services compared with their rural counterparts. However, no significant differences were found between urban and rural residents in their preferences for provisioning and habitat services. Gender did not significantly influence preferences for any of the ecosystem service dimensions, as no gender-based differences in ESSPs were found across the three ES groups.

3.5. The Influence of KEE and Religion on ESSPs

One-way ANOVA indicated that both KEE and religiosity had a significant impact on ESSPs across all three dimensions of ecosystem services (Table 5). In general, respondents with higher levels of KEE and religiosity consistently assigned higher ESSP scores across regulating, cultural, and provisioning and habitat services (Figure 3).
Post hoc analysis revealed significant differences in social preferences for regulating services based on KEE levels. Respondents with professional-level KEE exhibited significantly higher ESSP scores for both cultural and provisioning and habitat services compared with those with moderate or no KEE. However, no significant differences in ESSP scores were observed between respondents with moderate and no KEE for these two services.
Additionally, respondents with high religiosity (level 7) assigned significantly higher mean ESSP scores across all three dimensions—regulating (M = 4.87), provisioning and habitat (M = 4.70), and cultural (M = 4.81) services—compared with those with lower religiosity levels. Interestingly, no significant differences in ESSP scores were observed among respondents with religiosity levels ranging from 0 (non-believers) to 6.
In the regression models, the variance inflation factor (VIF) values were all below 2, suggesting the absence of multicollinearity among the variables [41]. The inclusion of KEE (Model 2) and, subsequently, religiosity (Model 3) significantly enhanced the explained variance in ESSPs across all three ecosystem service dimensions. The inclusion of KEE improved the explained variance by approximately 1%, while the addition of religiosity in Model 3 contributed an additional 3% to the explained variance (Tables S1–S3).
Stepwise regression analysis (Table S4) identified KEE and religiosity as significant predictors for all three ecosystem service dimensions. Traditional socio-demographic factors, including age, education, and income, which are typically regarded as strong predictors of ESSP, were selected in only one of the three models. Urban vs. rural residence and occupation emerged as significant predictors for two of the ecosystem service dimensions. Interestingly, gender was identified as a significant predictor across all three ecosystem service dimensions, underscoring its relevance in shaping ESSP.

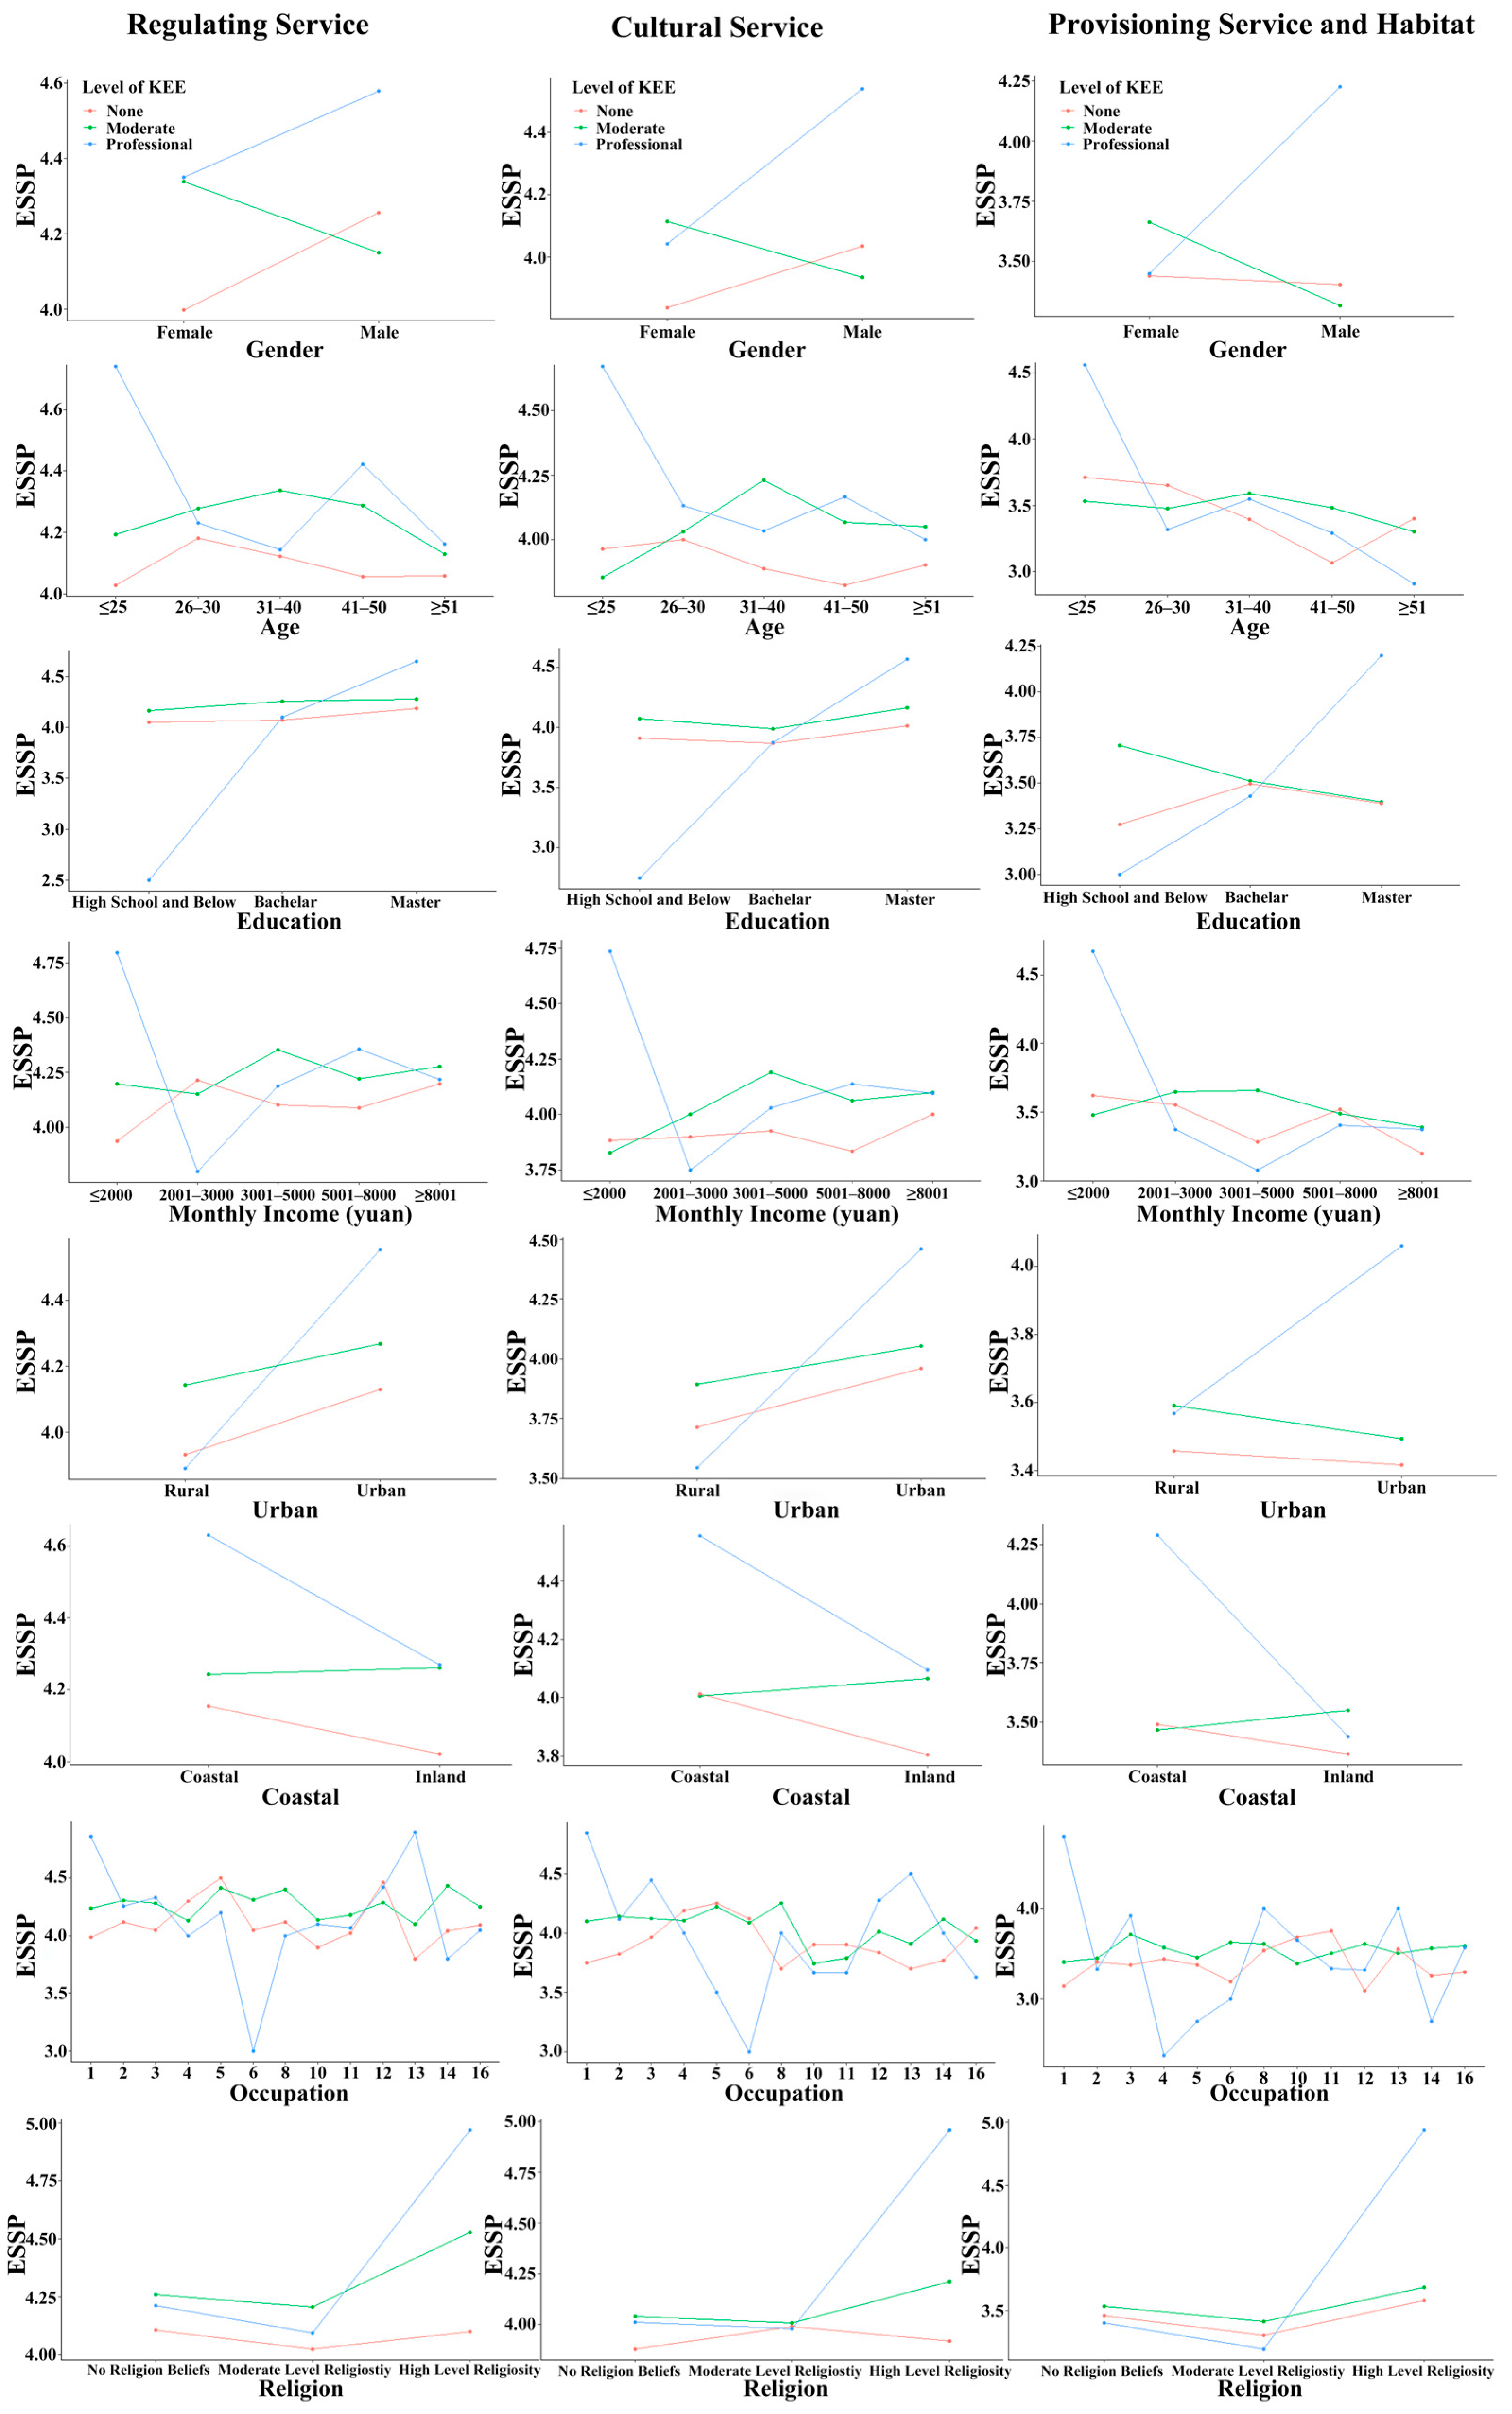
3.6. The Moderating Effect of KEE on the Relationship Between Demographic Factors and ESSPs

This study found that KEE significantly moderated the relationship between socio-demographic factors and ESSP across three ecosystem service categories: provisioning services and habitat, regulating services, and cultural services (Figure 3). The moderating effect of KEE was consistent across all three ecosystem service dimensions. Moderate levels of KEE had a significant positive impact on women’s preferences for all three ecosystem service dimensions. However, professional-level KEE did not substantially enhance ESSPs among women. In contrast, for men, moderate levels of KEE had little effect, while professional levels of KEE significantly improved their ESSPs across all dimensions.
The influence of KEE on ESSPs was more pronounced among respondents with higher education levels. Moderate levels of KEE enhanced ESSPs across all educational levels. However, professional-level KEE significantly increased ESSPs for respondents holding at least a master’s degree, while the effect was less pronounced for those with only a bachelor’s degree or lower educational qualifications.
KEE exerted a stronger moderating effect on younger respondents compared with older age groups. For individuals under 25, moderate levels of KEE led to a moderate increase in ESSPs, with professional KEE further amplifying preferences. For respondents aged 31–40, moderate levels of KEE significantly enhanced ESSPs, although professional-level KEE contributed only a marginal additional effect. In contrast, respondents aged 41–50 exhibited a significant improvement in ESSPs with professional-level KEE, while those aged over 51 showed no substantial effect of KEE on their ESSPs. Moderate levels of KEE had a significant positive effect on ESSPs among respondents with monthly incomes below RMB 2000, primarily students, as well as those earning between RMB 5001 and 8000, who generally had higher educational attainment. Professional-level KEE was more readily embraced by the higher-income group, leading to enhanced ESSPs.
Moderate levels of KEE enhanced ESSPs in both urban and rural respondents. However, professional-level KEE exerted a stronger effect on urban residents, significantly improving their ESSPs, while having a minimal impact on rural residents. Similarly, moderate levels of KEE improved ESSPs among both coastal and inland respondents, but professional-level KEE had a significant effect only on coastal residents, with no substantial improvement observed among inland residents.

4. Discussion

4.1. The Most Preferred ESs Are Associated with the Main Ecosystem Functions and Stakeholder Benefits

Our findings clearly highlight a preference for regulating and cultural ecosystem services (ESSP), with respondents exhibiting greater inclination toward these services compared with provisioning services (Figure 2). This trend is consistent with recent studies indicating a societal shift toward valuing regulating and cultural services more than provisioning services. For example, research in South African national parks found that visitors prioritize cultural services, such as recreation and a sense of place, alongside regulating services like biodiversity conservation, over provisioning services such as food and water supply [42]. Similarly, a study in Spain demonstrated a preference for regulating and cultural services like air purification and recreational opportunities over provisioning services such as agricultural production [16].
Our study contributes to this growing body of literature, particularly by showing that urban green spaces (UGS) are valued for their capacity to regulate environmental conditions (e.g., water regulation, dust retention, noise mitigation) and promote cultural well-being (e.g., aesthetic appreciation and outdoor recreation), rather than primarily for provisioning services such as food and timber. This preference reflects a broader societal shift toward prioritizing long-term ecological sustainability and quality of life, which underscores the importance of UGSs in promoting both environmental and social outcomes in urban contexts.
A review of recent studies reveals key patterns that support our findings. First, ecosystem services most valued by individuals often correspond to the core functions of the ecosystem or service provider. For example, in protected natural areas, regulating services and conservation values are typically prioritized [16,20], while in multi-functional land-use areas, traditional practices related to regulating and cultural services are often most valued. In agricultural areas, provisioning services like food production take precedence [16]. Our results align with these findings, as UGS respondents placed the highest value on regulating services such as water regulation, dust retention, carbon sequestration, and air temperature reduction services that enhance environmental resilience and public health.
Moreover, our results support the notion that individuals assign the highest value to ecosystem services offering direct benefits. For example, mangrove ecosystems, which provide both regulating services (e.g., waste processing, erosion control) and provisioning services (e.g., timber), are valued differently depending on individuals’ direct reliance on these services [43,44]. In urban areas, where residents typically benefit from cultural services like tourism and aesthetic value, these services are increasingly seen as essential for addressing contemporary challenges such as climate change, biodiversity loss, and public health.

4.1.1. The MA ES Framework Is Empirically Supported by ESSP Results

The Millennium Ecosystem Assessment (MA) framework categorizes ecosystem ser-vices into provisioning, regulating, cultural, and supporting services, with the latter often excluded from evaluations due to concerns about double-counting. Our findings provide empirical support for this classification, as the 11 ecosystem services assessed in our study align with three underlying dimensions: provisioning, regulating, and cultural services. This suggests that the MA framework is not only scientifically robust but also valid in capturing how individuals perceive and prioritize different types of ecosystem services. These results add empirical weight to the framework’s applicability in both ecological assessments and social evaluations of ecosystem services.
Previous studies also corroborate our findings, demonstrating that the MA classification aligns with public perceptions of ecosystem services. For instance, research on Spanish river ecosystems confirms the distinction between provisioning services (e.g., freshwater) and regulating services (e.g., water purification), with cultural services (e.g., recreation) perceived separately, all in alignment with the MA framework [45]. This consistency across various case studies strengthens the MA framework as a reliable tool for understanding how people value ecosystem services in different contexts.

4.1.2. The Influence of Level of KEE on ESSP

Our study underscores the significant role of Knowledge of Environmental Ecology (KEE) as a predictor of ESSP, demonstrating that KEE has a more profound impact on individuals’ preferences for ecosystem services than formal education levels. Specifically, enhancing KEE appears to be a more effective strategy for improving public awareness and appreciation of ecosystem services across all categories—provisioning, regulating, and cultural—than merely increasing general education levels. This finding aligns with the work of Lewan and Söderqvist (2002) [46], who highlighted the importance of KEE in fostering recognition of ecosystem services in policy and economics, and Martin-Lopez (2012) [16], who stressed the role of local ecological knowledge in promoting sustainable management practices.
Our results further suggest that KEE enhances the recognition of “non-obvious ecosystem services” among respondents. While it is widely acknowledged that UGS provide regulating services, fewer individuals are aware of the cultural services such as leisure, recreation, and aesthetic appreciation or provisioning services such as food production and energy generation that these spaces provide [47,48,49]. Thus, KEE has the potential to broaden public awareness of the wide range of ecosystem services, moving beyond the commonly recognized regulating services to include those that are less intuitively understood
Interestingly, KEE’s impact on ESSP varies across demographic groups. Younger individuals, particularly those under 25, show greater receptiveness to environmental education, likely due to their higher engagement with public issues and increased access to information technologies [50]. Urban and coastal residents, along with middle- and high-income groups, also exhibit a stronger incorporation of KEE into their worldviews due to their higher exposure to educational and environmental initiatives [51]. In contrast, older individuals and rural residents, who have limited access to such resources, show less responsiveness to KEE exposure [52]. These demographic differences imply that KEE initiatives need to be tailored to the educational, age, and geographical contexts of specific groups to maximize their effectiveness.
Additionally, our findings regarding the differential impact of professional-level KEE on ESSP align with existing studies. For instance, individuals with higher professional KEE, particularly those holding master’s degrees or working in environmental fields, tend to exhibit more refined preferences for ecosystem services [53]. This suggests that targeted environmental education, particularly at the professional and community levels, can significantly enhance public understanding and valuation of ecosystem services, especially for less obvious services

4.2. Religion and ESSP

Within the MA framework, both culture and religion are recognized as significant indirect drivers of ecosystem services [1,54]. Culture influences how individuals process information and form judgments based on their personal values and belief systems, which, in turn, shape their attitudes toward ecosystem services (ES). Religion, as one of the most influential cultural factors, plays a particularly significant role in shaping individuals’ ESSP. Historically, religion has been linked to environmental outcomes, particularly following White’s (1967) observation of environmental degradation associated with certain interpretations of Judeo-Christian teachings [55]. This recognition has catalyzed growing interest in exploring the complex relationships between religion, environmental values, and sustainability outcomes. Geographic variation in major world religions contributes to differences in environmental impacts across nations [56]. A more widely accepted approach, however, examines the interplay between religious values, environmental attitudes, and the practical outcomes these relationships produce, including shifts in environmental behaviors [57]. Despite this growing interest, empirical studies directly investigating how religiosity—the devoutness or intensity of one’s religious beliefs—affects ESSP remain limited.
Our findings suggest that enhancing ESSP can be effectively facilitated through the integration of KEE within religious contexts. Recent studies indicate that religious practices serve as effective platforms for promoting environmental sustainability by cultivating pro-environmental behaviors among followers. Religious education holds the potential to shape individuals’ perspectives on environmental stewardship, with the concept of “religious stewardship” positioning humans as custodians of the natural world. This religious framework encourages behaviors that align with sustainable environmental practices. For instance, the incorporation of ecological values into religious teachings has been demonstrated to enhance environmental responsibility among individuals [58].
The concept of “ecological conversion”, as introduced by Pope Francis in his encyclical Laudato Si’, represents a central element of this approach. “Integral Ecology”, as articulated by the Pope, combines spiritual values with environmental responsibility, positing that faith traditions play a crucial role in addressing the environmental crises confronting humanity. Through this, religion not only provides a spiritual framework for environmental justice but also inspires individuals and communities to embrace more sustainable lifestyles. The concept of ecological conversion encourages individuals to regard environmental responsibility as both a moral and spiritual imperative, rather than merely a secular or scientific concern [59].
Religious organizations can play an essential role in facilitating sustainability transitions by mobilizing communities and promoting pro-environmental values. The capacity of religious institutions to drive societal change is substantial, as they frequently possess well-established, extensive networks and a profound sense of community. They have the ability to promote sustainability practices both internally within their organizations and externally through extensive community engagement. By advocating for environmental ethics grounded in religious teachings, these organizations can facilitate the widespread adoption of sustainable practices across diverse communities. Religious actors have demonstrated significant potential in scaling sustainability initiatives and shaping public policy on environmental issues [60].
Furthermore, community-based knowledge exchanges, especially among indigenous religious groups, have demonstrated significant success in transmitting ecological knowledge through religious practices. Many indigenous communities have long employed spiritual frameworks to sustainably manage natural resources, with this knowledge frequently being transmitted through religious rituals and practices. These approaches underscore the long-term potential of religion as a tool for promoting environmental stewardship, as evidenced by various case studies that have integrated ecological knowledge with spiritual teachings [61].

4.3. Policy Implications

Understanding ESSP within the general population is crucial for effective planning, engineering, and policy development. By prioritizing ecosystem services that are most highly valued by society, policymakers can optimize social welfare, especially in contexts where land and resource availability are limited. In this study, regulating services—such as noise reduction, dust retention, carbon sequestration, water conservation, and temperature mitigation—were identified as the most critical services provided by UGS. Therefore, optimizing these services in green space planning and design should be a primary focus for urban planners and policymakers. To achieve this, enhanced communication between planners, designers, and scientific researchers is essential. Ensuring that regulating services are effectively integrated into green infrastructure necessitates a multidisciplinary approach. Additionally, high-level policy arrangements can foster collaboration among these groups, thereby enhancing the delivery of the ecosystem services most valued by the public.
Investing in KEE programs and elevating public awareness regarding the diversity and benefits of ecosystem services are pivotal strategies for enhancing ESSP. Our findings indicate that KEE initiatives may prove more effective than broadly enhancing formal education levels in terms of augmenting the general public’s recognition and appreciation of ecosystem services. By disseminating KEE through diverse public communication channels, individuals will acquire a more comprehensive understanding of lesser-known ecosystem services, thereby bolstering their support for government investments in green infrastructure. Tailoring KEE programs to distinct demographic groups will further enhance the effectiveness of these initiatives and contribute to more substantial improvements in ESSP. Based on our results, we developed a KEE dissemination plan specifically tailored to the needs and preferences of diverse demographic groups (Figure 4). This plan delineates the target groups, the appropriate level of KEE for each group, and the recommended dissemination strategies.
Leaders in Government and Corporate Management: These groups should serve as principal advocates for environmental education. As influential decision-makers, they can set the tone for policy changes and leverage their positions to promote KEE initiatives within their organizations and communities. Devoutly Religious Individuals: Religious leaders and organizations can also play a significant role in disseminating KEE. Religious teachings are often deeply rooted in environmental stewardship, and integrating KEE into religious activities can serve as a powerful means of raising awareness about ecosystem services. Aligning environmental protection messages with religious teachings can foster a broader societal commitment to sustainability. Rural and Inland Areas: Special emphasis should be placed on strengthening environmental education in rural and inland areas, where access to formal environmental education or KEE may be limited. These areas often face greater challenges related to environmental degradation; therefore, targeted educational programs designed to increase KEE levels can make a significant difference. Children and Students: Young people are prime targets for KEE programs, as they are more receptive to new ideas and more likely to engage in pro-environmental behaviors as they mature. Formal educational channels can be utilized to introduce moderate-level KEE to middle school students and professional-level KEE to college students. By instilling an awareness of ecosystem services early in life, future generations can become advocates for sustainable urban development.
Women tend to respond favorably to moderate levels of KEE, which can be disseminated through channels or products commonly utilized by women, such as cosmetics, household goods, and parent-child activities. These platforms can be leveraged to deliver environmental education in formats that align with everyday experiences and concerns. For men, higher levels of KEE may prove more effective, particularly through mass media channels such as internet-based knowledge-sharing platforms. Digital media, including social media, websites, and podcasts, can engage men, particularly younger, tech-savvy demographics, with more in-depth content on ecosystem services. Religious activities present a valuable opportunity to integrate KEE. By aligning environmental protection messages with religious teachings and incorporating references to ecology within religious doctrines, the message of sustainability can resonate deeply with devout individuals. These messages can underscore the ethical responsibility of individuals and communities to protect the environment, echoing religious principles of stewardship and care for creation.

4.4. Limitations of the Study

This study offers valuable insights into the social preferences for ecosystem services provided by urban green spaces (UGS) in China; however, several limitations must be acknowledged. The sample exhibits geographical bias, with 56.3% of respondents residing in coastal regions and 88% living in urban areas, which restricts the generalizability of the results to rural and inland populations, particularly in the western regions where UGS characteristics may differ significantly. Additionally, the sample is skewed towards higher educational attainment, with 67.8% holding at least a bachelor’s degree, potentially underrepresenting less-educated or higher-income groups and influencing the expressed preferences for ecosystem services. The reliance on self-reported survey data introduces the possibility of response biases, such as social desirability bias, and the use of an online questionnaire based solely on paid responses may compromise objectivity and reliability. Moreover, the pre-survey was conducted with undergraduate students, introducing demographic and cognitive biases that may affect the validity of the follow-up survey. Methodologically, while the factor analysis demonstrated strong reliability coefficients, identifying only three primary factors might oversimplify the complex nature of ecosystem service preferences, and the cross-sectional design limits the ability to observe changes over time. Lastly, the omission of spatial accessibility measures, such as the proximity and distribution of UGS, introduces uncertainty in understanding how physical access impacts public preferences, and the underrepresentation of respondents from western China means the findings may not fully reflect the preferences and needs of these distinct environmental and socio-economic contexts.

4.5. Future Research Directions

To address the identified limitations and enhance the understanding of social preferences for ecosystem services in urban green spaces, future research should pursue several key directions. Enhancing sample diversity is crucial, with efforts to achieve a more balanced representation of respondents from both coastal and inland regions, as well as from various urban and rural settings, particularly focusing on the western regions of China to capture regional variations. Incorporating spatial accessibility metrics through geospatial analysis and access trajectory data will provide a more comprehensive understanding of how proximity and distribution of UGS influence ecosystem service valuation. Conducting longitudinal studies will allow researchers to observe changes and trends in preferences over time, while mixed-methods approaches, such as qualitative interviews or focus groups, can offer deeper insights into the reasons behind certain preferences. Expanding the scope of ecosystem service categories to include a broader range of services will provide a more holistic view of UGS benefits. Utilizing advanced analytical techniques like Structural Equation Modeling (SEM) and geospatial analysis can examine more complex relationships between variables. Additionally, exploring additional moderators and mediators, such as cultural background and personal experiences with nature, will offer a more comprehensive understanding of the factors shaping ecosystem service preferences. Improving survey methodology by refining instruments to ensure clarity, reducing ambiguity, and minimizing response biases through strategies like ensuring anonymity will enhance the reliability and validity of future research. Finally, addressing the pre-survey sample limitations by using a more diverse pre-survey population and employing stratified sampling techniques will ensure broader representativeness and reduce potential biases, thereby strengthening the external validity of future studies.

5. Conclusions

This study elucidates the complex factors shaping ESSP, demonstrating that beyond traditional socio-demographic characteristics—such as age, income, and education—elements like local KEE and religiosity play a pivotal role. Our findings demonstrate that KEE enhances ESSP, particularly for regulating and cultural services, with professional-level KEE exerting a strong impact on urban, younger, and more educated populations. Furthermore, religiosity significantly influences ESSP, suggesting that religious communities could serve as key facilitators in promoting environmental awareness through faith-based initiatives. The study also corroborates the MA framework, demonstrating that individuals prioritize regulating services such as water conservation and carbon sequestration, particularly in urban areas. These insights carry significant policy implications, underscoring the necessity for tailored educational programs that address specific demographic groups and integrate KEE into everyday practices. By concentrating on fostering public awareness through KEE and incorporating cultural and knowledge-based factors into policy design, we can better align ecosystem service management with public preferences, ultimately promoting more sustainable urban development and environmental stewardship.

Supplementary Materials

The following supporting information can be downloaded at: https://www.mdpi.com/article/10.3390/su17052166/s1, Table S1: Hierarchical regression analysis between demographic variables and social preference for regulating services; Table S2: Hierarchical regression analysis between demographic variables and social preference for cultural services; Table S3: Hierarchical regression analysis between demographic variables and social preference for provisioning service & habitat; Table S4: Stepwise regression analysis between social-demographic variables and ESSP; Table S5: Studies analyzing social preference of ecosystem services.

Author Contributions

Conceptualization, J.L., H.-L.Z., M.M.N., Z.Z. and H.X.; methodology, J.L., H.-L.Z. and H.X.; validation, J.L., F.M., W.W., C.W., R.W. and Y.C.; formal analysis, H.-L.Z., M.M.N. and H.X.; investigation, J.L. and H.-L.Z.; resources, J.L.; data curation, J.L., F.M., W.W., C.W., R.W. and Y.C.; writing—original draft preparation, J.L., H.-L.Z., Z.Z. and H.X.; writing—review and editing, J.L., H.-L.Z., M.M.N., Z.Z. and H.X.; visualization, J.L., H.-L.Z., Z.Z. and H.X.; supervision, M.M.N., Z.Z. and H.X.; project administration, J.L. and H.-L.Z.; funding acquisition, H.-L.Z. and Z.Z. All authors have read and agreed to the published version of the manuscript.

Funding

This research was funded by the National Natural Science Foundation of China (No. 21976185) and the Qingdao Postdoctoral Application Research Project (QDBSH20240201028).

Institutional Review Board Statement

This study qualified for institution IRB waiver as this study utilized data collected with the informed consent of the participants. The data were anonymously gathered through the online survey platform Questionnaire Star, ensuring confidentiality. The research adhered to all relevant local laws and ethical guidelines throughout the data collection process.

Informed Consent Statement

Informed consent was obtained from all subjects involved in the study. Each questionnaire was accompanied by a comprehensive informed consent form, ensuring that participants were thoroughly briefed on the study’s objectives, contents, and their rights prior to participation.

Data Availability Statement

Data will be made available on request.

Conflicts of Interest

The authors declare that they have no known competing financial interests or personal relationships that could have appeared to influence the work reported in this paper.

Abbreviations

The following abbreviations are used in this manuscript:
ESEcosystem services
ESSPEcosystem Service Social Preferences
KEEEnvironmental and Ecological Knowledge
UGSUrban Green Spaces
VIFVariance inflation factor
MAMillennium Ecosystem Assessment

References

  1. MA. Ecosystems and Human Well-Being: The Assessment Series (Four Volumes and Summary); Island Press: Washington, DC, USA, 2005. [Google Scholar]
  2. Hu, Z.; Yang, X.; Yang, J.; Yuan, J.; Zhang, Z. Linking landscape pattern, ecosystem service value, and human well-being in Xishuangbanna, southwest China: Insights from a coupling coordination model. Glob. Ecol. Conserv. 2021, 27, e01583. [Google Scholar] [CrossRef]
  3. Dong, X.; Wang, X.; Wei, H.; Fu, B.; Wang, J.; Uriarte-Ruiz, M. Trade-offs between local farmers’ demand for ecosystem services and ecological restoration of the Loess Plateau, China. Ecosyst. Serv. 2021, 49, 101295. [Google Scholar] [CrossRef]
  4. Kaltenborn, B.P.; Linnell, J.D.C.; Gomez-Baggethun, E. Can cultural ecosystem services contribute to satisfying basic human needs? A case study from the Lofoten archipelago, northern Norway. Appl. Geogr. 2020, 120, 102229. [Google Scholar] [CrossRef]
  5. Washbourne, C.-L.; Goddard, M.A.; Le Provost, G.; Manning, D.A.C.; Manning, P. Trade-offs and synergies in the ecosystem service demand of urban brownfield stakeholders. Ecosyst. Serv. 2020, 42, 101074. [Google Scholar] [CrossRef]
  6. Campbell-Arvai, V. Engaging urban nature: Improving our understanding of public perceptions of the role of biodiversity in cities. Urban Ecosyst. 2019, 22, 409–423. [Google Scholar] [CrossRef]
  7. Wilkins, E.J.; Sinclair, W.; Miller, H.M.; Schuster, R.M. Does Proximity to Wetlands Matter? A Landscape-Level Analysis of the Influence of Local Wetlands on the Public’s Concern for Ecosystem Services and Conservation Involvement. Wetlands 2019, 39, 1271–1280. [Google Scholar] [CrossRef]
  8. Lapointe, M.; Cumming, G.S.; Gurney, G.G. Comparing Ecosystem Service Preferences between Urban and Rural Dwellers. Bioscience 2019, 69, 108–116. [Google Scholar] [CrossRef]
  9. Wang, R.; Qi, R.; Cheng, J.; Zhu, Y.; Lu, P. The behavior and cognition of ecological civilization among Chinese university students. J. Clean. Prod. 2020, 243, 118464. [Google Scholar] [CrossRef]
  10. Meli, P.; Vieli, L.; Spirito, F.; Reyes-Riveros, R.; Gonzalez-Suhr, C.; Altamirano, A. The importance of considering human well-being to understand social preferences of ecosystem services. J. Nat. Conserv. 2023, 72, 126344. [Google Scholar] [CrossRef]
  11. Grilli, G.; Tyllianakis, E.; Luisetti, T.; Ferrini, S.; Turner, R.K. Prospective tourist preferences for sustainable tourism development in Small Island Developing States. Tour. Manag. 2021, 82, 104178. [Google Scholar] [CrossRef]
  12. Li, K.; Hou, Y.; Fu, Q.; Randall, M.T.; Andersen, P.S.; Qiu, M.; Skov-Petersen, H. Integrating decision-making preferences into ecosystem service conservation area identification: A case study of water-related ecosystem services in the Dawen River watershed, China. J. Environ. Manag. 2023, 340, 117972. [Google Scholar] [CrossRef] [PubMed]
  13. Zhang, K.; Tang, X.; Zhao, Y.; Huang, B.; Huang, L.; Liu, M.; Luo, E.; Li, Y.; Jiang, T.; Zhang, L.; et al. Differing perceptions of the youth and the elderly regarding cultural ecosystem services in urban parks: An exploration of the tour experience. Sci. Total Environ. 2022, 821, 153388. [Google Scholar] [CrossRef]
  14. Ge, Y.; Chen, S.; Ma, Y.; Wang, Y.; Guo, Y.; Gan, Q. Ecosystem Services and Public Perception of Green Infrastructure from the Perspective of Urban Parks: A Case Study of Luoyang City, China. Sustainability 2024, 16, 7657. [Google Scholar] [CrossRef]
  15. Pinto, L.V.; Inacio, M.; Bogdzevic, K.; Kalinauskas, M.; Gomes, E.; Pereira, P. Factors affecting cultural ecosystem services use in Vilnius (Lithuania): A participatory mapping survey approach. Heliyon 2023, 9, e15384. [Google Scholar] [CrossRef] [PubMed]
  16. Martin-Lopez, B.; Iniesta-Arandia, I.; Garcia-Llorente, M.; Palomo, I.; Casado-Arzuaga, I.; Garcia Del Amo, D.; Gomez-Baggethun, E.; Oteros-Rozas, E.; Palacios-Agundez, I.; Willaarts, B.; et al. Uncovering Ecosystem Service Bundles through Social Preferences. PLoS ONE 2012, 7, e38970. [Google Scholar] [CrossRef] [PubMed]
  17. Sang, A.O.; Sang, N.; Hedblom, M.; Sevelin, G.; Knez, I.; Gunnarsson, B. Are path choices of people moving through urban green spaces explained by gender and age? Implications for planning and management. Urban For. Urban Green. 2020, 49, 126628. [Google Scholar] [CrossRef]
  18. Daigle, R.M.; Haider, W.; Fernandez-Lozada, S.; Irwin, K.; Archambault, P.; Cote, I.M. From coast to coast: Public perception of ocean-derived benefits in Canada. Mar. Policy 2016, 74, 77–84. [Google Scholar] [CrossRef]
  19. Zhao, W.; Zhang, L.; Li, X.; Peng, L.; Wang, P.; Wang, Z.; Jiao, L.; Wang, H. Residents’ Preference for Urban Green Space Types and Their Ecological-Social Services in China. Land 2022, 11, 2239. [Google Scholar] [CrossRef]
  20. Martin-Lopez, B.; Montes, C.; Benayas, J. Influence of user characteristics on valuation of ecosystem services in Do(n)over-tildeana Natural Protected Area (south-west Spain). Environ. Conserv. 2007, 34, 215–224. [Google Scholar] [CrossRef]
  21. Borresen, S.T.; Ulimboka, R.; Nyahongo, J.; Ranke, P.S.; Skjaervo, G.R.; Roskaft, E. The role of education in biodiversity conservation: Can knowledge and understanding alter locals’ views and attitudes towards ecosystem services? Environ. Educ. Res. 2023, 29, 148–163. [Google Scholar] [CrossRef]
  22. Casado-Arzuaga, I.; Madariaga, I.; Onaindia, M. Perception, demand and user contribution to ecosystem services in the Bilbao Metropolitan Greenbelt. J. Environ. Manag. 2013, 129, 33–43. [Google Scholar] [CrossRef] [PubMed]
  23. Bhattacharjee, A.; Sadadev, B.M.; Karmacharya, D.K.; Baral, R.; Perez-Garcia, J.M.; Gimenez Casalduero, A.; Sanchez-Zapata, J.A.; Anadon, J.D. Local ecological knowledge and education drive farmers’ contrasting perceptions of scavengers and their function in Nepal. People Nat. 2022, 4, 786–803. [Google Scholar] [CrossRef]
  24. Katuwal, H.B.; Zhang, M.; Baral, H.S.; Sharma, H.P.; Quan, R.-C. Assessment of farmers’ knowledge and perceptions towards farmland birds show the need of conservation interventions. Glob. Ecol. Conserv. 2021, 27, e01563. [Google Scholar] [CrossRef]
  25. Ngulani, T.; Shackleton, C.M. Use of public urban green spaces for spiritual services in Bulawayo, Zimbabwe. Urban For. Urban Green. 2019, 38, 97–104. [Google Scholar] [CrossRef]
  26. McElwee, P.; Vu, H.; Vo, G.; Le, D. Patriotism, place, and provisioning: Assessing cultural ecosystem servicesthrough longitudinal and historical studies in Vietnam. Ecol. Soc. 2022, 27, 3. [Google Scholar] [CrossRef]
  27. Nations, U. World Urbanaization Prospects: The 2014 Revision; Department of Economic and Social Affairs, Population Division: New York, NY, USA, 2015. [Google Scholar]
  28. Ko, H.; Son, Y. Perceptions of cultural ecosystem services in urban green spaces: A case study in Gwacheon, Republic of Korea. Ecol. Indic. 2018, 91, 299–306. [Google Scholar] [CrossRef]
  29. Middle, I.; Dzidic, P.; Buckley, A.; Bennett, D.; Tye, M.; Jones, R. Integrating community gardens into public parks: An innovative approach for providing ecosystem services in urban areas. Urban For. Urban Green. 2014, 13, 638–645. [Google Scholar] [CrossRef]
  30. Shams, I.; Barker, A. Barriers and opportunities of combining social and ecological functions of urban greenspaces—Users’ and landscape professionals’ perspectives. Urban For. Urban Green. 2019, 39, 67–78. [Google Scholar] [CrossRef]
  31. Pantaloni, M.; Marinelli, G.; Santilocchi, R.; Minelli, A.; Neri, D. Sustainable Management Practices for Urban Green Spaces to Support Green Infrastructure: An Italian Case Study. Sustainability 2022, 14, 4243. [Google Scholar] [CrossRef]
  32. Zhang, W.; Kato, E.; Bhandary, P.; Nkonya, E.M.; Ibrahim, H.I.; Agbonlahor, M.U.; Ibrahim, H.Y. Communities’ Perceptions and Knowledge of Ecosystem Service. In Proceedings of the International Association of Agricultural Economists (IAAE) 2015 Conference, Milan, Italy, 9–14 August 2015. [Google Scholar]
  33. Khachatryan, N. Green education in the context of ecosystem services. Econ. Financ. Account. 2024, 1, 18. [Google Scholar] [CrossRef]
  34. Zoderer, B.M.; Stanghellini, P.S.L.; Tasser, E.; Walde, J.; Wieser, H.; Tappeiner, U. Exploring socio-cultural values of ecosystem service categories in the Central Alps: The influence of socio-demographic factors and landscape type. Reg. Environ. Change 2016, 16, 2033–2044. [Google Scholar] [CrossRef]
  35. Zhang, W.; Kato, E.; Bhandary, P.; Nkonya, E.; Ibrahim, H.I.; Agbonlahor, M.; Ibrahim, H.Y.; Cox, C. Awareness and perceptions of ecosystem services in relation to land use types: Evidence from rural communities in Nigeria. Ecosyst. Serv. 2016, 22, 150–160. [Google Scholar] [CrossRef]
  36. Sy, M.M.; Rey-Valette, H.; Figuieres, C.; Simier, M.; De Wit, R. The impact of academic information supply and familiarity on preferences for ecosystem services. Ecol. Econ. 2021, 183, 106959. [Google Scholar] [CrossRef]
  37. Suhartanto, D.; Dean, D.; Amalia, F.A.; Triyuni, N.N. Attitude formation towards green products evidence in Indonesia: Integrating environment, culture, and religion. Asia Pac. Bus. Rev. 2024, 30, 94–114. [Google Scholar] [CrossRef]
  38. Mari, L.M.; Terzani, S.; Turzo, T. Environmental, social, and governance disclosure: The role of religiosity at a cross-country level. In New Challenges in Corporate Governance: Theory and Practice; University of Naples: Naples, Italy, 2019. [Google Scholar]
  39. Brislin, R.W.; Leibowitz, H.W. The effect of separation between test and comparison objects on size constancy at various age-levels. Am. J. Psychol. 1970, 83, 372–376. [Google Scholar] [CrossRef] [PubMed]
  40. Chen, Y.; Li, R.; Zhang, P.; Liu, X. WeChat engagement styles: Measuring the two processes of relatedness need, moderated by personality differences. Curr. Psychol. 2021, 40, 5445–5455. [Google Scholar] [CrossRef]
  41. Hair, J.; Black, W.; Babin, B. Anderson, R. Multivariate Data Analysis: A Global Perspective, 7th ed.; Pearson Education: London, UK, 2010. [Google Scholar]
  42. Ament, J.M.; Moore, C.A.; Herbst, M.; Cumming, G.S. Cultural Ecosystem Services in Protected Areas: Understanding Bundles, Trade-Offs, and Synergies. Conserv. Lett. 2017, 10, 440–450. [Google Scholar] [CrossRef]
  43. Iftekhar, M.S. An overview of mangrove management strategies in three South Asian countries: Bangladesh, India and Sri Lanka. Int. For. Rev. 2008, 10, 38–51. [Google Scholar] [CrossRef]
  44. Warren-Rhodes, K.; Schwarz, A.-M.; Boyle, L.N.; Albert, J.; Agalo, S.S.; Warren, R.; Bana, A.; Paul, C.; Kodosiku, R.; Bosma, W.; et al. Mangrove ecosystem services and the potential for carbon revenue programmes in Solomon Islands. Environ. Conserv. 2011, 38, 485–496. [Google Scholar] [CrossRef]
  45. Vidal-Abarca Gutierrez, M.R.; Suarez Alonso, M.L. Which are, what is their status and what can we expect from ecosystem services provided by Spanish rivers and riparian areas? Biodivers. Conserv. 2013, 22, 2469–2503. [Google Scholar] [CrossRef]
  46. Lewan, L.; Söderqvist, T. Knowledge and recognition of ecosystem services among the general public in a drainage basin in Scania, Southern Sweden. Ecol. Econ. 2002, 42, 459–467. [Google Scholar] [CrossRef]
  47. Dai, P.; Zhang, S.; Hou, H.; Yang, Y.; Liu, R. Valuing sports services in urban parks: A new model based on social network data. Ecosyst. Serv. 2019, 36, 100891. [Google Scholar] [CrossRef]
  48. Shi, Y.; Ge, Y.; Chang, J.; Shao, H.; Tang, Y. Garden waste biomass for renewable and sustainable energy production in China: Potential, challenges and development. Renew. Sustain. Energy Rev. 2013, 22, 432–437. [Google Scholar] [CrossRef]
  49. Xie, Q.; Yue, Y.; Hu, D. Residents’ Attention and Awareness of Urban Edible Landscapes: A Case Study of Wuhan, China. Forests 2019, 10, 1142. [Google Scholar] [CrossRef]
  50. Darvill, R.; Lindo, Z. Quantifying and mapping ecosystem service use across stakeholder groups: Implications for conservation with priorities for cultural values. Ecosyst. Serv. 2015, 13, 153–161. [Google Scholar] [CrossRef]
  51. Nummela, O.P.; Sulander, T.T.; Heinonen, H.S.; Uutela, A.K. Self-rated health and indicators of SES among the ageing in three types of communities. Scand. J. Public Health 2007, 35, 39–47. [Google Scholar] [CrossRef] [PubMed]
  52. Rantanen, T.; Portegijs, E.; Viljanen, A.; Eronen, J.; Saajanaho, M.; Tsai, L.-T.; Kauppinen, M.; Palonen, E.-M.; Sipila, S.; Iwarsson, S.; et al. Individual and environmental factors underlying life space of older people—Study protocol and design of a cohort study on life-space mobility in old age (LISPE). BMC Public Health 2012, 12, 1018. [Google Scholar] [CrossRef]
  53. Kitagawa, F.; Lightowler, C. Knowledge exchange: A comparison of policies, strategies, and funding incentives in English and Scottish higher education. Res. Eval. 2013, 22, 1–14. [Google Scholar] [CrossRef]
  54. IPBES. The IPBES Regional Assessment Report on Biodiversity and Ecosystem Services for Asia and the Pacific; IPBES: Bonn, Germany, 2018. [Google Scholar]
  55. White, L. The historical roots of our ecological crisis. Science 1967, 155, 1203–1207. [Google Scholar] [CrossRef] [PubMed]
  56. Sodhi, N.S.; Lee, T.M.; Sekercioglu, C.H.; Webb, E.L.; Prawiradilaga, D.M.; Lohman, D.J.; Pierce, N.E.; Diesmos, A.C.; Rao, M.; Ehrlich, P.R. Local people value environmental services provided by forested parks. Biodivers. Conserv. 2010, 19, 1175–1188. [Google Scholar] [CrossRef]
  57. Gifford, R.; Nilsson, A. Personal and social factors that influence pro-environmental concern and behaviour: A review. Int. J. Psychol. 2014, 49, 141–157. [Google Scholar] [CrossRef] [PubMed]
  58. Altmeyer, S. Religious education for ecological sustainability: An initial reality check using the example of everyday decision-making. J. Relig. Educ. 2021, 69, 57–74. [Google Scholar] [CrossRef]
  59. Christie, I.; Gunton, R.M.; Hejnowicz, A.P. Sustainability and the common good: Catholic Social Teaching and ‘Integral Ecology’ as contributions to a framework of social values for sustainability transitions. Sustain. Sci. 2019, 14, 1343–1354. [Google Scholar] [CrossRef]
  60. Koehrsen, J. Religious agency in sustainability transitions: Between experimentation, upscaling, and regime support. Environ. Innov. Soc. Transit. 2018, 27, 4–15. [Google Scholar] [CrossRef]
  61. Tschirhart, C.; Mistry, J.; Berardi, A.; Bignante, E.; Simpson, M.; Haynes, L.; Benjamin, R.; Albert, G.; Xavier, R.; Robertson, B.; et al. Learning from one another: Evaluating the impact of horizontal knowledge exchange for environmental management and governance. Ecol. Soc. 2016, 21, 41. [Google Scholar] [CrossRef]
Figure 1. Illustrates the residential locations of the respondents.
Sustainability 17 02166 g001
Figure 2. The social preferences for ecosystem services (ESSP) in 11 urban green spaces (UGS) were assessed using a Likert scale (1 = not important, 5 = very important), with a total of 1236 respondents.
Sustainability 17 02166 g002
Figure 3. The moderating effect of environmental and ecological knowledge (KEE) on the relationship between demographic factors and social preference towards urban green space ecosystem services. Note: In the survey, religiosity had 8 levels, with 0 = no beliefs, 7 = very devout. In order to make it more clear in the graph, we combined 8 levels to 3 levels, no beliefs = level 1, originally 1–6 = level 2, originally 7 = level 3.
Sustainability 17 02166 g003
Figure 4. The effective ecological and environmental knowledge (KEE) level and possible dissemination plans for different groups of people. Note: We only listed groups of people whose Ecosystem service social preference (ESSP) could be effectively moderated by level of KEE based on our analyses.
Sustainability 17 02166 g004
Table 1. Definition of 11 urban green space ecosystem services.
Ecosystem ServicesDefinition and Process
Carbon sequestrationSequestrate carbon through photosynthesis process in plants and carbon accumulating process in soil.
Air temperature reductionMitigate temperature through transpiration process in plants.
Dust retentionDust retention deposition processes of airborne particulate matter on the surfaces of plants.
Noise mitigationMitigate noise through blocking, absorbing, and reflecting sound waves by plants.
Water regulationRegulate hydrological cycle and water flow and mitigate the impact of storms.
Outdoor Leisure and recreationProvide space to allow people to engage in a leisure or recreation activity.
Aesthetics appreciationProvide space and occasions to allow people to have spiritual appreciation for beautiful, tranquil, or artistic scenery created by UGSs.
Food provisioningProvide edible food, for example, fruits or vegetables.
Energy provisioningProvide renewable biofuel through garden waste biomass.
Timber provisioningProvide timber through sustainable deforestation activity.
Biodiversity conservationProvide refuge for endangered plants and provide a habitat for animals like birds.
Table 2. Description of survey respondents (N = 1236).
Population ProfileSociodemographic VariableNumber of RespondentsPercentage (%)
GenderFemale61950.1
Male61749.9
Education levelMaster1119
Bachelor72758.8
High School and below39832.2
Age range≤2545436.7
26–301229.9
31–4030724.8
41–5023619.1
≥511179.5
Monthly Income
(RMB)
≤200037830.6
2001–3000756.1
3001–500023218.8
5001–800028423.0
≥800126721.6
Inland Or CoastalInland54043.7
Coastal69656.3
Rural Or UrbanRural14812.0
Urban108888.0
Ecology KnowledgeNo knowledge16012.9
Moderate82967.1
Professional24720
ReligionNo religion80765.3
1584.7
2534.3
3645.2
4564.5
5423.4
6231.9
Very loyal13310.8
OccupationLeaders for government, company, and other organizations24119.5
Professionals (Professor, researcher, teacher, doctor, lawyer, etc.)31825.7
Office staff13911.2
Businesspeople544.4
People who work in the service industry312.5
Industrial worker171.4
People in agriculture, forestry, animal husbandry, and fishery50.4
Full time housewife282.3
Middle school student40.3
College student (Social science and education)927.4
College student (Humanities, arts, and law)1189.5
College student (Natural science and medicine)564.5
Entrepreneur504
Freelancer373
Jobless20.2
Other443.6
Note: Monthly income representing the individual monthly income of each respondent.
Table 3. Factor analysis of social preference toward urban green space ecosystem service.
Ecosystem Service GroupingFactor LoadingsEigen ValuePercentage of Variance (%)Reliability CoefficientMean Score
Factor 1: Regulating service 6.03 54.820.91 4.28
Carbon sequestration0.82
Temperature mitigation0.59
Dust reduction (Air filtering)0.85
Noise mitigation0.80
Storm water attenuation0.90
Factor 2: Provisioning service and Habitat 1.7315.740.88 3.60
Food provisioning0.83
Energy provisioning0.93
Timber provisioning0.91
Biodiversity conservation0.55
Factor 3: Cultural service 0.776.950.844.10
Outdoor Leisure and recreation0.79
Aesthetics appreciation0.77
Total variance explained0.77
Total scale reliability0.94
Table 4. The major factors that influences respondents’ social preference toward urban green space ecosystem service.
FactorSub-FactorNRegulating ESCultural ESProvisioning ES and Habitat
MeanS.D.MeanS.D.MeanS.D.
GenderMale6194.2880.6064.1280.7083.5991.051
Female6174.2810.5984.0610.7313.6050.844
p value_0.840 0.099 0.924
EducationHigh school and below1114.0937 a0.7054 b0.8503.5563 ab0.864
Bachelor7274.2209 a0.5733.9677 b0.6823.5048 b0.873
Master3984.4538 b0.5844.3518 a0.6803.7927 a1.080
p value_0.000 0.000 0.000
Age≤254544.3485 a0.6234.1170.7723.8673 a0.940
26–301224.2525 ab0.6654.0410.8273.4857 b0.997
31–403074.2795 ab0.6154.1530.6753.557 bc0.897
41–502364.2619 ab0.5174.0340.6473.3835 bc0.895
≥511174.1282 b0.5404.0300.6383.2543 c0.957
p value_0.008 0.218 0.000
Monthly Income≤20003784.3757 a0.6014.1440.7773.9001 a0.942
2001–3000754.1173 ab0.6493.9470.7473.5933 ab0.886
3001–50002324.2914 ab0.5734.1250.6993.5388 b0.948
5001–80002844.2254 b0.6014.0460.6723.4798 b0.906
≥80012674.2592 b0.5974.0900.6923.368 b0.939
p value_0.001 0.153 0.000
UrbanRural1484.0740.6693.8240.7653.5590.793
Urban10884.3130.5864.1310.7063.6080.972
p value_0.002 0.001 0.484
CoastalInland5404.2260.6034.0300.7013.5070.871
Coastal6964.3300.5964.1440.7313.6761.006
p value_0.002 0.007 0.004
Environmental and Ecological KnowledgeNo knowledge1604.0863 a0.6673.9063 a0.7613.4266 a0.901
Moderate8294.2516 b0.5454.0338 a0.6783.506 a0.887
Professional2474.5231 c0.6644.419 b0.7344.0385 b1.067
p value_0.000 0.000 0.000
ReligiosityNon-believer8074.2322 b0.5894.0118 b0.7023.5068 b0.882
1584.1621 b0.5563.9914 b0.6913.4353 b0.829
2534.0566 b0.5653.8491 b0.6253.3255 b0.781
3644.1344 b0.6053.9063 b0.5903.3256 b0.878
4564.1857 b0.5454.0446 b0.7153.3257 b1.022
5424.3143 b0.5594.1786 b0.7563.3258 b0.859
6234.1913 b0.6674.1957 b0.5983.3259 b1.036
Very devout1334.8662 a0.3674.8045 a0.5113.3260 b0.755
p value_0.000 0.000 0.000
Note: Figures in bold mark p value < 0.05, indicating significant differences exist between scores of respondents from corresponding groups. Letters in superscript indicate the post hoc comparison of one-way analysis of variance (ANOVA).
Table 5. The impact of occupation on respondents’ social preferences towards ecosystem service of urban green spaces.
OccupationNRegulating ServiceCultural ServiceProvisioning Service and Habitat
MeanS.D.MeanS.D.MeanS.D.
Leaders for government, company, and other organizations2414.519 a0.6454.429 a0.7084.049 a1.080
Professionals (Professor, researcher, teacher, doctor, etc.)3184.283 b0.5564.111 b0.6363.413 b0.925
Office staff1394.238 b0.5984.111 b0.7203.651 b0.905
Businesspeople544.151 b0.7764.111 b0.8223.5 b0.988
People who work in the service sector314.419 ab0.5964.177 ab0.7593.395 b1.127
Industrial worker174.176 b0.6634.029 bc0.8563.485 b0.998
Full time housewife284.235 b0.5583.946 bc0.8093.580 b0.811
College student (social science and education)924.108 b0.5873.75 c0.6933.453 b0.796
College student (humanities and law)1184.155 b0.5023.796 c0.6743.527 b0.750
College student (natural science and medicine)564.325 ab0.4864.053 bc0.6303.522 b0.868
Entrepreneur504.1 b0.6293.91 bc0.7613.525 b0.804
Freelancer374.264 b0.4743.986 bc0.6513.405 b0.929
Other444.190 b0.5713.931 bc0.6343.505 b0.831
p value_0.000 0.000 0.000
Note: Figures in bold mark p value < 0.05, indicating significant differences exist between scores of respondents from corresponding groups. Letters in superscript indicate the post hoc comparison of one-way analysis of variance (ANOVA).
Disclaimer/Publisher’s Note: The statements, opinions and data contained in all publications are solely those of the individual author(s) and contributor(s) and not of MDPI and/or the editor(s). MDPI and/or the editor(s) disclaim responsibility for any injury to people or property resulting from any ideas, methods, instructions or products referred to in the content.

