1. Introduction
Disasters are among the most endangering cases that threaten human life, and emergency management is needed because of their sudden occurrence [
1]. Disasters are divided into two classes: natural and artificial. Natural disasters occur due to geological reasons, such as earthquakes, volcanoes, tsunamis, and landslides, and meteorological reasons, such as lightning, floods, storms, tornadoes, hail, and drought. On the other hand, artificial disasters caused by human actions are fires, industrial accidents, nuclear accidents, terrorist incidents, biological attacks, etc. [
2], which pose more dangerous and greater risks.
Disasters have a devastating impact on human lives, causing irreversible damage and affecting millions of people around the world. Recent data show that more than 2.6 billion people have been affected by natural disasters, highlighting the sheer scale of their impact [
3]. In recent years, there has been an increase in the number of individuals affected by disasters, indicating a concerning trend in disaster frequency and impact [
4]. The gradual increase in the frequency and devastating effects of hazards and disasters has been noted, yet no country is fully prepared to handle these challenges effectively [
5]. In 2024, the Centre for Research on the Epidemiology of Disasters (CRED) reported a significant increase in the frequency and impact of natural hazards worldwide. A total of 432 natural disasters were recorded, affecting approximately 210 million people, resulting in 35,000 fatalities, and causing an estimated economic loss of 250 billion USD [
6,
7]. Heat waves severely impacted Europe, with an estimated 16,305 deaths attributed to extreme temperatures. Droughts affected Ethiopia, Sudan, the Democratic Republic of the Congo, Nigeria, Niger, and Burkina Faso, while drought-induced famine caused 2465 deaths in Uganda. Floods in 2022 heavily impacted Pakistan, India, Bangladesh, Nigeria, South Africa, Brazil, and eastern Australia, with 2035 deaths recorded in India and 1739 in Pakistan [
8]. According to the United States Geological Survey (USGS) Statistics, an annual average of 112.5 earthquakes of magnitude 6.0 and above occurred worldwide between 2014 and 2024 [
9]. Most earthquake losses originate from the weakness of urban development, poor planning, and structural failure against earthquakes [
10].
Türkiye is located in a critical earthquake zone. Throughout history, many disasters have occurred in this geography. The major devastating earthquakes over magnitude 7.0 in Türkiye in the last century are the Erzincan 1939, Tokat 1942, Ladik 1943, Gerede 1944, Kütahya 1970, Van 1976 and 2011, Gölcük 1999, and Düzce 1999 earthquakes [
11]. On 6 February 2023, two large earthquakes occurred in the south–central region of Türkiye within 9 h. The first main shock happened at 4:18 am local time with a 7.7 magnitude in Pazarcık (Kahramanmaraş), and the second main shock occurred at 1:24 pm local time with a 7.6 magnitude in Elbistan (Kahramanmaraş) 80 km north from the Pazarcık. A total of 11 cities were affected by this destructive disaster. The February 6 earthquakes were such massive disasters that more than 48.000 people lost their lives, and half a million buildings collapsed or were heavily damaged [
12].
The importance of emergency management is remarkable, considering the destructive effects of disasters in urban and rural areas. Only effective emergency management can reduce disasters and their hazardous effects. Emergency management encompasses four primary phases: mitigation, preparedness, response, and recovery, which are essential for effectively addressing the increasing frequency and impact of natural disasters observed in recent years [
6].
Prevention and Mitigation: Deciding what to do in case of a risk which threatens society’s safety and health and applying a risk reduction program [
2].
Preparedness: Improving operational capabilities and developing a response plan, such as warning systems, emergency operation plans, emergency public information, resource management plans, training and exercises, to save lives and reduce disaster damage [
2,
13].
Response: Activities taken immediately before, during or directly after an emergency case to reduce the probability of secondary damage and minimize problems for recovery operations [
2,
13].
Recovery: Short-term activities that restore vital life support systems to minimum operating standards; temporary housing, debris clearance, facility restoration, etc. [
2,
14].
Under the prevention and mitigation heading, risk analysis, risk reduction improvements, early warning systems and identifying suitable assembly places may reduce the impact of a disaster on affected people. Preparedness and response phases provide plans for before and during disasters. After a disaster, building residents gather in the proper and appropriate places, making it easier to provide services to disaster victims.
Public administration is critical in disaster and emergency management [
15]. The authorized institution is the Disaster and Emergency Management Authority (DEMA) in Türkiye, which prepared the Türkiye Disaster Response Plan (TDRP) in 2013. TDRP aims to define the responsibilities and roles of service groups and units participating in disaster and emergency response activities [
16].
In an emergency or disaster, buildings should be evacuated immediately, and the residents gather safely away from buildings. Assembly places keep the residents clear of the hazard zone and in a location where all residents can be informed simultaneously, thus avoiding rumors and miscommunication.
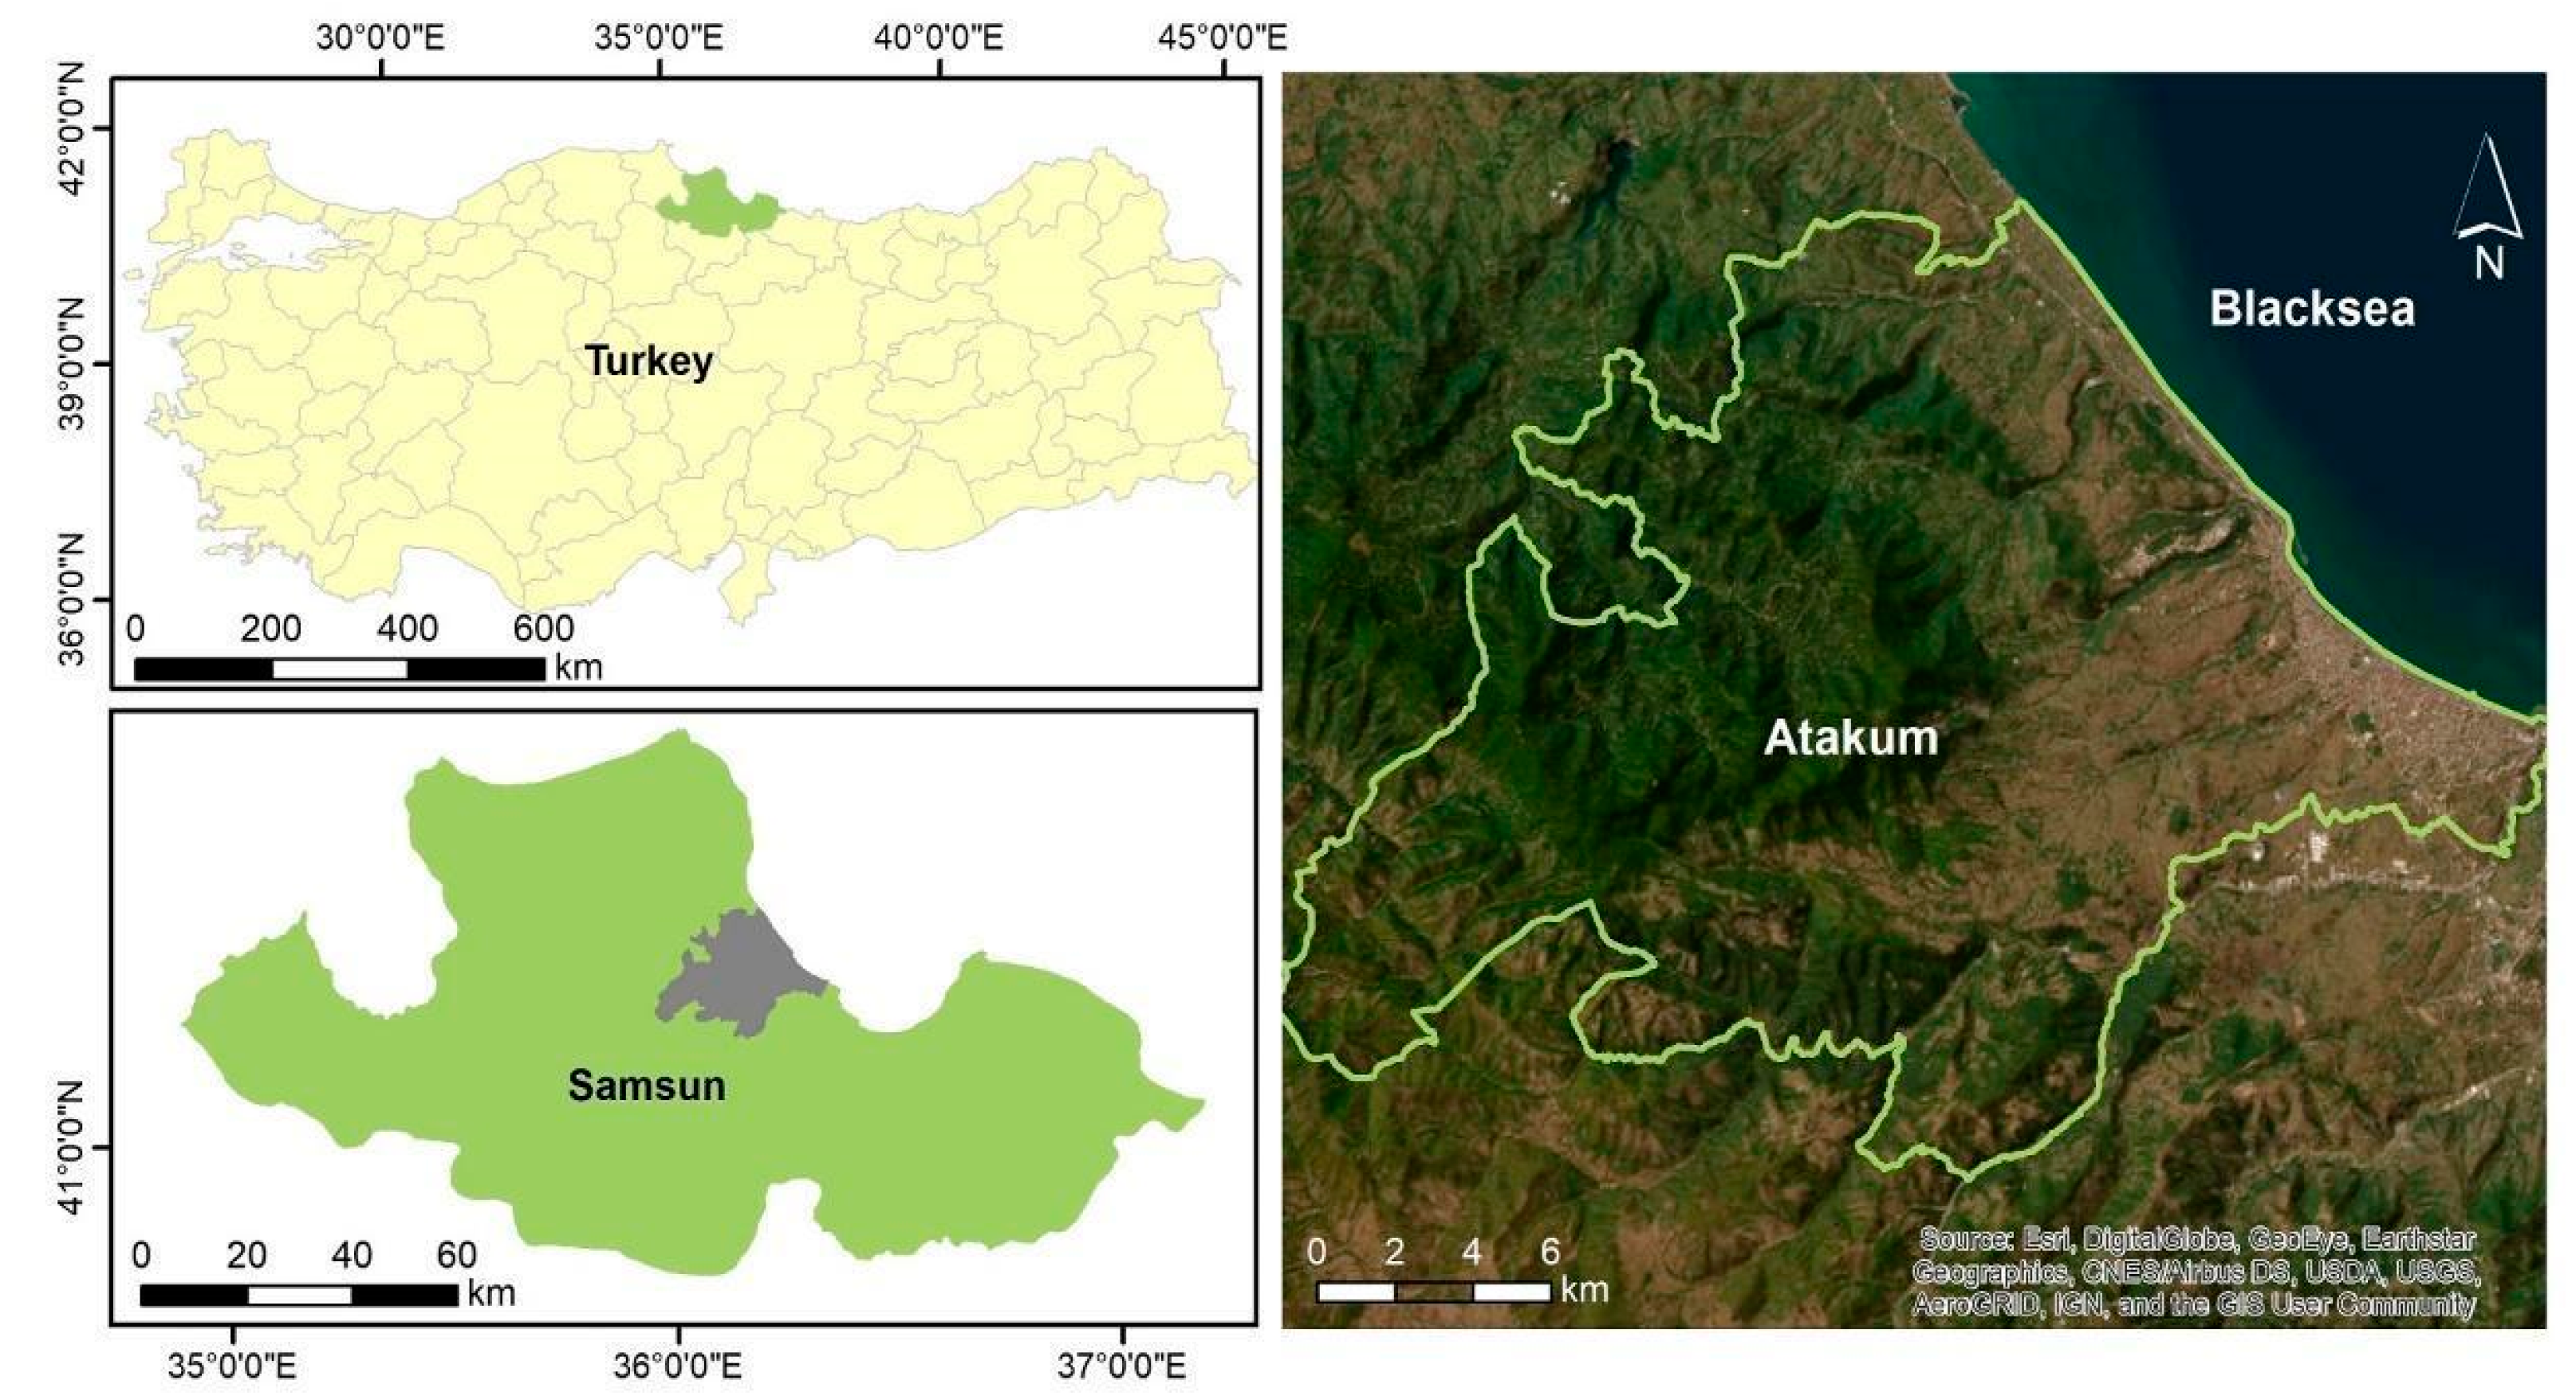
This study focused on determining suitable locations for emergency assembly places. A combined methodology, incorporating GIS and MCDM, was utilized in this study. First, the criteria affecting the assembly places specified and then the weights of these criteria were calculated using the AHP and BWM. Weighted overlapped map and restricted area maps evaluated together in GIS to determine suitable locations for emergency assembly places. The potential suitable assembly places were ranked using the TOPSIS method.
This paper consists of six sections. After the Introduction,
Section 2 provides a brief overview of the relevant literature.
Section 3 describes the workflow of the study, the study area, and the methods used, including GIS, the AHP, BWM, and TOPSIS.
Section 4 presents the application of the proposed methods, along with the results and the ranking of the suitable assembly places using TOPSIS.
Section 5 offers a discussion of the findings, explaining and interpreting them. Finally,
Section 6 presents the main conclusions of the study.
2. Literature Review
Currently, there are more than 200 MCDM methods, and the ranking of alternative preferences can vary significantly depending on the method used [
17]. Therefore, when selecting an appropriate method for a study, a thorough review of the literature should be conducted, and competent experts should be consulted.
A review of MCDM and GIS studies used in the field of disaster and emergency management reveals a large number of studies. MCDM techniques play a crucial role in disaster management by providing structured frameworks for evaluating complex scenarios involving multiple conflicting criteria. One of the widely utilized methods is the AHP, which helps decision-makers prioritize criteria and alternatives by breaking down a problem into a hierarchy of sub-problems. The AHP has been effectively applied in various contexts, such as selecting optimal locations for emergency services and assessing risks associated with disaster management [
18,
19,
20,
21]. Another prominent technique is TOPSIS, which ranks alternatives based on their distance from an ideal solution. This method is particularly useful for evaluating recovery strategies and resource allocation in disaster scenarios [
22,
23]. Fuzzy MCDM techniques, which incorporate fuzzy logic to handle uncertainty and vagueness, are also significant in disaster management, especially when data may be incomplete or imprecise [
24,
25]. GIS combined with MCDM techniques facilitate spatial decision-making, allowing for the visualization of data and assessment of geographical factors affecting disaster response and recovery [
26,
27]. Hybrid MCDM approaches, which combine multiple MCDM methods, enhance decision-making effectiveness by leveraging the strengths of different techniques [
21,
28]. Stochastic MCDM methods account for uncertainty in decision-making processes, which is crucial in dynamic disaster scenarios, optimizing resource allocation and response strategies under uncertain conditions [
29,
30]. The involvement of multiple experts in the decision-making process enhances the robustness and reliability of MCDM outcomes, making multi-expert MCDM a valuable approach in disaster management [
31,
32]. The Entropy weighting method is used to determine the weight of criteria based on the amount of information each criterion provides, particularly useful in contexts where the relative importance of criteria may vary significantly [
33,
34]. The VIKOR method focuses on finding a compromise solution among conflicting criteria, making it applicable for prioritizing recovery projects and resource allocation in disaster management [
19,
22]. Additionally, the Ranking Comparison (RANCOM) method is a novel subjective weighting approach designed to determine criteria relevance based on expert knowledge while addressing inaccuracies in expert judgments. Unlike traditional methods such as the AHP, RANCOM provides a structured yet intuitive approach, making it accessible for both experienced and less experienced users. The method relies on defining a criteria ranking order and generating a weight vector accordingly. Comparative analyses indicate that RANCOM produces highly reliable and repeatable results, particularly in decision-making scenarios involving five or more criteria [
35,
36]. Other notable techniques include the Step-wise Weight Assessment Ratio Analysis (SWARA), which determines the weights of criteria based on expert judgment, and the Complex Proportional Assessment (COPRAS), which evaluates alternatives based on their performance across multiple criteria [
34,
37]. The Fuzzy Analytic Hierarchy Process (FAHP) incorporates fuzzy logic into the AHP framework, enhancing its applicability in uncertain decision-making environments [
19].
In conclusion, the diverse range of MCDM techniques, including the AHP, TOPSIS, fuzzy MCDM, GIS-based approaches, BWM, and RANCOM, provide valuable frameworks for evaluating complex decision-making scenarios in disaster management. These techniques enhance the robustness of decision-making processes, allowing for more informed and effective responses to disasters.
Recent studies within disaster management have increasingly addressed the importance of assembly areas. These studies can be summarized as follows.
Hurricanes are among the frequently observed disasters in the USA. Kar and Hodgson [
38] focused on identifying existing and candidate temporary shelter areas in the case of a disaster in Florida. They used a GIS-based model to solve the problem and observed that 48% of the shelter areas were unsuitable. Using cluster analysis, Cicekdagi and Kiris [
39] grouped the units according to their coordinates. According to the number of people, they determined each group’s appropriate disaster station locations by the center of gravity method. Omidvar et al. [
40] used GIS-based MCDM techniques for the site selection of temporary shelter areas before an earthquake. They used TOPSIS, ELECTRE, SAW, and the AHP as MCDM techniques for the final selection. Abounacer et al. [
41] focused on the challenges of disaster response. The study addresses issues related to location and transportation in a disaster response. The location issue was defined as determining the position of the number of humanitarian aid distribution centers within the affected area. Ibrahim et al. [
42] made a crowd and evacuation management review and focused on crowd management technological improvements during the disaster evacuation time. Zhao et al. [
43] used the location allocation model within GIS to define an emergency shelter to reduce the total setup cost of locating the shelters and minimize their total evacuation distance. Mengi and Erdin [
44] analyzed emergency assembly places using the current routing standards and design criteria. Fedele and Merenda [
45] focused on the advantages of smart cities in emergency management, such as recognizing alarms, available exits, assembly points, etc. and defined improvements in Internet of Things (IoT) systems. Sakarya and Bektas [
46] examined the adequacy and accessibility of the emergency assembly areas in the Kadıköy District of Istanbul city and network analysis to determine accessibility. Gokgoz et al. [
47] used three primary and ten sub-criteria defining emergency assembly places and calculated field properties as the most critical criterion according to the AHP. Hoscan and Cetinyokus [
48] proposed an approach to choosing emergency assembly points in industrial areas. They used the AHP to solve the problem. Atmaca et al. [
19] used the AHP, TOPSIS, COPRAS, and BORDA techniques to evaluate the suitability of emergency assembly places for the Ankara, Gölbaşı District. Bektas and Dogan [
49] examine the compliance of post-disaster emergency assembly areas with planning criteria in the Battalgazi District of Malatya, Turkey, which was severely affected by the 6 February 2023 earthquakes. The research evaluates these areas through both qualitative and quantitative lenses.
The BWM allows decision-makers to identify the most and least important criteria from a set, thereby simplifying the comparison process and improving consistency of judgments compared to traditional methods such as the AHP [
50,
51]. The design of the BWM minimizes the number of pairwise comparisons required, which not only reduces cognitive load but also mitigates the potential for inconsistency in judgments [
52,
53]. Furthermore, the BWM has been successfully applied in a variety of domains, including healthcare, industrial management, market research, and environmental management, demonstrating its versatility and effectiveness in addressing complex decision scenarios [
54,
55,
56].
Compared to other MCDM techniques, the BWM offers significant advantages. For example, it reduces the cognitive load on decision-makers by minimizing the number of comparisons required, which can lead to more reliable results [
57]. The comparison of the BWM with the most used MCDM method, the AHP, is shown in
Table 1.
Overall, the efficiency and effectiveness of the BWM in producing consistent results makes it a user friendly, valuable method in MCDM, particularly in situations where rapid and informed decision-making is required.
In the field of disaster management, various MCDM techniques have been used to facilitate effective decision-making [
19,
23]. Among these, the BWM stands out for its unique approach of requiring fewer pairwise comparisons compared to traditional methods such as the AHP. The BWM focuses on identifying the best and worst criteria, which simplifies the decision-making process while improving the consistency of results [
59]. This reliable method has been preferred in this study since it has not been used much in disaster studies yet.
TOPSIS is a widely used MCDM method due to its straightforward computational procedure and logical framework [
60]. TOPSIS ranks alternatives by assessing their proximity to an ideal solution, which facilitates intuitive evaluation for decision-makers. A key advantage of TOPSIS over other MCDM techniques is its ability to maintain consistent rankings even when alternatives are added or removed, thus overcoming the rank reversal problem. The speed of the calculation process, the ease of interpretation of the results and the realism of the results make TOPSIS a powerful tool in the decision-making process [
61]. Consequently, the combination of simplicity, logical clarity and robustness makes TOPSIS a highly effective tool for ranking alternatives in disaster management and other domains requiring multi-criteria evaluations.
This study sets itself apart by conducting a comparative analysis of the MCDM techniques, the AHP and BWM, to derive reliable and consistent criterion weights, which are then effectively integrated into GIS-based spatial analyses. By applying the TOPSIS method, it ensures a systematic and data-driven ranking of critical locations, such as emergency assembly places, enhancing the precision and objectivity of the site selection process. This comprehensive approach not only strengthens spatial decision-making but also provides a valuable framework for disaster preparedness and urban planning.
3. Materials and Methods
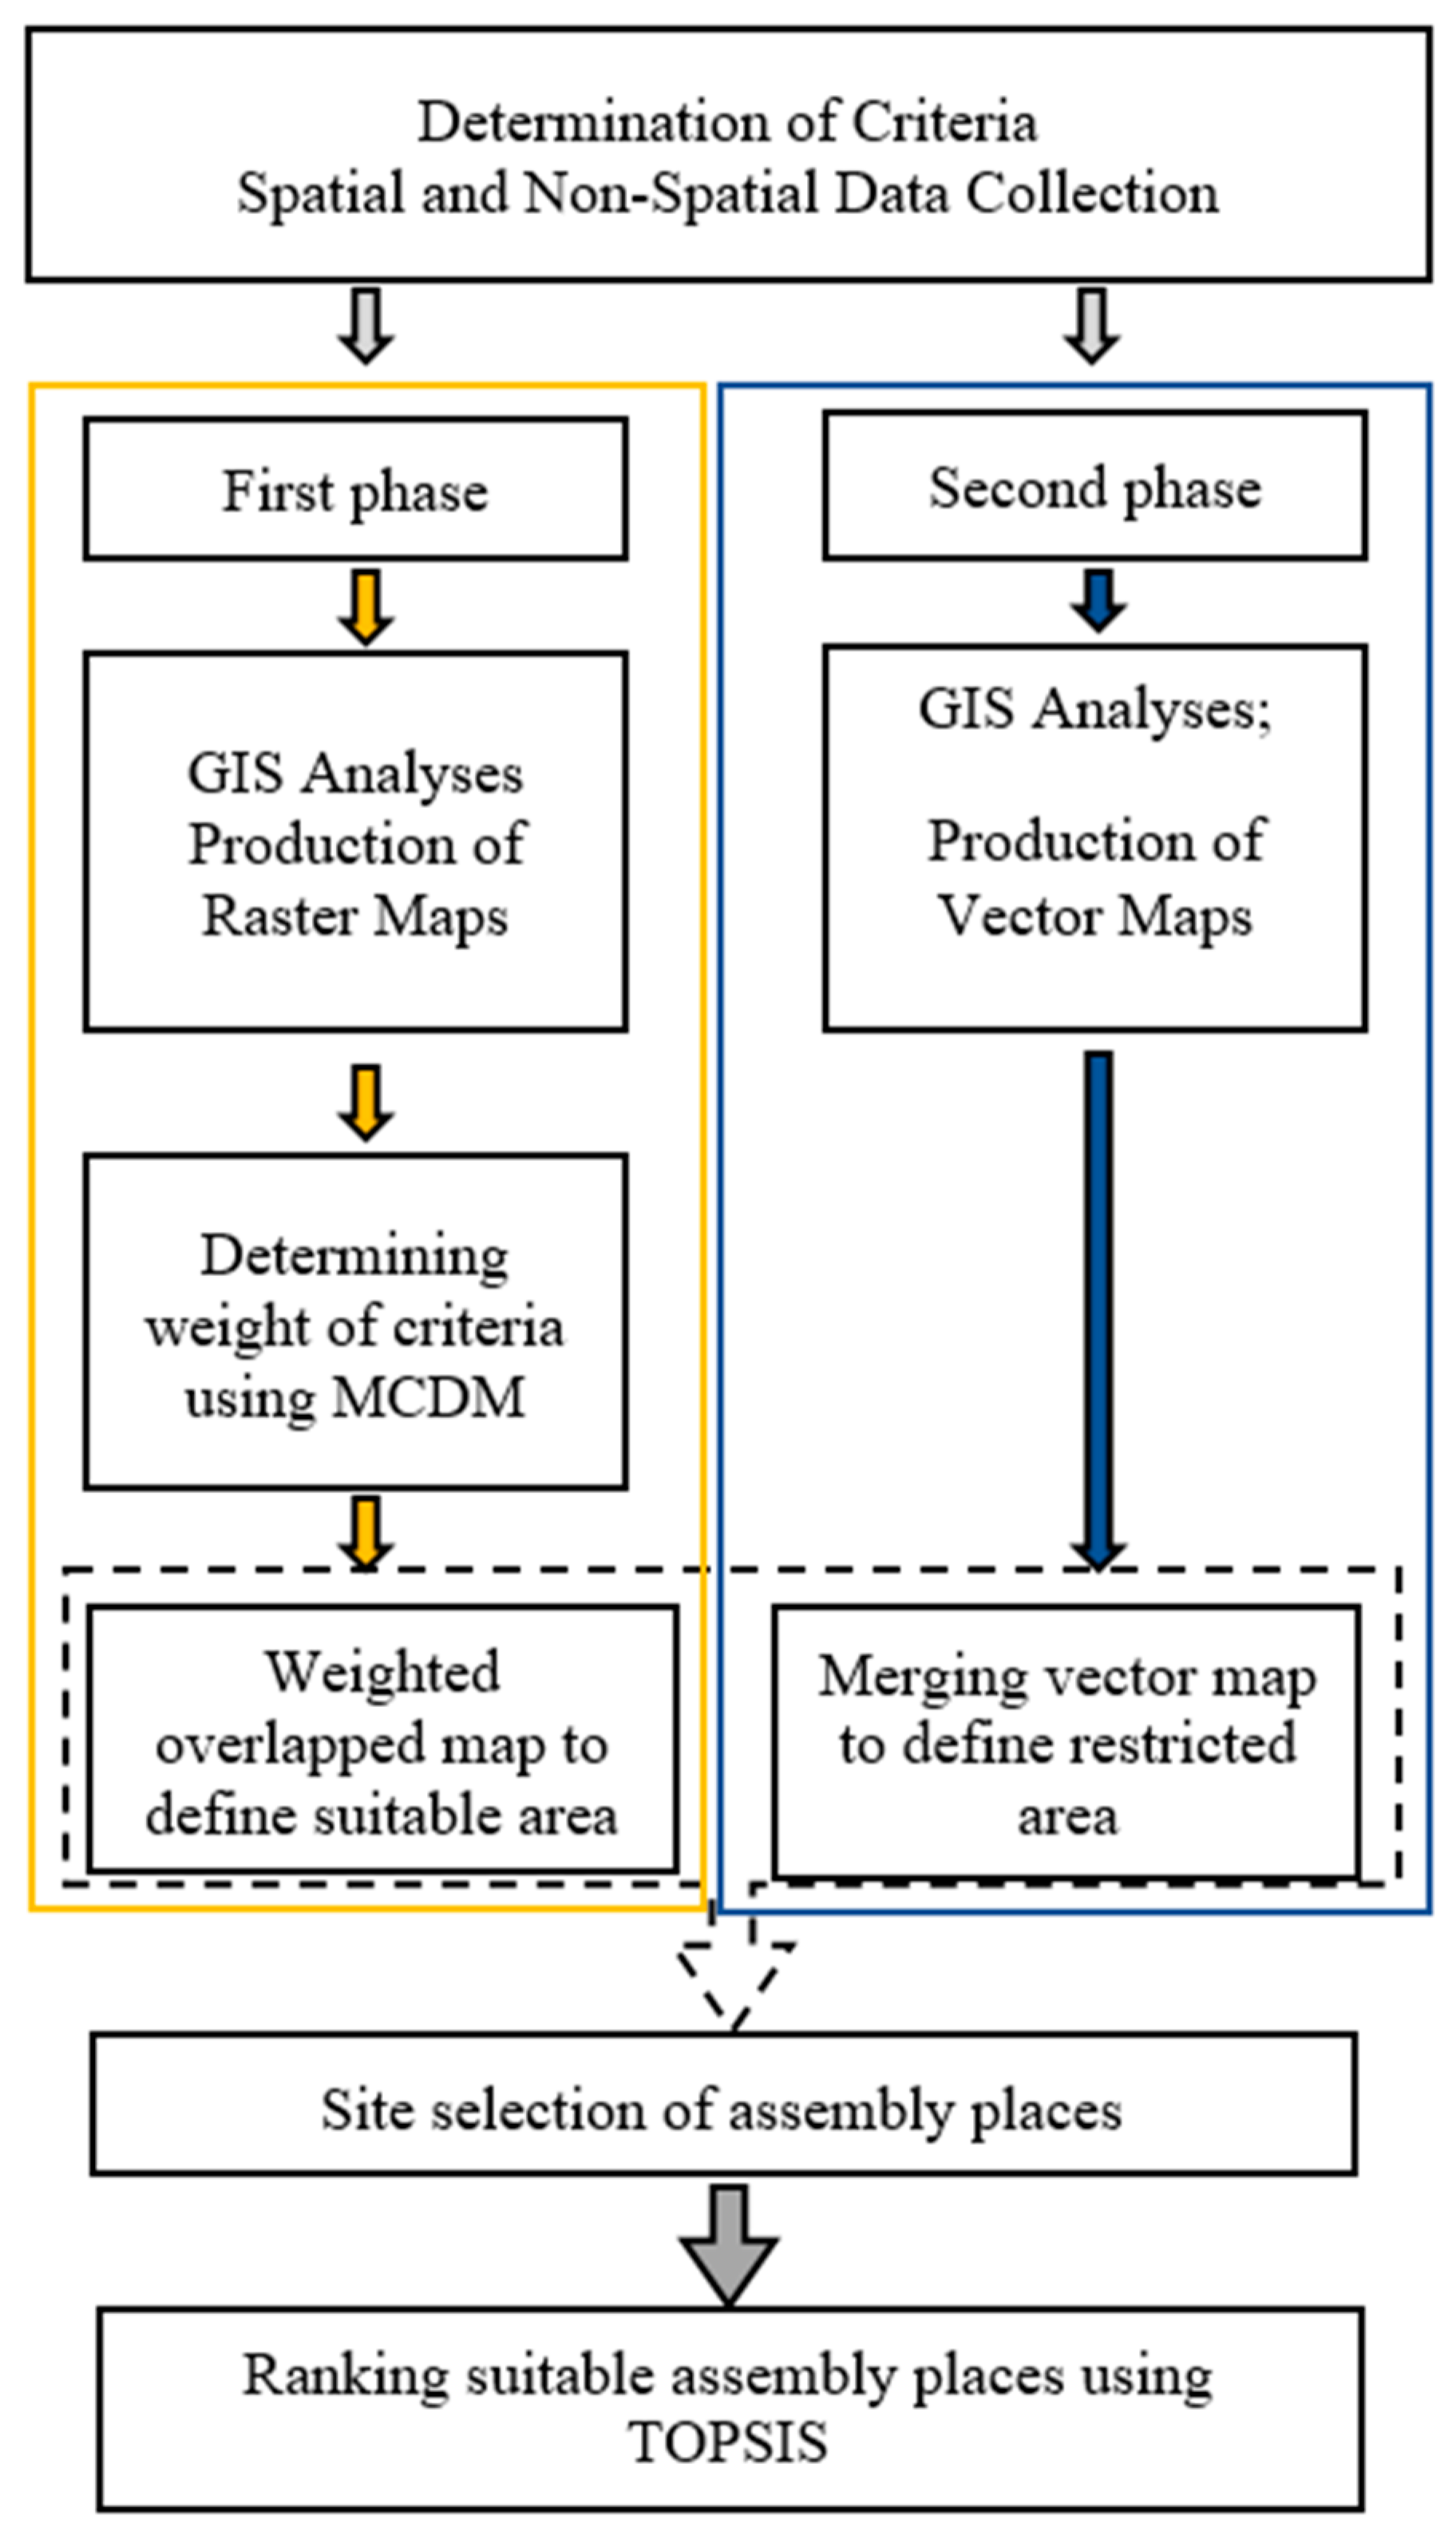
This study proposed a two-phase method to identify suitable emergency assembly places (
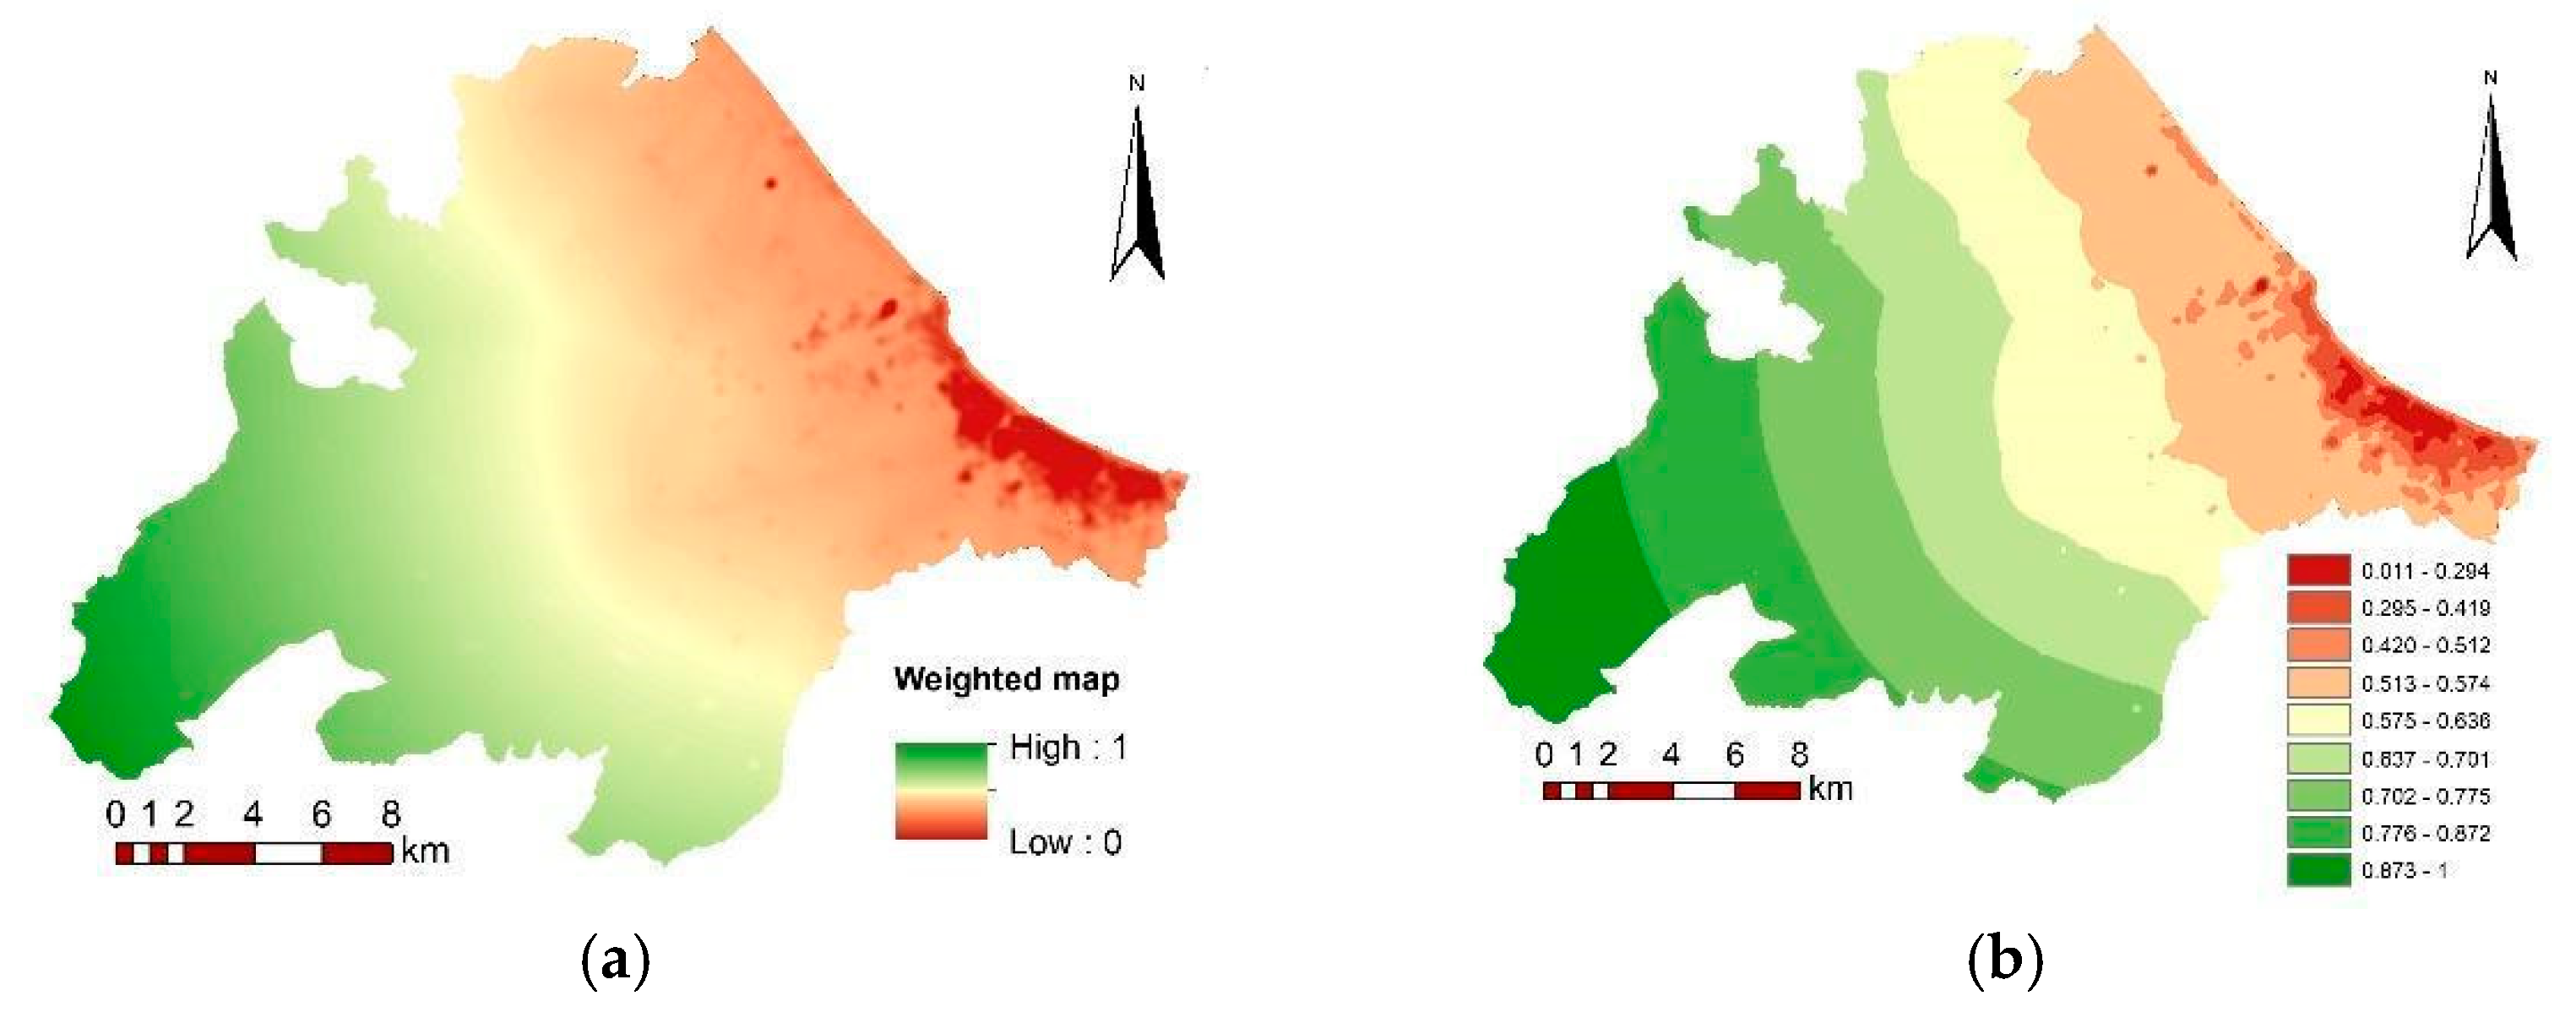
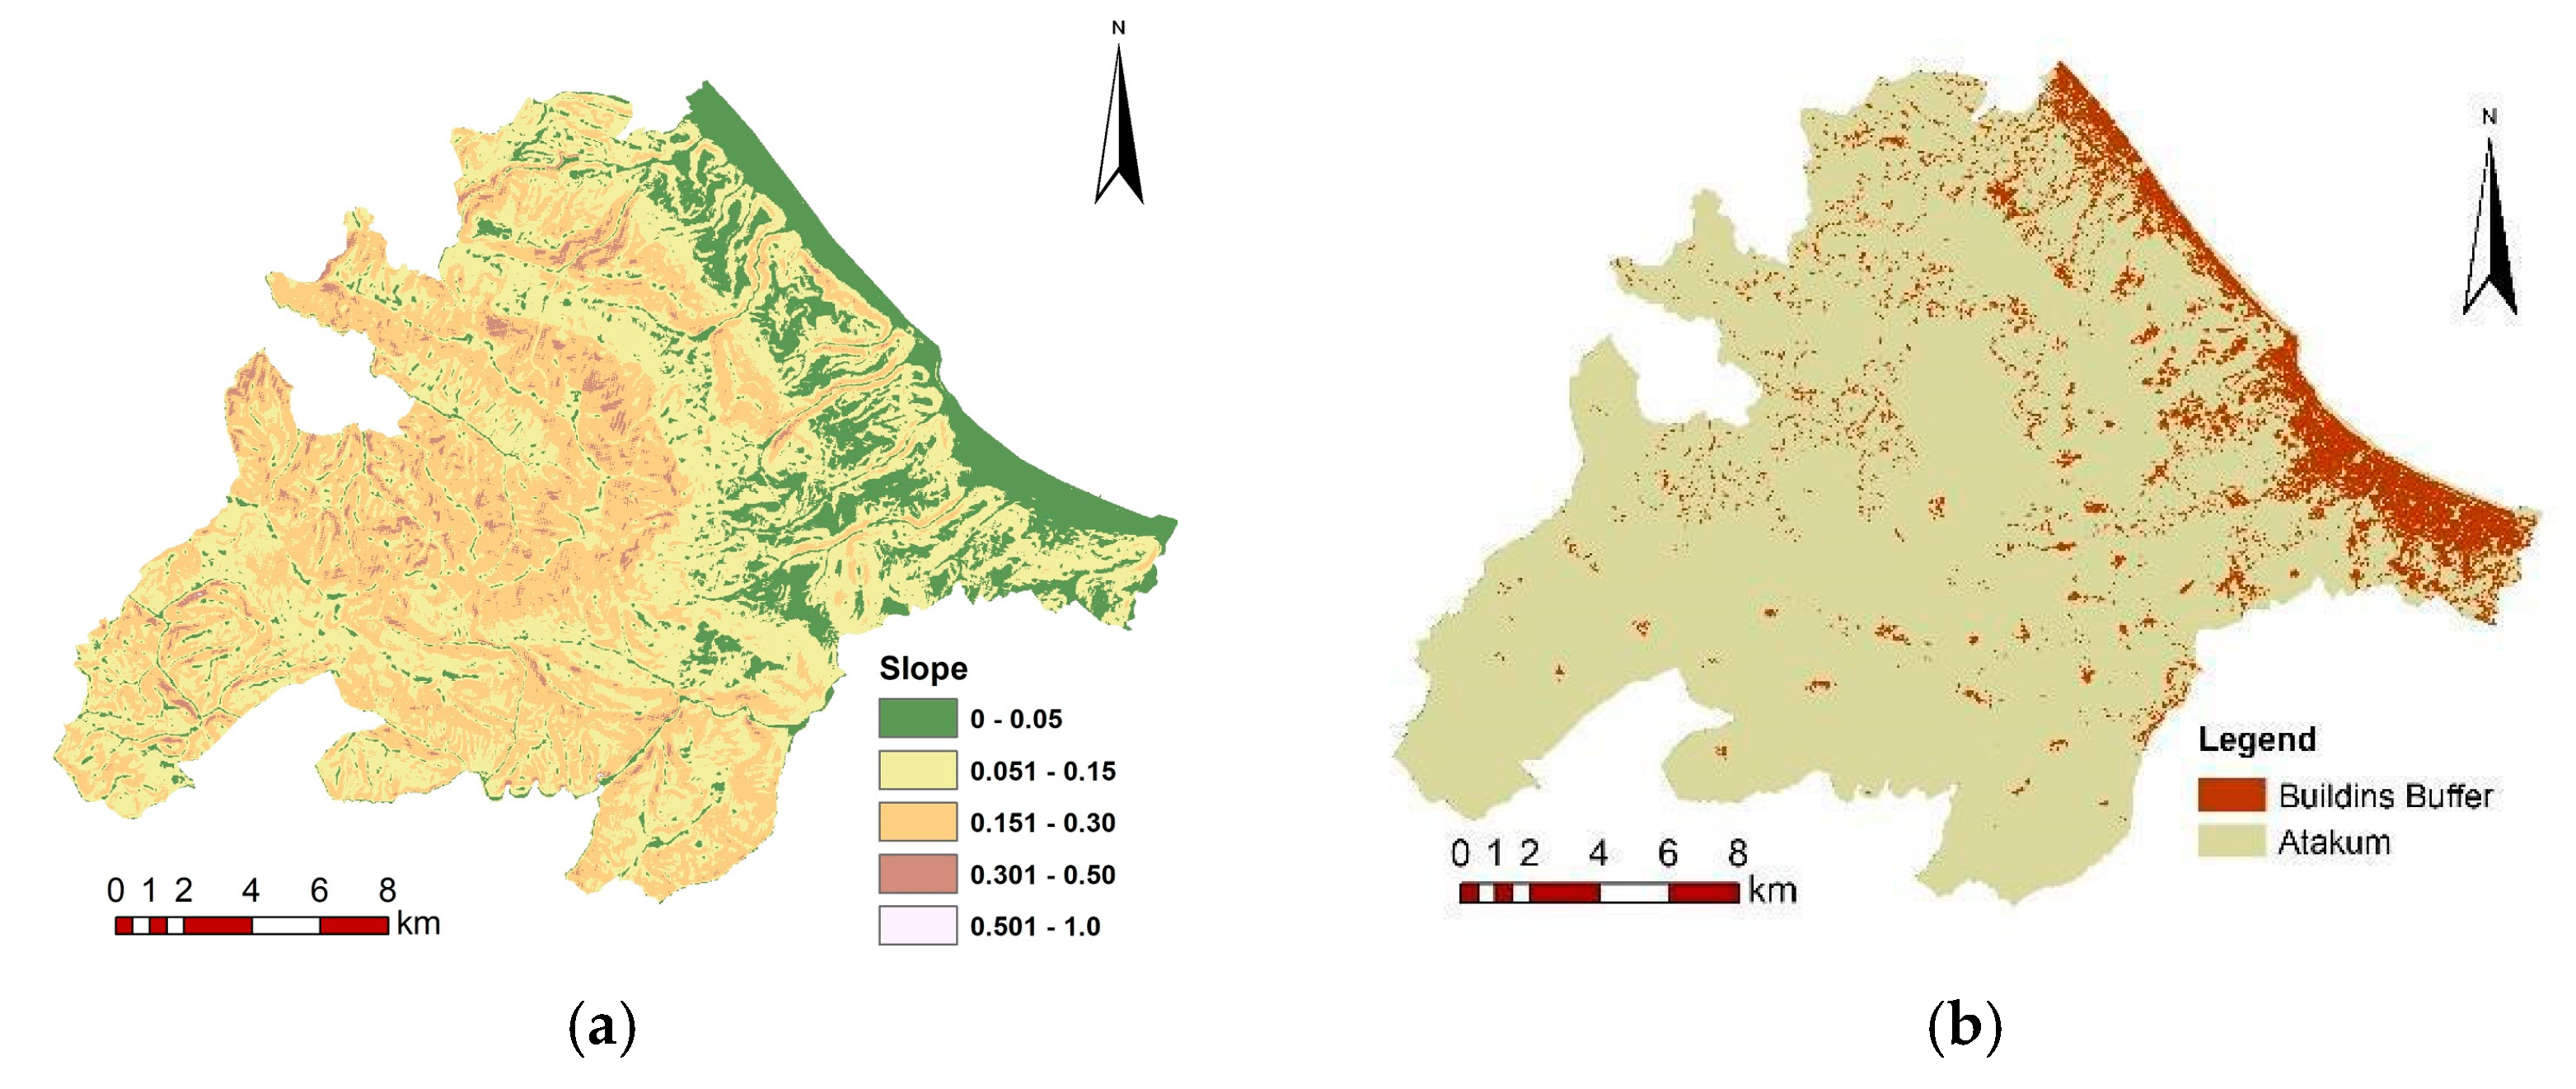
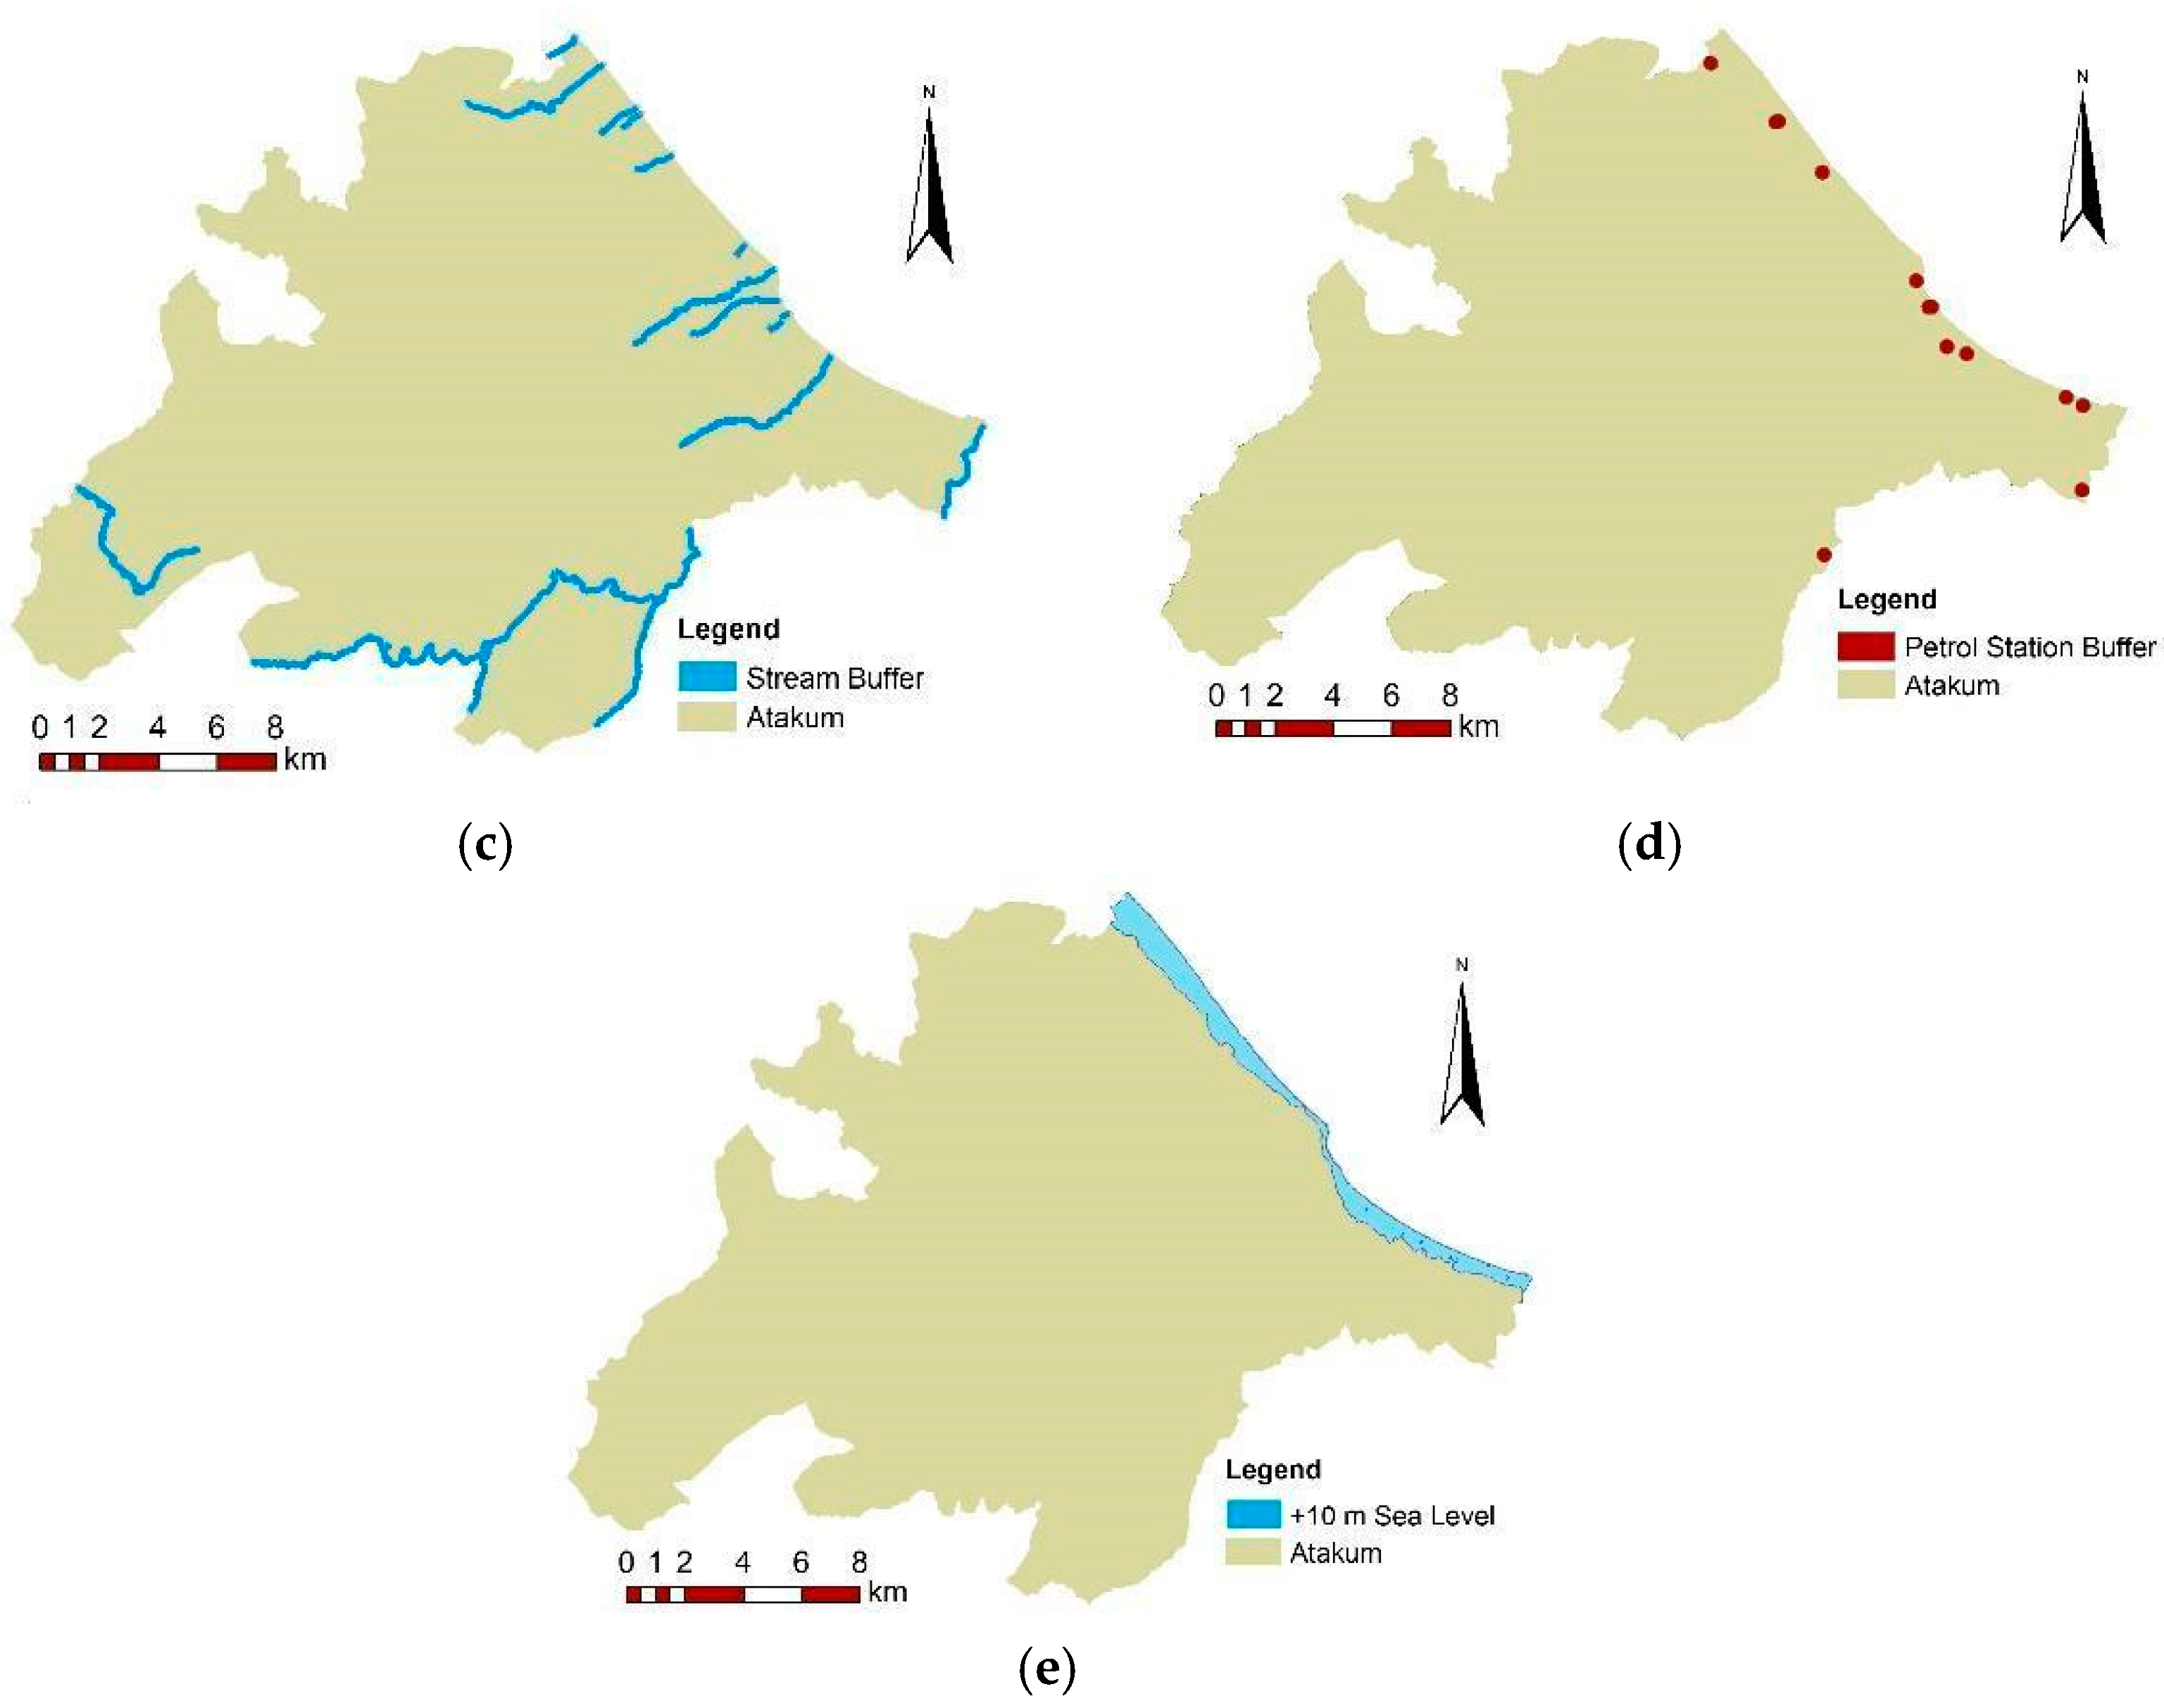
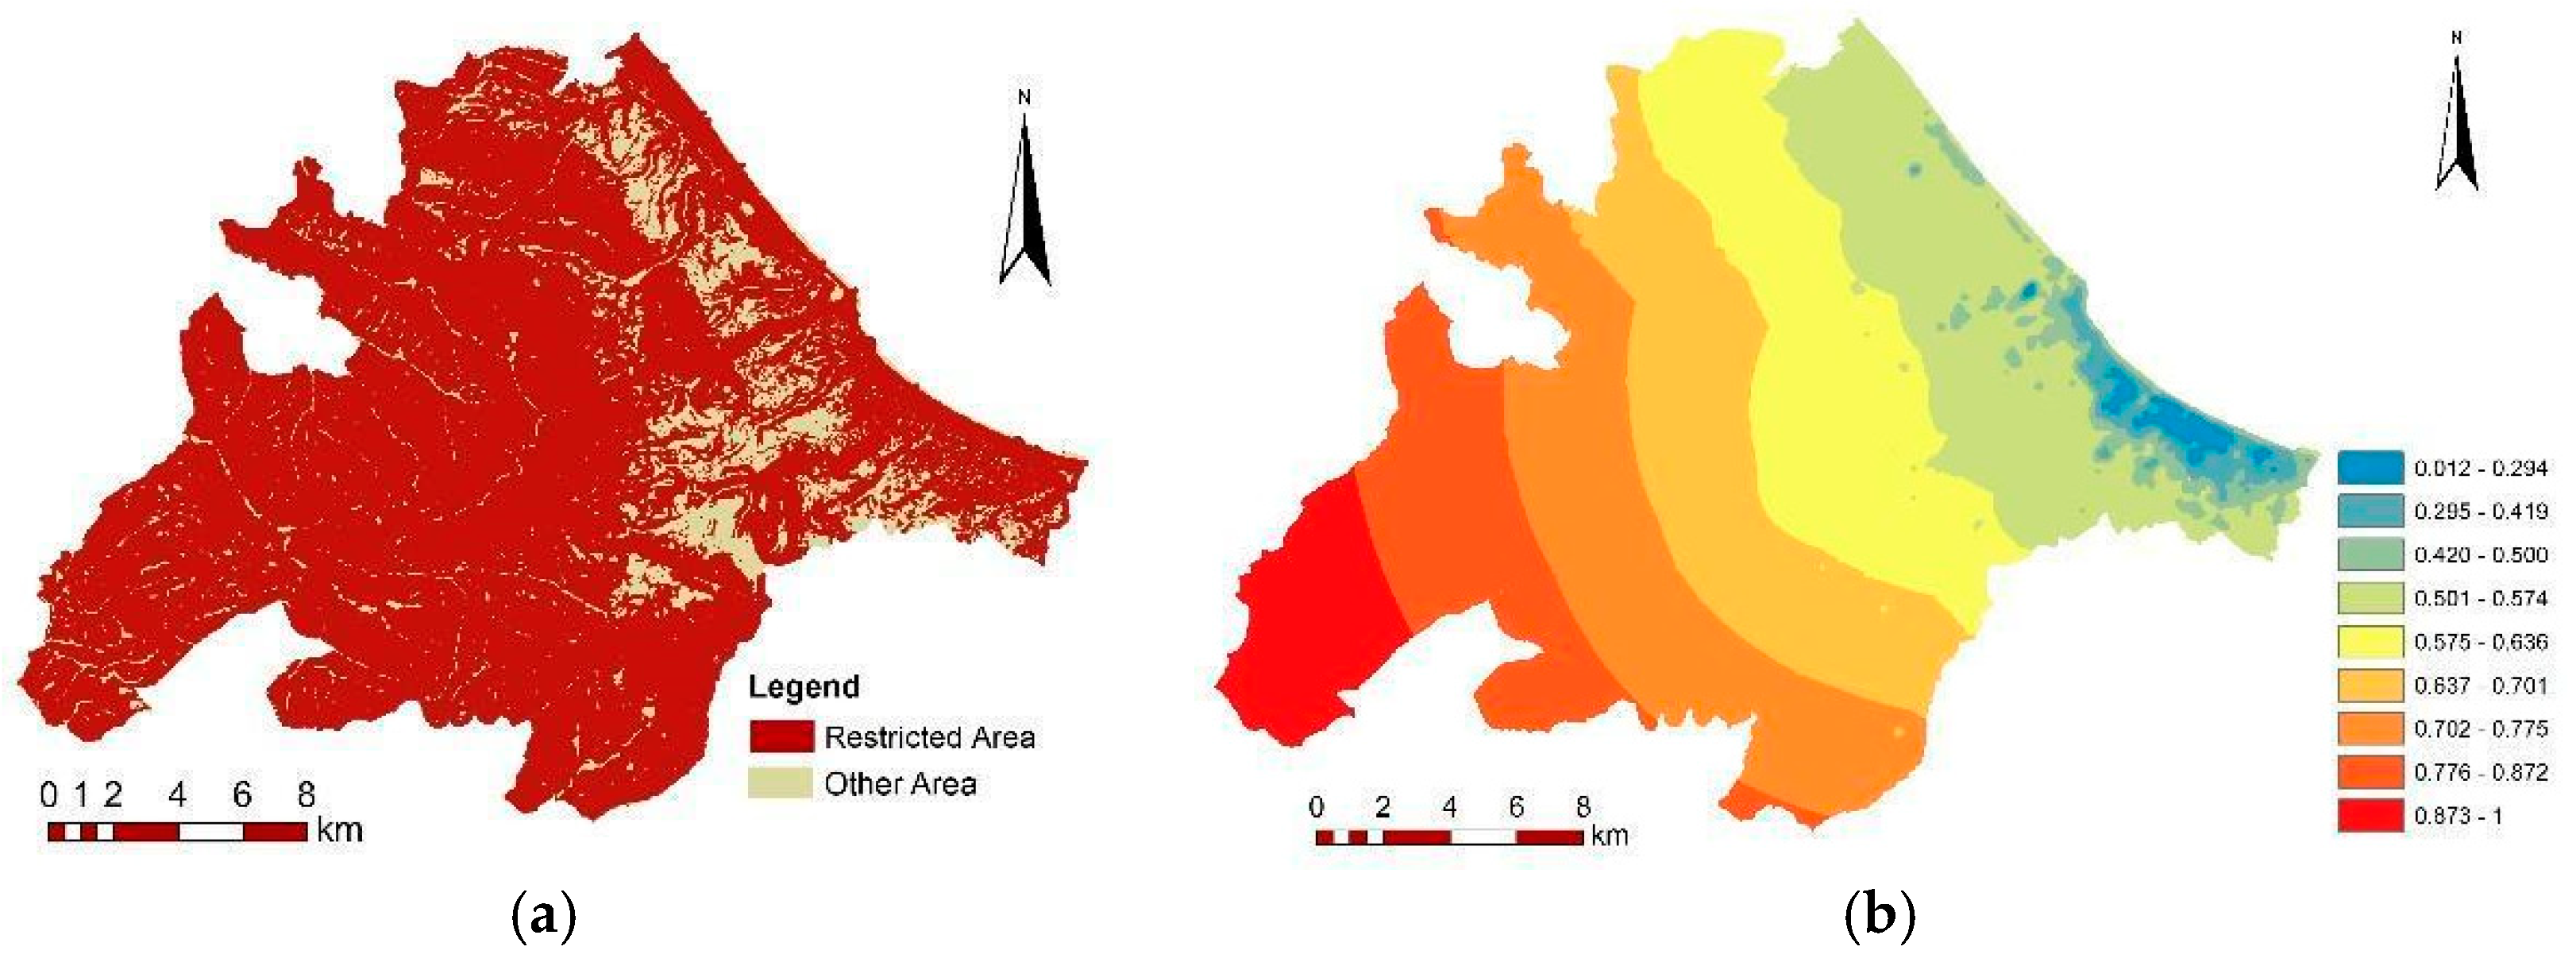
Figure 1). This study requires the integration of criteria derived from various data sources with different data types that influence the selection of disaster assembly places. In this context, the powerful spatial analysis capabilities of GIS were utilized. In this study, a total of ten criteria were determined based on literature review and expert opinions and national regulations. In the first phase, five raster datasets were created based on population density, distance to roads, distance to hospitals, distance to schools, and distance to parks/green areas. Two different MCDM methods were tried to determine the criterion weights, and after comparing the results of the AHP and BWM, the criterion weights calculated with the BWM, whose results were found to be consistent, were used in this study. These datasets were normalized and then overlapped according to their weights. The overlapped raster data were classified on the basis of pixel values, allowing for the identification of suitable areas through raster analyses. In the second stage, a vector-based analysis was performed using five criteria: slope data converted to vectors, distance to buildings, distance to waterways, distance to gas stations, and elevation above sea level. These vector layers were merged to identify restricted areas and define unsuitable regions. While the first phase focused on determining suitable areas through raster analyses, the second phase involved merging vector maps to delineate unsuitable regions. Finally, the results from both phases were integrated and jointly evaluated to determine the most suitable assembly places. The determined suitable locations were ranked using the TOPSIS method.
3.1. Emergency Assembly Places and Affecting Criteria
Assembly places are one of the most critical parts of disaster response plans, which should be determined carefully. In an emergency, people must be gathered at predefined places to get services from first aiders and government authorities.
The selection of disaster assembly areas is a critical aspect of effective disaster management, as these places serve as the first assembly points for individuals affected by emergencies. Various criteria have been proposed in the literature to ensure that these areas are suitable for their purposes. These criteria can be generally categorized as accessibility, safety and capacity.
Accessibility is a priority when determining assembly areas. It is essential that these areas are easily accessible for individuals during emergencies, which requires proximity to main roads and densely populated areas [
20]. Studies highlight the importance of minimizing travel distance and ensuring that assembly points are connected to essential services such as hospitals and fire stations [
18,
20]. Furthermore, the availability of open spaces such as parks, green areas and school gardens in zoning plans is crucial, as they need to accommodate a significant number of people seeking refuge [
21,
62].
Safety is another critical criterion. Assembly areas should be located away from potential hazards such as potential building collapses or flood zones to minimize the risk during disasters. The surrounding environment, including the slope of the land and the width of access roads that may affect evacuation routes, should also be assessed for potential threats [
19].
The main criteria used in the literature and their explanations are in
Table 2.
In addition to the criteria used in the studies in the literature, the laws and regulations of local administrations and state units are also critical in determining the assembly areas. As mentioned before, DEMA is the competent authority for disaster management in Türkiye. According to DEMA’s regulations [
68], while determining the disaster and emergency assembly places, criteria which should be taken into consideration are population density, ease of accessibility and evacuation, suitability for the transportation of needed people as much as possible, avoidance of secondary hazards such as flood, fire, tsunami, etc. Other issues to be considered, far from sea and waterways sides and fault lines, having as flat terrain as possible, close to residential areas where basic needs such as water, electricity, sanitary and similar elements can be met but not affected by structural and non-structural elements. Appropriate public places should be selected paying attention to the criteria above.
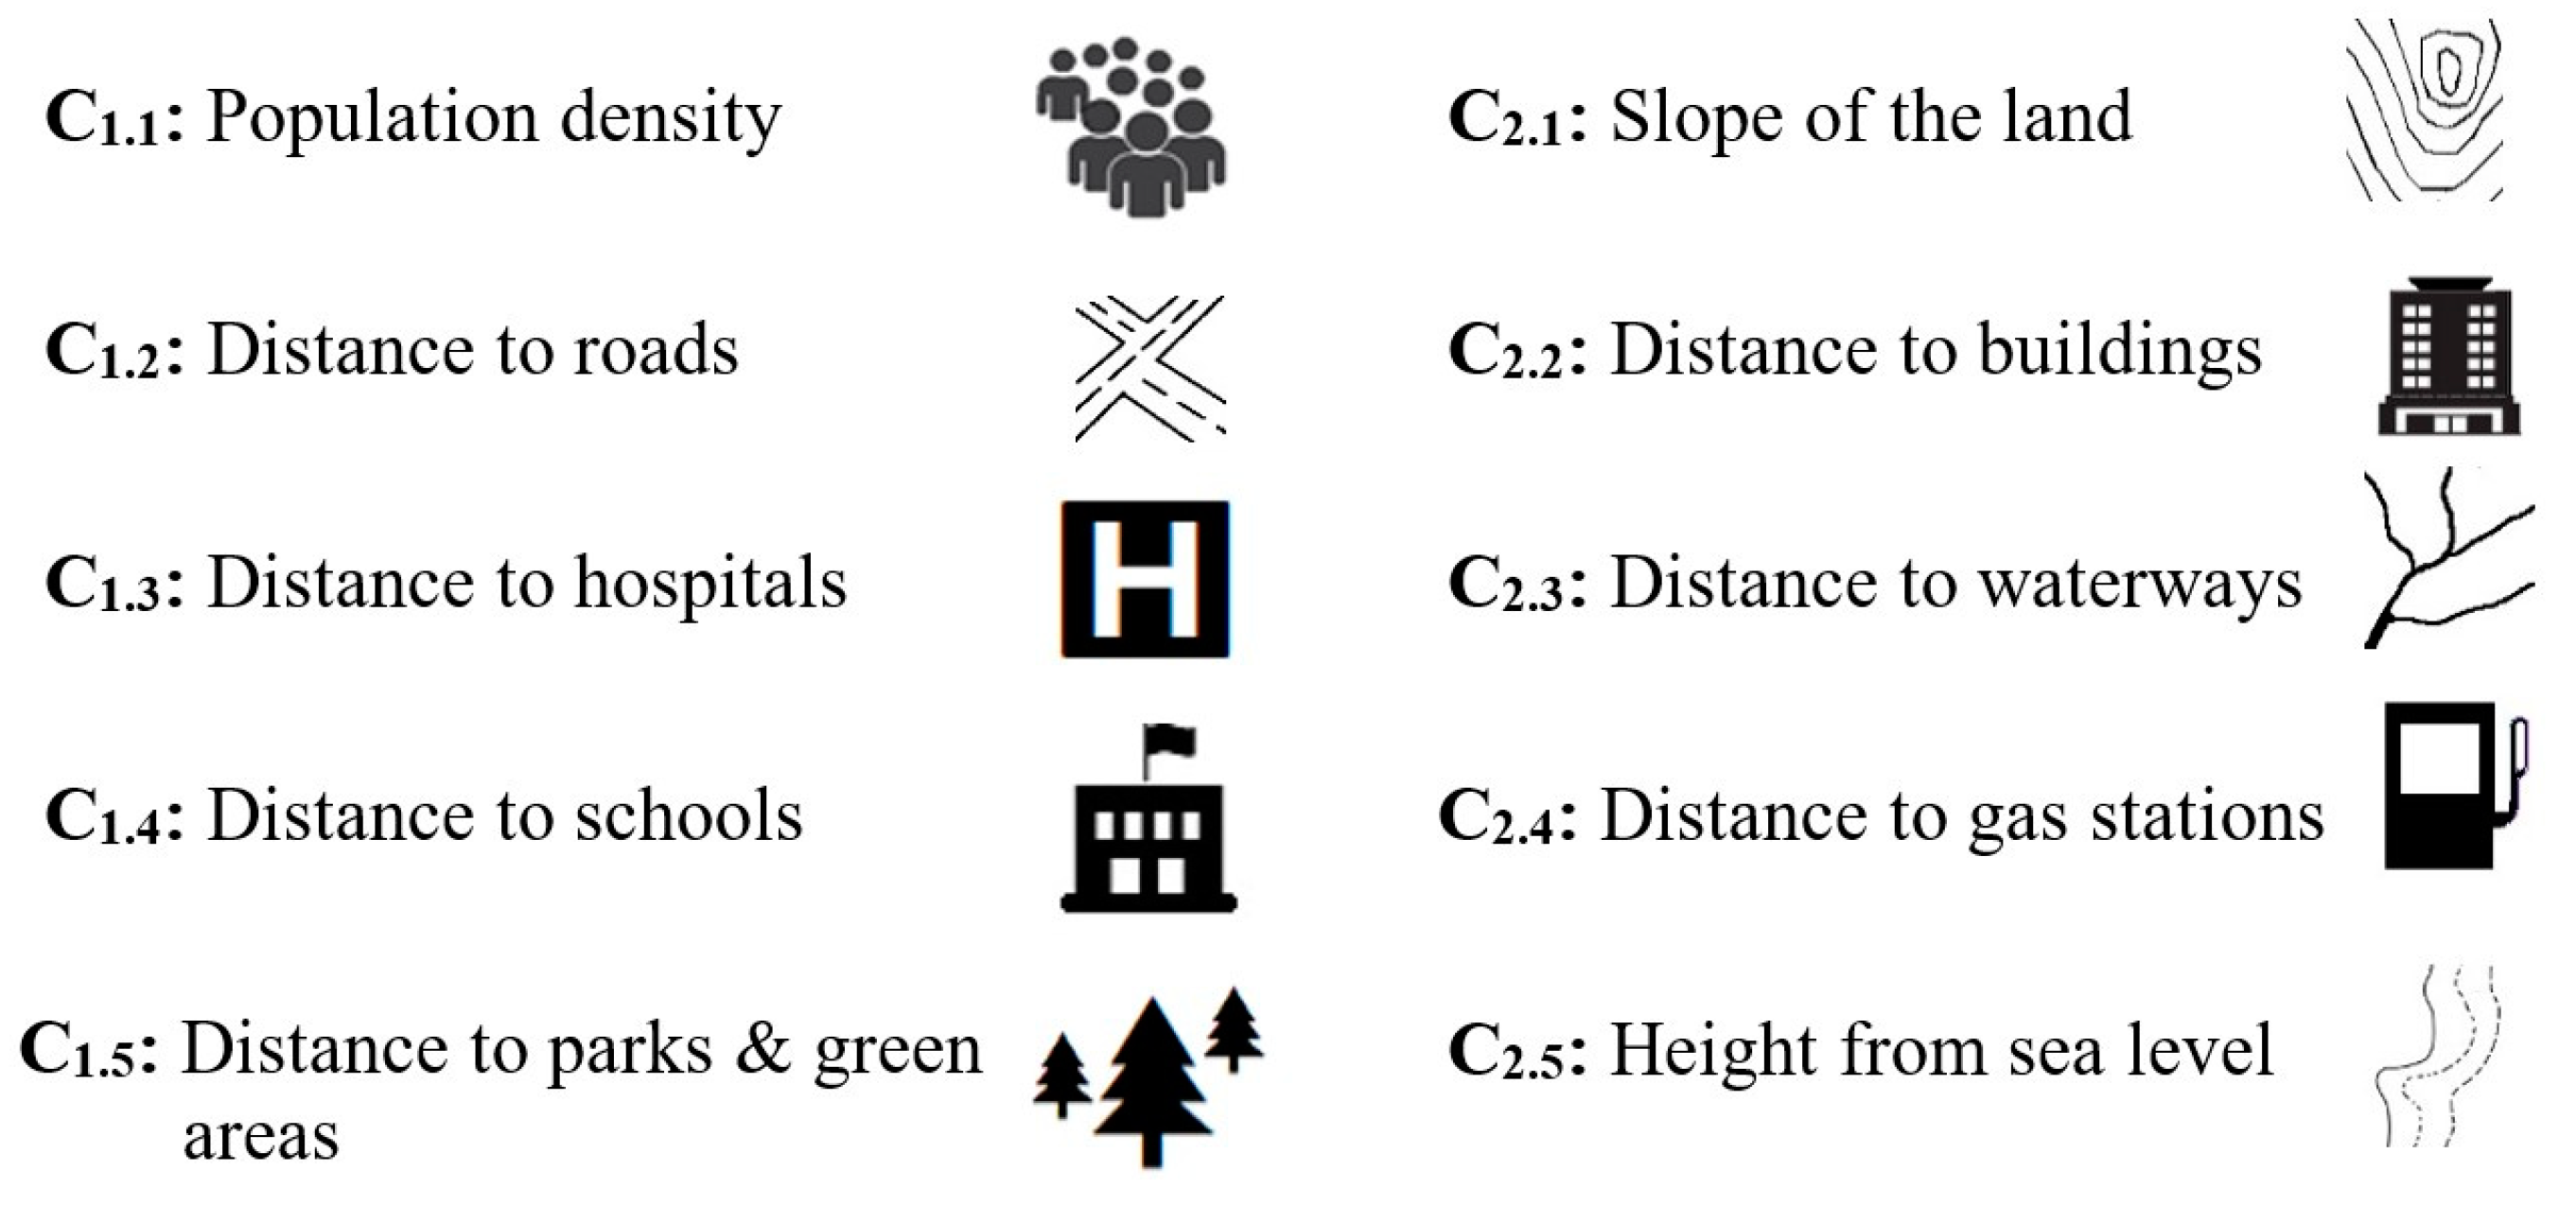
In this study, ten criteria were used to determine suitable assembly places for disasters. These criteria were identified in the light of the DEMA components presented above, based on expert opinion and literature studies. In determining the criteria, accessibility, safety, capacity, and infrastructure support were taken into consideration, and population density, distance from roads, distance from hospitals, distance from schools, and distance from parks and green areas were identified as favourable criteria. These five criteria (C
1.i) were used to identify suitable sites. Environmental and safety considerations were taken into account, and land slope, distance to buildings, distance to waterways, location of gas stations in the case of explosion and fire risk, and distance to sea level in the case of possible tsunami effects were used as restrictive criteria. These second five criteria (C
2.i) define the restricted areas for the assembly places.
Figure 2 shows the criteria.
Site selection for assembly places represents a spatial problem. The proposed model is based on a combined GIS and MCDM analysis. Integrated GIS and MCDM techniques are powerful tools for solving various problems in many areas, such as hospital site selection [
69], bike share station locations [
70], wind farm location suitability [
71], etc.
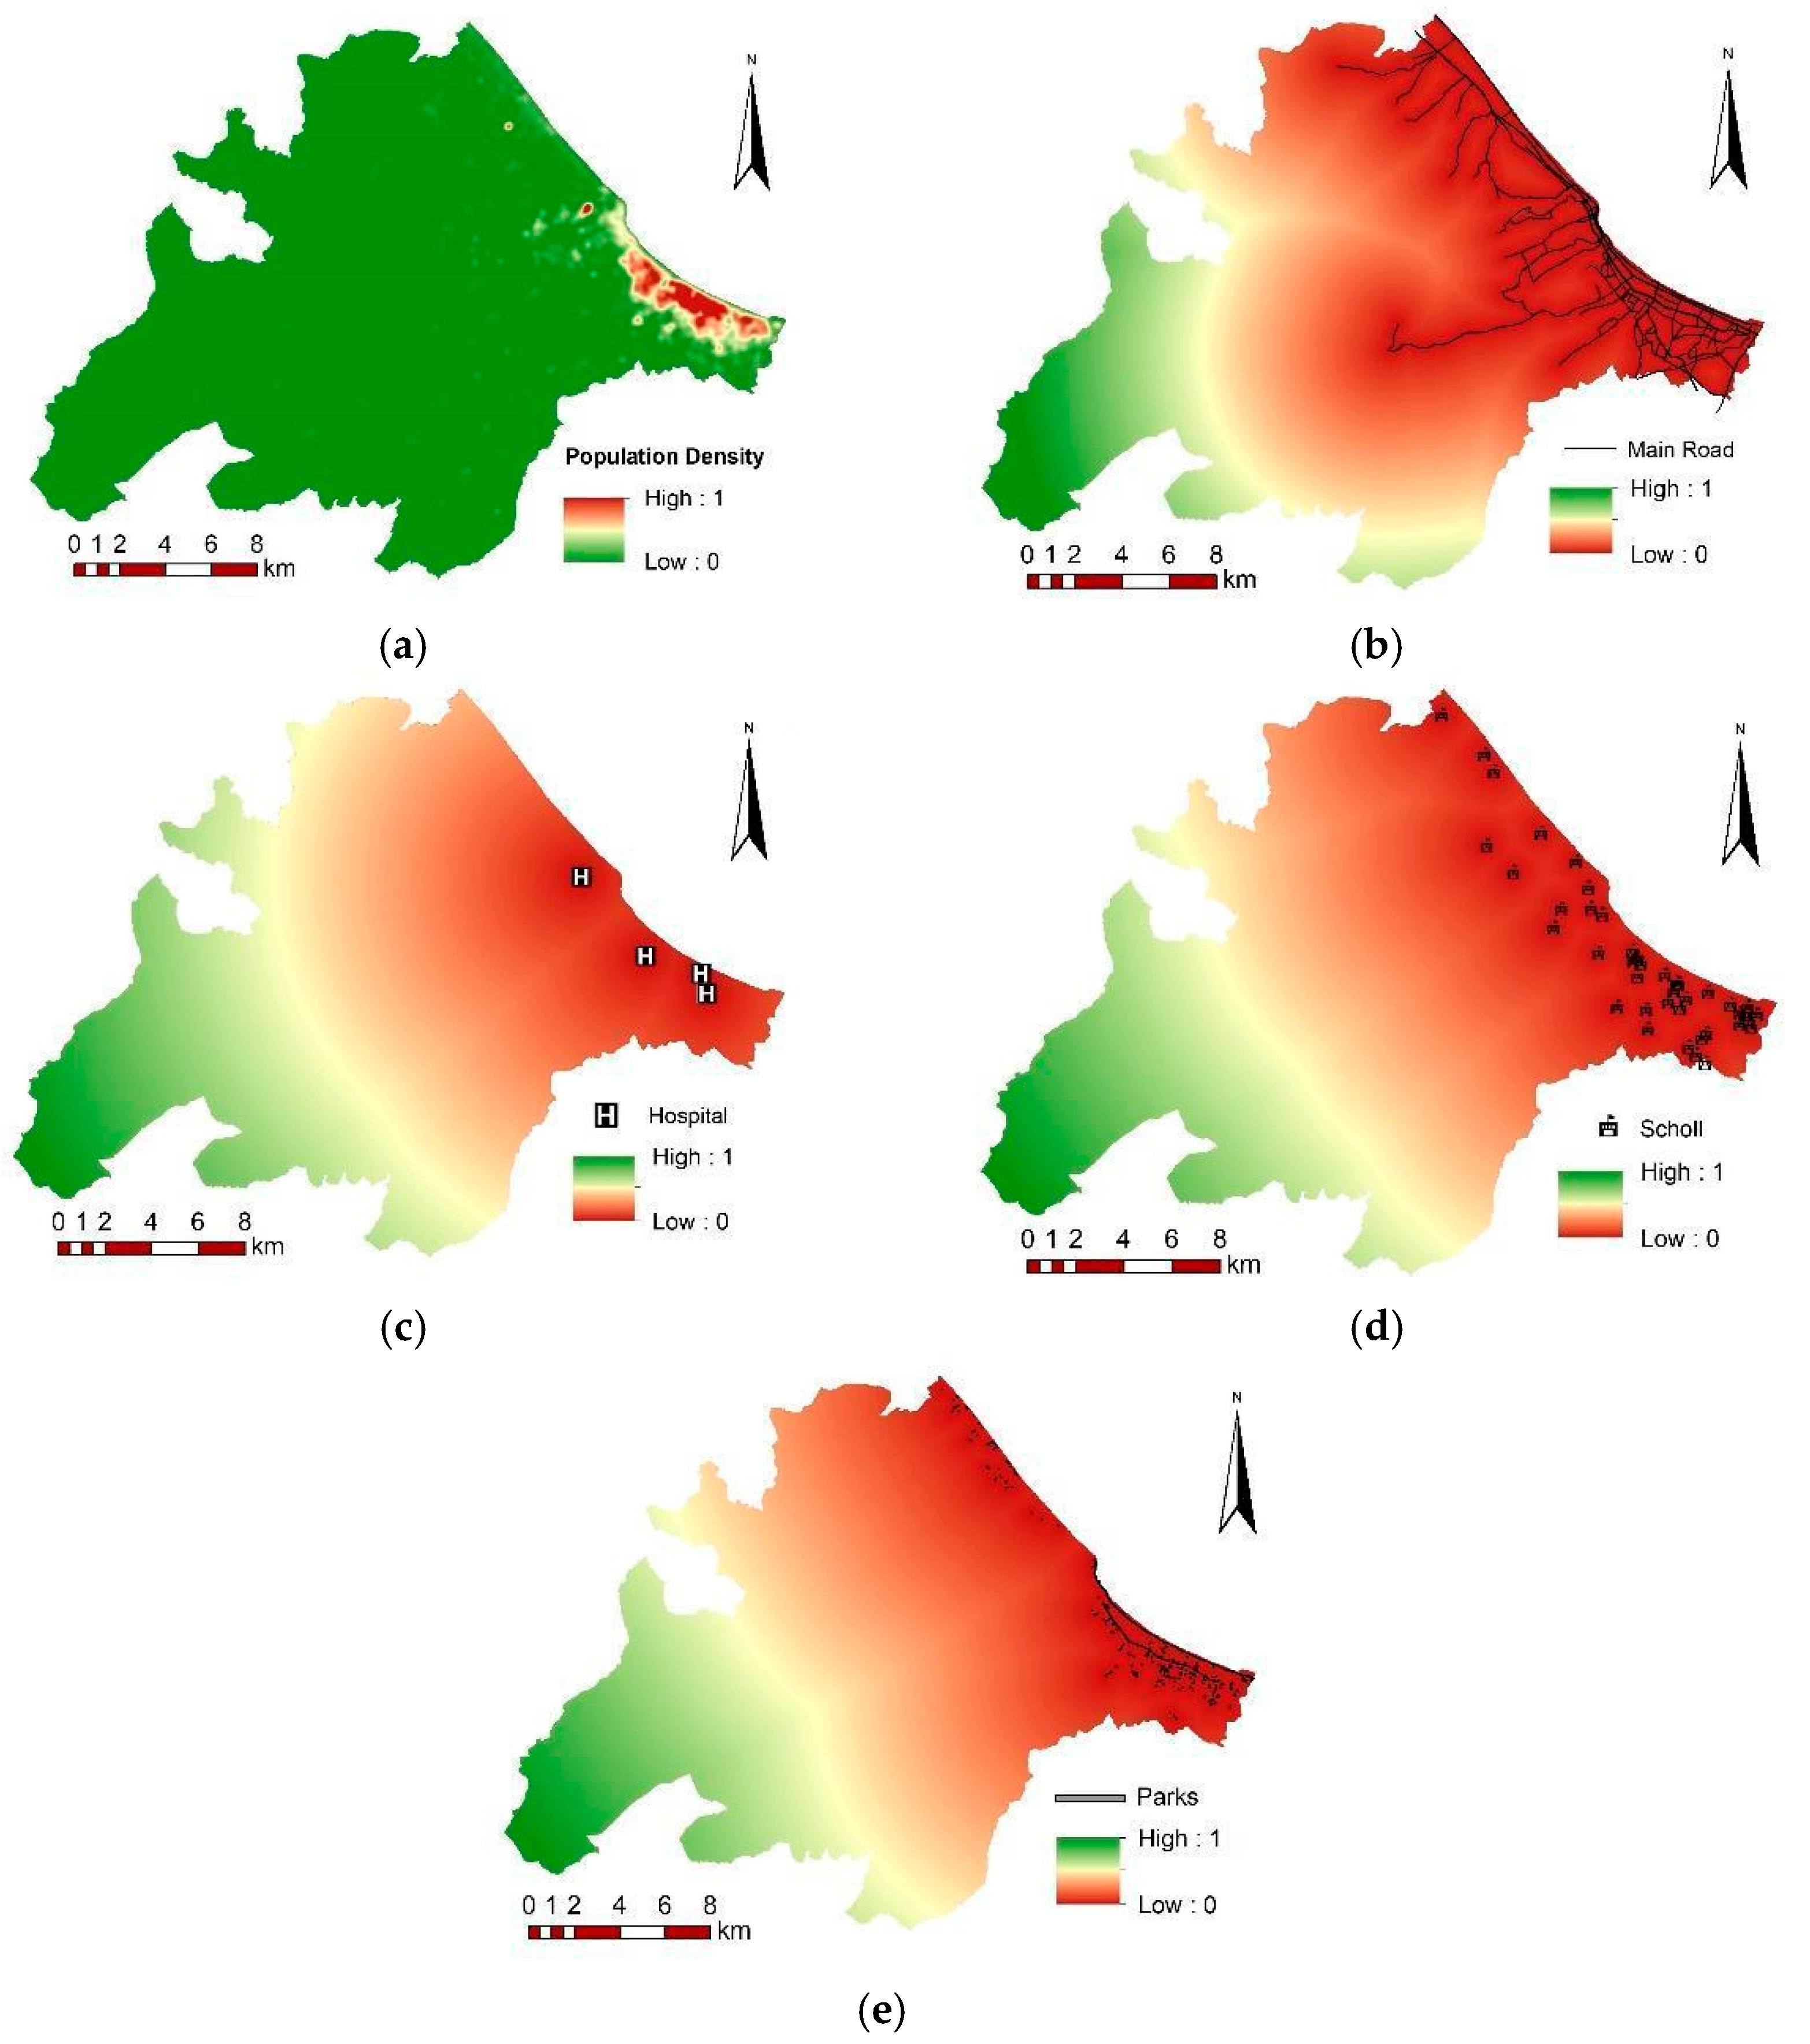
The spatial data management capabilities of GIS and the flexibility of MCDM can be used to integrate and process real-world data. Various spatial analyses were carried out to identify suitable assembly sites in the current study. Some of the most powerful aspects of GIS are querying and analysis. The following GIS spatial analyses were used. Kernel density analysis was used to generate a population density raster dataset, and Euclidean distance analysis was used to assess proximity to roads, hospitals, schools, and parks/green areas. Slope analysis was used to determine suitable terrain conditions, including elevation above sea level. Buffer analysis was used to define risk zones around buildings, waterways and gas stations.
3.2. GIS
GIS, a computer-based tool, has excellent capabilities in spatial query and analysis, which is used in many areas, such as land management, urban and rural land planning, environmental sciences, emergency management, monitoring of risk, etc. [
72]. GIS plays a crucial role in disaster response and recovery efforts by providing real-time data analysis and mapping capabilities that enhance situational awareness, facilitate resource allocation, and ultimately help save lives during emergencies, particularly as the frequency and severity of natural disasters continue to rise [
73]. Spatial data, which describes any data related to a specific location on the Earth, is a critical data type in understanding the world. GIS allows for the investigation of several factors together using spatial data. In this paper, the spatial data influencing the location of emergency assembly places were obtained in different layers and evaluated jointly using a GIS application.
3.3. AHP
The AHP is a structured decision-making framework that allows for the evaluation of multiple criteria in complex decision scenarios. Developed by Saaty, the AHP is particularly useful in MCDM contexts, where it helps decision-makers prioritize alternatives based on different criteria [
74]. The AHP is widely used in various fields due to its ability to handle complex decision problems involving multiple criteria. It is applied in urban and regional planning, land use planning and infrastructure development, environmental management, transportation and logistics, health care, business and finance, manufacturing and industry, etc. The AHP remains a widely preferred MCDM in various disciplines [
75,
76]. The following steps outline the AHP calculation process:
Step 1. Determination of Criteria and Sub-Criteria.
Initially, the decision problem is identified, and the relevant criteria and sub-criteria are defined. These criteria represent the different factors that will influence the decision-making process.
Step 2. Pairwise Comparison of Criteria.
Experts or decision-makers perform pairwise comparisons of each criterion based on their relative importance using the Pairwise Comparison Method (PCM). A comparison matrix is then constructed, where each element represents the relative significance of one criterion over another, typically using a weighting scale from 1 to 9, as proposed by Saaty [
74].
Step 3. Calculation of Criteria Weights.
The pairwise comparison matrix is analyzed to derive the criteria weights by normalizing the matrix and computing the eigenvector associated with the largest eigenvalue, which represents the relative importance of each criterion (1) [
75].
where
aij′ is the normalized weights and
wi the relative weights of each factor.
Step 4. Consistency Check.
The relative weights are given by the normalized eigenvector (w) corresponding to the maximum eigenvalue
. The consistency ratio (CR) is given by
, where random index (RI) is the random consistency index that varies according to the number of criteria in a comparison (n) as shown below (
Table 3). The consistency index (CI) is calculated using Equation (2).
A consistency ratio is calculated to assess the consistency of the judgments made during the pairwise comparisons. If the CR is within an acceptable threshold (CR ≤ 0.10), then the judgments are considered consistent (3). If the ratio exceeds this threshold, then the comparisons may need to be revisited [
47,
75].
3.4. BWM
The BWM is a relatively new MCDM method based on the comparison of the best (most important, most desirable) criterion with other criteria and the other criteria against the worst (least important, least desirable) criterion [
77,
78,
79]. The weights of the criteria can be obtained with fewer comparisons in the BWM compared to other MCDM methods. The BWM has been used in many areas, such as land valuation [
78], logistics performance evaluation, green innovation, technology evaluation and selection, research and development performance evaluation [
80], machining processes, material selection, and industrial optimization [
56].
The steps of the BWM are briefly described below [
81]:
Step 1. Determining the Criteria Set.
The decision-maker identifies
n criteria.
Step 2. Selecting the Best and Worst Criteria.
Among the identified criteria, the decision-maker selects:
- -
Best criterion (B): the most important or desirable criterion;
- -
Worst criterion (W): the least important or least desirable criterion.
Step 3. Determining the Preference of the Best Criterion Over Others.
The decision-maker assigns a preference value (
aBj) between 1 and 9 (1—equally important, 3—moderately more important, 5—highly important, 7—much more important, and 9—extremely important), indicating how much more important the best criterion is compared to each criterion
j. The best-to-others (
BO) preference vector is:
where
aBj in the
AB vector represents the preference of the best criterion
B over criterion
j, and
aBB = 1.
Step 4. Determining the Preference of Other Criteria Over the Worst Criterion.
Similarly, the decision-maker assigns a preference value (
ajW) between 1 and 9, representing how much more important each criterion
j is compared to the worst criterion
W. The others-to-worst (
OW) preference vector is:
where
ajW indicates the preference of criterion
j over the worst criterion
W and
aww = 1.
Step 5. Determining the Optimal Weights.
The most suitable weight for each criterion is found (w1*, w2*, ……… wn*).
The aim is to determine the optimal weights of the criteria, such that the maximum absolute differences
and
for all
j are minimized, which is translated to the following min–max model (4) [
82]:
The problem equation is transferred to the following linear programming problem (5) [
82]:
With the completion and solving of all these models, optimum weights and values obtains. The values show the consistency rates of the analysis made [
81].
3.5. TOPSIS
TOPSIS, one of the classic multi-criteria decision-making methods, was developed by Hwang and Yoon [
83,
84]. The basic principle of the TOPSIS method is that the chosen alternative should have the shortest distance from the positive ideal solution and the longest distance from the negative ideal solution, facilitating effective multi-criteria decision-making [
85]. TOPSIS is used in many areas where ranking is required. It is frequently used in industrial planning, marketing and site selection applications [
61].
The TOPSIS process consists of the following steps:
Step 1. Structuring and Normalizing the Decision Matrix using Equation (6) [
83]:
j = 1, …,
J;
i = 1, …,
n.
Step 2. Calculating the Weighted Normalized Decision Matrix using Equation (7).
where w
i is the weight of the
ith attribute or criterion (8), and
Step 3. Determining the Positive Ideal Solution and Negative Ideal Solution using Equations (9) and (10) [
83].
where
I′ is associated with benefit criteria and
I″ is associated with cost criteria.
Step 4. Calculating the Distance of Each Alternative from the Positive Ideal Solution using Equation (11) and from the Negative Ideal Solution using Equation (12) [
61].
Step 5. Calculating the Relative Closeness using Equation (13) [
61].
Step 6. Ranking the Preference Order [
61].
5. Discussion
This study focuses on the identification of suitable emergency assembly places. Two-phases approach was used. In the first phase of the study, the criteria were selected based on a combination of the most commonly used criteria in the literature and expert opinions. These criteria were categorized into two groups: suitability criteria which define areas suitable for assembly, and restrictive criteria which represent areas unsuitable for emergency assembly. The weights of the criteria used in the integration of raster data were determined using the AHP and BWM.
Due to the high similarity ratio (91%) between the AHP and BWM results and the consistency of the BWM, the criterion weights obtained through the BWM were used in this study. The CR value, which assesses the accuracy and reliability of the BWM results, was calculated as 0.076, confirming the validity of the model. Nyimbili and Erden [
62], in their studies, used two different BWM approaches and calculated the CR values as 0.11 and 0.10, respectively, concluding that these values were within the consistency threshold. In comparison, the CR value in this study was 0.076, indicating a higher consistency and confirming the robustness of the model. Although the CR value of the study is consistent, the difference in weighting between population density and other criteria is due to the individual preferences of the experts. If the CR had been outside the acceptable range, then the decision-makers’ answers would have required further evaluation, or additional experts would have been consulted. However, the individual preferences of the experts differ. The consensus on population density as the most critical factor explains the differences in weighting observed in the BWM results.
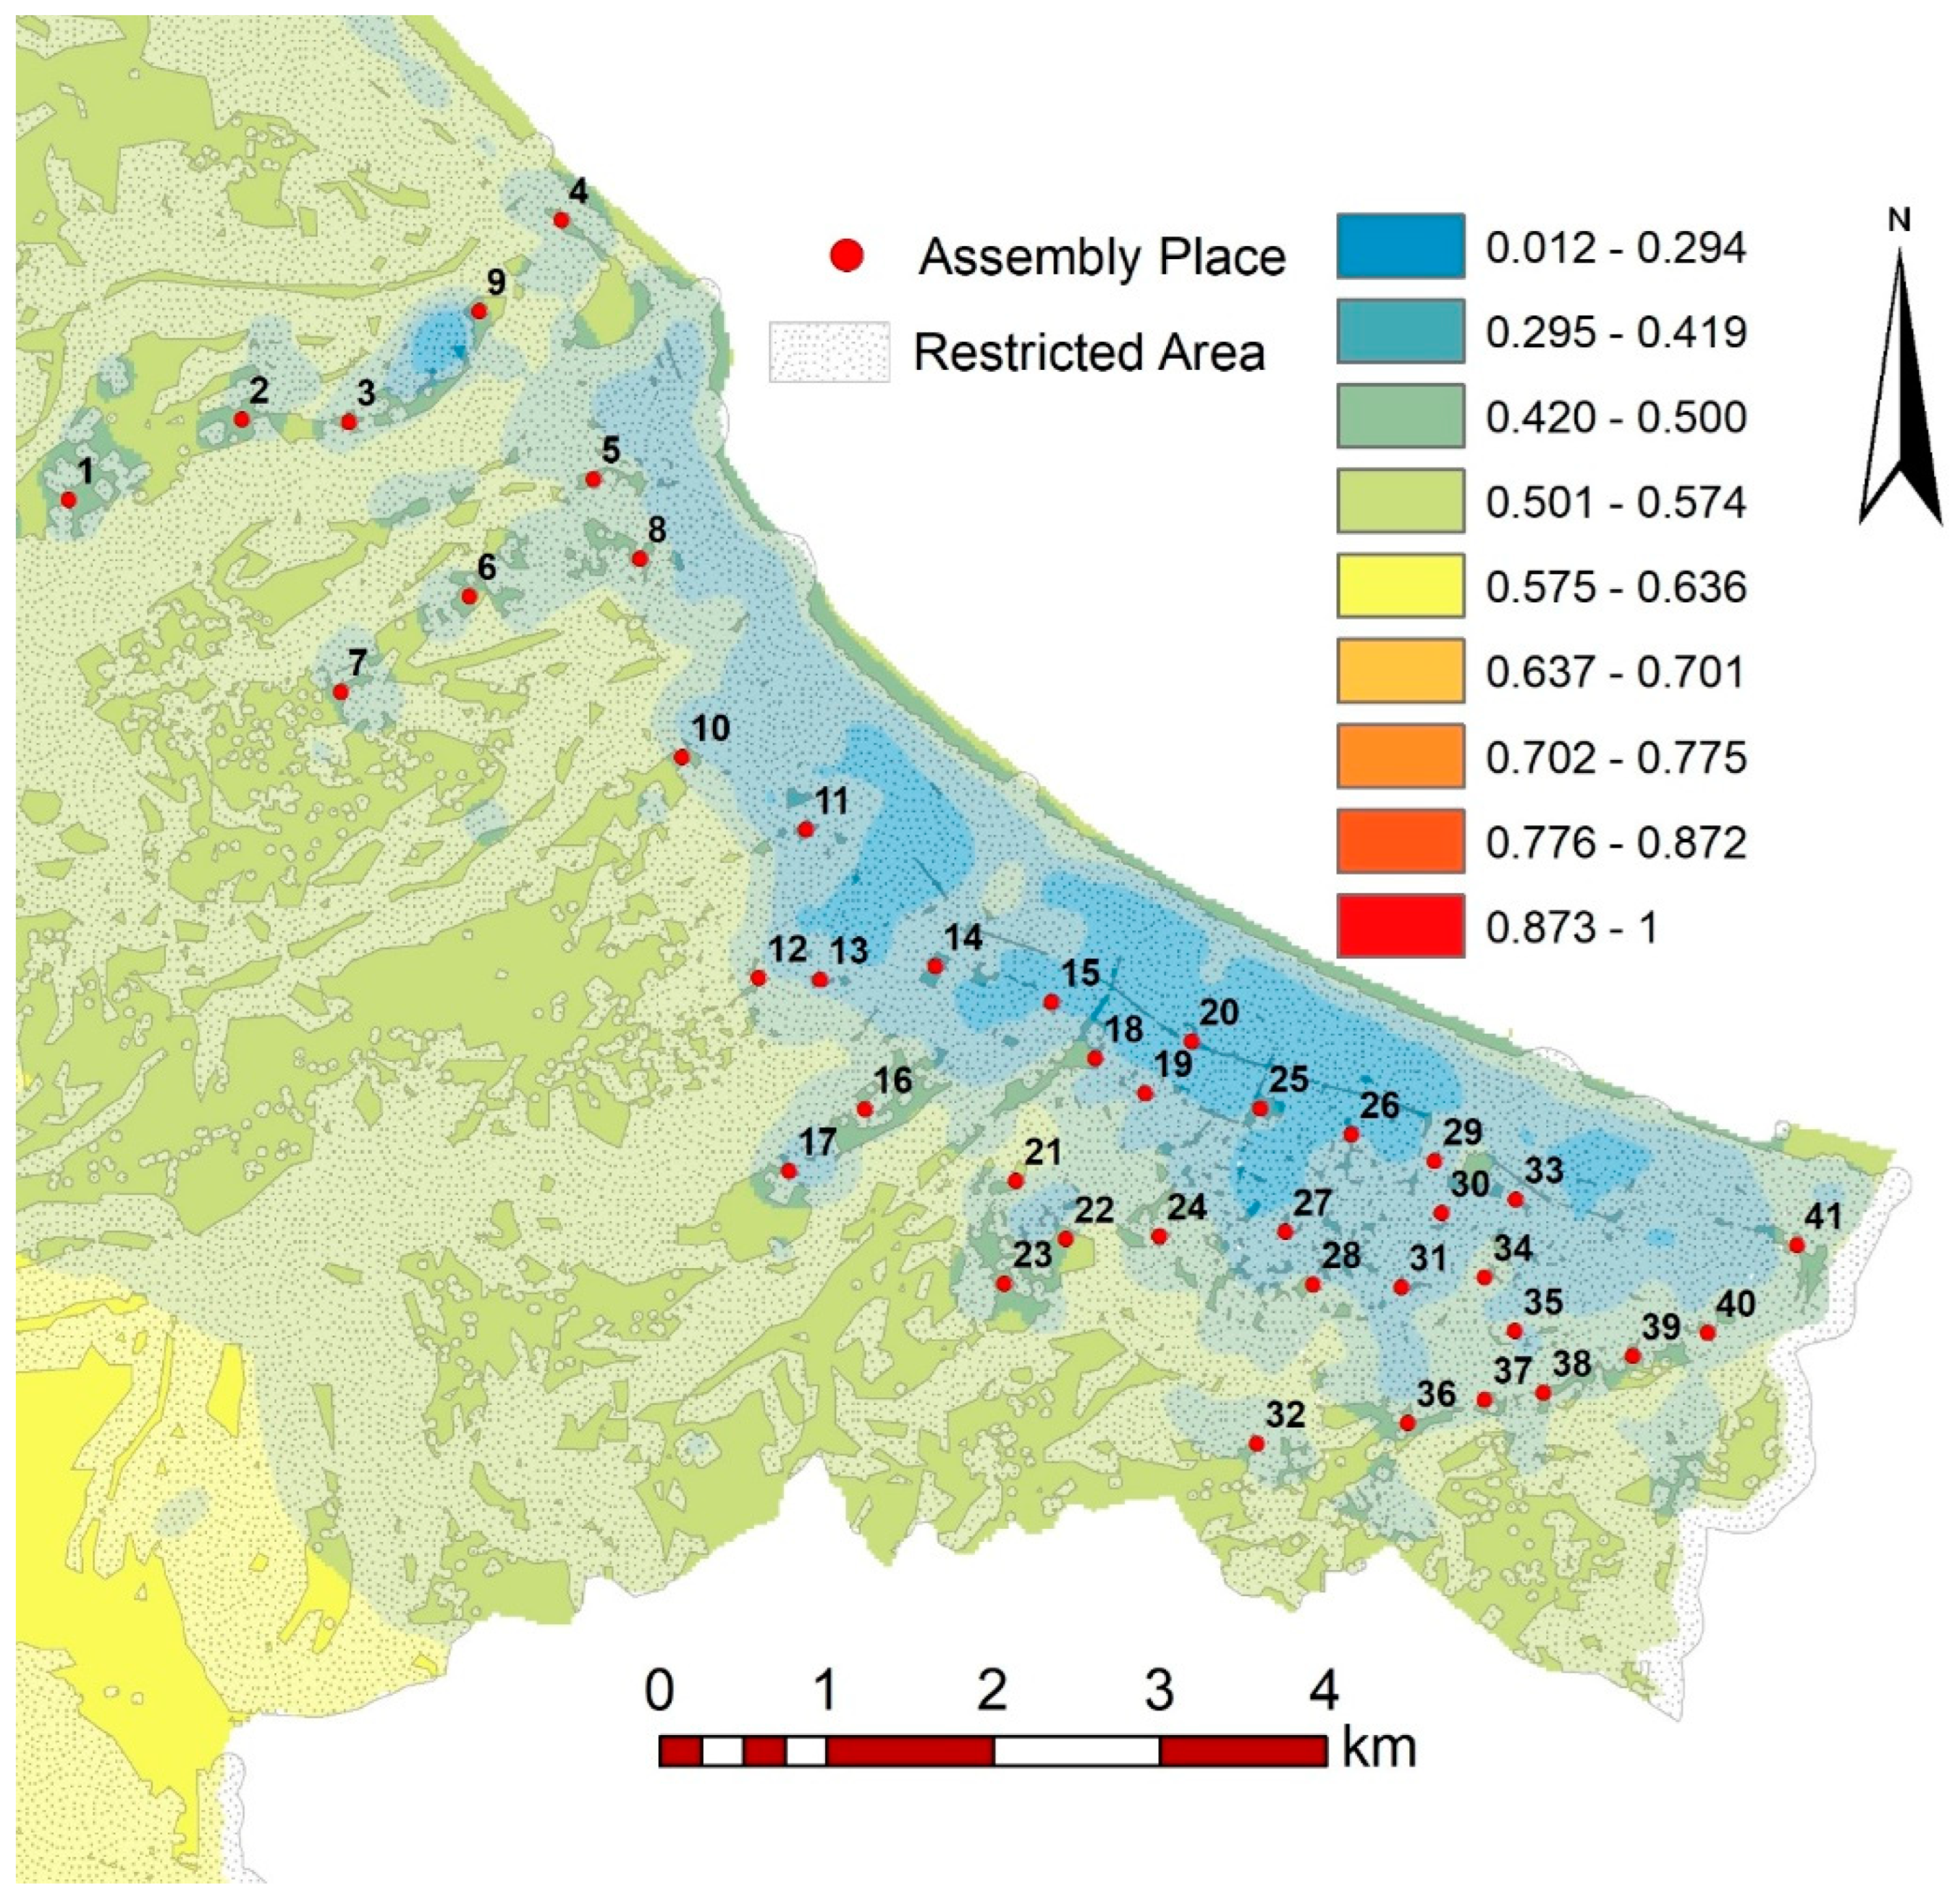
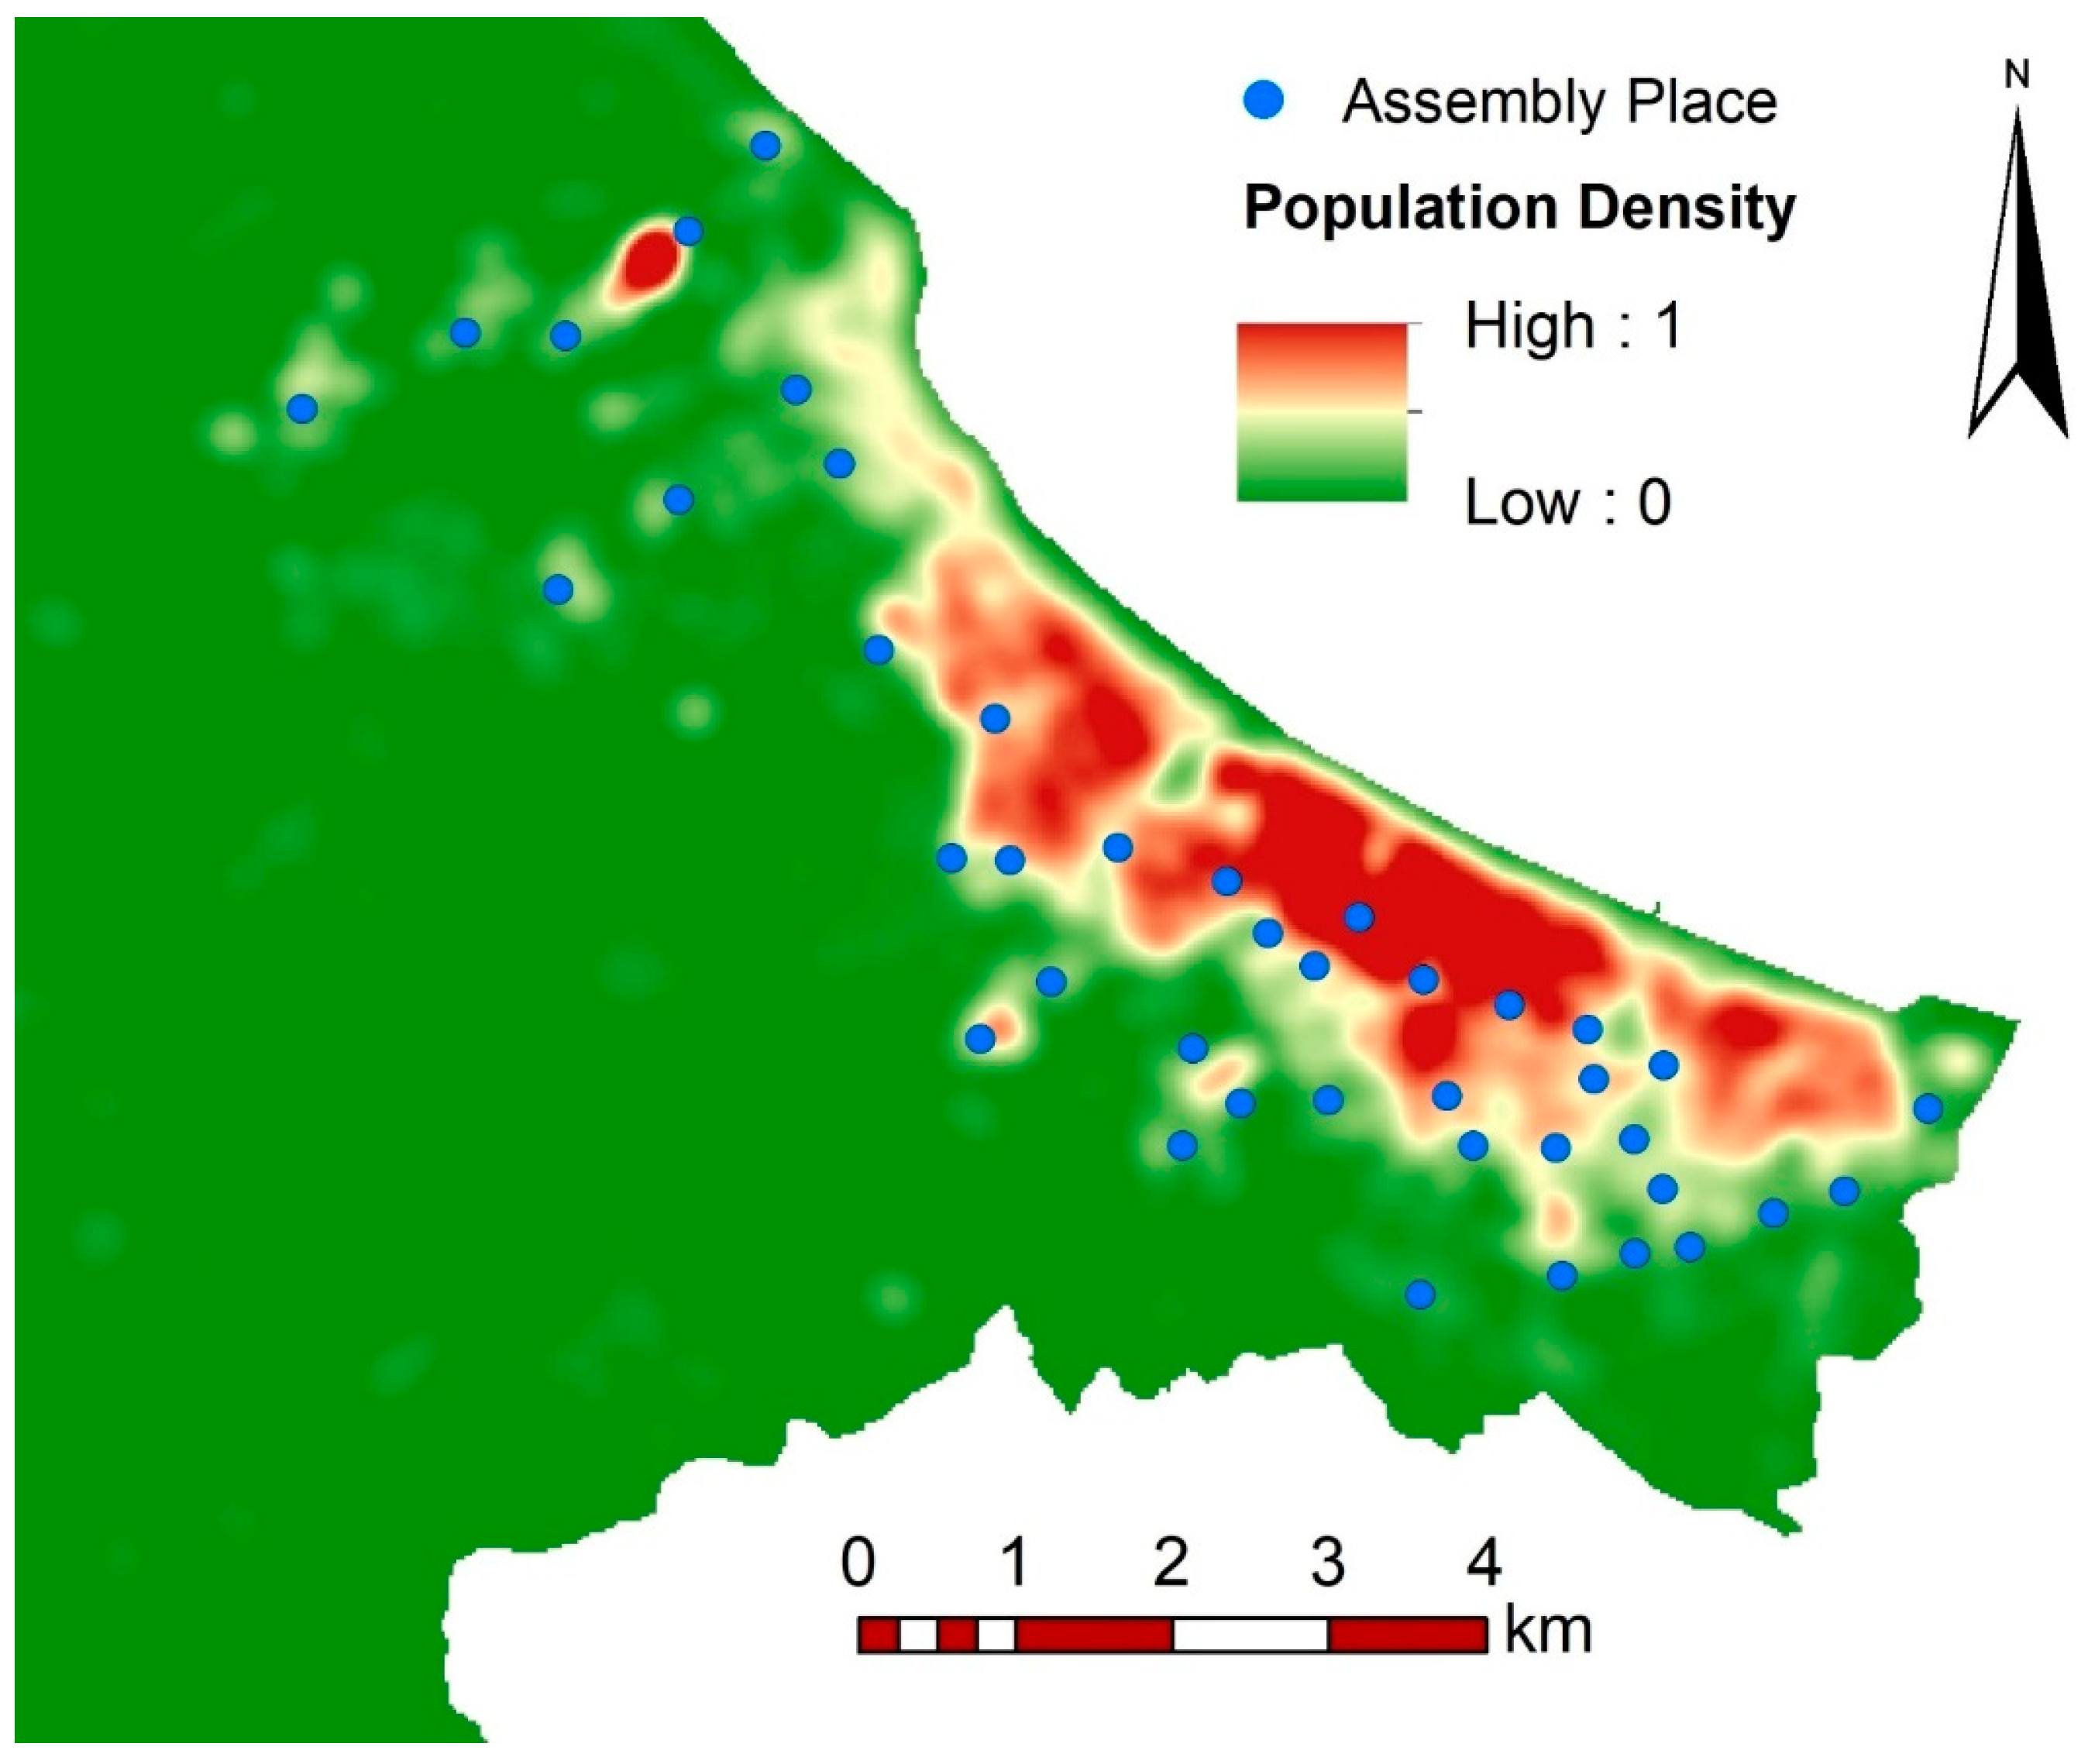
Following the determination of the criteria weights, individual maps for each criterion were generated. Areas with higher population density were assigned higher scores. In the proximity maps (e.g., roads, hospitals, schools, and parks), areas closest to these features received the highest scores, as per the study’s objective. To enable a comprehensive evaluation, all generated raster map pixel values were normalized between 0 and 1. The weighted values calculated through the BWM were then applied in a raster calculation process to produce a final suitability map. According to the legend of this raster map, pixel values closer to 0 indicate more suitable areas, while higher values represent less suitable ones. When pixel values were classified into nine groups, it was determined that a pixel value range of 0–0.5 represents the more suitable assembly areas. This classification marked the completion of the first phase of the study.
The second phase focused on identifying restrictive areas using vector-based data. The restrictive criteria included slope, proximity to buildings, proximity to waterways, proximity to gas stations, and proximity to coastal areas. These vector layers were merged to generate a restricted area map, completing the second phase.
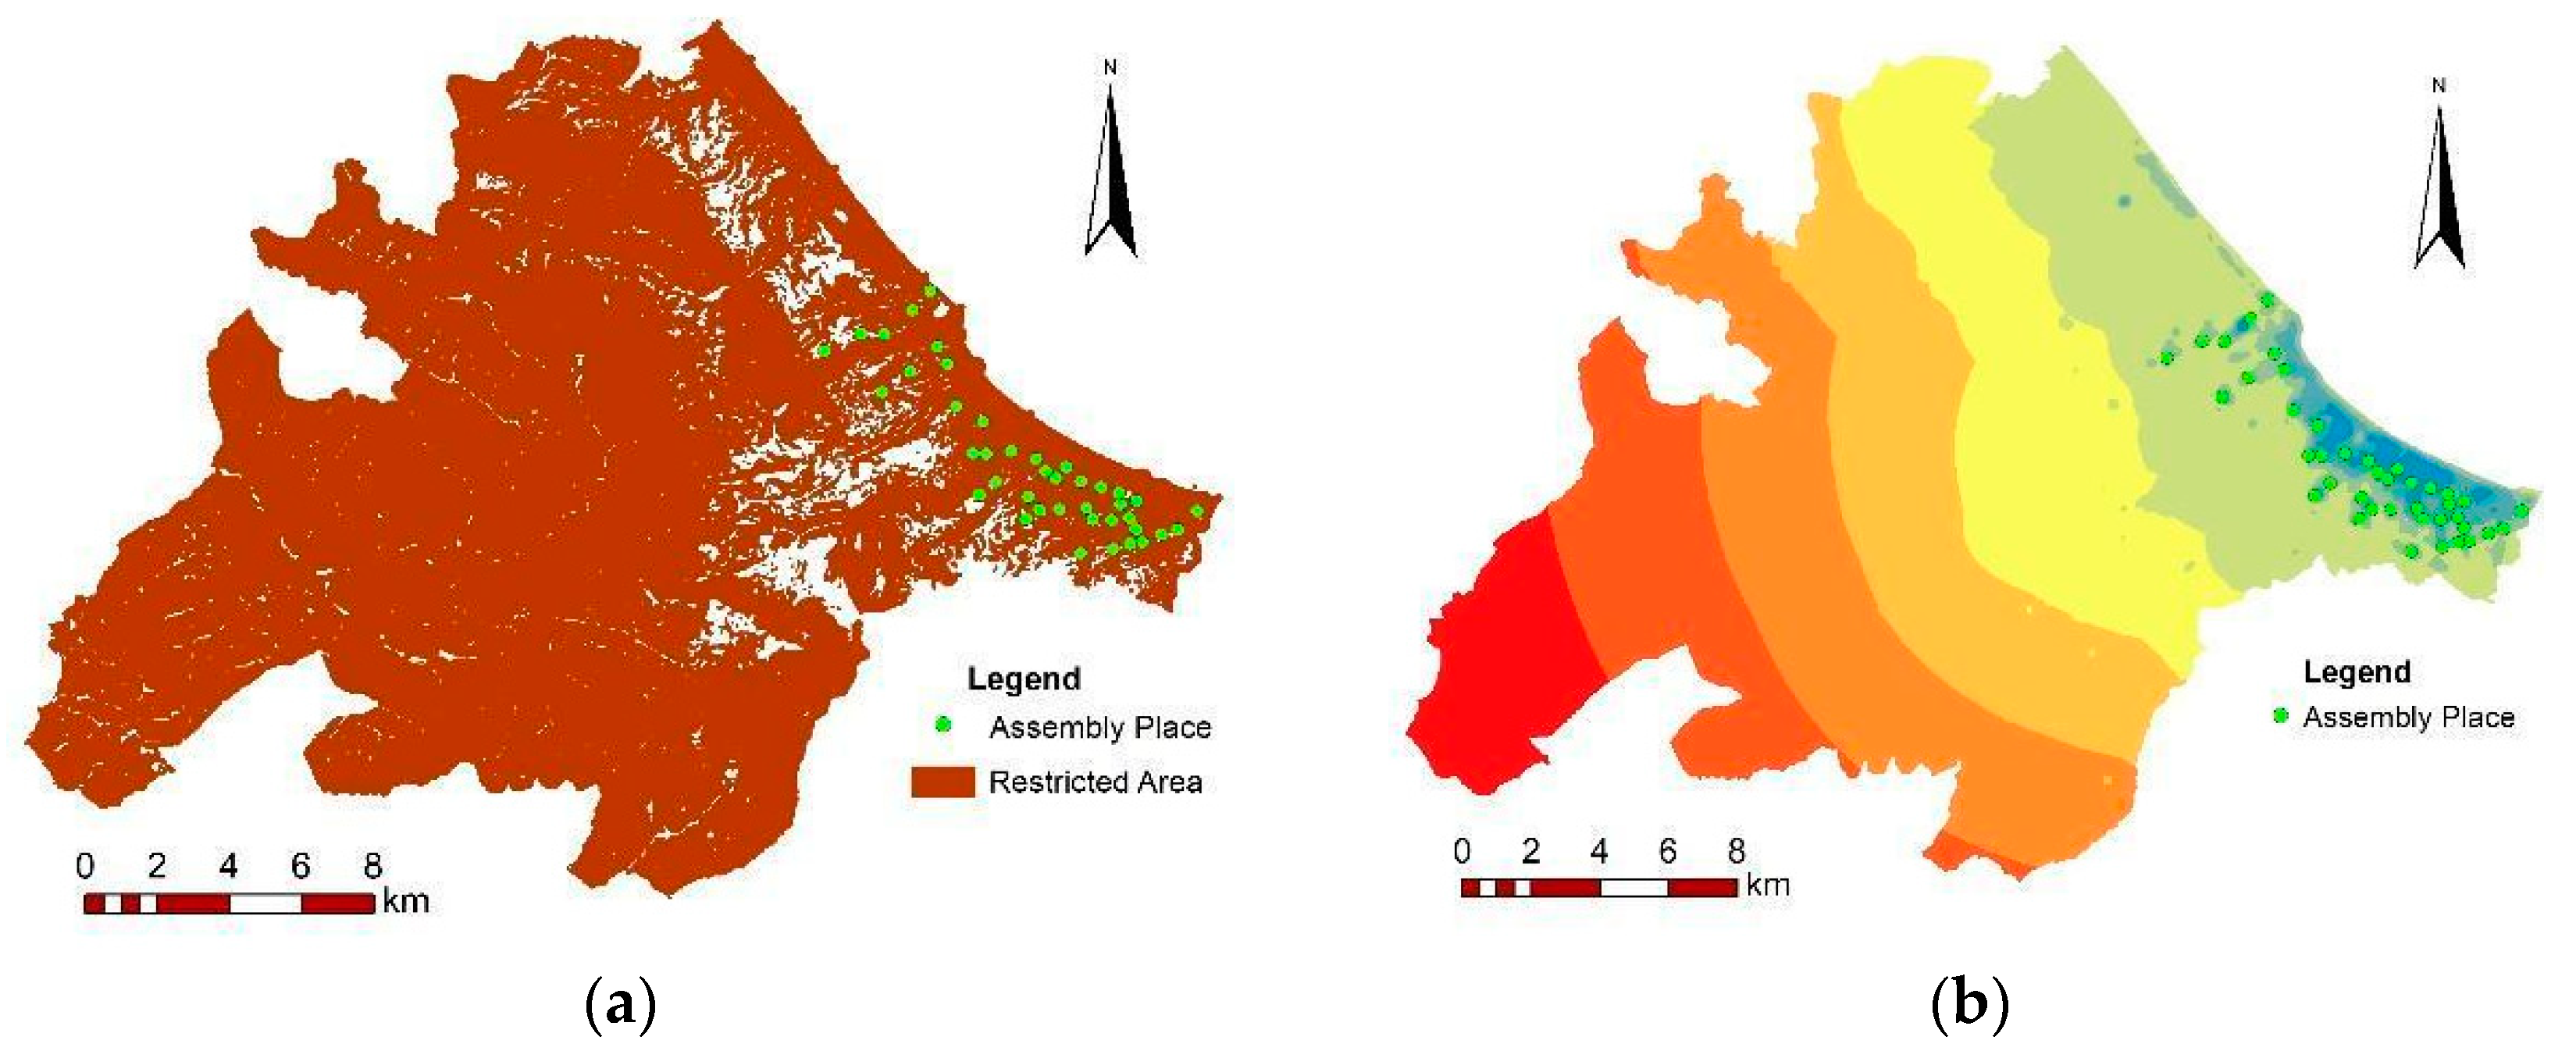
By integrating the suitability and restrictive area maps, potential assembly locations were identified based on specific conditions. Areas with pixel values ranging between 0 and 0.5 in the suitability map were considered the most appropriate for emergency assembly. Additionally, to ensure effective spatial distribution and accessibility, selected locations were required to be at least 250 m apart. Furthermore, any areas overlapping with restrictive zones, such as steep slopes, proximity to buildings, waterways, gas stations, or coastal areas, were excluded from consideration. As a result of this comprehensive evaluation, a total of 41 potential emergency assembly areas were identified, all meeting the established criteria.
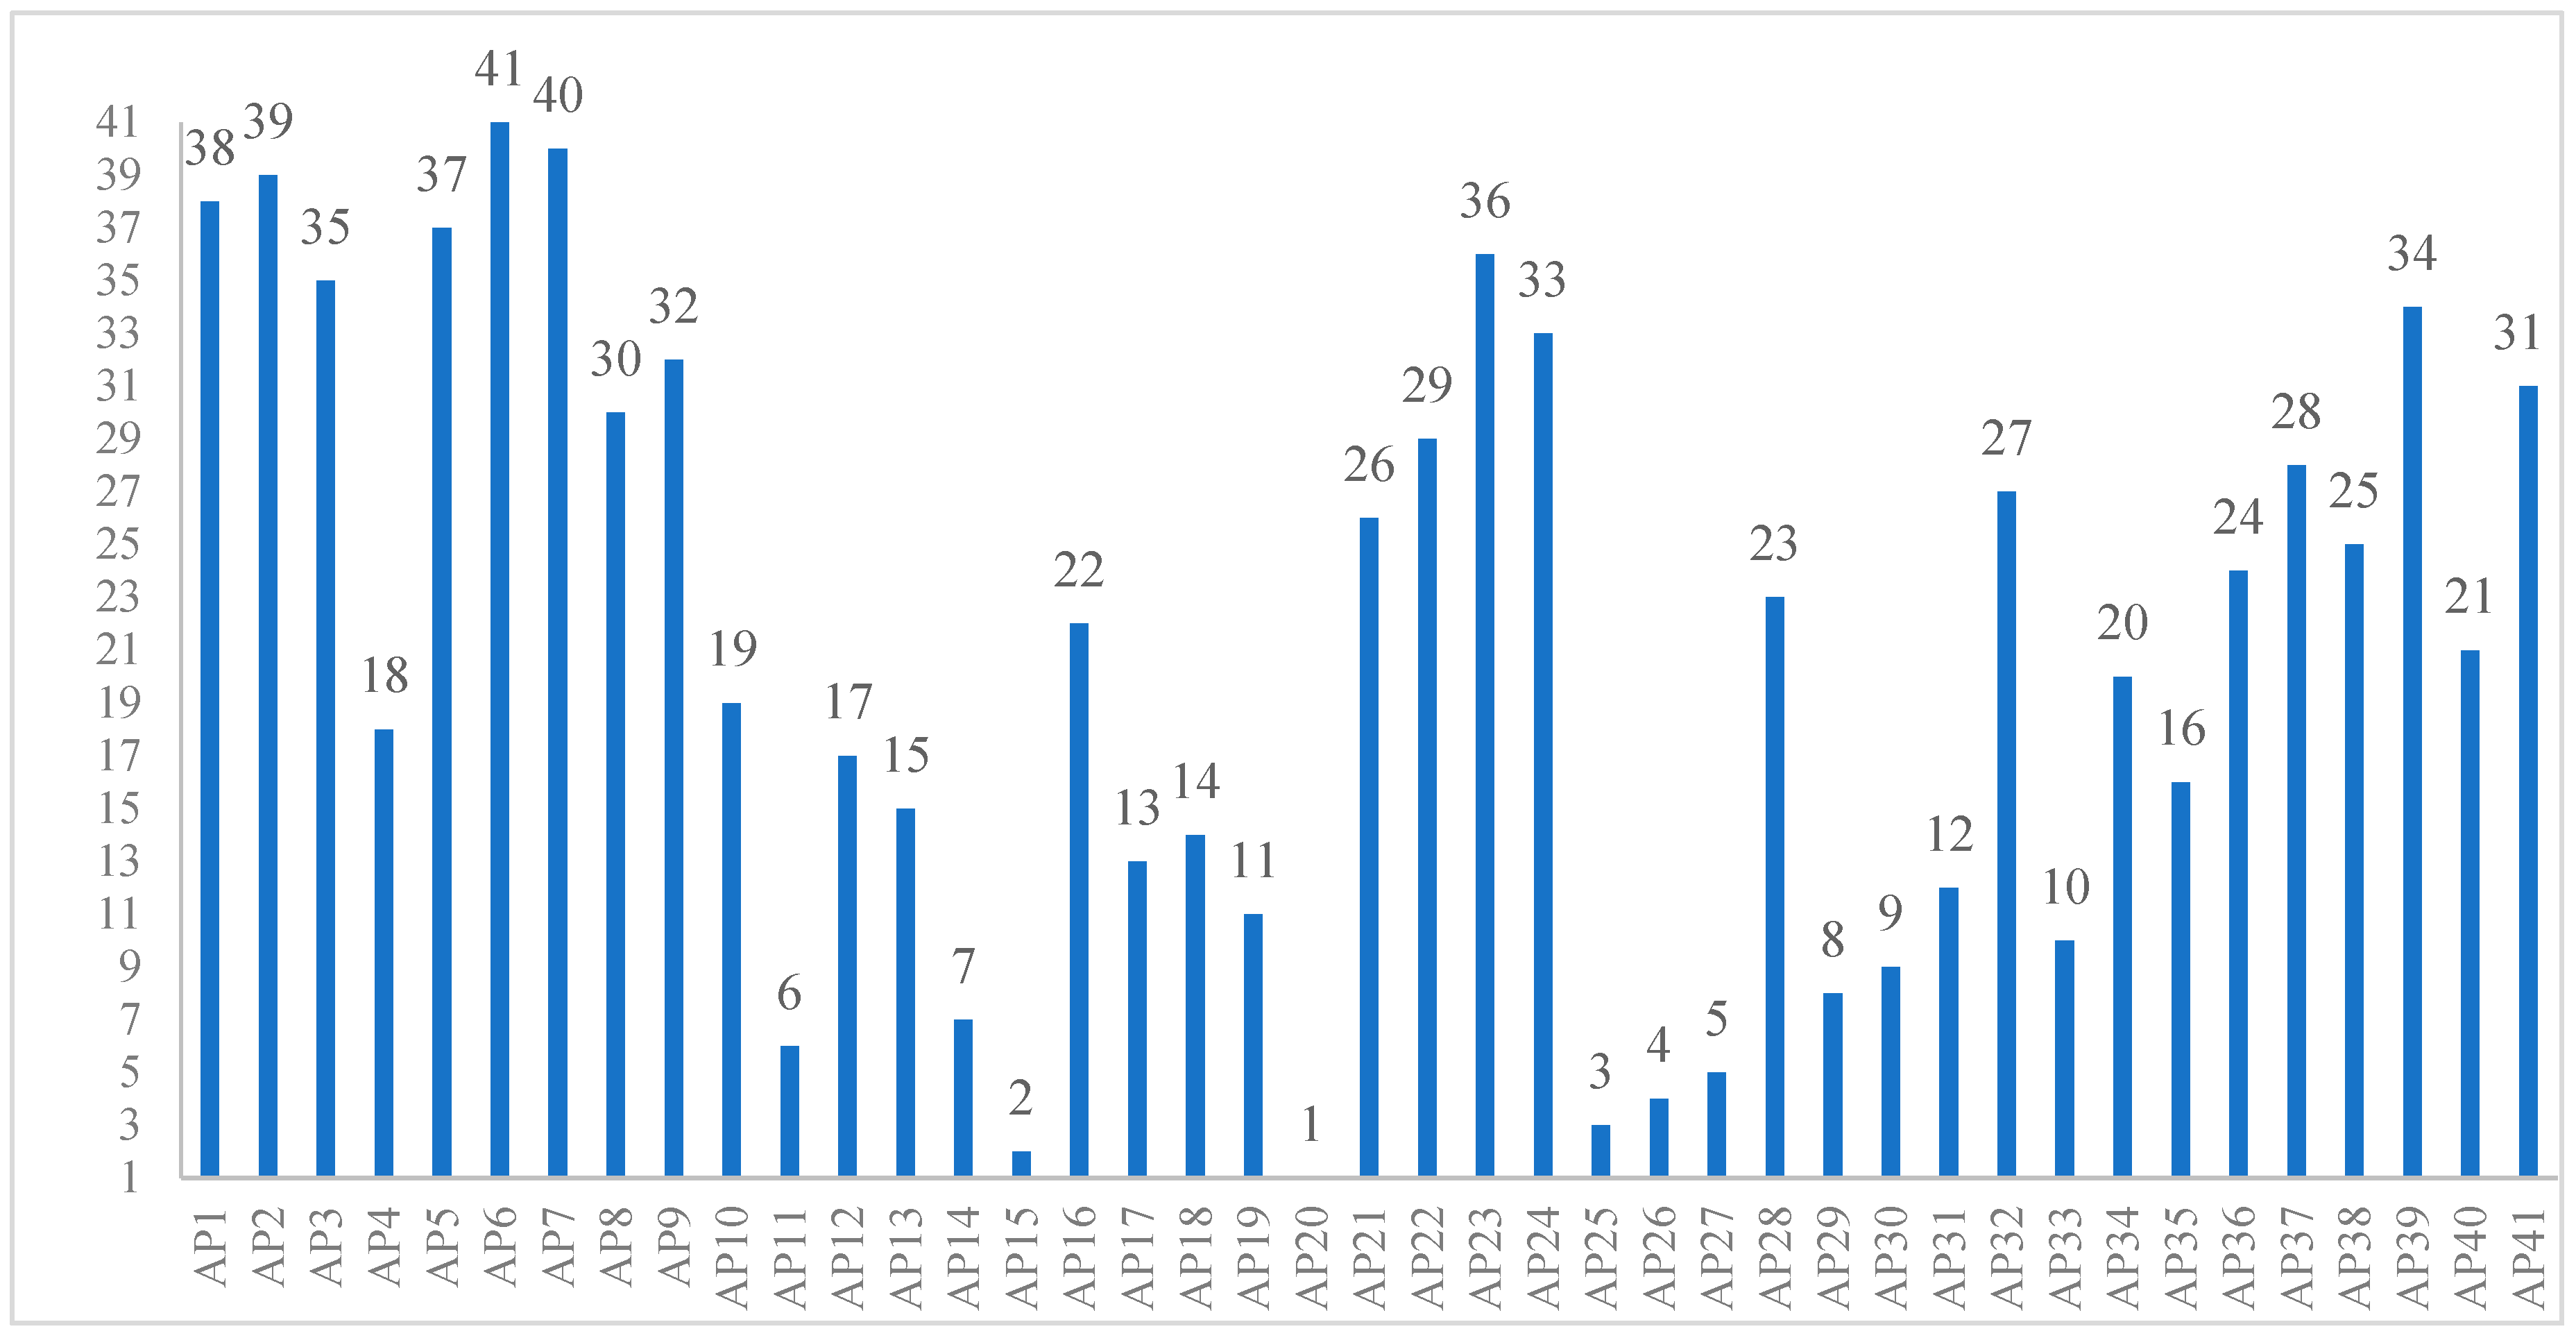
The identified APs were ranked using the TOPSIS method to determine their suitability from most to least appropriate. The analysis of the TOPSIS results revealed that the three highest-ranked assembly points (AP20, AP15, and AP25) are located in densely populated areas, well-connected by a dense road network, and in close proximity to parks, green spaces, hospitals, and schools. Conversely, an examination of the three lowest-ranked assembly points (AP2, AP7, and AP6) indicates that these locations are in sparsely populated areas with limited road access. Although they have abundant green spaces nearby, they lack proximity to critical infrastructure such as hospitals and schools. Based on the TOPSIS results, the ranking was found to be consistent and effectively reflects the suitability of the selected emergency assembly points.
6. Conclusions
Effective emergency management policies and applications are needed to prevent or reduce disasters and their hazardous effects, which cover before, during, and after an emergency case. Assembly places have a vital role in the case of an emergency. This study provides a scientific framework for determining suitable locations for emergency assembly places in Atakum. In this study, ten criteria were identified as influencing the location of the APs. For five criteria, which represented suitable places, a raster-based spatial analysis was performed, and the BWM was then applied to determine their respective weights. The remaining five criteria, in vector form, underwent spatial analysis and were then merged to delineate restricted areas for APs. Finally, all raster and vector-based criteria maps were integrated to identify suitable AP locations. In particular, the most suitable APs were located away from densely populated residential areas based on the building buffer, slope, and sea level criteria.
The proposed two-phase method determines suitable locations for assembly places based on criteria and reduces the complexity in the site selection process. Another advantage of the proposed approach is its excellent decision support for planners, especially decision-makers. The findings highlight that the identified locations are concentrated in highly urbanized areas, which are crucial during and after a disaster, as these sites serve as initial access points for affected individuals and enable prompt emergency response efforts. The proper selection of these locations is essential for ensuring accessibility, safety, and proximity to critical infrastructure, thereby facilitating efficient disaster management and rapid intervention.
This study determined suitable locations for emergency assembly points using MCDM and GIS analysis to provide safer residential, commercial, and industrial areas. Unlike current regulations that designate these areas based on predefined guidelines, this study presents a more data-driven and realistic approach to their selection. This methodology provides significant spatial decision support, particularly for local governments, disaster response units, and urban planners, ensuring that assembly areas are strategically located to enhance accessibility, safety, and infrastructure connectivity. Integrating such analyses into urban planning and the development of new settlements will offer valuable decision support to disaster management authorities, city planners, and administrators, ultimately contributing to the creation of safer communities and more resilient cities.
However, the study has certain limitations, primarily its reliance on available data and the inclusion of subjective assessments in some analyses. The model can be further improved by incorporating a broader range of criteria and expert opinions, making the decision-making process more comprehensive. Additionally, expanding the dataset and comparing different analytical methods could enhance the sensitivity and accuracy of the results, providing a more robust framework for future studies. Future research can build upon this study by integrating additional criteria and applying various MCDM techniques alongside advanced GIS analyses to further refine the methodology. The methodology used in this study can also be adapted to other facility location problems when the necessary criteria are met. It can be applied to the selection of critical locations, such as suitable hospital and school sites in newly planned urban areas. By doing so, this approach can support decision-makers in identifying essential locations for sustainable urban development and disaster management, contributing to the creation of more resilient and well-planned cities. Another strength of this study is that, although it was applied to a specific study area, it is designed to be adaptable to different regions, provided relevant data are available. The model’s flexibility allows for its implementation in various locations to identify suitable emergency assembly areas, making it a scalable and transferable framework for disaster preparedness planning.
