Abstract
The efficiency of wastewater treatment systems must be reflected in the removal of the pollutant load from the influent and the optimal energy performance of electrical equipment. Wastewater Treatment Plants (WWTPs) are part of the Intensive Energy Consumption Management System (SGCIE) and are therefore subject to mandatory energy audits. This article aims to assess the impact of an energy audit in a WWTP, according to ISO 50001:2018 and the Plan-Do-Check-Act (PDCA) methodology, to identify and quantify both persistent and transient energy inefficiencies. According to the results, the energy audit contributed to an approximate 10.8% reduction in electrical energy consumption. During the assessment, several challenges were identified that may compromise the effectiveness of audits in improving energy performance. The complexity of the treatment model, aging infrastructure and equipment, the lack of real-time data, and a limited number of indicators hinder the proper management of inefficiency phenomena, particularly transient ones.
1. Introduction
Despite the existence of some sustainable solutions focused on developing products with low greenhouse gas (GHG) emissions [1,2], there is still much to be done across various sectors.
In an increasingly urbanized society, wastewater treatment systems play a fundamental role in protecting the environment and preserving public health. However, Wastewater Treatment Plants (WWTPs) are considered intensive consumers of electrical energy. According to the International Energy Agency (IEA) [3], wastewater treatment consumed approximately 4% of global electricity in 2014, equivalent to 952.54 TWh. It is estimated that by 2040, due to population growth in major urban centers and the consequent expansion of treatment infrastructure, energy consumption will increase by 60% [4]. Nevertheless, despite the expected growth, a potential reduction in electricity consumption of approximately 15% is projected by 2040 [5].
Based on these projections, policymakers, water service managers, and researchers recognize the importance of studying the energy efficiency of these treatment systems to reverse the trend of increasing energy intensity, reduce operational costs, and ensure resource sustainability [6,7,8].
For the year 2030, the European Union (EU), through the new Energy Efficiency Directive (EU) 2023/1791 [9], a revision of Directive 2012/27/EU [10], set more ambitious targets for the entire European zone compared to the projections made in 2020. This new directive requires EU Member States to establish indicative national energy efficiency targets, aiming for a final energy consumption of 763 Mtoe for the EU. According to the Governance Regulation (EU) 2018/1999 [11], Eurozone countries must develop National Energy and Climate Plans (NECPs) for the period 2021–2030 and submit interim reports every two years. In Portugal, an EU Member State, Decree-Law No. 71/2008 [12] was published as a part of the National Energy Strategy, which regulates the Intensive Energy Consumption Management System (SGCIE) [13]. This decree was later amended by Law No. 7/2013 [14] and Decree-Law No. 68-A/2015 [15]. The SGCIE [13], the ISO 50001:2018 standard [16], and the Plan-Do-Check-Act (PDCA) methodology play an important role in improving an organization’s energy performance. The SGCIE [13], regulated by Decree-Law No. 71/2008 [14], requires that the managing entities of industrial units with intensive energy consumption develop Energy Rationalization Plans (PREs) and submit Execution and Progress Plans (REPs) to regulatory authorities. The ISO 50001:2018 [16] provides a structured framework for implementing an Energy Management System (EnMS), enabling managers to meet legal requirements and improve energy consumption in production units using the systematic PDCA methodology.
According to the literature [5,8,17,18,19,20,21,22], there are several gaps that warrant study and reflection. However, the scarcity of quantitative studies on the impact of the PDCA methodology, according to ISO 50001:2018 [16], in wastewater treatment systems hinders the understanding of the challenges related to data access, the limited number of Key Performance Indicators (KPIs), and the origins and consequences of energy inefficiency phenomena. Therefore, there is a need to assess the impact of energy audits based on this standard and methodology, thereby contributing to new insights on the topic in this sector.
Thus, this study aims to assess the impact of an energy audit in a WWTP located in northern Portugal, according to ISO 50001:2018 [16] and the PDCA methodology, to identify and quantify both persistent and transient energy inefficiencies. Throughout this assessment, the same PDCA methodology was followed, maintaining a structured and systematic approach aligned with the audit team, ensuring scientific validity and compliance with technical and legal requirements.
This research was based on the hypothesis that a structured and systematic approach, when properly implemented, should enable the identification and quantification of both persistent and transient energy inefficiencies. From a scientific perspective, this analysis aims to provide a rigorous quantitative assessment of an energy audit conducted at a WWTP in northern Portugal, within the context of legal obligations. Additionally, this paper sought to contribute to the decision-making processes of managers and policymakers.
In Section 2, the legal framework and the PDCA methodology used is presented. The description of the WWTP is covered in Section 3. Section 4 presents the data collection process. The discussion of the audit results are presented in Section 5. Section 6 outlines the measures to be implemented, and finally, the conclusions and future work are presented in Section 7.
2. Legal Framework and Plan-Do-Check-Act Methodology
This chapter addresses the essential aspects of the legal and methodological frameworks applicable to improving the energy performance of energy-intensive consumers, according to the ISO 50001:2018 [16] standard. Initially, Section 2.1 presents the current legislation applicable to WWTPs, as well as the description of the mandatory action plan aimed at promoting energy efficiency, in line with the SGCIE [13]. Subsequently, Section 2.2 describes the PDCA methodology as a systematic methodology for identifying and correcting inefficiency phenomena.
2.1. Legal Framework
Energy efficiency measures aim to achieve a sustainable energy supply, reduce GHG emissions, improve supply security, lower import bills, and foster national competitiveness. Taking into account the Sustainable Development Goals (SDGs) of the United Nations, in 2023, the European Commission decided to reduce the final energy consumption of production units by at least 11.7% by 2030, compared to the projections made in the previous decade. Based on Article 194 of the Treaty on the Functioning of the EU, the new Energy Efficiency Directive, which has been in force since October 2023 by (EU) 2023/1791 [9], sets more ambitious energy efficiency targets for the EU. In absolute terms, primary and final energy consumption should not exceed 992.5 and 763 Mtoe, respectively, by 2030. The directive requires European countries to set indicative national energy efficiency targets, based on their contributions to the final energy consumption, to meet the EU’s overall target. However, in the context of Portugal’s energy strategy, Decree-Law No. 71/2008 [12], which regulates the SGCIE [13], was published on 15 April 2008. This legislation was amended by Law No. 7/2013 [14] from 22 January 2013, and by Decree-Law No. 68-A/2015 [15] of 30 April 2015. This management system applies to facilities with an energy consumption equal to or exceeding 500 toe/year, resulting from the revision of the Energy Consumption Management Regulation, which is one of the measures of the National Action Plan on Energy Efficiency.
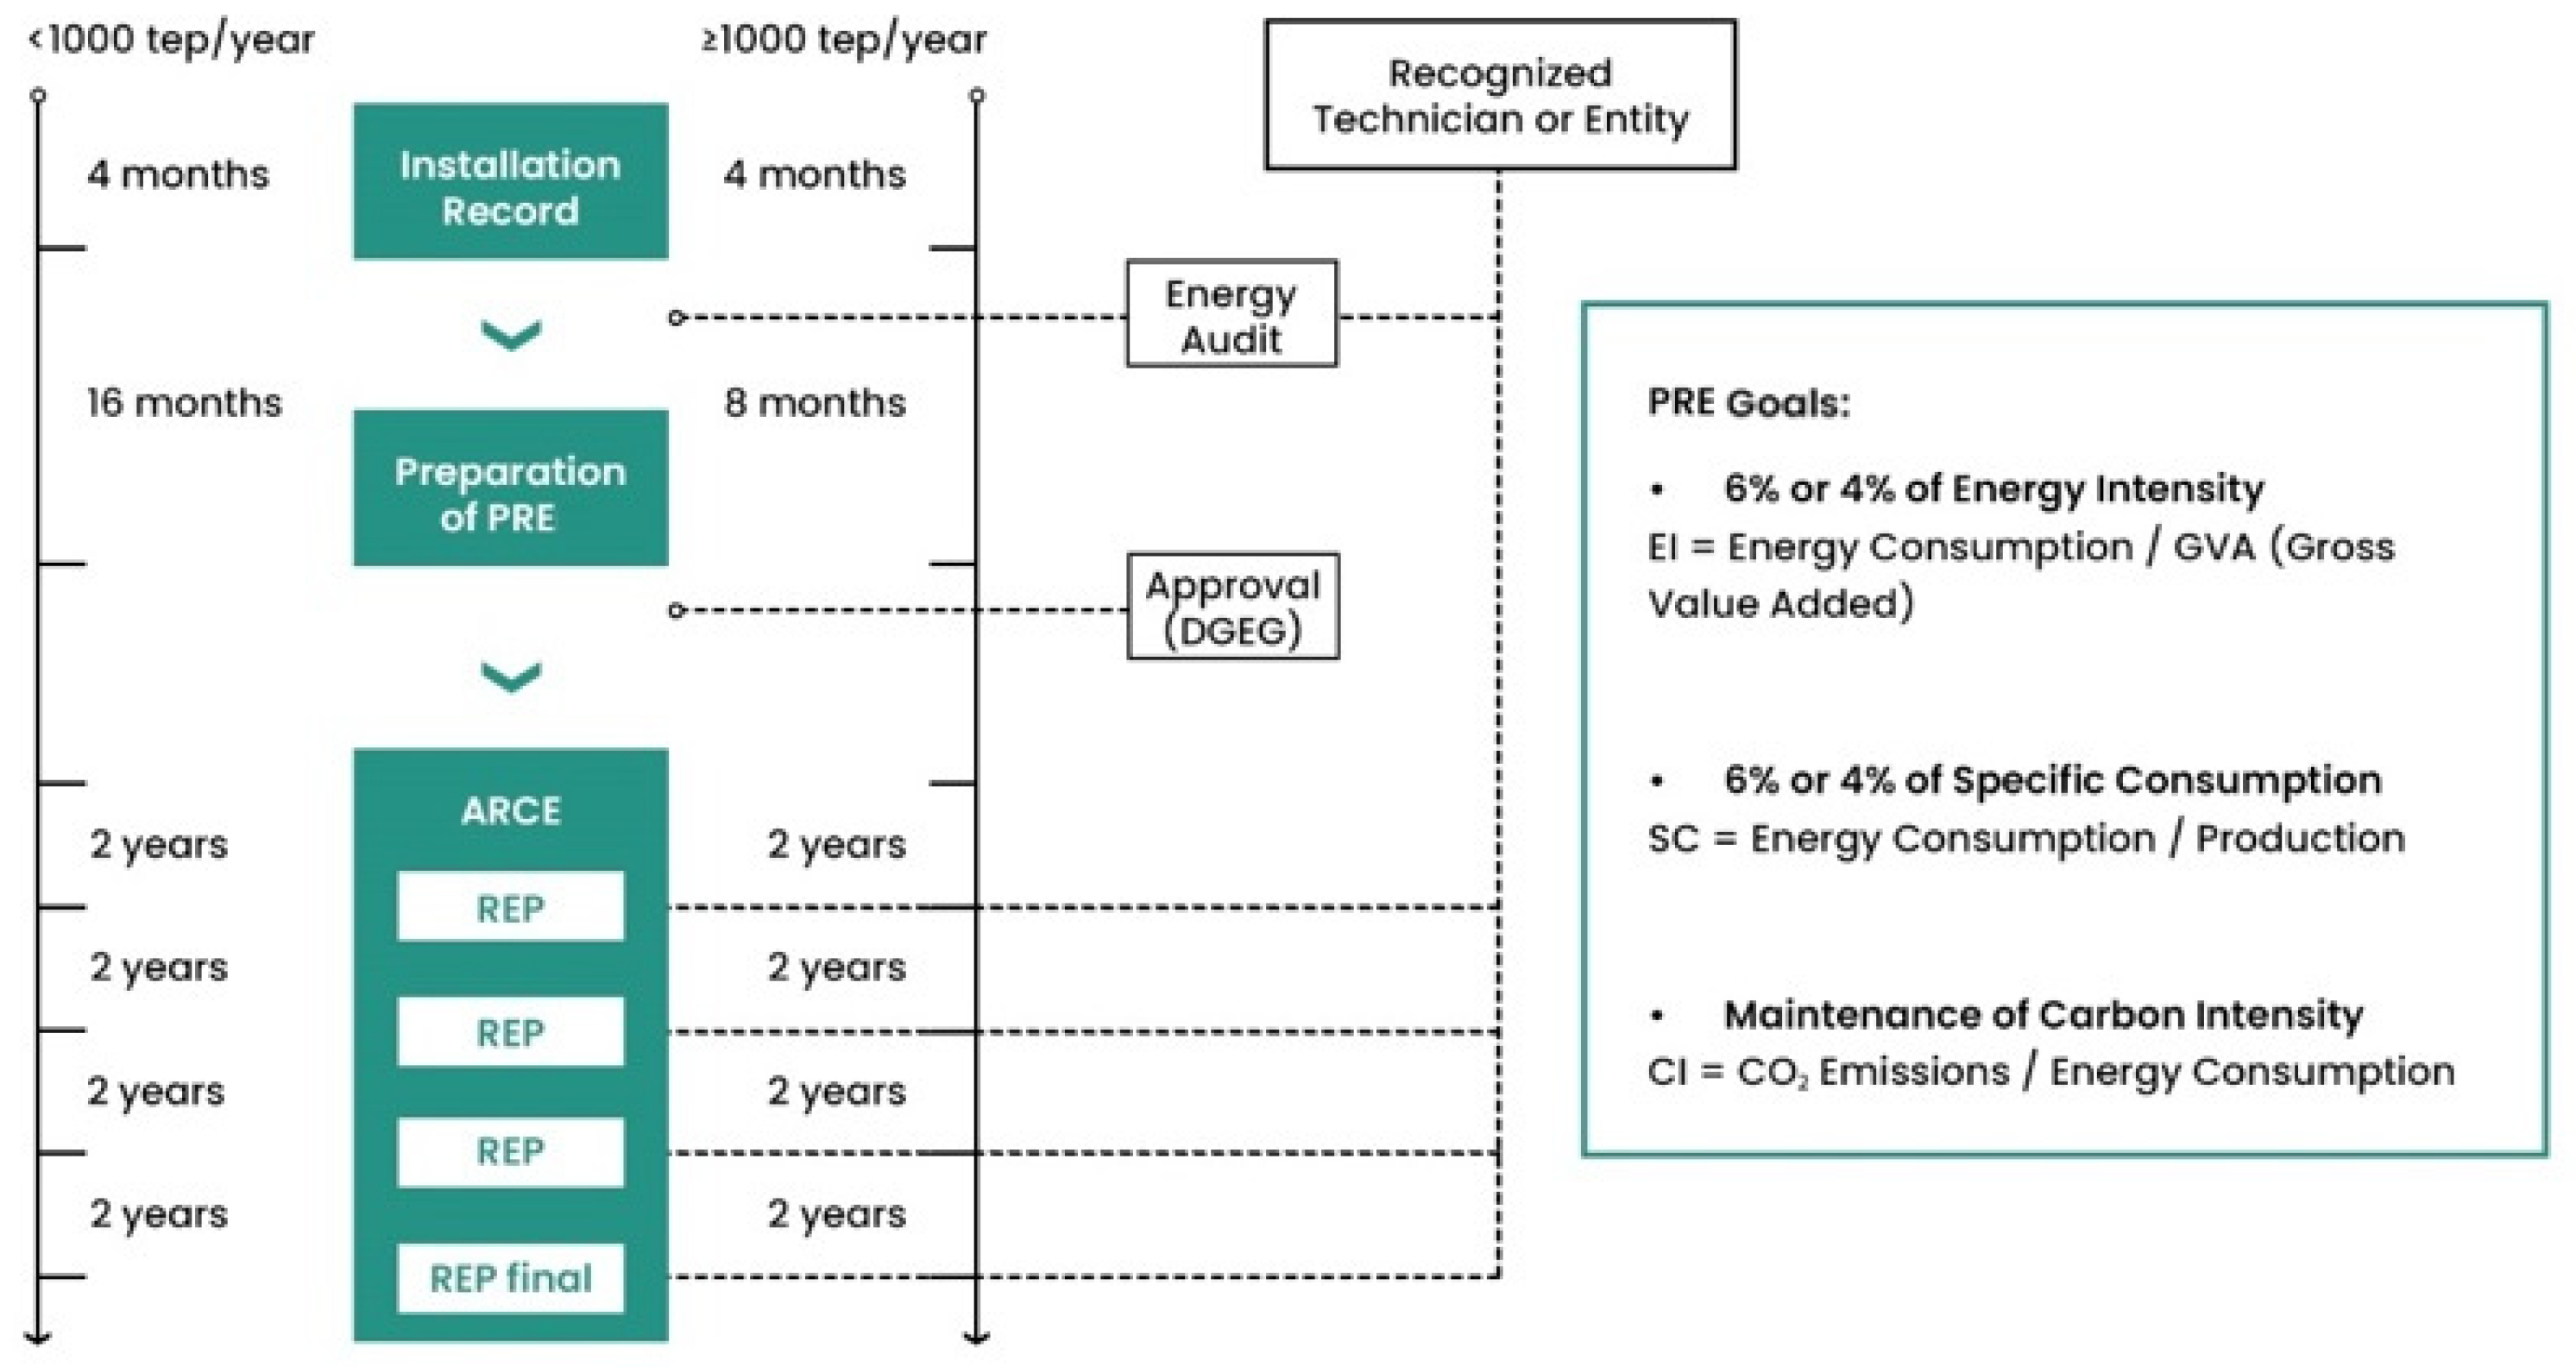
Given that the entities managing water treatment systems, which are intensive energy consumers, are integrated into the SGCIE [13], periodic energy audits that focus on energy use conditions are required to improve energy performance, considering, whenever possible, the use of renewable energy sources. According to Figure 1, the SGCIE [13] also includes the requirement to develop PREs that establish minimum energy efficiency objectives. Once approved, the PREs led to the creation of the ARCE, signed by the General Directorate of Energy and Geology (DGEG), linking their implementation to the receipt of incentives for entities managing water treatment infrastructure.

Figure 1.
SGCIE execution schedule [23].
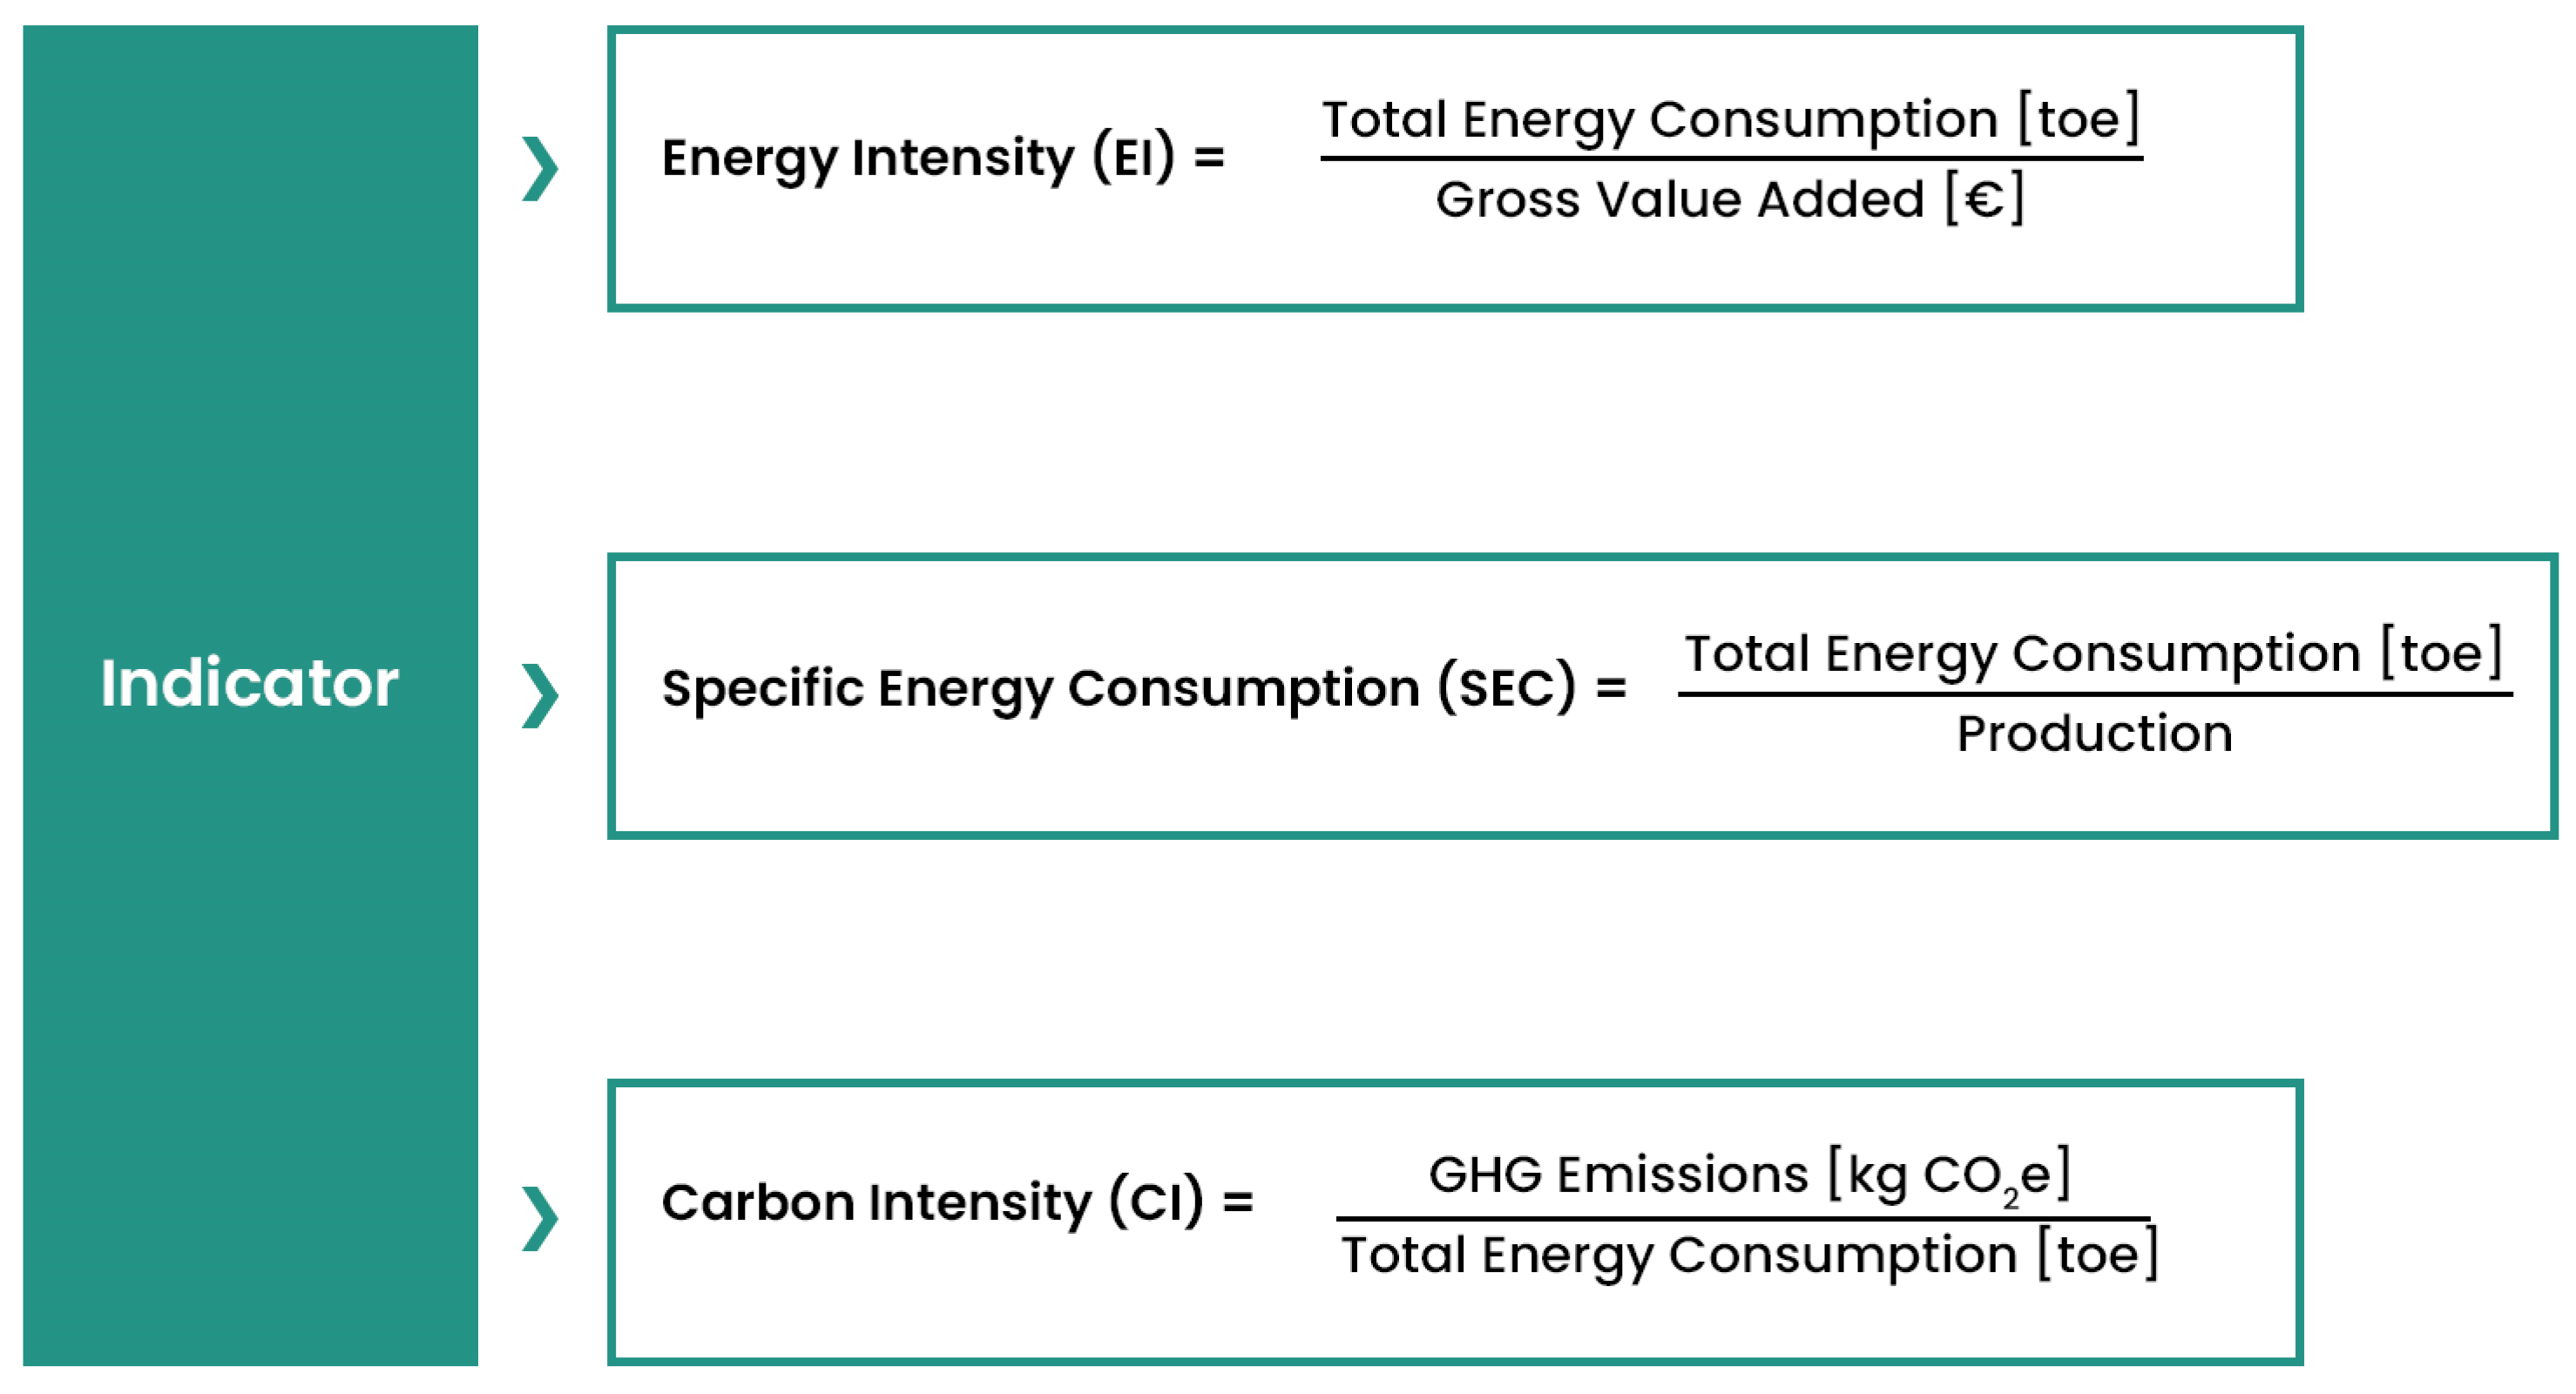
The PREs, based on reports from mandatory energy audits, must consider the implementation, within the first three years, of all the identified measures with a payback period of five years or less for facilities with an energy consumption of 1000 toe/year or more, or three years or less for other facilities. Based on Figure 2, the Energy Consumption Rationalization Plan must also establish goals related to Energy Intensity (EI), Specific Energy Consumption (SEC), and Carbon Intensity (CI), where applicable, according to the following indicators. Directive (EU) 2023/1791 [9] also establishes information reporting obligations for data centers and specific one-stop shops for small and medium-sized enterprises within a legal framework.
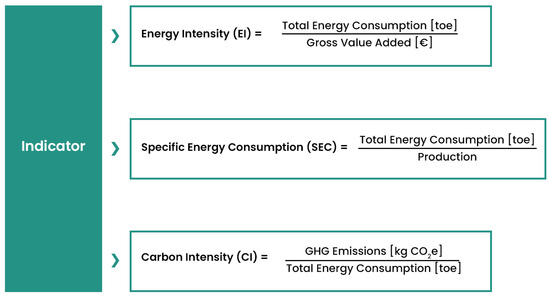
Figure 2.
Energy indicators [23].
2.2. PDCA Methodology
Water treatment system management entities, after the registration of facilities on the official platform, must engage a recognized technician to perform an energy audit and the corresponding PREs in line with the objectives outlined in the context of energy efficiency. The energy audit, according to Ordinance No. 17449/2008 [24] dated 27 June, consists of a detailed assessment of all aspects related to energy use, with the aim of providing an energy characterization of the different equipment and systems associated with the industrial unit, as well as identifying technically and economically viable measures to improve the energy performance of the facility.
In the context of ISO 50001:2018 [16], an energy audit is a systematic and independent methodology that evaluates the compliance and effectiveness of the EnMS, which comprises processes and practices aimed at managing and improving the energy performance of organizations. Therefore, the energy audit should focus on the design and condition of the facilities, data collection, planning of the EnMS and its energy processes, improving energy performance, meeting legal and other requirements, and achieving energy objectives and SDGs 6 (Clean Water and Sanitation), 7 (Affordable and Clean Energy), 9 (Industry, Innovation, and Infrastructure), 11 (Sustainable Cities and Communities), 12 (Responsible Consumption and Production), and 13 (Climate Action), specific to this sector.
The Plan-Do-Check-Act methodology can be described by the following steps:
- (a)
- Audit Planning: The purpose of this document is to define the scope and objectives of the audit as well as to ensure the availability of the necessary resources [16]. Two important aspects to consider are the selection of the team from a holistic perspective of different areas of expertise and the execution schedule of the task to implement the methodology.
- (b)
- Data Collection: This involves the analysis of documentation, inspection on site, interviews, and data collection using appropriate equipment [16]. For an accurate assessment of the facility’s energy performance, it is important to understand the objectives and dynamics of the production system, the role of the operational personnel, and how energy is used.
- (c)
- Data Observation: Data processing and analysis aim to identify operational patterns for comparison with reference values, energy inefficiencies, and opportunities for improvement [16].
- (d)
- Energy Audit Report: In addition to fulfilling the legal obligations imposed by Decree-Law No. 71/2008 [12], this document also aims to report on the conditions of energy use in the industrial facility and to promote the presentation of a PRE. This plan should set targets related to energy and carbon intensity as well as the specific energy consumption of the facility [13].
- (e)
- Implementation of Improvement Actions: Monitoring the obligations outlined in the PREs, in agreement with the DGEG, is carried out through four REPs submitted every 2 years during the agreement’s term, reporting the implementation status of the measures over the assumed period [13,16]. During this period, continuous monitoring of the facilities should ensure that improvement actions are maintained and new opportunities are identified.
These steps, when properly implemented, ensure that the energy audit is conducted in a structured and efficient manner, allowing the organization to systematically identify and implement improvements in energy efficiency.
3. Wastewater Treatment Plant Description
The management of this wastewater treatment system, located in northern Portugal, which includes the audited WWTP, has been the responsibility of a concessionaire entity since 1998. Under a concession contract with five Portuguese municipalities the facility serves a population of 388,273 domestic inhabitants.
Initially, the original WWTP, designated as Phase I, was equipped with a tertiary treatment system. It had the capacity to serve a Population Equivalent (PE) of 100,800 inhabitants with an average flow rate of 15,120 m3/day and a Biochemical Oxygen Demand over 5 days (BOD5) of 5009 kg/day. Later, its treatment capacity was increased by the construction of a new line, referred to as Phase II, located northwest of the original. Phase II, covering approximately 5 hectares, is also capable of tertiary treatment. The new line has the capacity to treat the influent from a total population of approximately 170,513 PE, with an average flow rate of 25,577 m3/day and a BOD5 load of 10,017 kg/day. Currently, the two lines occupy a total area of 7 hectares. By 2033, the managing entity expects to serve an equivalent population of 361,096 inhabitants.
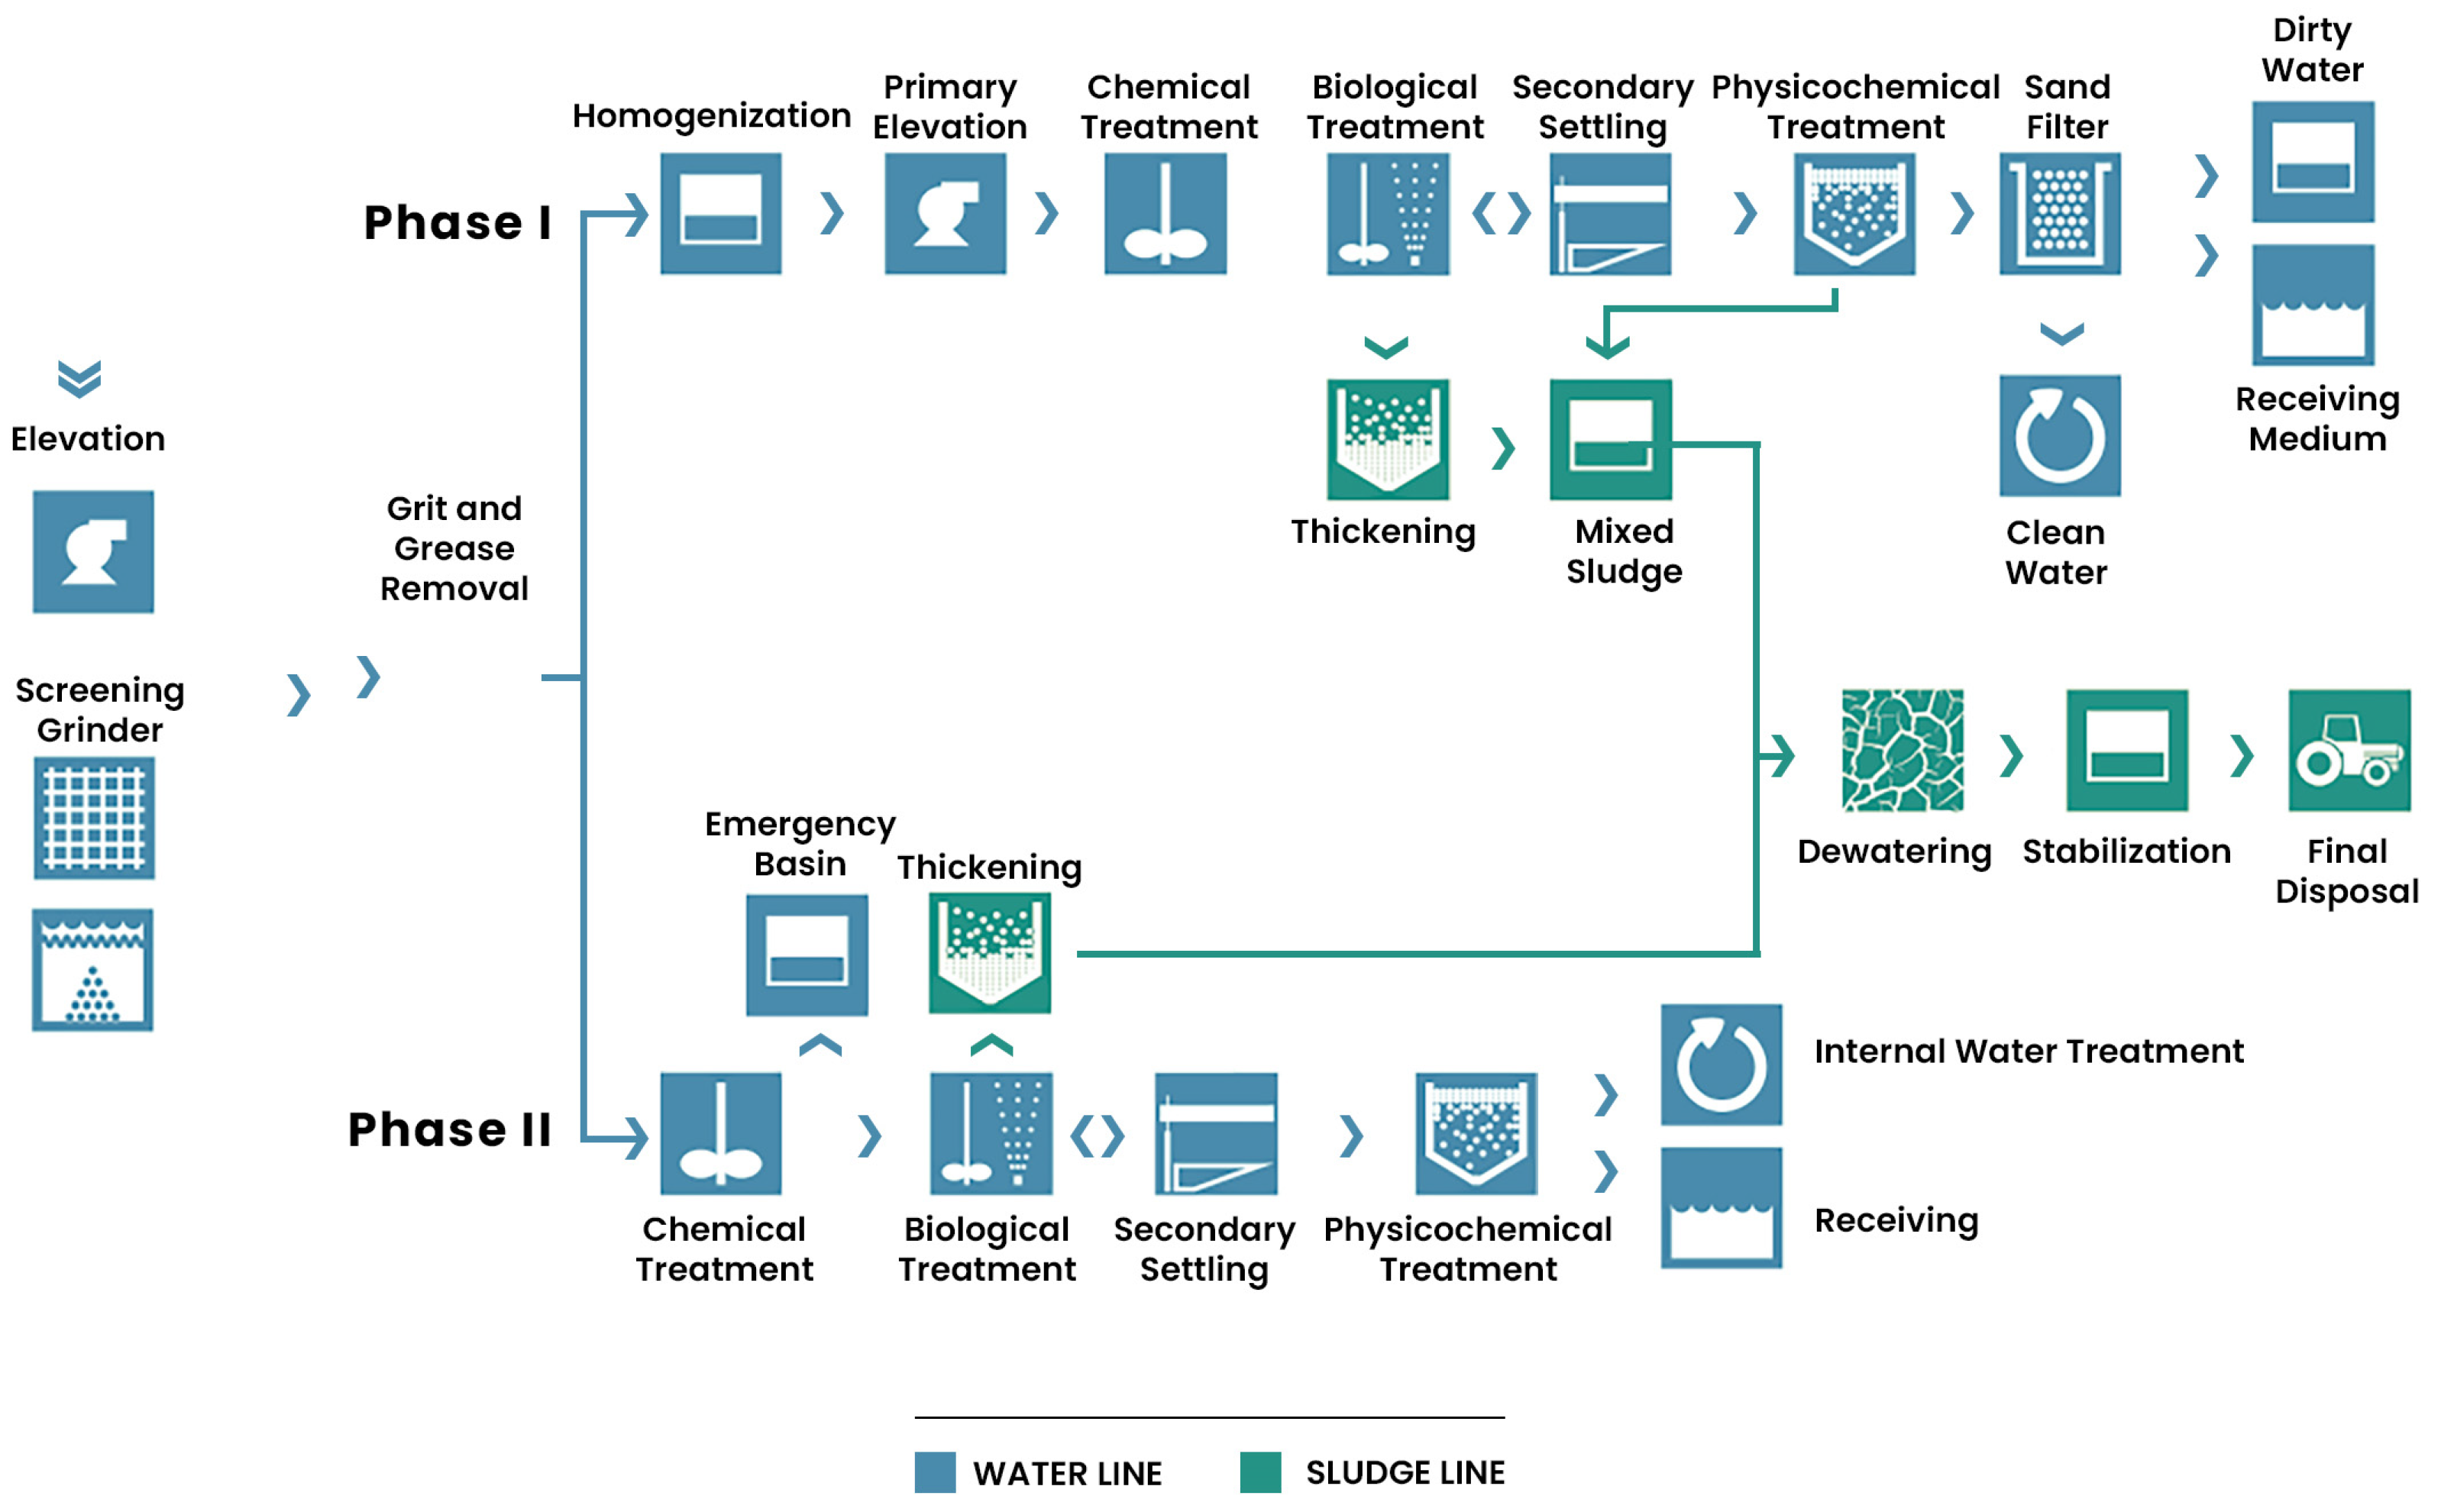
According to Figure 3, the raw influent to be treated in the WWTP is directed by gravity to the input chamber. The total elevation of the influent is achieved using Archimedes screws, which operate at variable speeds in two stages. After elevation, the influent is conveyed through channels equipped with manually cleaned screens with 40 mm thickness and a rotary drum screen with a mesh of 5 mm. The grease and grit removal unit consists of two lines of bottom diffusers for air injection, facilitating the flotation of grease and the washing of grit. It is equipped with movable bridges and surface scrapers for grease removal as well as bottom scrapers for grit removal. In the same unit, the dewatering of the removed residues is carried out in the grit classifier and grease concentrator. After the previous stages, the flows are directed by gravity to Phase I and Phase II. At this stage, the flow rate sent to each line is measured using an electromagnetic flowmeter.

Figure 3.
Treatment layout of the audited WWTP [25].
Section 3.1 and Section 3.2 describe the two treatment lines corresponding to Phase I and Phase II.
3.1. Phase I
3.1.1. Description of the Liquid Phase Treatment
As illustrated in Figure 3, the effluent is directed to two homogenization basins. These units are designed to equalize hydraulic loads and pollutants as well as to buffer peak flows. This is achieved using aerators and submersible agitators. The flow is then directed by gravity to the intermediate lift station, where five submersible pump groups are employed to ensure a constant flow rate during the subsequent treatment stages. CO2 is added for pH correction. In the neutralization basin, equipped with an electrical agitator, the pH is monitored, and a coagulant is added to remove the color.
After leaving the neutralization basin, the flow is distributed among four aeration basins, each equipped with six turbines to ensure proper oxygen injection. In these units, an aerobic biological treatment of the influent is performed. For each treatment line, there is a cylindrical–conical vertical flow clarifier, equipped with a scraper bridge, where secondary sedimentation occurs and separation between the treated effluent and biomass is carried out.
The biomass is then returned to the corresponding aeration basin via the recirculation system. For the physicochemical treatment, there are two coagulation/flocculation units, consisting of one rapid mixing chamber, two slow mixing chambers, a flotation unit, and a device for scraping the floated surface sludge. The effluent filtering is performed by gravity through three sand filters. Finally, the effluent is discharged into the receiving medium, the river.
3.1.2. Description of the Solid Phase Treatment
In the solid phase treatment, shown in Figure 3, the secondary sludge is directed to the flotation/thickening unit for thickening and then transferred to the mixed sludge basin. In this unit, sludges from different sources (secondary and chemical sludge) are mixed with the aid of an electrical agitator. The sludge is then directed to the dewatering stage of Phase II.
3.2. Phase II
3.2.1. Description of the Liquid Phase Treatment
As shown in Figure 3, the neutralization basin is equipped with two electrical agitators that ensure the stirring and mixing of the influent with the chemical sludges generated in the tertiary treatment. At the bottom of the basin, automatic injections of CO2 are performed through diffuser grids to adjust the pH. Subsequently, the influent is directed to biological treatment, and it may occasionally be diverted to the emergency basin. At the outlet of the neutralization basin, a distribution chamber splits the flow between two biological reactors, which then convey the influent to the contact basins. In these basins, a fraction of the recirculated sludge is mixed with the influent. This unit facilitates biological treatment under aerobic and anoxic conditions. Each ditch is equipped with a compressed air injection system that uses fine bubble diffusers, which ensure the necessary introduction of oxygen, as well as frequency inverters. Aeration in only two areas of the ditches creates aerated and anoxic zones, promoting the respective biological processes. The unit also includes four submersible agitators in the non-aerated areas which keep the biomass in suspension, improve contact with the pollutant load, and ensure effluent flow. A coagulant is added for the removal of the color. Each treatment line features two cylindrical conical vertical flow clarifiers, equipped with bottom and surface scraper bridges, a scum collection box, and a deflector upstream of the discharge line. In these treatment units, the treated effluent and biomass are separated, and the biomass is subsequently recirculated to the respective biological reactor. The scum is directed to the drainage line and returned to the inlet box. The physicochemical treatment consists of two coagulation/flocculation units, each comprising one rapid mixing chamber and two slow mixing chambers, followed by lamellar settling. After lamellar settling, the effluent passes through the reused treated water well and is gravity fed to the water line.
3.2.2. Description of the Solid Phase Treatment
As shown in Figure 3, the secondary sludge is sent to the thickening tables, where a polyelectrolyte is injected into the liquid stream. At this stage, the water contained in the sludge is eliminated as much as possible by centrifuge dehydration, with the aid of the polyelectrolyte, and then sent for storage in silos. The chemical stabilization of the sludge is achieved by adding quicklime.
4. Data Collection
Section 4 covers the collection and calculation of the necessary data, according to the criteria defined in ISO 50001:2018 [16]. In Section 4.1, the general data are presented, followed by the electricity consumption data in Section 4.2. Section 4.3 is dedicated to the production data. These data were used in the calculation of performance indicators, presented in Section 4.4, and in the preparation of the energy balance, described in Section 4.5. This balance provides an overview of the energy performance segmented by treatment stages.
4.1. General Data
The WWTP is powered exclusively by electricity supplied from the power distribution grid. The facility receives energy at medium voltage (15 kV) and has its own Transformer Substation to ensure the necessary supply. Currently, the WWTP has a contracted power capacity of 1860 kVA, a four-period time-of-use energy tariff, and a weekly billing cycle, and the contract is negotiated in the free market. The lighting systems should be as follows: the exterior lighting was optimized in 2017 with LED technology, and the interior lighting of the buildings is tubular fluorescent type (residual use), except for the Headquarters building, which has been undergoing optimization. Regarding the climate control system, there are several mono-split units, used both for cooling the Headquarters building and for cooling the electrical panel rooms, which are also subject to improvements. Concerning the compressed air equipment, which is used to operate valves and flotation systems, the energy consumption is relatively minor and is subject to periodic inspection and maintenance to detect air leaks [25].
4.2. Energy Consumption
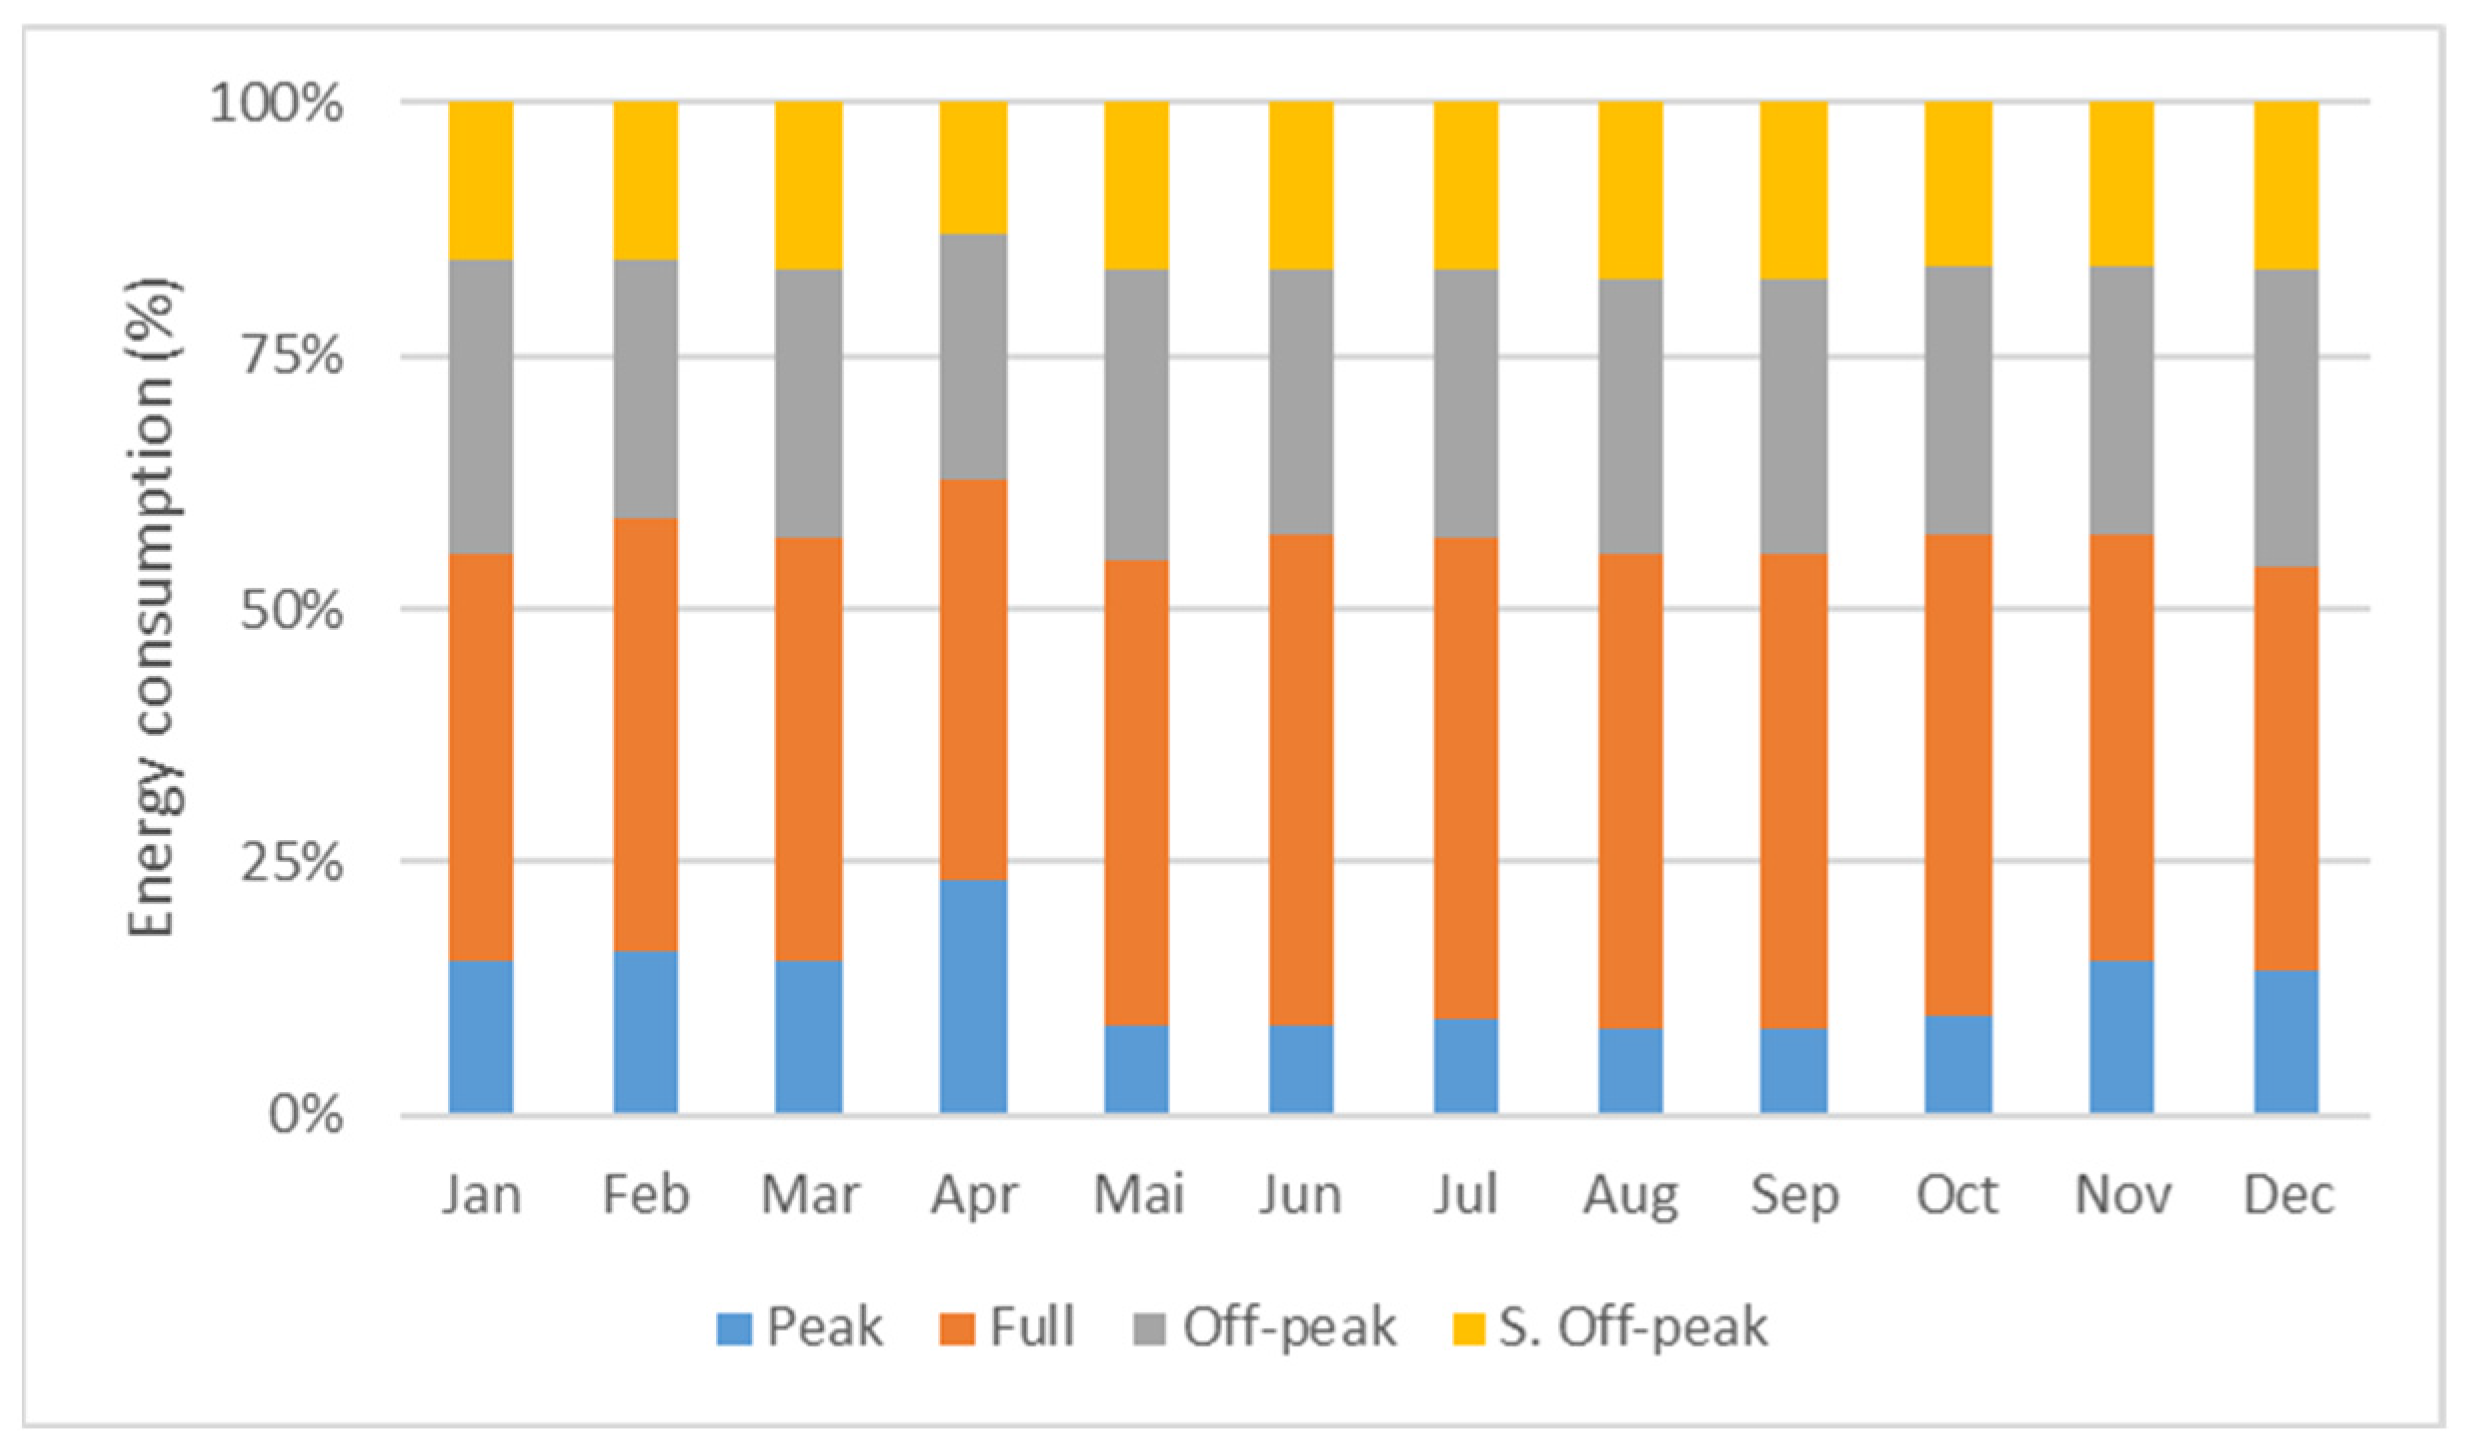
Based on the annual consumption values provided by the WWTP managers, which are presented in Figure 4, the energy consumption is distributed across the four periods, with a weighted average cost of 0.1922 €/kWh. Given the significant share of consumption during higher cost (peak and full), efforts should be made to shift the usage to lower cost periods to optimize expenses [25].
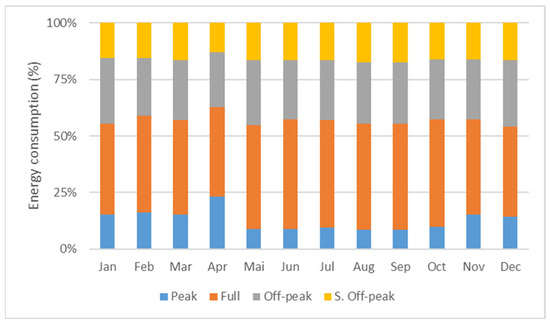
Figure 4.
Weighting of energy consumption by billing periods [25].
With an electrical energy consumption of 8,097,177 kWh/year (with the corresponding total annual cost of 757,883.00 €) and according to the factors published in Orde No. 17313/2008 [26], issued on 26 June, the facility consumed approximately 1741 toe of primary energy during the reference period [25]. As a result, it is considered an energy-intensive consumer and is therefore subject to the SGCIE [13] regulations.
4.3. Production
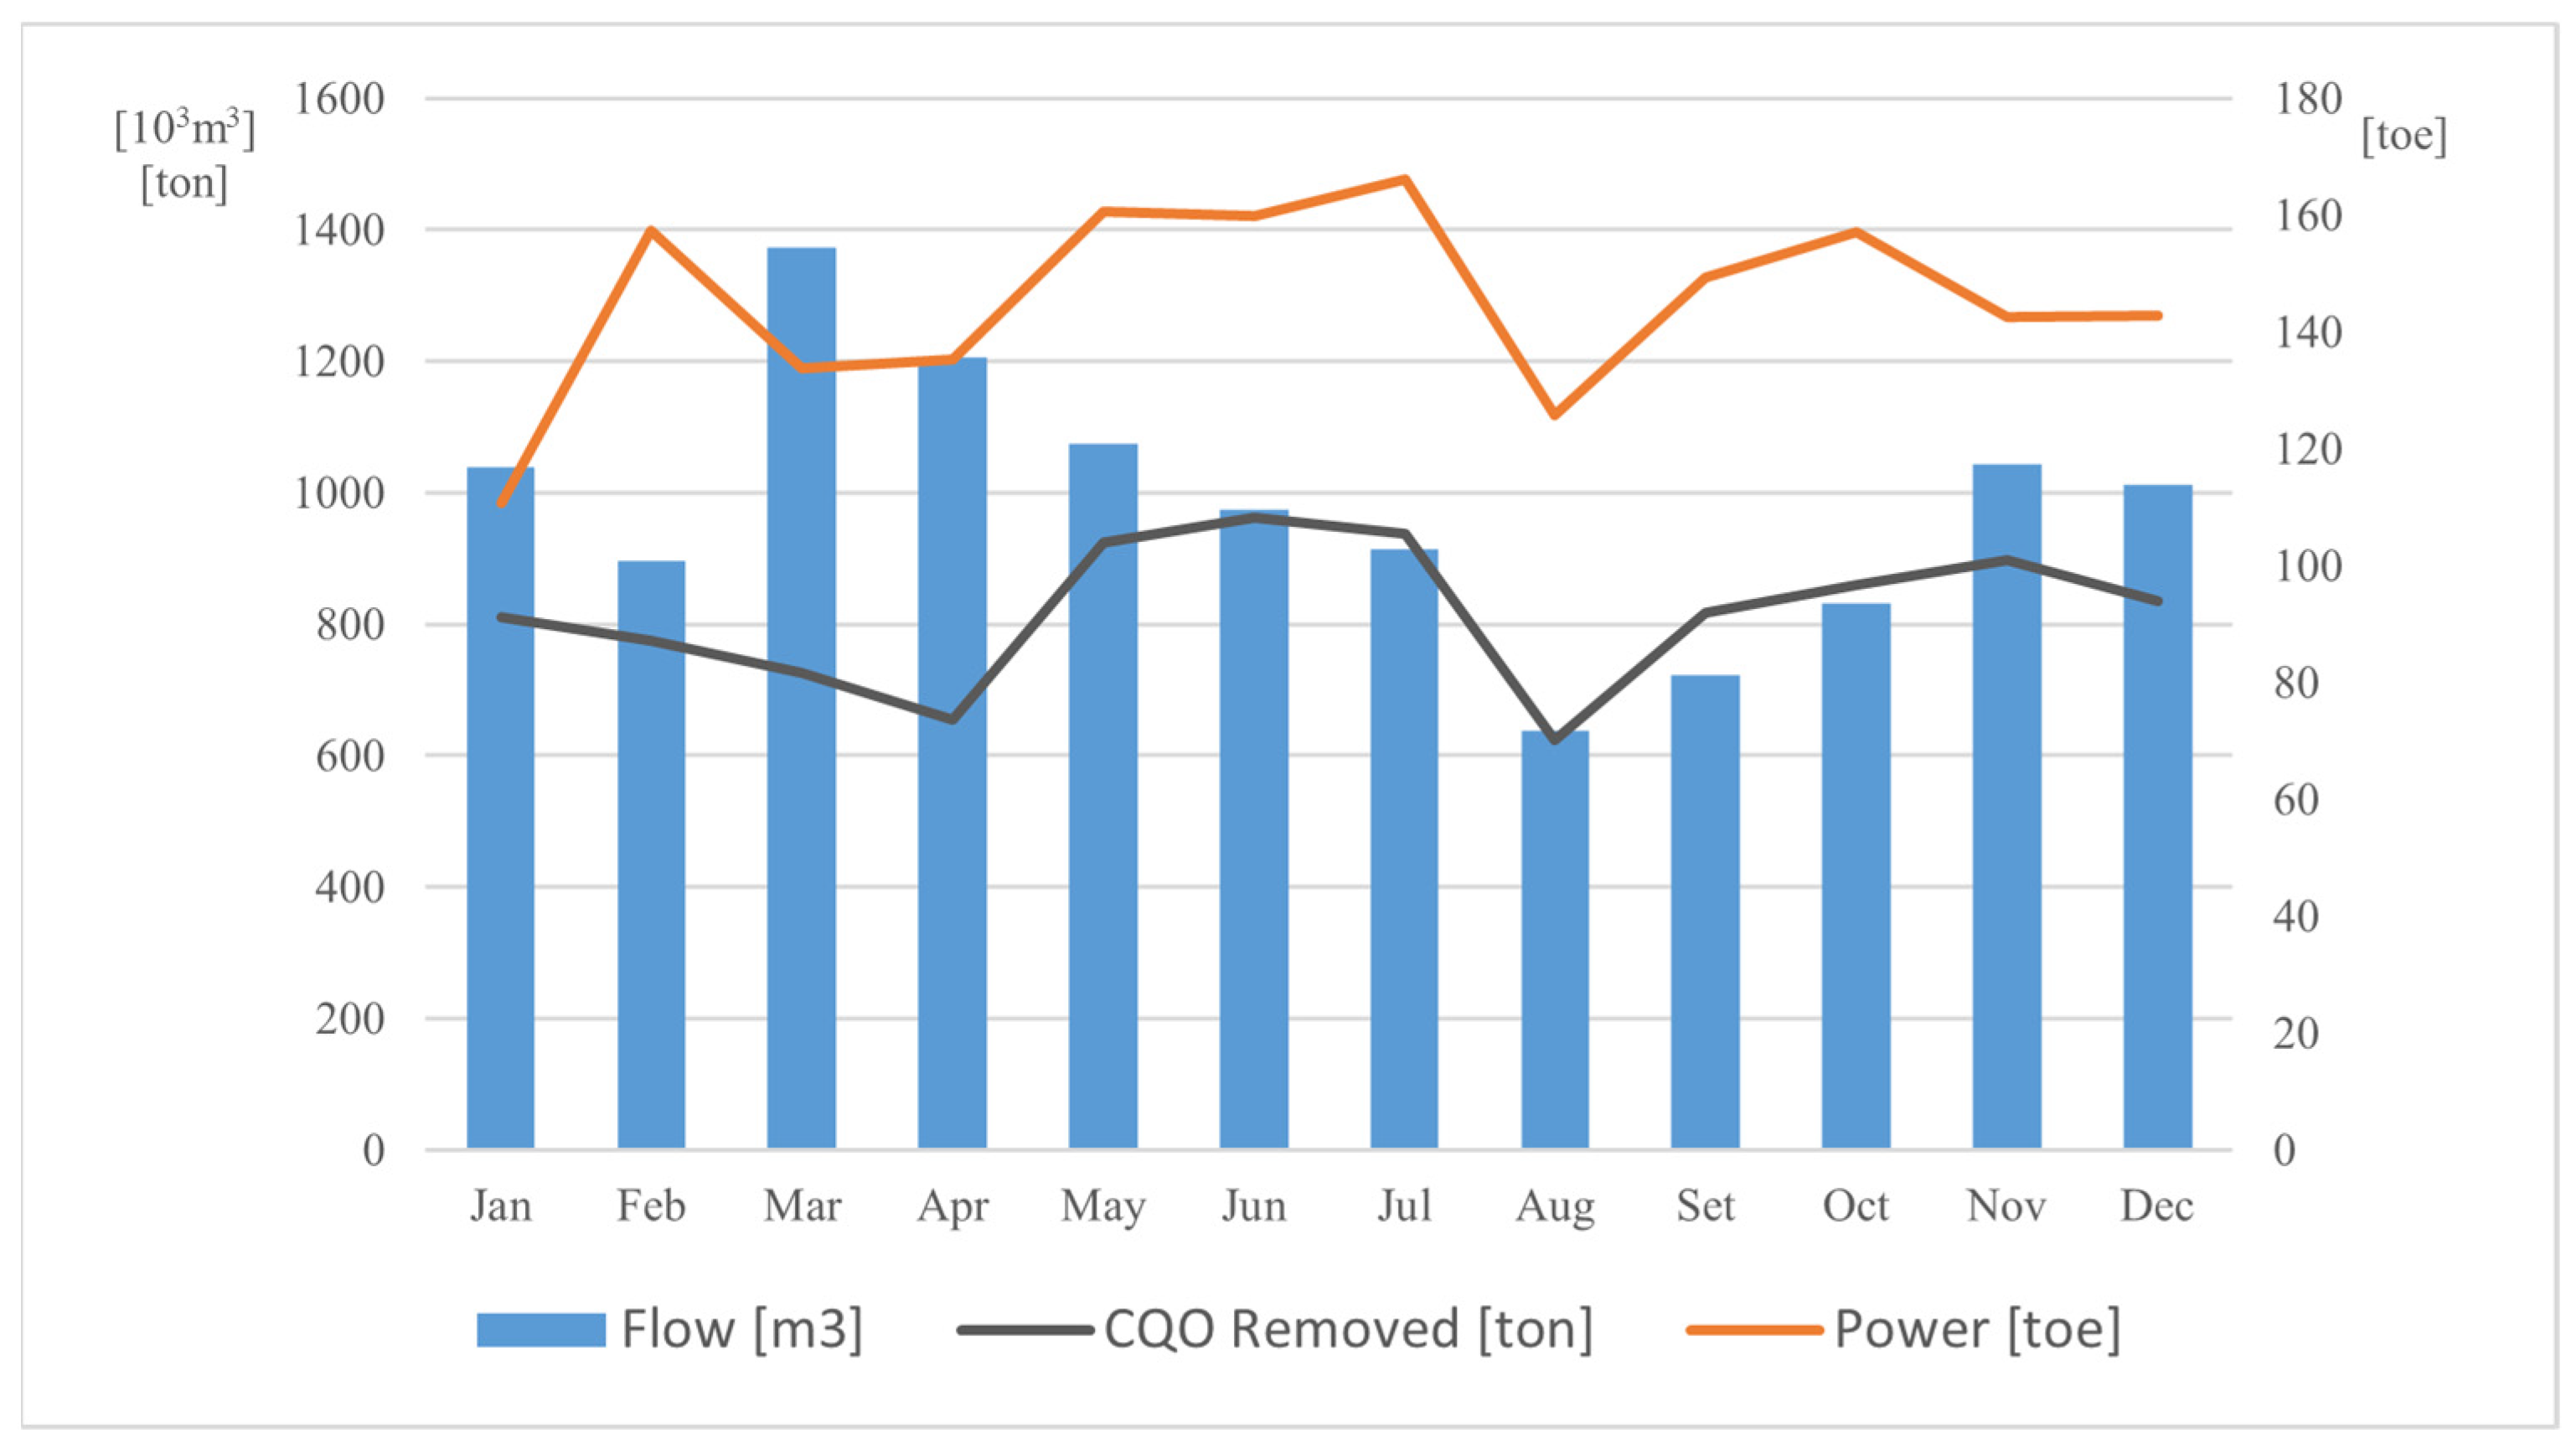
Specific electricity consumption varies depending on the volume and amount of organic matter present in the inflow to the WWTP. The Chemical Oxygen Demand (COD) is a parameter used in wastewater treatment systems to measure the amount of organic matter and oxidizable inorganic matter present in a water sample. An increase in flow does not necessarily imply an increase in the COD but rather depends on the source of the influent. Three possible scenarios can be identified from the obtained data: an increase in flow with a decrease in the COD, resulting from the connection of sewer networks to stormwater networks; an increase in flow with a constant the COD, when the influent has consistent characteristics; and an increase in flow with an increase in the COD, when activity peaks occur in industrial or residential facilities. In our case study and according to the values provided by the WWTP management entity [25], it is possible to identify these three scenarios, as shown in Figure 5. This analysis highlights, on one hand, the importance of separating wastewater networks from stormwater networks and, on the other hand, the added value of predicting occurrences that, due to variations in flow or the COD, may compromise the energy efficiency of the WWTP.
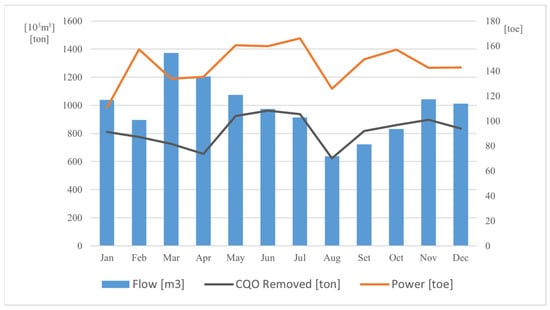
Figure 5.
Monthly evolution of production and energy consumption during the reference period [25].
4.4. Performance Indicators
In Table 1, Table 2 and Table 3, the performance indicators Energy Intensity, Specific Energy Consumption, and Carbon Intensity of the wastewater treatment plant are presented for the reference year.

Table 1.
Energy Intensity indicator [25].
Table 2.
Specific Energy Consumption indicator [25].
Table 3.
Carbon Intensity indicator [25].
4.5. Energy Balance
Based on various factors, such as the load of pollutants, the equivalent population, and the quality of the treated water, wastewater can undergo four stages of treatment: primary, secondary, tertiary, and sludge treatment [5,27,28,29]. The treatment is responsible for 70% of the total electrical energy consumption of the WWTP [30,31]. According to the literature, the pumping system in the preliminary and primary treatment stages (screening, grit removal, and primary sedimentation phases) requires significant energy consumption, accounting for approximately 10–15% [5,28]. Aeration in the biological treatment stage represents the most energy-intensive process, accounting for between 40% and 75% [5,32]. The high consumption of electrical energy is due to the need to use high-power and high-consumption equipment to ensure adequate levels of dissolved oxygen in the basins, which is essential for the degradation of the organic matter by microorganisms. In the tertiary treatment stage, the energy consumption depends on technologies such as filtration, disinfection, and advanced nutrient removal. The associated electrical energy consumption ranges from 10% to 20% [5]. Sludge treatment is the second largest energy consumer in the wastewater treatment process. The different stages, such as thickening, anaerobic digestion, dewatering, and incineration or drying of the sludge, consume between 10% and 25% [5,33]. Finally, auxiliary systems such as pumping, lighting, and heating, ventilation, and air conditioning (HVAC) are an energy consumer of 5–10% [28].
During the calculation of the Energy Balance, presented in Figure 6, the operating hours recorded and the information obtained through the monitoring carried out during the on-site measurement period by the audit team were considered. According to the auditors, the results revealed a significant discrepancy between the consumption data recorded in the Supervisory Control and Data Acquisition (SCADA) system and the actual consumption of the equipment, which was determined through direct measurements using a power quality analyzer during the energy audit [25].
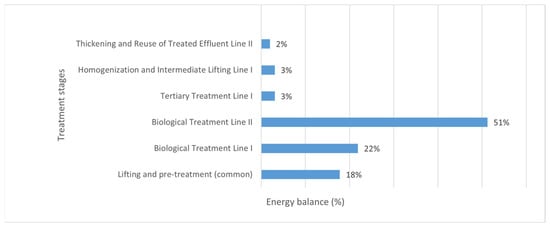
Figure 6.
Energy balance [25].
5. Audit Results and Discussion
This section presents the results and discussion of the opportunities and challenges identified within the scope of the WWTP’s energy audit, according to the PDCA methodology of ISO 50001:2018 [16]. Section 5.1 addresses the quality of the electrical energy consumed. Section 5.2 and Section 5.3 present the evaluation of the initial pumping station and the intermediate pumping station integrated into Phase I. Section 5.4 and Section 5.5 present and discuss the results related to the biological treatment aeration systems in Phases I and II, respectively. The results for the evaluation of the sludge recirculation pumping station for Phase I, the excess sludge pumping station for Phase II, and the sludge recirculation pumping station for Phase II, are presented and discussed in Section 5.6, Section 5.7, and Section 5.8, respectively. Finally, in Section 5.9, a proposal for a study on the integration of alternative energies is presented.
5.1. Power Quality
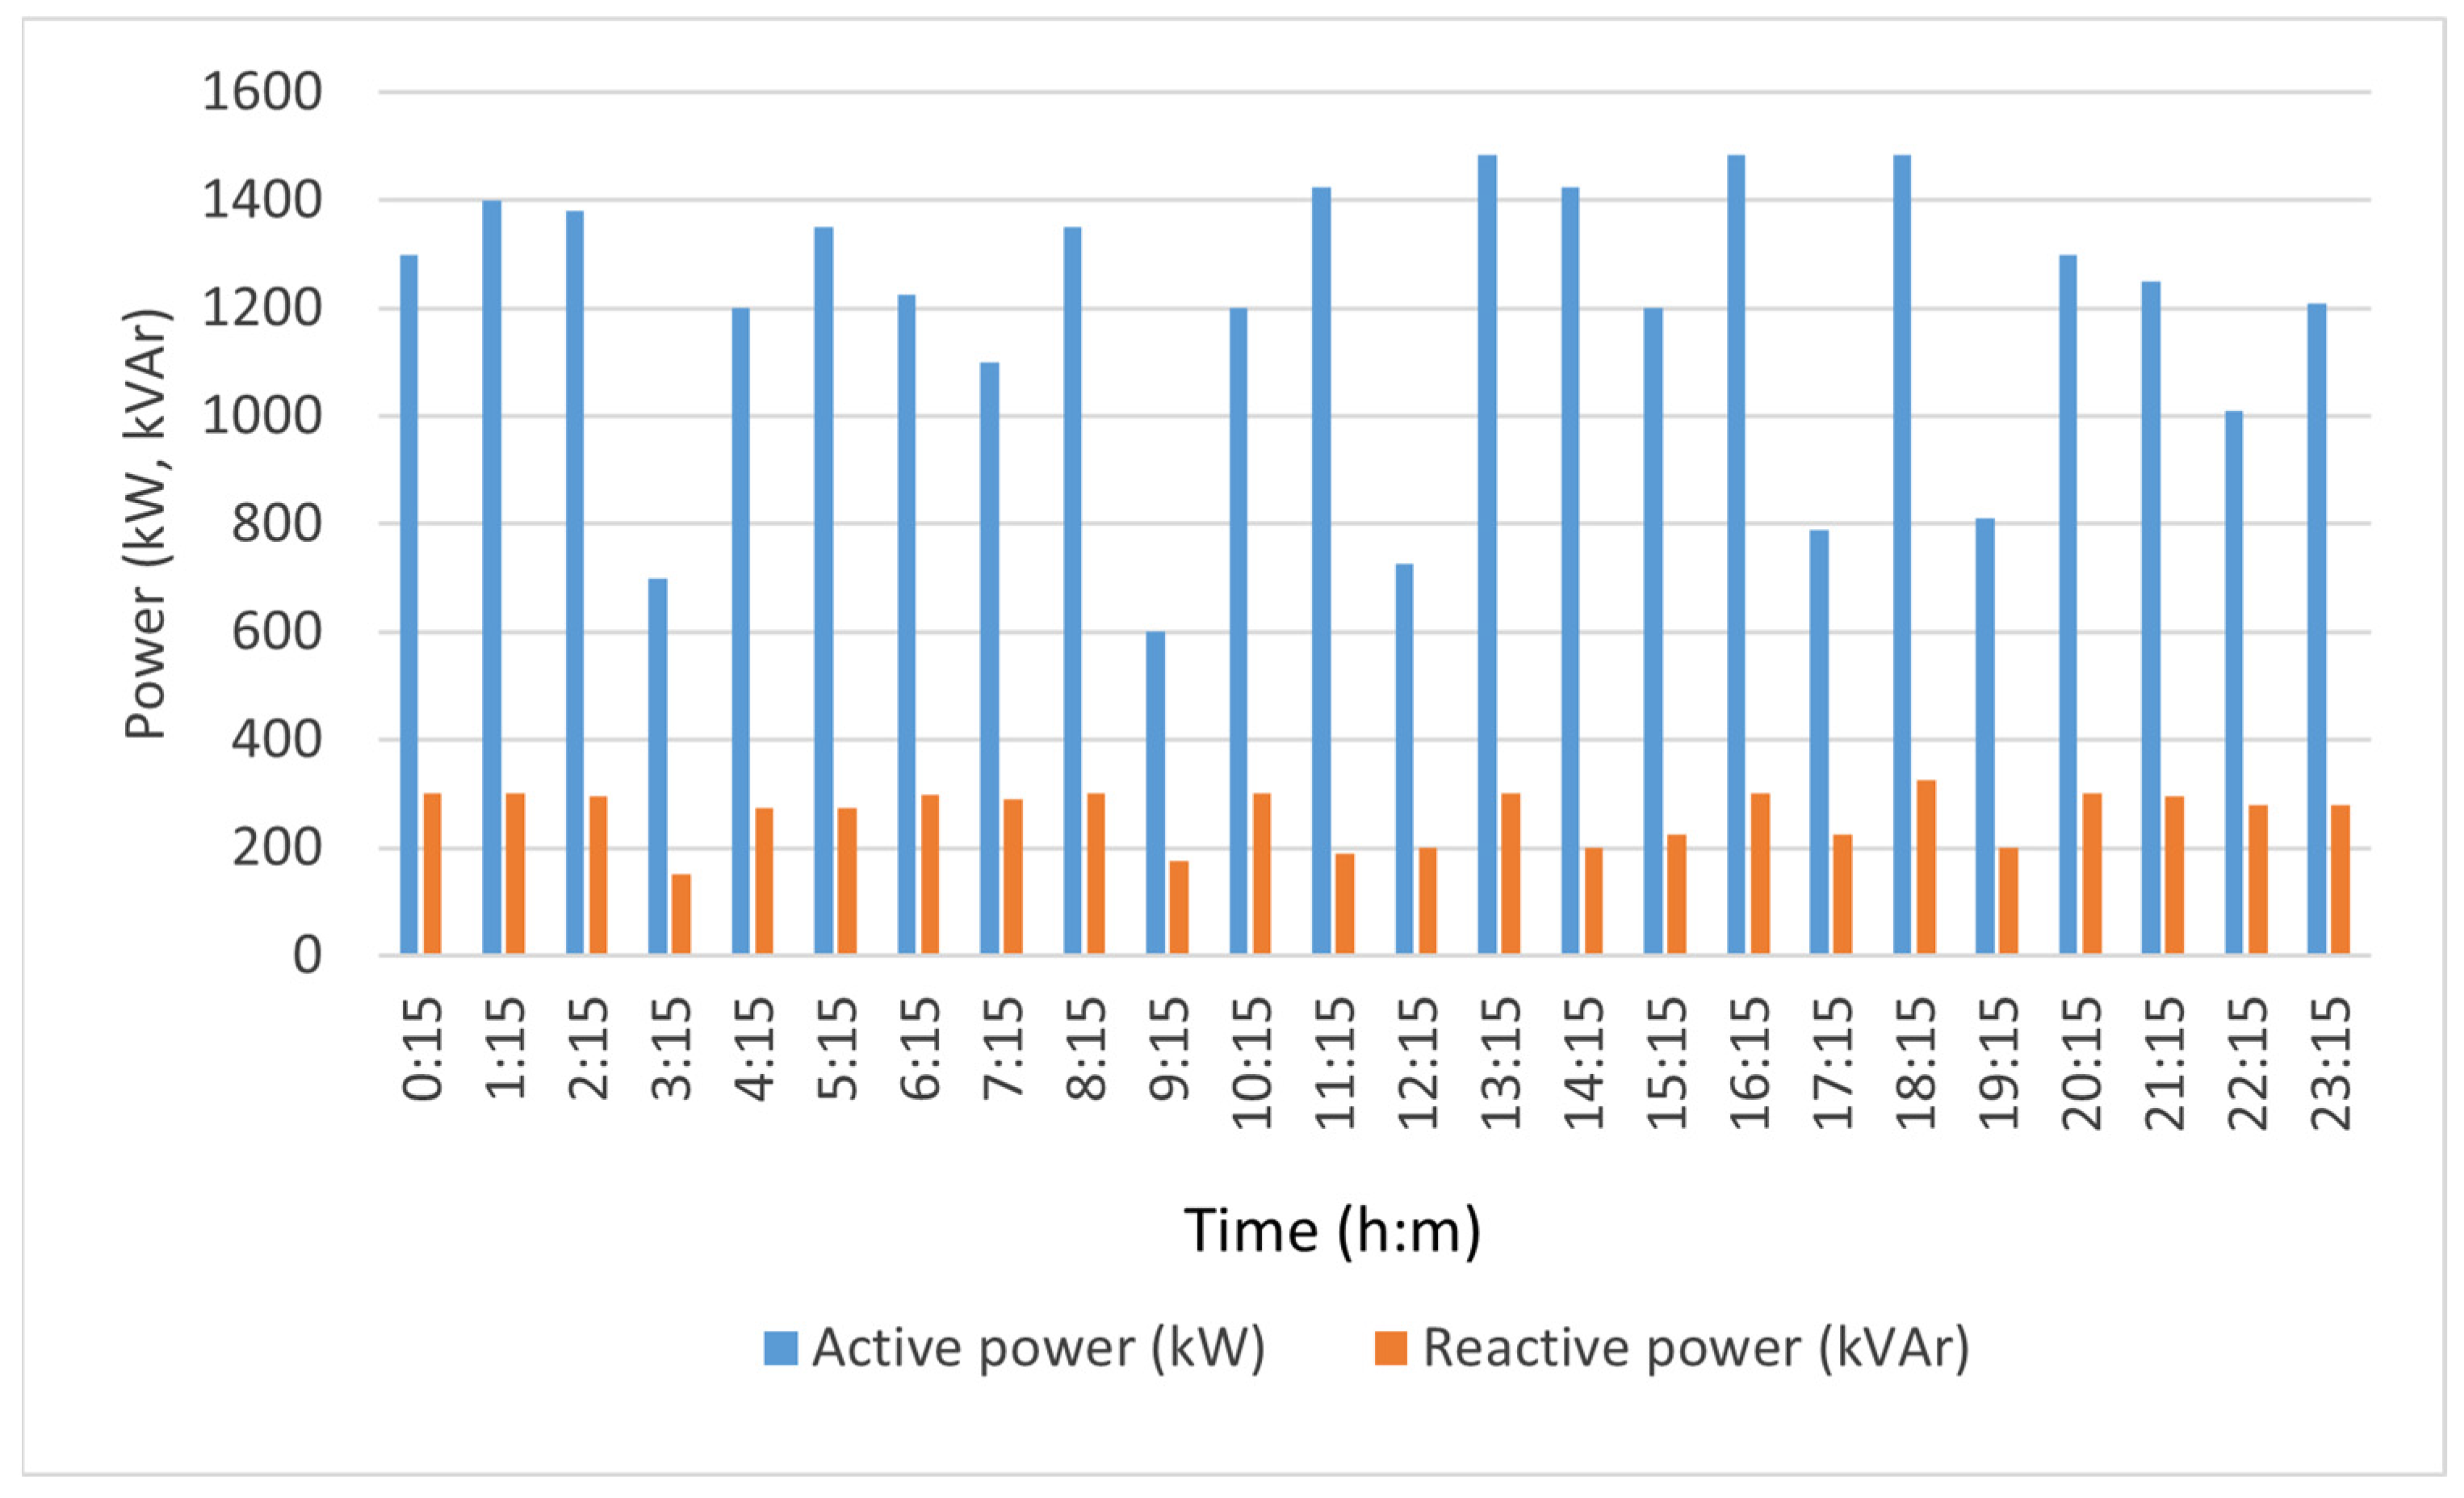
The quality of the electrical power supply is essential for the proper operation of WWTPs. Issues such as voltage fluctuations, harmonic distortions, and, in extreme cases, supply interruptions can lead to equipment failures, increased energy consumption, high operational costs, and a compromise in the system’s production goals. Based on the audit records and using measurements taken on two distinct days, three weeks apart, a load curve was identified with an average power consumption of 1176 kW and a maximum of 1485 kW (Figure 7) [25].
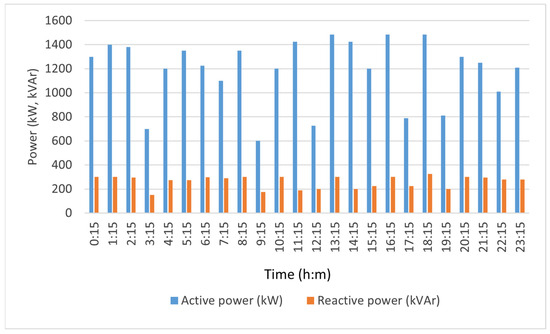
Figure 7.
Load curve of a day of activity [25].
The power factor was 0.974, with a current Total Harmonic Distortion Factor (THDI) of 16% and a voltage Total Harmonic Distortion Factor (THDV) of 3% [25]. Based on the values presented, the installation showed an adequate compensation for the power factor as well as THDV and THDI rates within the normal limits. According to the audit team, no improvement opportunities were identified, though they recommended proper load management during peak hours.
The practice of energy auditing, regardless of its methodology, must consider the analysis and evaluation of electrical parameters such as voltage, current, power consumption, reactive power, power factor, and harmonics, among others, due to their impact on the stability and efficiency of the electrical installation and the preservation of energy-consuming equipment. Furthermore, an analysis of the results over extended reference periods (preferably from the last three years), based on a multidisciplinary perspective of the sector’s inherent expertise, is essential for correlating technical, operational, and economic data, enabling more accurate diagnostics and integrated energy performance solutions tailored to the specific reality of the installations.
5.2. Initial Pumping Station
The elevation of the influent to the WWTP is done through a pumping station, equipped with six Archimedes screws distributed in two lift stages in equal numbers. The rotation speed of the screws is managed by frequency converters, which are activated by level sensors in the input chamber. Given the monitoring carried out over a 24 h period, the auditors recommended monitoring the specific energy consumption of these lifting groups as a means of identifying mechanical anomalies that affect electrical energy consumption as well as other phenomena of inefficiency [25].
5.3. Intermediate Pumping Station Phase I
After the preliminary treatment, the influent flows by gravity to the neutralization basin of Phase II and the rest is directed to the homogenization basin of Phase I. From there, it is pumped by the intermediate pumping station of Phase I to the neutralization basin of the same treatment line. During the reference period, this last stage consumed approximately 250 MWh, equivalent to 3.1% of the energy consumption of the facility [25]. Therefore, considering the geometric elevation difference of approximately 3 m between the intermediate pumping station located between the homogenization basin and the neutralization basin of Phase I, the auditors suggested discharging the influent directly from the pretreatment stage to the neutralization basin of Phase I by implementing a gravity bypass around the homogenization stage and the pumping station under analysis. However, given the need to homogenize the influent, especially during peak periods or higher loads, it was considered feasible to use this bypass only for 50% of the influent flow [25].
Based on the technical guide from the Regulatory Entity for Water and Waste Services (ERSAR), the auditors estimated the investment required for the implementation of the homogenization bypass along with the estimated reduction in energy costs. With an investment of 53,728.00 €, recoverable in four years, it would be possible to achieve a reduction in energy consumption of around 50%, with a decrease in associated costs of 13,310.00 € [25].
5.4. Biological Treatment Phase I
According to the literature [5,27,29], and also this case study, the aeration system represents the stage with the highest electricity consumption and therefore it expected that the implementation of energy efficiency measures would achieve a reduction in consumption between 15% and 38%. The biological treatment of Phase I is ensured by vertical-shaft surface aerators. Before the audit period, half of the aerators were replaced with higher-performance models due to their degraded condition and consequently low-efficiency levels (0.9 kgO2/kWh).
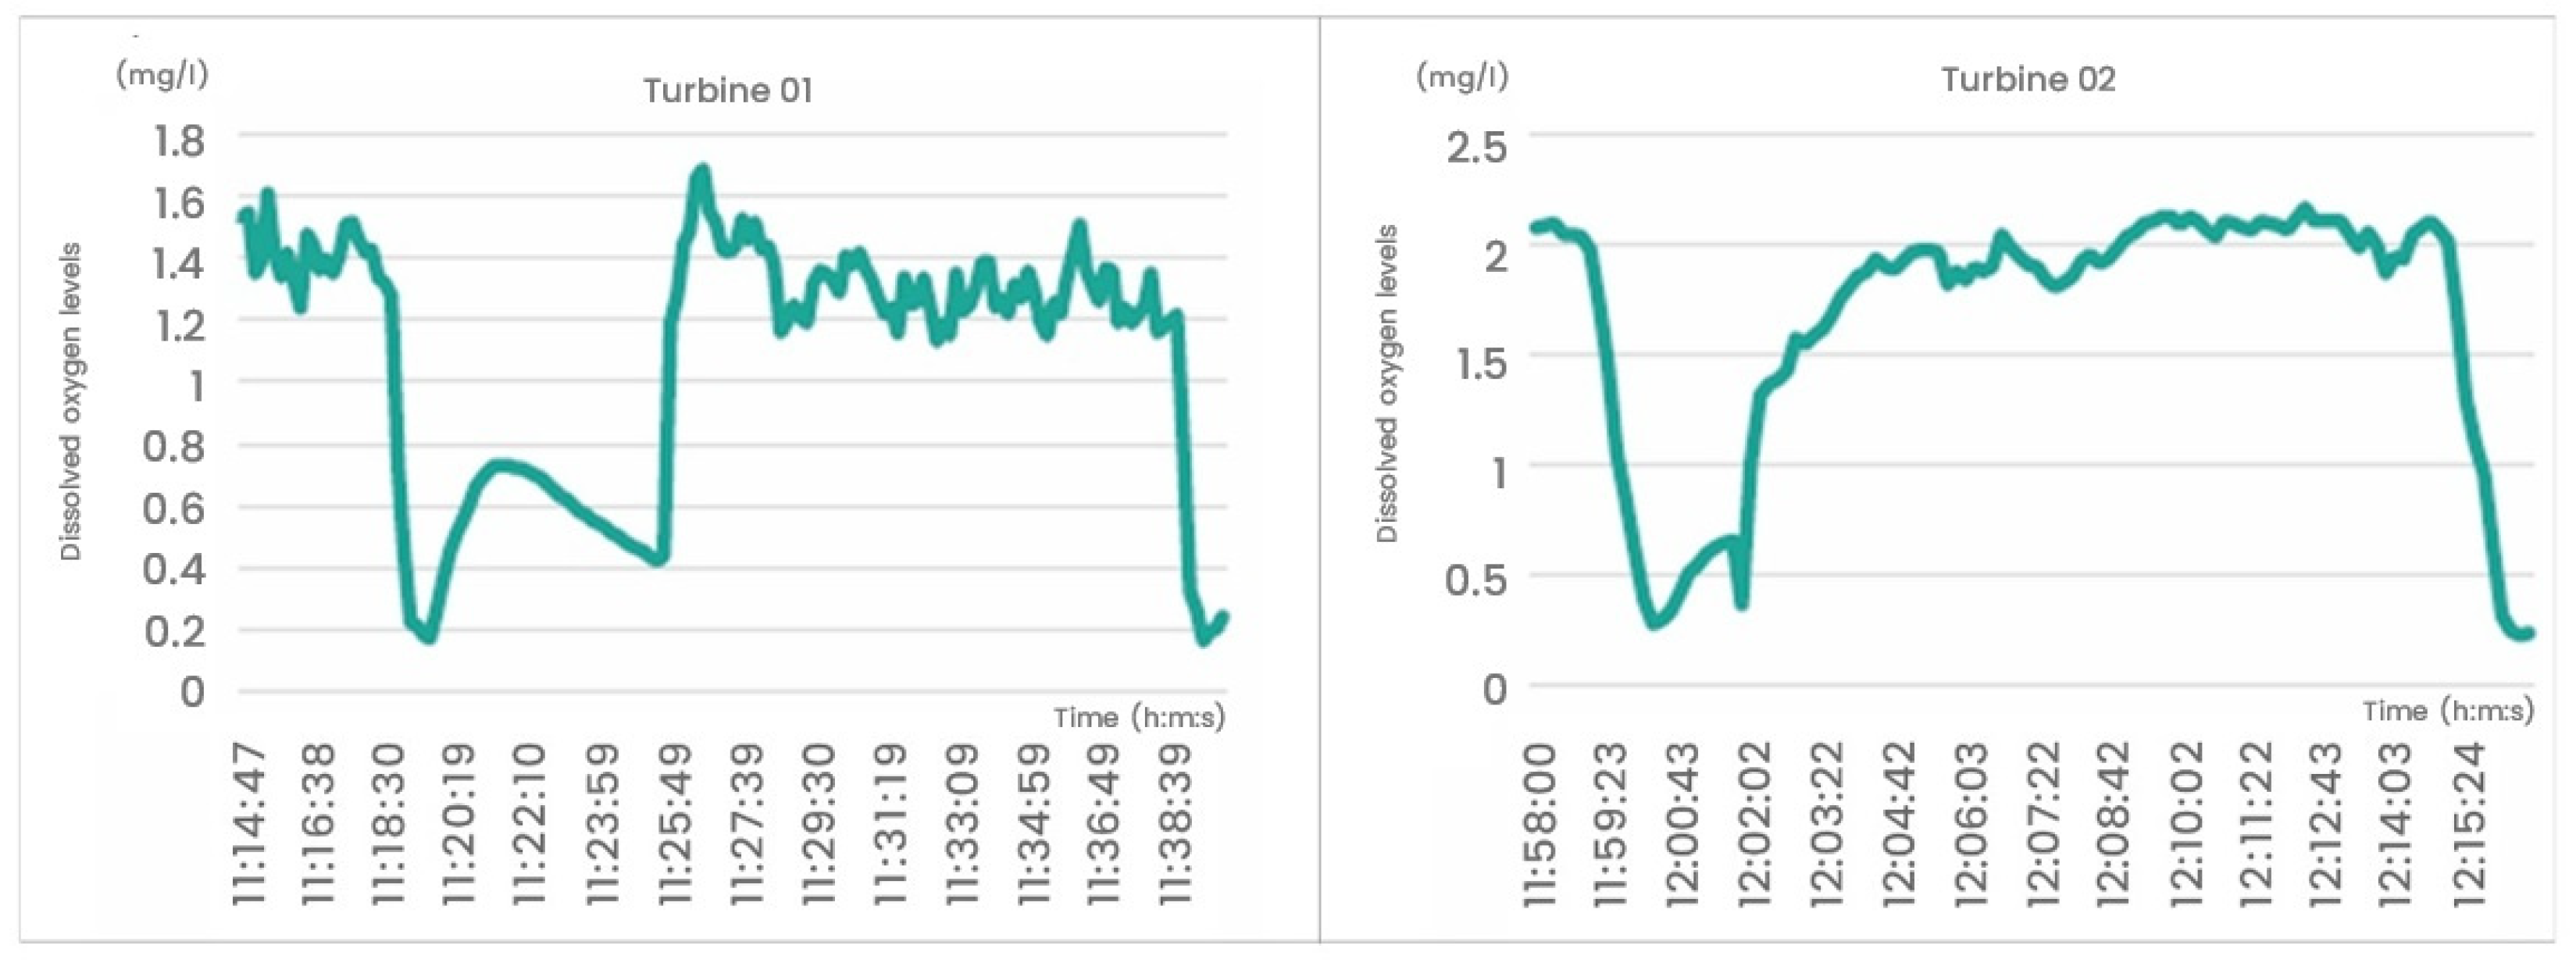
As aerator 01 is in an area with a higher concentration of pollutant load, as shown in Table 4, the amount of oxygen transferred to the liquid medium is greater, ensuring a more effective biological decomposition of organic matter by bacteria. In relation to aerator 02, located downstream of 01, the pollutant load is lower, which is why the dissolved oxygen values are higher. According to the auditors and based on the values calculated by the operator and referenced by the manufacturer, aerator 01 had an average performance within the expected range. Regarding aerator 02, the value was slightly above the value calculated in previous studies (Figure 8).
Table 4.
Performance of aeration turbines 01 and 02 of the biological treatment in Phase I [25].

Figure 8.
Dissolved oxygen levels (mg/L) in aeration turbines 01 and 02 of Phase I [25].
Currently, using a management platform dedicated to this treatment stage, the aeration system maximizes its performance by preferentially using the most efficient aerators during lower electricity tariff periods and by controlling the pollutant load to be treated. However, despite the good results achieved, the auditors identified opportunities to improve the energy performance of this treatment stage [25]. In the pollutant load removal process, through oxygen transfer, the control system does not consider the best efficiency point (BEP). Given the importance of the topic, the audit team conducted an analysis of the theoretical oxygen requirements and the optimization of the transfer point based on the pollutant load [25].
The relationship between factors such as pollutant load, dissolved oxygen levels, hydraulic retention time (HRT), and the aeration capacity of the turbines is critical to ensure oxygen transfer at the most efficient moment. The best efficiency point has direct impacts on the operational and energy performance of the WWTP. Thus, the higher the pollutant load, the lower the amount of dissolved oxygen in the basins. This makes it essential to ensure proper oxygen transfer, a process intensified by the aeration turbines. The HRT influences the time available for the removal of organic matter during the biological process. However, if it is too high or too low, it can lead to oxygen saturation or limit the time required for proper degradation. The auditors estimated the maximum theoretical oxygen requirements for biological treatment based on the reference operational values, together with the aeration capacity of the surface aerators in three lines (assuming an average turbine efficiency of 2.2 and an oxygen consumption rate of 1 kgO2/kWh) and the average monthly hydraulic retention time, with the possibility of stopping the fourth line (Table 5 and Table 6).
Table 5.
Analysis of the maximum theoretical O2 requirements for the biological treatment of Phase I and the aeration capacity with the shutdown of a treatment line [25].
Table 6.
Hydraulic retention time [25].
From the analysis of the results (Table 5 and Table 6) two important aspects should be highlighted. First, in aeration, the turbine capacity, corresponding to 12,123 kgO2/day, exceeds the oxygen requirements, particularly in June when the consumption is highest [25]. The second aspect concerns the relationship between the volume of the three basins and the flow rate, which contributes to defining more appropriate retention times.
Given the solution presented by the audit team [25], we understand that it could be optimized by analyzing the levels of ammonia and nitrate in the biological reactor in addition to the levels of oxygen. This measure would enable a reduction in energy consumption without compromising the quality of the treated effluent [34,35].
According to the results presented and the opinion of the auditors [25], it was expected that with the shutdown of one biological treatment line, the load and consequently the oxygen consumption of the biomass would increase in the remaining three lines, the average oxygen concentration in the aeration would decrease, and the oxygen transfer point would be optimized. However, according to the auditors [25], with the adjustment of the oxygen set point, an estimated 7.5% reduction in energy consumption was achieved in this treatment stage. The proposed optimization measure, associated with bypassing the homogenization basin, can be facilitated by upgrading the servo-motorized gate at the aeration basin feed, with negligible implementation costs that can be amortized within the fiscal year. However, the optimization of the oxygen transfer set-point does not require any investment.
5.5. Biological Treatment Phase II
With the aim of assessing the energy efficiency of the aeration system in the Phase II line, the oxygen consumption of the biomass was calculated using the mixed liquid suspended solids (MLSS) metric, and the oxygen supply in the basins was monitored, as shown in Figure 9.
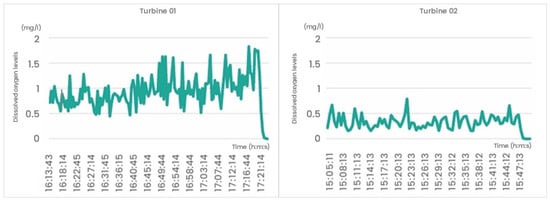
Figure 9.
Dissolved oxygen levels (mg/L) in aeration turbine 01 and 02 of Phase II [25].
As shown in Table 7, the oxygen consumed was divided by the compressor energy consumption, resulting in an average efficiency of 1.69 and 0.65 kg O2/kWh in basin 1 and basin 2, respectively.
Table 7.
Performance of the aeration system in the biological treatment of Phase II [25].
In treatment systems with these characteristics, it is common to find efficiency values exceeding 2 kgO2/kWh. However, as shown in Table 7, the efficiency value in basin 2 was significantly lower than that of basin 1, which corresponded to approximately 25% of the aerated zone in general.
Following an on-site inspection, the audit team identified an air leak in the fine bubble diffusion system in basin 2 [25]. A fine bubble diffusion system, when operating properly, allows for an increase in the total surface area of the bubbles, and consequently, an increase in contact time, which translates into a greater oxygen transfer. In other words, the reduction in the amount of air injected by the compressors and the optimization of the aerators’ operating times leads to a decrease in electricity consumption. According to the authors, the use of fine bubble diffusion systems can result in energy savings between 10% and 20% [36].
The recovery of a fine bubble diffusion system is justifiable, considering that the investment of 32,759.00 € would promote a reduction in energy costs of 58,810.00 € (corresponding to a reduction of 551,678 kWh). The investment is justifiable and, according to the auditors, can be recovered in 0.56 years [25].
Considering the importance of dissolved oxygen levels in aeration tanks, one study [37] demonstrated how replacing air with pure oxygen could increase oxygen transfer rates, allowing for the treatment of higher loads without compromising the effluent quality. Although oxygen production has an associated energy cost, the increased efficiency resulting from pure oxygen transfer can reduce the electrical energy consumption of compressors, especially in well-designed systems. Due to the energy advantages of using a fine bubble aeration system, there is the potential to optimize this treatment process with this technology. Nanobubbles increase the contact area with the water, allowing for superior gas transfer. In addition to the advantage mentioned above, there is also the characteristic of neutral buoyancy, which allows them to remain submerged and increase the contact time with water [38,39].
5.6. Sludge Recirculation Pumping Station Phase I
Given the energy consumption of the sludge recirculation pumping systems and their advanced state of degradation, the audit team measured the flow rate, power consumption, efficiency, and specific consumption of the pumps, and they compared the results with the technical specifications of more efficient equipment [25].
From the analysis of the audit results, it was concluded that there were significant differences with respect to four parameters. By replacing equipment, it would be possible to increase the efficiency of the machine by 130 to 135% through an increase in the flow rate (by 6% to 36%) while reducing the power consumption (by 53% to 65%) and, consequently, the specific energy consumption by approximately 130% to 135%. Therefore, the auditors proposed an investment of 10,237.00 € for the acquisition of new equipment. This proposal was based on an annual reduction in electricity costs of 4475.00 €, which, according to this study, would allow the investment to be recouped in approximately two and a half years [25].
5.7. Excess Sludge Pumping Station Phase II
After identifying the technical characteristics of the sludge extraction pumping unit, the flow rate, the power, and the specific consumption values of the electric energy were monitored, and the efficiency of each associated pump was evaluated.
During this treatment phase, opportunities for improvement through the acquisition of new equipment were also identified. With a reduction in average global power of approximately 70%, a reduction in specific energy consumption between 80% and 85%, and a projected increase in flow rate of 60%, the expected improvement in energy efficiency, compared to the measured values of existing equipment, was estimated to be between 400% and 550% [25].
Given these findings and considering the wear of the machines, as well as the obstruction of the pipelines, the causes of pressure losses, and the excessive energy consumption identified, the team decided to propose replacing the equipment. The investment proposal, amounting to 10,205.00 €, was justified by a projected cost reduction of approximately 3308.00 € per year, allowing for a return on investment in approximately three years. In addition to the investment proposal, the audit team did not overlook the possibility of repairing damaged equipment or implementing an appropriate maintenance action plan [25].
5.8. Sludge Recirculation Pumping Station Phase II
As was done with the Phase I sludge recirculation pumping station, specific flow rate, power, and consumption measurements were taken to assess the energy efficiency of the installed pumps, and a comparative performance analysis was performed with the proposed equipment. Based on the measurements taken, the auditors identified some efficiency loss, which may be associated with wear and losses between the impeller and the volute. However, considering the investment cost of 58,722.00 € and a payback period of over 8 years, which is above the recommended duration, as well as the low-cost reduction amount of 7137.00 €, the audit team recommended regular monitoring of the recirculation pumps by the operator. In the event of an anomaly, the operator could consider restoring the impeller and reducing the pump speed to minimize head losses and improve efficiency [25].
5.9. Alternative Energies
The production of biogas, resulting from microbial activity under anaerobic conditions, typically represents an alternative energy source. However, in this case, the type of biological treatment of activated sludge with prolonged aeration produces sludge with a high level of digestion and consequently with a reduced biogas production potential, making it unsuitable for use. As an alternative energy source, the auditors proposed studying the potential use of the available gravitational energy at the WWTP discharge point into the watercourse, based on a geometric head of 14 m, an average flow rate of 0.3716 m3/s, and an estimated useful power output of 36 kW, by constructing a minihydropower plant (cross-flow type) for self-consumption [25].
6. Measures to Be Implemented
With the execution of the energy audit, energy inefficiencies were identified in the WWTP, which, once corrected, could result in a reduction of approximately 10.8% in energy consumption (Table 8). The audit team provided several recommendations: monitor the performance loss of the motors installed at the initial pumping station; in case of failure, replace the existing electric motors with high-efficiency models; and utilize the hydroelectric potential in the discharge area and the available space for the installation of photovoltaic panels for self-consumption.
Table 8.
Summary of the corrective measures to be implemented [25].
Beyond the audit team’s suggestions, it is our understanding that additional measures should be considered based on the presented audit report. As the lamellar decantation treatment is a physical and effective process, it should be implemented in Phase I, similar to what is present in Phase II. This would allow the elimination of the equipment associated with the flotation process and consequently reduce energy, operational, and maintenance costs.
7. Conclusions and Future Work
This paper evaluated the impact of energy auditing based on the PDCA methodology and ISO 50001:2018 standard, which was framed within the context of a legal obligation imposed on the management entity of the WWTP integrated into the SGCIE. In addition, this paper illustrated that the PDCA methodology is structured and systematic and could only identify and correct persistent inefficiency phenomena by approximately 10.8%. The challenges encountered included difficulty accessing data, infrastructure and equipment wear, a limited number of parameters and KPIs, and a restricted inspection period. Therefore, the implementation of systematic and real-time methodologies for data collection, storage, and analysis, according to a multidisciplinary approach, is essential for supporting decision-making (ISO 50001:2018 and the systematic PDCA methodology).
In future work, the development of dedicated and dynamic key performance indicators (KPIs-2d) will be proposed and correlated through intelligent tools to identify and quantify inefficiency phenomena. This approach will be based on real-time data collection, storage, and analysis.
Author Contributions
Conceptualization, F.E.; methodology, F.E.; validation, F.E., J.C.C., S.L. and E.J.S.P.; formal analysis, F.E.; investigation, F.E.; resources, F.E.; writing—original draft preparation, F.E.; writing—review and editing, F.E., J.C.C., S.L. and E.J.S.P.; supervision, J.C.C., S.L. and E.J.S.P.; All authors have read and agreed to the published version of the manuscript.
Funding
This research received no external funding.
Institutional Review Board Statement
Not applicable.
Informed Consent Statement
Not applicable.
Data Availability Statement
This study did not generate new data.
Conflicts of Interest
The authors declare no conflicts of interest.
References
- Kumar, R.; Kumar, K.; Singh, R.; Sá, J.C.; Carvalho, S.; Santos, G. Modeling Environmentally Conscious Purchase Behavior: Examining the Role of Ethical Obligation and Green Self-Identity. Sustainability 2023, 15, 6426. [Google Scholar] [CrossRef]
- Santos, G.; Figueiredo, B.; Carvalho, S.; Silva, J.C. Technology Innovation to Apply the Freecycle Concept: Background, Evolution and Technological Solutions. Qual. Innov. Prosper. 2023, 27, 89–108. [Google Scholar] [CrossRef]
- International Energy Agency (IEA). World Energy Outlook 2016; IEA: Paris, France, 2016. Available online: https://www.iea.org/reports/world-energy-outlook-2016 (accessed on 14 December 2024).
- Nakkasunchi, S.; Hewitt, N.J.; Zoppi, C.; Brandoni, C. A Review of Energy Optimization Modelling Tools for the Decarbonisation of Wastewater Treatment Plants. J. Clean. Prod. 2021, 279, 123811. [Google Scholar] [CrossRef]
- Longo, S.; d’Antoni, B.M.; Bongards, M.; Chaparro, A.; Cronrath, A.; Fatone, F.; Lema, J.M.; Mauricio-Iglesias, M.; Soares, A.; Hospido, A. Monitoring and Diagnosis of Energy Consumption in Wastewater Treatment Plants. A State of the Art and Proposals for Improvement. Appl. Energy 2016, 179, 1251–1268. [Google Scholar] [CrossRef]
- Krampe, J. Energy Benchmarking of South Australian WWTPs. Water Sci. Technol. 2013, 67, 2059–2066. [Google Scholar] [CrossRef]
- Longo, S.; Hospido, A.; Mauricio-Iglesias, M. Energy Efficiency in Wastewater Treatment Plants: A Framework for Benchmarking Method Selection and Application. J. Environ. Manag. 2023, 344, 118624. [Google Scholar] [CrossRef] [PubMed]
- U.S. Environmental Protection Agency. Energy Efficiency in Water and Wastewater Facilities: A Guide to Developing and Implementing Greenhouse Gas Reduction Programs; U.S. Environmental Ptrotecnion Agency: Washington, DC, USA, 2013; p. 56. Available online: https://www.epa.gov/sites/default/files/2015-08/documents/wastewater-guide.pdf (accessed on 17 February 2025).
- European Union. Directive (EU) 2023/1791. EUR-Lex 2023. Available online: https://eur-lex.europa.eu/legal-content/EN/TXT/?uri=CELEX%3A32023L1791 (accessed on 15 April 2024).
- European Union. Directive 2012/27/EU of the European Parliament and of the Council of 25 October 2012 on Energy Efficiency. EUR-Lex 2012. Available online: https://eur-lex.europa.eu/legal-content/EN/TXT/?uri=CELEX%3A32012L0027 (accessed on 17 February 2025).
- European Union. Regulation (EU) 2018/1999 of the European Parliament and of the Council of 11 December 2018 on the Governance of the Energy Union and Climate Action. EUR-Lex 2018. Available online: https://eur-lex.europa.eu/legal-content/EN/TXT/?uri=CELEX%3A32018R1999 (accessed on 22 September 2024).
- Portugal. Decreto-Lei n. 71/2008, de 15 de Abril. Diário da República 2008. Available online: https://diariodarepublica.pt/dr/detalhe/decreto-lei/71-2008-249821 (accessed on 8 December 2024).
- Direção-Geral de Energia e Geologia (DGEG). Sistema de Gestão dos Consumos Intensivos de Energia (SGCIE). Available online: https://www.dgeg.gov.pt/pt/areas-setoriais/energia/eficiencia-energetica/auditorias-energeticas/sistema-de-gestao-dos-consumos-intensivos-de-energia-sgcie/ (accessed on 10 May 2024).
- Portugal. Lei n. 7/2013, de 22 de Janeiro. Diário da República 2013. Available online: https://diariodarepublica.pt/dr/detalhe/lei/7-2013-257073 (accessed on 10 September 2024).
- Portugal. Decreto-Lei n. 68-A/2015, de 30 de Abril. Diário da República 2015. Available online: https://dre.pt/dre/detalhe/decreto-lei/68-a-2015-67123272 (accessed on 30 November 2024).
- ISO 50001:2018; Energy Management Systems―Requirements with Guidance for Use. ISO: Geneva, Switzerland, 2018. Available online: https://www.iso.org/standard/69426.html (accessed on 1 December 2024).
- García Nieto, P.J.; Alonso Fernández, J.R.; de Cos Juez, F.; Sánchez Lasheras, F.; Díaz Muñiz, C. Hybrid modelling based on support vector regression with genetic algorithms in forecasting the cyanotoxins presence in the Trasona reservoir (Northern Spain). Environ. Res. 2013, 122, 1–10. [Google Scholar] [CrossRef]
- Torregrossa, D.; Schutz, G.; Cornelissen, A.; Hernández-Sancho, F.; Hansen, J. Energy Saving in WWTP: Daily Benchmarking under Uncertainty and Data Availability Limitations. Environ. Res. 2016, 148, 330–337. [Google Scholar] [CrossRef]
- Esteves, F.; Cardoso, J.C.; Leitão, S.; Pires, E.S.; Baptista, J. Review of Energy Audit and Benchmarking Tools to Study Energy Efficiency through Reducing Consumption in Wastewater Treatment Systems. Cad. Educ. Tecnol. Soc. 2022, 15, 150–165. [Google Scholar] [CrossRef]
- Esteves, F.A.; Cardoso, J.; Leitão, S.; Pires, E. Impact of artificial intelligence in the reduction of electrical consumption in wastewater treatment plants: A review. J. Inf. Syst. Eng. Manag. 2023, 8, 21855. [Google Scholar] [CrossRef]
- May, G.; Taisch, M.; Prabhu, V.V.; Barletta, I. Energy Related Key Performance Indicators―State of the Art, Gaps and Industrial Needs. In Advances in Production Management Systems. Sustainable Production and Service Supply Chains, Proceedings of the IFIP WG 5.7 International Conference, APMS 2013, State College, PA, USA, 9–12 September 2013; Prabhu, V.V., Taisch, M., Kiritsis, D., Eds.; Springer: Berlin/Heidelberg, Germany, 2013; Volume 414, pp. 257–267. [Google Scholar] [CrossRef]
- Cardoso, B.J.; Gaspar, A.R.; Gomes, Á. Energy Audits and Energy Efficiency in Small Wastewater Treatment Plants: A Case Study. In INCREaSE 2019: Proceedings of the 2nd International Congress on Engineering and Sustainability in the XXI Century; Monteiro, J., Silva, A.J., Mortal, A., Aníbal, J., Moreira da Silva, M., Oliveira, M., Sousa, N., Eds.; Springer International Publishing: Cham, Switzerland, 2020; pp. 766–777. [Google Scholar] [CrossRef]
- ADENE―Agência para a Energia. ADENE: Portugal. 2024. Available online: https://www.adene.pt/ (accessed on 12 September 2024).
- Diário da República. Despacho n. 17449/2008; Diário da República: Lisboa, Portugal, 2008. Available online: https://diariodarepublica.pt/dr/detalhe/despacho/17449-2008-3290785 (accessed on 10 September 2024).
- Nothern Portugal WWTP. Energy Audit Report, single ed.; Technical Report; Nothern Portugal WWTP: Portugal, 2019. [Google Scholar]
- Diário da República. Despacho n. 17313/2008; Diário da República: Lisboa, Portugal, 2008; Available online: https://diariodarepublica.pt/dr/detalhe/despacho/17313-2008-3397117 (accessed on 8 December 2024).
- Wakeel, M.; Chen, B.; Hayat, T.; Alsaedi, A.; Ahmad, B. Energy Consumption for Water Use Cycles in Different Countries: A review. Appl. Energy 2016, 178, 868–885. [Google Scholar] [CrossRef]
- International Energy Agency (IEA). Electricity Consumption in the Water Sector by Process, 2014–2040; IEA: Paris, France, 2020. Available online: https://www.iea.org/data-and-statistics/charts/electricity-consumption-in-the-water-sector-by-process-2014-2040 (accessed on 30 June 2024).
- Hamawand, I. Energy Consumption in Water/Wastewater Treatment Industry—Optimisation Potentials. Energies 2023, 16, 2433. [Google Scholar] [CrossRef]
- Su, X.; Chiang, P.; Pan, S.; Chen, G.; Tao, Y.; Wu, G.; Wang, F.; Cao, W. Systematic Approach to Evaluating Environmental and Ecological Technologies for Wastewater Treatment. Chemosphere 2019, 218, 778–792. [Google Scholar] [CrossRef]
- Yang, J.; Chen, B. Energy Efficiency Evaluation of Wastewater Treatment Plants (WWTPs) Based on Data Envelopment Analysis. Appl. Energy 2021, 289, 116680. [Google Scholar] [CrossRef]
- Gude, V.G. Energy and Water Autarky of Wastewater Treatment and Power Generation Systems. Renew. Sustain. Energy Rev. 2015, 45, 52–68. [Google Scholar] [CrossRef]
- Gu, Y.; Li, Y.; Li, X.; Luo, P.; Wang, H.; Robinson, Z.P.; Wang, X.; Wu, J.; Li, F. The feasibility and challenges of energy self-sufficient wastewater treatment plants. Appl. Energy 2017, 204, 1463–1475. [Google Scholar] [CrossRef]
- U.S. Department of Energy (DOE). DOE ABAC Webinar for Public. Available online: https://betterbuildingssolutioncenter.energy.gov/sites/default/files/tools/DOE%20ABAC%20Webinar%20for%20pub.pdf (accessed on 8 December 2024).
- Budzynski, G. Total ammonia aeration control (TAAC) theory―An innovative ammonia-based aeration controller. AQUA―Water Infrastruct. Ecosyst. Soc. 2024, 73, 396–406. [Google Scholar] [CrossRef]
- Joni, I.M.; Subhan, U.; Hanam, E.S.; Azhary, S.Y.; Pratopo, L.H.; Hermawan, W.; Miranti, M.; Panatarani, C. Application of fine bubbles technology in wastewater treatment plant (WWTP) for aquaculture system. AIP Conf. Proc. 2020, 2219, 090001. [Google Scholar] [CrossRef]
- Skouteris, G.; Rodriguez-Garcia, G.; Reinecke, S.F.; Hampel, U. The Use of Pure Oxygen for Aeration in Aerobic Wastewater Treatment: A Review of its Potential and Limitations. Bioresour. Technol. 2020, 312, 123595. [Google Scholar] [CrossRef]
- Ushikubo, F.Y.; Furukawa, T.; Nakagawa, R.; Enari, M.; Makino, Y.; Kawagoe, Y.; Shiina, T.; Oshita, S. Evidence of the existence and the stability of nano-bubbles in water. Colloids Surf. A Physicochem. Eng. Asp. 2010, 361, 31–37. [Google Scholar] [CrossRef]
- Gu, Y.; Li, F.; Yuan, F.; Yang, Q. Optimization and control strategies of aeration in WWTPs: A Review. J. Clean. Prod. 2023, 418, 138008. [Google Scholar] [CrossRef]


Disclaimer/Publisher’s Note: The statements, opinions and data contained in all publications are solely those of the individual author(s) and contributor(s) and not of MDPI and/or the editor(s). MDPI and/or the editor(s) disclaim responsibility for any injury to people or property resulting from any ideas, methods, instructions or products referred to in the content. |
© 2025 by the authors. Licensee MDPI, Basel, Switzerland. This article is an open access article distributed under the terms and conditions of the Creative Commons Attribution (CC BY) license (https://creativecommons.org/licenses/by/4.0/).