Article

Digital Economy, Entrepreneurship of Small and Medium-Sized Manufacturing Enterprises, and Regional Carbon Emissions: Evidence from Chinese Provinces

1
Business School, Beijing Technology and Business University, Beijing 100048, China
2
Academic Affairs Department, Beijing National Accounting Institute, Beijing 101312, China
3
School of Economics, Central South University of Forestry and Technology, Changsha 410004, China
*
Authors to whom correspondence should be addressed.
Sustainability 2025, 17(5), 2133; https://doi.org/10.3390/su17052133
Submission received: 1 November 2024 / Revised: 12 February 2025 / Accepted: 27 February 2025 / Published: 1 March 2025

Abstract

:
In recent years, the digital economy (DE) has gained significant attention for its potential in reducing carbon emissions (CE). This paper intends to explore the regional carbon reduction effect of the DE and the entrepreneurship of small and medium-sized manufacturing enterprises (SMMEs), as well as disclose the mechanism through which the entrepreneurship of SMMEs functions. To this end, this paper employs an extended STIRPAT model to analyze the panel data of 30 provinces in China spanning from 2011 to 2018. The empirical analysis shows that (1) the DE has a positive effect on reducing regional total carbon emissions (TCE) and carbon emissions intensity (CEI); (2) the entrepreneurship of SMMEs has a negative influence on reducing regional CE; (3) the entrepreneurship of SMMEs fully mediates the link between the DE and TCE and partially mediates the relationship between the DE and the CEI; and (4) the DE has a stronger carbon reduction effect in regions with low urbanization levels and low institutional quality, as well as non-industrial pilot areas. The findings provide empirical evidence to policymakers on promoting CE reduction and the DE. This study has practical value for SMMEs to improve competitiveness and survival under the current environment.

1. Introduction

Recently, the DE has experienced remarkable growth, emerging as a crucial driver of global economic advancement. Its rapid expansion is reshaping various sectors worldwide. The ongoing enhancements in network infrastructure and the advancement of intelligent tools, including smart devices, have accelerated the integration of digital technologies into a broader range of fields and deeper levels. This transformation is driving the shift from an industrial economy to an intelligent one, thereby revolutionizing the entire economic operating mode [1]. This shift signifies the future direction of industry, where data-driven approaches, integrated innovation, and open sharing have become the primary characteristics of economic development [2]. As energy consumption and environmental issues become increasingly prominent [3], balancing economic growth with environmental quality has long been a significant policy challenge for countries worldwide [4]. As a result, the effect of the DE in reducing CE has attracted significant attention. Since the 1970s, there has been a fundamental positive correlation between CE and global economic growth [5].The considerable increase in CE has led to heightened global warming, making the low-carbon economy a worldwide priority. In the context of developing next-generation digital technologies, it has become a common goal for countries worldwide to formulate strategies for the development of the DE according to local conditions and achieve DE integration and low-carbon economic development. This goal has been widely recognized and acknowledged [6].
Scholars have explored the factors and pathways affecting CE from both micro and macro perspectives. Micro perspectives include technological change [7], factor substitution effects between energy and other inputs [8], and the digital transformation of enterprises [9]. Macro perspectives, on the other hand, encompass carbon tax policies [10], international trade [11], economic restructuring [12], and environmental policies [13]. Few studies have comprehensively examined the performance measurement, as well as the influencing pathways and spatial effects of DE on CE [14], yet the causal mechanisms remain insufficiently substantiated.
Moreover, the effect of the DE on CE reduction and its internal mechanisms has rarely been explored from the perspective of enterprise entrepreneurship. Extensive scholarly efforts have focused on the factors influencing the low-carbon performance of mature enterprises, such as their willingness to reduce emissions, scale, industry affiliation, and government regulations [15]. They have also taken into account regional differences, such as resource endowment and policy differences, that affect the low-carbon performance of enterprises. However, few studies have explored the CE reduction challenges faced by startups. Numerous studies have highlighted that entrepreneurship typically entails establishing new enterprises, and it is a process through which these ventures grow from small to large. From the perspective of company size, 75% of new ventures employ 20–1000 people [16], which are classified as small and medium-sized enterprises (SMEs). This classification ensures their flexibility and agility during the entrepreneurial process. However, SMEs face significant pressure for CE reduction due to factors such as the development ideology of the digital era, financial strength, technological proficiency, and regulatory efficiency. In addition, the low participation rate of SMEs in CE trading markets and the lack of clear energy-saving and CE reduction standards for these enterprises make it challenging to incentivize and constrain their CE reduction efforts. Therefore, SMEs possess substantial potential for CE abatement. Manufacturing is the pillar industry of the national economy, and how manufacturing enterprises take proactive CE reduction actions in their quest for high-quality development has garnered much attention. Existing studies have largely overlooked the CE reduction strategies of manufacturing startups [17,18,19]. Hence, this study examines the impact of SMME entrepreneurship on CE and further explores the intermediary effect of the SMME entrepreneurship through which the DE influences regional CE.
In addition, the DE and the entrepreneurship of SMMEs may influence regional CE, leading to regional heterogeneity [20]. Previous studies have predominantly explored such factors as resource endowment [21], geographical location, urban scale [22], growth stage [23], and the abundance of human capital [24], usually neglecting the composite differences between the DE and low-carbon development. Therefore, this paper bridges the existing research gap by categorizing the samples based on economic development levels, the degree of urbanization, the quality of institutions, and the history of industrial development, which reflects both economic and policy dimensions, to explore the heterogeneity of the effects in different contexts. This provides a holistic view of how the DE and the entrepreneurship of SMMEs influence regional CE.
Accordingly, given the growing global emphasis on sustainable development, this study aims to contribute to the achievement of the Sustainable Development Goals (SDGs) by exploring the role of the DE and entrepreneurship in reducing CE. We propose the following research contributions: First, this paper proposes an extended STIRPAT model, which incorporates the DE and the entrepreneurship of SMMEs as two new variables, thereby expanding the research boundaries of existing studies on the DE, CE reduction, SMEs, and entrepreneurship. Second, this paper divides the samples to explore the heterogeneity of the effects across four different contexts, which reflect both economic and policy dimensions, offering a more comprehensive perspective for further investigating the role of the DE and the entrepreneurship of SMMEs in affecting the total carbon emissions (TCE) and carbon emission intensity (CEI). Third, this study advances scholarly discourse on regional CE reduction mechanisms by elucidating how the DE affects regional CE through the mediating role of SMME entrepreneurship. Fourth, this study pioneers the investigation of CE reduction in startups, addressing the research gap where existing studies predominantly focus on established companies. Furthermore, to assess the DE, this paper uses the digitization index, which can effectively capture both its current and expected development.
The rest of the paper is organized as follows: Section 2 reviews the literature and develops hypotheses on the DE, the entrepreneurship of SMMEs, and their linkages to CE. Section 3 details econometric models, variables, and data. Section 4 empirically tests the hypotheses through baseline regressions, robustness checks, heterogeneity analysis, and mediation effects. Section 5 discusses the implications of this paper, including theoretical implications, practical implications, and managerial discussions. Finally, Section 6 concludes with policy insights and future research avenues.

2. Literature Review and Research Hypotheses

2.1. Literature Review

In the current era, the advancement of technology is predominantly propelled by two critical areas: the control of CE and the progression of the DE, both deeply influencing the formation of national innovation systems. The DE is the product of the close integration of modern information technology and the operation of the national economy. Its core content includes digital empowerment infrastructure, digital media, digital transactions, and digital products and services. The development of emerging technologies like cloud computing, the Internet of Things, and artificial intelligence has led to the DE permeating every aspect of social life and acting as a new driver of economic growth [25,26]. The OECD points out that the DE is developing rapidly and has permeated many aspects of the world economy, including retail, transportation, education, health, and other fields, leading to changes in social work and trade methods [27].
The prominence of digitalization in manufacturing enterprises is escalating due to the ongoing emergence of digital technology application scenarios that empower the real economy. This trend has led to significant interest in leveraging digital technology to improve CE reduction efficiency in the manufacturing industry. A multitude of studies points to the fact that the scale economies linked to industrialization and the innovation of green technology give rise to an inverted U-shaped Environmental Kuznets Curve (EKC), linking industrial development with CE. However, since the “Integration of Informatization and Industrialization” development strategy was implemented, the interplay between industrialization and CE has become more multifaceted. Digital technology, which has the capacity to increase energy efficiency and thus lower CE, might also lead to an escalation in CE because of the requirements for infrastructure development and economic scale enlargement. The emergence of this “double effect” has aroused the attention of the academic community [28,29]. Therefore, this study focuses on how the DE and the entrepreneurship of SMMEs affect regional CE.
Scholars generally use a variety of econometric methods, such as system generalized moment estimation (SYS-GMM), the panel smooth transformation regression model (PSTR), and an intermediary effect model, to explore the relationship between DE and CE. For example, Wang used SYS-GMM technology to study the connection between the DE development index and CO₂ emissions in 30 provinces in China [6]; Li and Wei revealed the nonlinear effects of CE on economic growth through the PSTR model [30]. Karaki incorporated the DE as a form of technological progress into the STIRPAT model, using panel data to analyze the effect of DE on CE in BRICS countries between 2011 and 2021 [31]. As an assessment model for environmental impact, the STIRPAT model is widely applied in quantifying the nexus between human economic endeavors and the environment. Researchers can enhance this methodology by employing diverse data models or incorporating variables as per research requisites, rendering it the most prevalent tool for scrutinizing factors influencing CE. By integrating the Divisia decomposition technique and SDA, this model enables the consideration of various factors when explaining alterations in CE, including economic development, technological advancements, and population dynamics, among others. The STIRPAT model is particularly beneficial in assessing this issue due to its comprehensive evaluation of diverse influences and its ability to account for the effects of distinct stages of economic development, technological innovation, population dynamics, and other variables when elucidating shifts in CE. Additionally, other scholars have included intermediary variables, such as green technology innovation and energy structure adjustment, to more comprehensively clarify the mechanism of DE development on CE reduction [32].
When examining the impact of the DE on CE, regional differences cannot be ignored. It has been shown by prior research that the developed eastern region has a stronger advantage in promoting low-carbon development due to its higher degree of industrialization and perfect infrastructure. The less developed regions are rich in resources but have limited technical level, so they face greater challenges in achieving energy conservation and CE reduction goals [33]. In addition, the DE exhibits pronounced spatial spillover effects, whereby regional DE advancement stimulates economic dynamism in neighboring areas [34]. Therefore, we also conducted a heterogeneity test based on economic development level, urbanization level, institutional quality, and industrial development history to analyze the regional heterogeneity of the impact effect.

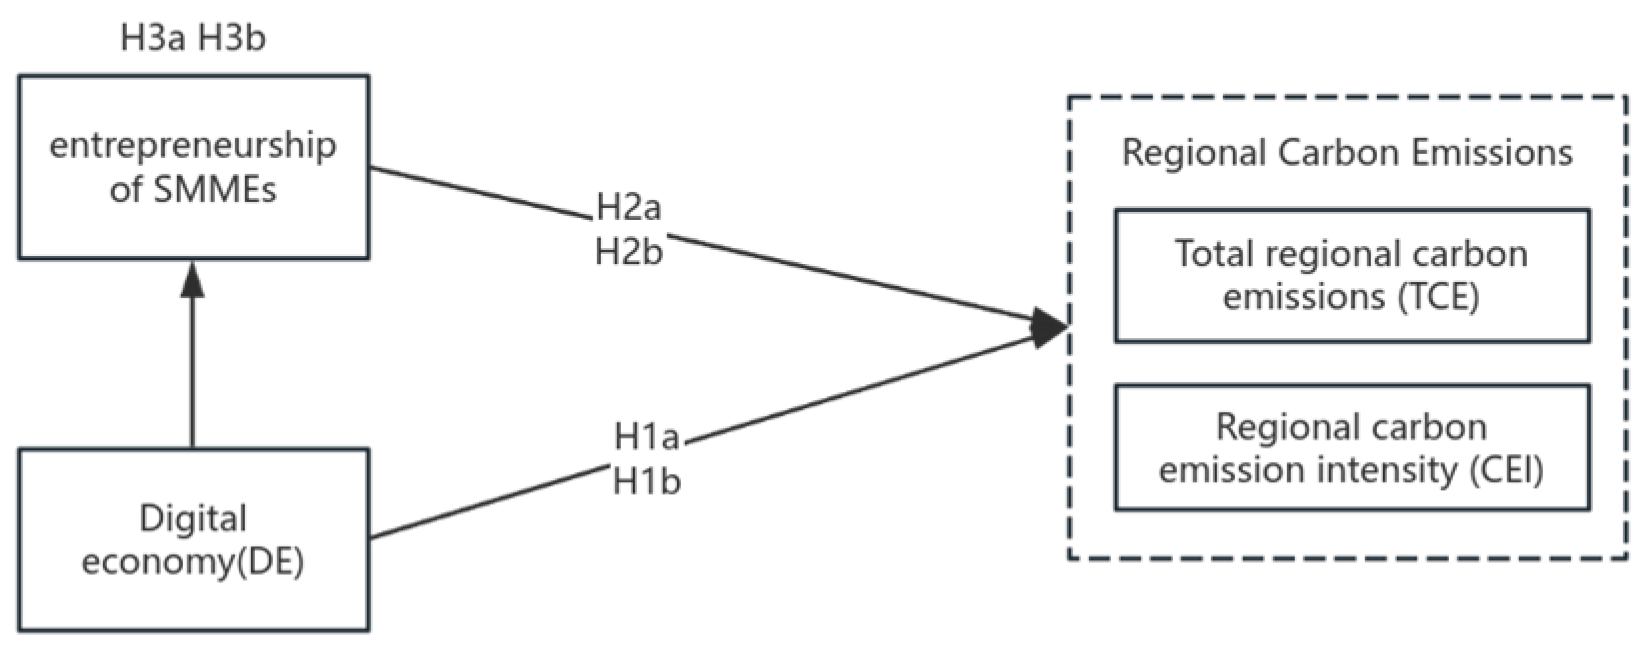
2.2. Research Hypotheses

2.2.1. Digital Economy and Regional Carbon Emissions

The positive contribution of the DE to the reduction of CE is apparent. When viewed from a macroeconomic standpoint, it serves as a force for CE reduction. The integration of intelligent and automated technologies primarily boosts production efficiency, which subsequently reduces energy usage and leads to a decrease in CE from production. This helps in the diminution of regional CE [35]. Additionally, the growth of the DE promotes the adoption and advancement of clean energy in manufacturing, indirectly contributing to the reduction of regional CE. In the consumer realm, the DE fosters the development of sustainable consumption patterns; specifically, e-commerce and online services decrease reliance on physical retail stores, thereby reducing the carbon footprint associated with commercial circulation. Simultaneously, there is an increase in consumer demand for low-carbon products and services, which drives societal green transformation. Secondly, from a medium industrial structure perspective, the widespread adoption of digital technology comprehensively optimizes and upgrades industrial structures by reallocating production factors from inefficient sectors to efficient ones while enhancing resource allocation efficiency. In the end, this leads to enhanced energy efficiency and CE reduction [36]. Viewed from individual enterprises, leveraging digital technology not only optimizes the effectiveness of their CE reduction technologies at the final phase but also advances the digital transformation and the inception of technological innovation in manufacturing. This aids in the research, development, and deployment of eco-friendly technologies [37]. The implementation of these technologies contributes to reducing CE [38] and fosters advancements in green practices, thereby elevating overall productivity while minimizing carbon output. Moreover, a spatial analysis demonstrates that DE development cuts carbon intensity in specific regions and can spill over to reduce intensity in neighboring areas [39]. Thus, the advancement of the DE possesses the ability to diminish both the overall quantity of TCE and CEI simultaneously, thereby aiding in achieving carbon emission reduction targets. On this foundation, the subsequent hypotheses are put forward:
H1a. 
The DE has a positive impact on reducing TCE.
H1b. 
The DE has a positive impact on reducing CEI.

2.2.2. Entrepreneurship of SMMEs and Regional Carbon Emissions

Approximately 90% of global enterprises are SMEs [40]. Over half of China’s CE stem from SMEs [41]. The manufacturing sector is inherently extensive in the development model, consuming significant energy while generating output [42]. From a practical perspective, due to high uncertainty and long return periods, establishing a low-carbon development strategy during the entrepreneurial process may incur high sunk costs, requiring substantial financial and technical support. Coupled with the pressures brought by government environmental regulations [43], manufacturing startups usually rationally choose to focus on financial performance while neglecting low-carbon performance. Hence, the energy spillover from startups is substantial, and the entrepreneurship of SMMEs is not only ineffective in lowering CE but also boosts energy consumption. This leads to a rise in TCE and CEI, thereby thwarting the achievement of CE control goals. Consequently, the subsequent hypotheses are suggested:
H2a. 
The entrepreneurship of SMMEs has a positive impact on TCE.
H2b. 
The entrepreneurship of SMMEs has a positive impact on CEI.

2.2.3. The Mediating Role of the Entrepreneurship of SMMEs

SMEs serve as key drivers for economic and social progress across various nations. They account for about 97.2% of business institutions and provide employment for approximately 7.3 million people in Malaysia. In Spain, SMEs make up 99.82% of all companies and employ nearly 10 million people or about 60% of the total workforce in Spanish companies. In China, SMEs make up 98.4% of all enterprises, with their numbers surpassing 52 million [44]. The DE can effectively drive high-quality entrepreneurship by fostering entrepreneurial opportunities, enriching entrepreneurial resources, and lowering entrepreneurial thresholds, thereby influencing the entrepreneurship of SMEs [45].
Low-carbon entrepreneurship by SMMEs is pivotal to the regional impact of the DE on CE, potentially leading to emission reductions and promoting sustainable, environmentally conscious development [46]. From a macro perspective, by improving digital infrastructure and promoting resource sharing, SMEs can more easily team up with other businesses, research organizations, and government departments to co-develop and implement low-carbon technologies, cutting CE. Micro-wise, the DE’s growth has heightened consumer demand for sustainable products and services. Being agile and responsive to market trends, SMEs inherently meet this demand by advocating for the manufacture and use of more low-carbon products and services, which further aid in the reduction of CE. For SMEs, undergoing digital transformation significantly boosts their CE reduction efficiency, and when coupled with green innovation, it positively affects their carbon performance. Summing up, the entrepreneurship of SMMEs likely serves as an intermediary in the relationship between the DE and regional efforts aimed at reducing CE. Armed with this comprehension, the ensuing hypotheses are constructed:
H3a. 
The entrepreneurship of SMMEs mediates the relationship between the DE and regional TCE.
H3b. 
The entrepreneurship of SMMEs mediates the relationship between the DE and regional CEI.
The research conceptual model, as depicted in Figure 1, illustrates the relationships among digital economy, entrepreneurship of SMMEs, and regional carbon emissions.

3. Materials and Methods

Figure 2 below provides a visual representation of the research framework and methodology, which is central to understanding the structure and logic of our study. The framework is divided into three main sections: theoretical foundation, empirical analysis, and conclusion and implications. The empirical analysis section, which is the focus of this paper’s methodology, is further divided into three sub-parts: main effects analysis, path analysis, and heterogeneity analysis. Every subsection is designed to examine particular aspects of the relationship among the DE, the entrepreneurship of SMMEs, and CE. The framework serves as a guide for the empirical analysis, providing a detailed overview of the specific elements involved in empirical research and the scope and complexity of the data analysis process.

3.1. Econometric Model Specification

When selecting the research methods, the following aspects were mainly taken into consideration: Firstly, this paper seeks to investigate the impact of the DE and SMME entrepreneurship on regional CE. To comprehensively analyze the relationships among these factors, we chose the extended STIRPAT model. The STIRPAT model is an improved version of the IPAT model, which better reflects the complex relationship between human economic activities and environmental impacts. By incorporating stochastic factors and elasticity coefficients, the STIRPAT model can more flexibly handle the relationships among different variables and is suitable for analyzing environmental issues such as CE. Secondly, the STIRPAT model allows us to introduce multiple control variables (CVs), such as the urbanization rate, per capita GDP, number of patents, degree of openness, and industrial structure, into the model. This enables a more comprehensive control of other factors that may affect CE, thereby enhancing the model’s explanatory power and estimation accuracy.
The IPAT model, first proposed by Ehrlich et al. [47]., establishes anthropogenic environmental impacts as a multiplicative function of three core determinants: population scale (P), economic affluence (A), and technological intensity (T). The equation is as follows:
I = P A T
where I symbolizes environmental impact; P represents population; A indicates affluence; and T signifies technology.
The IPAT model assumes that I changes in direct proportion to P, A, and T, which contradicts general economic principles, leading to limitations in its application. The STIRPAT model originated from the IPAT model, building on this by incorporating stochastic factors and allowing coefficients to be estimated as parameters or other variables to be introduced, thus enabling researchers to improve and extend the model. The elasticity relationships between independent and dependent variables are reflected through the regression coefficients in the equation. The STIRPAT equation is formulated as follows:
I = a P b A c T d e
where I, P, A, and T have identical meanings as in the IPAT model; a represents the coefficient; b, c, and d are the exponents of the respective independent variables; and e is the error term.
Taking natural log on both sides of the equation:
L n I = a + b L n P + c L n A + d L n T + e
For panel data analysis, the two-way fixed-effects model factors in both individual (typically cross-sectional units such as regions, companies, etc.) and time (typically longitudinal units such as years, quarters, etc.) fixed effects. This model controls these fixed effects to reduce estimation bias. The fixed effects for individuals and time represent unobservable factors related to the individual and time with the panel data, which might influence the dependent variable but cannot be directly observed or measured. By introducing these fixed effects, the two-way fixed effects can more accurately estimate the relationships between other variables. Therefore, using the expanded STIRPAT model as the foundational theoretical framework, this paper establishes an econometric model with two-way fixed effects, adjusting for both temporal and regional variations. This model is crafted to thoroughly evaluate the influence of DE and SMME entrepreneurship on the TCE and CEI. The models are formulated as follows:
l n T C i t = μ 0 + μ 1 l n m a n u i t + μ 2 D L i t + μ 3 l n u r b a n i t + μ 4 l n p e r G D P i t + μ 5 l n p a t e n t i t + μ 6 l n E D i t + μ 7 l n i n s t r u i t + u 1 + δ 1 + E 1
l n C I i t = β 0 + β 1 l n m a n u i t + β 2 D L i t + β 3 l n u r b a n i t + β 4 l n p e r G D P i t + β 5 l n p a t e n t i t + β 6 l n E D i t + β 7 l n i n s t r u i t + u 2 + δ 2 + E 2
where i stands for regions and t for time, respectively; TC represents total carbon emissions; CI represents carbon emission intensity; the terms µ0 and β0 are constants; manu indicates the entrepreneurship of SMMEs; DL stands for the digital economy level; urban represents the urbanization rate; perGDP denotes per capita GDP; patent indicates patents; ED signifies the degree of openness; instru stands for industrial structure; u1 and u2 represent time fixed effects; δ1 and δ2 represent region fixed effects; and Ɛ1 and Ɛ2 represent error terms.
In the aforementioned model, environmental pressure (I) is measured by total carbon emissions (TC) and carbon emission intensity (CI); population (P) is assessed by means of the urbanization rate (urban); affluence (A) is measured by four variables: digital economy level (DL), per capita GDP (perGDP), degree of openness (ED), and industrial structure (instru). Unlike previous studies, this paper introduces the digital economy level as a variable. Technology (T) is measured by patents (patent). Finally, the entrepreneurship of SMMEs (manu) is the newly introduced variable for the model.
To further validate the mediating role of the entrepreneurship of SMMEs (manu) between the digital economy level (DL) and regional carbon emissions (TC/CI), the following mediation effect model is constructed:
l n m a n u i t = α 0 + α 1 D L i t + α 2 l n u r b a n i t + α 3 l n p e r G D P i t + α 4 l n p a t e n t i t + α 5 l n E D i t + α 6 l n i n s t r u i t + u 3 + δ 3 + E 3
l n T C i = γ 0 + γ 1 l n m a n u i t + γ 2 D L i t + γ 3 l n u r b a n i t + γ 4 l n p e r G D P i t + γ 5 l n p a t e n t i t + γ 6 l n E D i t + γ 7 l n i n s t r u i t + u 4 + δ 4 + E 4
l n C I i = η 0 + η 1 l n m a n u i t + η 2 D L i t + η 3 l n u r b a n i t + η 4 l n p e r G D P i t + η 5 l n p a t e n t i t + η 6 l n E D i t + η 7 l n i n s t r u i t + u 5 + δ 5 + E 5
where i and t represent regions and time, respectively; the definitions of TC, CI, manu, DL, urban, perGDP, patent, ED, and instru are consistent with those described above; the terms u3, u4, and u5 represent time fixed effects; δ3, δ4, and δ5 represent region fixed effects; Ɛ3, Ɛ4, and Ɛ5 denote error terms.

3.2. Measurement of Variables

This paper employed a quantitative methodology to examine the relationships among the DE, entrepreneurship of SMMEs, and regional CE. What follows is a detailed elucidation of the measurement employed in this study. It is noteworthy that our research did not necessitate approval by the ethics committee because it involved no animal or human clinical trials, human participants, or any unethical practices.

3.2.1. Dependent Variables

This paper employs TCE and CEI to represent the control targets of CE, which correspond to the environmental impact in the STIRPAT model. The environmental impact grows with rising emissions and intensity. These variables are measured by using the natural logarithm of the total carbon dioxide emissions and the CE per unit of GDP in each region [48].

3.2.2. Core Independent Variables

This paper utilizes the DE and entrepreneurship of SMMEs as independent variables. Here, the DE is seen as a set of economic activities where digital knowledge and information are key production factors, modern information networks are important carriers, and the efficient use of information and communication technologies is a main driver for improving efficiency and refining economic frameworks. SMMEs refer to manufacturing enterprises with a personnel scale of 20 to 1000 people in their startup or growth phase that have been established within the last 36 months. In current academic studies, there is no agreed-upon way to measure the DE [49]. Some scholars have constructed DE indicator systems from aspects such as informatization progression, internet advancement, and digital transaction evolution, or alternatively, by centering their attention on internet growth and inclusive digital financial services. To measure the digital economy level in China, this paper utilizes the digitization index from the Digital Financial Inclusion Index of China by Peking University, denoted as (DL). This index covers four dimensions: mobility, affordability, credibility, and convenience, and is derived using the coefficient of variation and the analytic hierarchy process, which substantially reflect the evolution of the DE [50].
Scholars have measured the entrepreneurship of SMMEs using various methods, including the ratio of enterprises with registered capital of RMB 5 million to manufacturing enterprises with registered capital exceeding RMB 5 million [51], the ratio of the quantity of startups in each region to the number of permanent residents [52], and the number of newly registered legal entities in each province. This paper follows the method provided in [53] and employs the number of newly established SMMEs to measure the variable, which is named (manu).

3.2.3. Control Variables

Based on the STIRPAT model and drawing on prior research [54], this paper employs the total population and urbanization rate as CVs. Table 1 lists all variables and their measurements.

3.3. Data Sources and Description

This paper utilizes panel data from 30 Chinese provinces during the period from 2011 to 2018. Due to data availability limitations, Tibet, Hong Kong, Macau, and Taiwan are excluded. There are two reasons for selecting this time period: Firstly, the COVID-19 pandemic has significantly affected the industrial economic operation from 2019 onwards, causing large-scale stagnation in production activities, severely disrupting the industrial chain cycle, and posing considerable difficulties for the production and operation of SMEs. Secondly, in 2019, China introduced a series of policies to promote industrial upgrading and green, low-carbon development, resulting in SMEs facing higher environmental protection standards and energy-saving requirements. The combination of these factors led to a phased sharp decline in the number of SMEs after 2018. To minimize the impact of outliers, this paper sets the time cutoff point at 2018.
The data sources for various variables are as follows: Carbon Emissions Data: Sourced from the database of the China Stock Market & Accounting Research (CSMAR). This database is highly authoritative and comprehensive in academic research, covering CE statistics in multiple dimensions, such as energy consumption and industrial production across various regions in China. It provides a reliable basis for accurately reflecting the CE levels of each province.
Digital Economy Level Data: Sourced from the Digital Financial Inclusion Index of China by the Institute of Digital Finance at Peking University. This index integrates several key indicators, including digital payments, digital lending, and digital wealth management, to holistically depict the development level of the DE in a region. We specifically use the digitization index because it focuses more on measuring the depth and breadth of digital technology applications in economic activities, which is highly relevant to our research topic.
Number of Newly Established SMMEs: Sourced from the tianyancha website. By using advanced search options, we precisely screened the number of newly created SMMEs with 20 to 1000 employees in 30 provinces from 2011 to 2018. This data source is not only highly timely and accurate but also helps us observe the development dynamics of SMMEs in different regions from a micro perspective. According to industrial classification standards, the number of newly established SMMEs in 30 provinces from 2011 to 2018 can be calculated based on the “number of insured persons” option.
Control variable data were extracted from multiple annual editions of the China Statistical Yearbook, an official government-compiled statistical compendium encompassing economy, society, and environment indicators. This standardized data infrastructure provides a robust foundation for model estimation accuracy.
To ensure the comparability of data and the accuracy of model estimation, we processed some data as follows: Dimensionless Processing of Digital Economy-Level Data: The digital economy-level data were processed using the power function method to eliminate the order of magnitude differences in the scale of the DE among different provinces, making the data more comparable.
Natural Logarithm Transformation of Other Variables: Other variables were transformed using their natural logarithms to make the distribution of variables closer to a normal distribution, reduce data skewness, and improve the efficiency and accuracy of model estimation. Additionally, the logarithm-transformed variables offer the convenience of elasticity interpretation, facilitating a deeper understanding of the research results.

4. Empirical Analysis

4.1. Descriptive Statistics of Variables

Table 2 displays the descriptive statistics calculated using Stata 17.0. Both TCE and CEI exhibit substantial inter-province variability (SD = 29.47 k and 1.68, respectively), whereas their within-group standard deviations are markedly lower (4.16 k and 0.35). This pattern highlights pronounced regional disparities in emission distributions. The expected value of the digital economy level is 263.53, with an overall standard deviation of 116.65 and a within-group standard deviation of 116.43. The data indicate substantial heterogeneity in the progression of the DE among different regions and throughout time, pointing to significant dispersion and volatility within individual provinces across different years. The CVs exhibit similar characteristics and highlight disparities in regional development. The between-group standard deviation for the entrepreneurship of SMMEs is 449.61, while the within-group standard deviation is 82.73. This demonstrates that the number of newly established SMMEs varies greatly between different provinces but changes less significantly within the same region over different years.

4.2. Regression Results and Analysis

The panel regression results, utilizing a two-way fixed-effects model, are reported in Table 3. Compared to baseline specifications (Models 1–2), Models 3–4 incorporating CVs demonstrate improved explanatory power. The negative regression coefficients for the digital economy level, observed both with and without CVs, substantiate hypotheses H1a and H1b. This indicates that the growth of the DE could aid regions in establishing a foundation for their green and low-carbon development and in reaching essential benchmarks for CE reduction. Moreover, an increment of 1% in the number of SMMEs is associated with an approximate increment of 0.081% in TCE and 0.076% in CEI. The entrepreneurship of SMMEs significantly boosts both TCE and CEI across all four models, supporting H2a and H2b. This suggests that while efforts have focused on enhancing innovation capabilities and total factor productivity in manufacturing enterprises, these improvements are not evident in newly established SMMEs, indicating a substantial challenge in their low-carbon development. What is more, it should be noted that the impact of the DE level is less pronounced than that of the entrepreneurship of SMMEs. Specifically, a 1% increase in the DE level is associated with a reduction of approximately 0.001% in TCE and 0.001% in CEI. In contrast, a 1% increase in the number of newly established SMMEs is associated with an increase of approximately 0.081% in TCE and 0.076% in CEI. This indicates that though DE has a positive influence on CE reduction, the impact of the entrepreneurship of SMMEs on CE is more obvious. Additionally, the regression coefficients for per capita GDP in all four models reveal a significant negative connection with both TCE and their CEI, highlighting China’s evolution from rapid economic growth towards high-quality development. It is worth mentioning that all models have VIF scores below 7, ruling out multicollinearity among variables.

4.3. Endogeneity Test

To alleviate endogeneity concerns caused by reverse causality or omitted variables and to more accurately pinpoint the net impacts of the aforementioned factors, this study adopts the number of R&D projects conducted by large-scale industrial enterprises in the region as an instrumental variable for the entrepreneurship of SMMEs. This instrumental variable meets the two basic requirements: relevance and exogeneity. For relevance, this variable involves the R&D investments of enterprises in new technologies, new products, and new processes, indicating the extent and proficiency of technological innovation activities within the region’s industrial sector. It is relevant to the entrepreneurship of SMMEs in various aspects, such as technological innovation, industrial competition, and regional division of labor. Regarding exogeneity, this variable exerts a minimal influence on TCE and CEI and does not directly affect the error term, thereby fulfilling the exogeneity condition. The 2SLS regression in Table 4 uses a selected instrumental variable. Stage 1 shows a significant positive link with the entrepreneurship of SMMEs, confirming the variable’s suitability. Stage 2 indicates the DE’s substantial reduction in TCE and CEI, contrasted with the significant increase in the entrepreneurship of SMMEs. These findings align with the baseline regression, reinforcing this paper’s conclusions.

4.4. Robustness Test

The paper uses four methods to assess the robustness of the findings: two-sided 1% winsorization, replacing the dependent variable (Table 5) [60], replacing the independent variable (Table 6), and deleting special samples (Table 7). Specifically, the paper uses a two-sided 1% winsorization method to deal with the variables of the digital economy level and the entrepreneurship of SMMEs, accounting for regional and temporal aspects. The dependent variable here is the natural logarithm of per capita CE, noted as (lnperC), and the independent variables are substituted with the natural logarithm of express business volume (lnpack) and the Digital Financial Inclusion Index (fi). The regression outcomes can be found in Table 5, Table 6 and Table 7. These outcomes are in close correspondence with the aforementioned findings, thereby reinforcing the dependability of the conclusions derived in this paper.

4.5. Heterogeneity Analysis

Taking into account the broad regional coverage and the diverse provincial features, this paper looks into the heterogeneity of the aforementioned impacts from four separate perspectives: economic development level, urbanization level, institutional quality, and industrial development history. The justification for selecting these four areas is outlined herein: (1) Economic development in a region is intimately connected to the DE’s growth, which indirectly encourages integrated development through increased [61]. (2) The accelerated development of the DE has notably transformed the urbanization process, opening up new avenues for urban modernization and technological innovation. (3) As a policy factor, the institutional quality can effectively promote regional green development [62]. (4) The industrial development history determines a region’s industrial base and manufacturing intensity and reflects the unevenness of regional development [63]. In the empirical analysis, the heterogeneity test is conducted by dividing the sample into two sub-samples based on per capita GDP, urbanization rate, marketization index, and whether the region is an industrial pilot area.

4.5.1. Economic Development Level

The level of economic development provides a nuanced view of a region’s capabilities in economy, society, and environment, allowing for clearer regional differentiation. As shown in the regression analysis in Table 8, provinces with higher levels of economic development see a significant reduction in TCE due to the DE, even though the effect on CEI is not substantial. Moreover, the entrepreneurship of SMMEs positively affects both TCE and CEI. However, in less economically developed areas, the influence of the DE and the entrepreneurship of SMMEs on CE reduction is statistically insignificant. This may be attributed to the presence of more intense market competition and a more developed DE in regions with higher economic development.

4.5.2. Urbanization Level

Higher levels of urbanization are usually associated with increased industrialization and higher traffic volumes, both of which can substantially influence regional CE and environmental challenges. Table 9 demonstrates that the DE significantly reduces CE in low-urbanization regions, underscoring that the swift expansion of information technology is pivotal for urban development. Moreover, the study indicates that in highly urbanized areas, the entrepreneurship of SMMEs positively affects both TCE and CEI in a significant manner. This may be because the input level of production factors in these regions is higher. To improve economic efficiency, enterprises increase production capacity and reduce environmental protection investments, leading to increased CE.

4.5.3. Institutional Quality

Good institutions play a vital role in addressing the effects of climate change, which can potentially influence the production decisions, resource allocation, and technological applications of enterprises. As shown in Table 10, regions with lower institutional quality are significantly adversely affected by the DE in terms of both TCE and CEI. This may be because these regions usually face resource shortages and inefficient utilization. In regions with lower institutional quality, the progress of the DE is likely to enhance resource allocation efficiency, minimize resource wastage, and thus decrease CE. Conversely, in areas with higher institutional quality, the entrepreneurship of SMMEs exhibits a significant positive correlation with both TCE and CEI. This may be because these regions generally have higher resource allocation efficiency. Startups in these regions can more easily obtain resources and technical support, and efficient resource allocation is usually accompanied by increased production, leading to higher CE.

4.5.4. Industrial Development History

The industrial development history of a region determines its industrial base and the density of its manufacturing sector, which can impact entrepreneurial activities. As shown by the data in Table 11, in non-industrial pilot areas, the DE exerts a significantly negative influence on both the TCE and CEI. Perhaps due to lower baseline CE and the DE’s efficiency boost in services and rural areas, this results in reduced regional CE. In contrast, in industrial pilot areas, the entrepreneurship of SMMEs demonstrates a significant positive correlation with both TCE and CEI. This observation is likely due to the high industrial density and substantial manufacturing base in these areas, resulting in a considerable baseline of CE. Additionally, the entrepreneurship of SMMEs in these areas fails to have a competitive advantage; even though they are at the heart of manufacturing transformation and upgrading, they commonly hold the lower end of the industrial chain, with a narrow scope for energy conservation and CE reduction.

4.6. Mediation Test

Using stepwise regression and Bootstrap approaches, this study evaluates the mediating role of the entrepreneurship of SMMEs between the DE and regional CE, with results presented in Table 12 and Table 13. Table 12 shows that the DE has significantly negative coefficients in Columns (1) and (3), indicating its effectiveness in reducing CE. In Columns (4) and (5), the DE again shows significant negative coefficients, while the entrepreneurship of SMMEs has a significant positive coefficient of 0.076, suggesting that although the DE reduces CEI, the entrepreneurship of SMMEs increases it. As shown in Table 13, the 95% Confidence Interval for the indirect influence of the entrepreneurship of SMMEs on this relationship does not include zero, implying a statistically significant indirect effect. This supports H3a, suggesting that the entrepreneurship of SMMEs fully mediates the relationship between the DE and TCE. However, the Confidence Interval for the direct effect does include zero, suggesting that the mediation effect may not be complete [64]. This implies that while the entrepreneurship of SMMEs significantly impacts the relationship between the DE and CEI, other factors may also be at play. In conclusion, the results demonstrate that the entrepreneurship of SMMEs partially mediates the relationship between DE and CEI, with a statistically significant indirect effect but an insignificant direct effect, thereby providing partial support for H3b.

5. Discussion

5.1. Theoretical Implications

This paper, based on an expanded STIRPAT model, considers various factors like population, industrial structure, economic growth, technological advancements, and external market openness. Firstly, this paper makes theoretical contributions by expanding the STIRPAT model through the novel inclusion of DE development and the entrepreneurship of SMMEs as key variables. By integrating these dimensions, the research not only broadens the analytical scope of the STIRPAT framework but also offers fresh insights into the interplay between digitalization and CE, extending the foundational work of Abu Karaki [31]. Secondly, the findings reveal a dual mechanism: DE positively affects the reduction of regional TCE and CEI, whereas the entrepreneurship of SMMEs negatively impacts the mitigation of both. This dual pathway enriches the theoretical understanding of how digital technologies interact with the entrepreneurship of SMMEs to shape environmental outcomes, thereby advancing the discourse initiated by Chen [65]. Thirdly, the entrepreneurship of SMMEs acts as a full mediator between the DE and TCE while serving as a partial mediator for its relationship with CEI. This finding indicates that low-carbon entrepreneurship is vital for regional sustainable development and that the government should enhance its low-carbon entrepreneurship capacity while supporting SMMEs to alleviate carbon emission reduction pressure [66]. Furthermore, cross-regional heterogeneity effects were found. This paper examines the heterogeneous effects under varying regional contexts, including economic development level, urbanization level, institutional quality, and industrial development history. The DE tends to have more positive effects on CE reduction in regions with lower urbanization levels and lower economic development levels. Conversely, in regions with higher economic development levels, urbanization levels, institutional quality, and industrial pilot areas, SMMEs’ entrepreneurship tends to have a negative effect on CE reduction. This paper adds differentiation to existing theories by emphasizing the contextual dependencies of digital-driven sustainability. These results collectively deepen the theoretical framework for analyzing the environmental implications of digital transformation in diverse socioeconomic settings.

5.2. Practical Implications

This study holds practical implications in three aspects. Firstly, it is suggested that developing countries give priority to developing digital infrastructure. They can promote low-carbon transitions by optimizing capital allocation across industries and implement region-specific digital policies in areas with lower urbanization levels to enhance CE reduction effects. Strengthening the cross-regional spillover effect of digital technology is also crucial, as it can help balance the spatial heterogeneity of CE reduction. Secondly, in terms of local sustainable development goals, this study suggests that the establishment of a collaborative system between the DE and low-carbon innovation is needed. For example, the energy structure of the manufacturing industry could be transformed via subsidizing low-carbon research and development. By integrating “digital infrastructure—low-carbon innovation—institutional adaptation” in a three-dimensional manner, the traditional “zero sum” dilemma between environmental protection and economic development can be overcome. This directly supports SDG 9 (Industry, Innovation and Infrastructure) and SDG 13 (Climate Action). Finally, it would be beneficial to guide the entrepreneurial activities of SMMEs towards low-carbon technology. These enterprises might take into account introducing carbon accounting systems. There is also a need to be watchful of the CE inequality that may be worsened by the “digital divide” between enterprises of different sizes. It is proposed that a digital CE reduction cooperation platform be established among enterprises.

5.3. Managerial Discussion

The findings of this study offer critical insights for policymakers and business leaders to navigate the dual challenges of digital transformation and carbon neutrality. For regional governments, prioritizing digital infrastructure in regions with lower urbanization and institutional quality can amplify the CE reduction benefits of the DE. Tailored policies, such as subsidies for SMEs adopting energy-efficient technologies or tax incentives for green startups, are essential to mitigate the carbon-intensive tendencies of the entrepreneurship of SMMEs. Additionally, establishing cross-regional carbon governance frameworks, where technologically advanced areas share digital solutions with underdeveloped regions, could harmonize emission reduction efforts.
For SMMEs, integrating low-carbon practices into business models is imperative. Entrepreneurs should leverage digital tools, such as AI-driven energy management systems or blockchain-enabled supply chain transparency, to minimize their environmental footprint while maintaining competitiveness. Firms in industrial pilot zones should adopt circular economy principles, transforming waste into resources through digital platforms.
At the institutional level, enhancing carbon accounting standards and creating a unified digital carbon regulatory ecosystem will ensure accountability. Policymakers should actively promote collaborative efforts between the public and private sectors to jointly fund R&D initiatives in green technologies, ensuring that digital advancements align with decarbonization goals. Through tackling regional inequalities and integrating sustainability into the core of entrepreneurship, stakeholders are able to tap into the combined potential of the DE and low-carbon transformations.

6. Conclusions

The DE fosters carbon mitigation and beneficially influences both TCE and CEI. It accomplishes this primarily through reducing energy consumption intensity, optimizing industrial structure, advancing technological progress, and empowering digital infrastructure. However, under the trend of the DE, entrepreneurship in SMMEs notably still elevates TCE and CEI, thereby posing substantial challenges to carbon reduction efforts. Therefore, the entrepreneurship of SMMEs should adopt an approach that integrates resources to enhance their digital and low-carbon capabilities while seeking competitive advantages through high-quality development. The entrepreneurship of SMMEs functions as an intermediary in the DE’s influence on CE. The widespread influence of the DE on human society is an irreversible trend. However, in the entrepreneurial process, SMMEs may encounter pressures such as funding and talent development, leading to the insufficient application of digital technologies. Targeted technical and management measures are needed to improve their digital capabilities and green innovation. Due to differences in regional economic development levels, urbanization levels, institutional quality, and industrial development history, the influence of the DE and entrepreneurship of SMMEs on CE exhibits significant heterogeneity. Government policies for carbon emission reduction should consider these heterogeneous constraints to achieve dual carbon targets. In entrepreneurship, SMMEs should adapt to local conditions, seize opportunities for digital economic development, and enhance digital and low-carbon entrepreneurship capabilities. Despite being at a comparative disadvantage in the digital and low-carbon development process, SMEs and startups possess considerable potential for CE reduction. It is essential to establish scientifically sound incentive and constraint mechanisms to advance the integration of digitalization and sustainable development.
This paper employs an extended version of the STIRPAT model, introducing two new variables: the digital economy level and the entrepreneurship of SMMEs. By considering a multitude of factors, including population, industrial structure, economic development, technological advancements, and openness, this paper expands the application boundaries of the STIRPAT model and enriches the research on environmental impact assessment, the DE, and the low-carbon economy. Furthermore, it offers profound insights into the digital and low-carbon practices of SMEs and startups. The paper clarifies how the entrepreneurship of SMMEs affects regional CE in the context of the DE, revealing the complex dynamics behind the DE’s role in carbon reduction. It serves as both a theoretical foundation for exploring CE reduction strategies in the DE era and provides theoretical backing for a deeper dive into how startups and SMEs can adapt to digital economic trends and adopt integrated digital and low-carbon development strategies. Additionally, this study clarifies the heterogeneous influence of the DE level and the entrepreneurship of SMMEs on CE across diverse regional contexts, such as economic development level, urbanization level, institutional quality, and industrial development history. These discoveries contribute to a more comprehensive research backdrop for theoretical investigations into the DE, low-carbon economy, SMEs, and entrepreneurship, thereby extending and broadening the application of the STIRPAT model.
Restricted by data and time, further investigation is necessary to resolve the limitations of this study. First, this paper employs the number of newly established SMMEs as the sole metric for evaluating the entrepreneurship of SMMEs. In the future, a comprehensive indicator system may be adopted to better assess the entrepreneurial behavior of SMMEs at the micro level. Second, due to data availability, we could only analyze the panel data from 2011 to 2018, which represents a relatively short observation period. Finally, it is worth mentioning that this study centers exclusively on the Chinese context. Given that the data originate from a single country, the robustness and validity of the research findings may not be fully guaranteed. So, future research should include multi-economy comparative analyses to improve result robustness and applicability.

Author Contributions

Conceptualization, J.T. and R.L.; Methodology, J.T.; Software, Q.T.; Validation, J.L. and R.L.; Formal Analysis, J.T. and J.L.; Investigation, J.L.; Resources, J.T.; Data Curation, R.L. and Q.T.; Writing—Original Draft Preparation, J.L. and R.L.; Writing—Review and Editing, J.T. and R.L.; Visualization, R.L. and J.L.; Supervision, J.T.; Project Administration, Q.T.; Funding Acquisition, J.T. All authors have read and agreed to the published version of the manuscript.

Funding

This research was supported by the Beijing Municipal Education Commission Research Program (SM20191001107, PXM2019-014213-000007).

Institutional Review Board Statement

Not applicable.

Informed Consent Statement

Not applicable.

Data Availability Statement

Restrictions apply to the availability of these data. Data were obtained from tianyancha and CSMAR and are available at https://www.tianyancha.com/ (accessed on 30 October 2024) and https://data.csmar.com/ (accessed on 30 October 2024) with the permission of tianyancha and CSMAR.

Conflicts of Interest

The authors declare no conflicts of interest.

References

  1. Tan, N.N.; Ngan, H.T.T.; Hai, N.S.; Anh, L.H. The Impact of Digital Transformation on the Economic Growth of the Countries. In Prediction and Causality in Econometrics and Related Topics; Ngoc Thach, N., Ha, D.T., Trung, N.D., Kreinovich, V., Eds.; Springer International Publishing: Cham, Switzerland, 2022; pp. 670–680. [Google Scholar]
  2. Kormaniková, E.; Senková, A. Analysis of the Implementation of the Sustainable Development Goals (SDGs) in V4 Countries and Their Impact on Competitiveness. Polish J. Environ. Stud. 2024, 33, 5757–5766. [Google Scholar] [CrossRef] [PubMed]
  3. Shrimali, G. Making India’s Power System Clean: Retirement of Expensive Coal Plants. Energy Policy 2020, 139, 111305. [Google Scholar] [CrossRef]
  4. Nordhaus, W. Climate Change: The Ultimate Challenge for Economics. Am. Econ. Rev. 2019, 109, 1991–2014. [Google Scholar] [CrossRef]
  5. Sun, P.S.; Nisar, U.; Qiao, Z.Y.; Ahmad, S.; Kathuria, K.; Al Bahir, A.; Ahmad, M. Digital economy, technology, and urban carbon emissions nexus: An investigation using the threshold effects and mediation effects tests. Front. Environ. Sci. 2024, 12, 1454256. [Google Scholar] [CrossRef]
  6. Wang, J.; Dong, K.; Dong, X.; Taghizadeh-Hesary, F. Assessing the Digital Economy and Its Carbon-Mitigation Effects: The Case of China. Energy Econ. 2022, 113, 14. [Google Scholar] [CrossRef]
  7. Acemoglu, D.; Aghion, P.; Bursztyn, L.; Hemous, D. The Environment and Directed Technical Change. Am. Econ. Rev. 2012, 102, 131–166. [Google Scholar] [CrossRef]
  8. Tan, L.; Gao, D.; Liu, X. Can Environmental Information Disclosure Improve Energy Efficiency in Manufacturing? Evidence from Chinese Enterprises. Energies 2024, 17, 2342. [Google Scholar] [CrossRef]
  9. Zhang, H.K.; Wu, J.C.; Mei, Y.; Hong, X.Y. Exploring the relationship between digital transformation and green innovation: The mediating role of financing modes. J. Environ. Manag. 2024, 356, 120558. [Google Scholar] [CrossRef]
  10. Barrage, L. Optimal Dynamic Carbon Taxes in a Climate–Economy Model with Distortionary Fiscal Policy. Rev. Econ. Stud. 2019, 87, 1–39. [Google Scholar] [CrossRef]
  11. Shapiro, J.S. The Environmental Bias of Trade Policy. Q. J. Econ. 2020, 136, 831–886. [Google Scholar] [CrossRef]
  12. Bui Minh, T.; Nguyen Ngoc, T.; Bui Van, H. Relationship between Carbon Emissions, Economic Growth, Renewable Energy Consumption, Foreign Direct Investment, and Urban Population in Vietnam. Heliyon 2023, 9, e17544. [Google Scholar] [CrossRef] [PubMed]
  13. Galeotti, M.; Salini, S.; Verdolini, E. Measuring environmental policy stringency: Approaches, validity, and impact on environmental innovation and energy efficiency. Energy Policy 2020, 136, 111052. [Google Scholar] [CrossRef]
  14. Yi, M.; Liu, Y.F.; Sheng, M.S.; Wen, L. Effects of Digital Economy on Carbon Emission Reduction: New Evidence from China. Energy Policy 2022, 171, 19. [Google Scholar] [CrossRef]
  15. Yin, S.; Yu, Y.Y. An Adoption-Implementation Framework of Digital Green Knowledge to Improve the Performance of Digital Green Innovation Practices for Industry 5.0. J. Clean. Prod. 2022, 363, 132608. [Google Scholar] [CrossRef]
  16. Duan, L.; Sun, W.; Zheng, S. Transportation network and venture capital mobility: An analysis of air travel and high-speed rail in China. J. Transp. Geogr. 2020, 88, 102852. [Google Scholar] [CrossRef]
  17. Zhuo, R.; Zhang, Y.; Zheng, J. Digitalization transformation and enterprise green innovation: Empirical evidence from Chinese listed companies. Front. Environ. Sci. 2024, 12, 1361576. [Google Scholar] [CrossRef]
  18. Bo, Q.; Liu, H.; Zheng, J. Research on the Mechanism of the Green Innovation of Enterprises Empowered by Digital Technology from the Perspective of Value Co-Creation. Sustainability 2024, 16, 9065. [Google Scholar] [CrossRef]
  19. Wang, S.; Song, Y.; Min Du, A.; Liang, J. The digital economy and entrepreneurial dynamics: An empirical analysis of urban regions in China. Res. Int. Bus. Financ. 2024, 71, 102459. [Google Scholar] [CrossRef]
  20. Yang, D.; Yang, Z.; Wu, H. Effects and mechanisms of digital economy development on corporate carbon emission intensity: Empirical evidence from cross-country data. Digit. Econ. Sustain. Dev. 2025, 3, 3. [Google Scholar] [CrossRef]
  21. Li, Z.; Wang, J. The Dynamic Impact of Digital Economy on Carbon Emission Reduction: Evidence City-level Empirical Data in China. J. Clean. Prod. 2022, 351, 131570. [Google Scholar] [CrossRef]
  22. Liu, M.; Zhao, J.; Liu, H. Digital transformation, employee and executive compensation, and sustained green innovation. Int. Rev. Financ. Anal. 2025, 97, 103873. [Google Scholar] [CrossRef]
  23. Gao, D.; Tan, L.; Duan, K. Forging a path to sustainability: The impact of Fintech on corporate ESG performance. Eur. J. Financ. 2024, 1–19. [Google Scholar] [CrossRef]
  24. Zhang, J.N.; Lyu, Y.W.; Li, Y.T.; Geng, Y. Digital Economy: An Innovation Driving Factor for Low-Carbon Development. Environ. Impact Assess. Rev. 2022, 96, 15. [Google Scholar] [CrossRef]
  25. Tapscott, D. The Digital Economy: Promise and Peril in the Age of Networked Intelligence. Educom. Rev. 1996, 10, 342. [Google Scholar] [CrossRef]
  26. Yin, S.; Gao, Z.; Mahmood, T. Artificial Intelligence-Driven Bioenergy System: Digital Green Innovation Partner Selection of Bioenergy Enterprises Based on Interval Fuzzy Field Model. Kybernetes 2023, 54, 1344–1372. [Google Scholar] [CrossRef]
  27. Safi, A.; Kchouri, B.; Elgammal, W.; Nicolas, M.K.; Umar, M. Bridging the Green Gap: Do Green Finance and Digital Transformation Influence Sustainable Development? Energy Econ. 2024, 134, 107566. [Google Scholar] [CrossRef]
  28. Zhang, C.; Fang, J.; Ge, S.; Sun, G. Research on the Impact of Enterprise Digital Transformation on Carbon Emissions in the Manufacturing Industry. Int. Rev. Econ. Financ. 2024, 92, 211–227. [Google Scholar] [CrossRef]
  29. Cheng, Y.; Zhang, Y.; Wang, J.J.; Jiang, J.X. The Impact of the Urban Digital Economy on China’s Carbon Intensity: Spatial Spillover and Mediating Effect. Res. Conserv. Recycl. 2023, 189, 106762. [Google Scholar] [CrossRef]
  30. Li, G.C.; Wei, W.X. Financial Development, Openness, Innovation, Carbon Emissions, and Economic Growth in China. Energy Econ. 2021, 97, 105194. [Google Scholar] [CrossRef]
  31. Abu Karaki, B.; Al-kasasbeh, O.; Alassuli, A.; Alzghoul, A. The Impact of the Digital Economy on Carbon Emissions Using the Stirpat Model. Int. J. Energy Econ. Pol. 2023, 13, 139–143. [Google Scholar] [CrossRef]
  32. Yu, H.Y.; Wei, W.; Li, J.H.; Li, Y. The Impact of Green Digital Finance on Energy Resources and Climate Change Mitigation in Carbon Neutrality: Case of 60 Economies. Resour. Pol. 2022, 79, 103116. [Google Scholar] [CrossRef]
  33. Bai, L.; Guo, T.R.; Xu, W.; Liu, Y.B.; Kuang, M.; Jiang, L. Effects of Digital Economy on Carbon Emission Intensity in Chinese Cities: A Life-Cycle Theory and the Application of Non-Linear Spatial Panel Smooth Transition Threshold Model. Energy Policy 2023, 183, 113792. [Google Scholar] [CrossRef]
  34. Sun, Y.A.; You, X.T. Do Digital Inclusive Finance, Innovation, and Entrepreneurship Activities Stimulate Vitality of the Urban Economy? Empirical Evidence from the Yangtze River Delta, China. Technol. Soc. 2023, 72, 102200. [Google Scholar] [CrossRef]
  35. Yin, S.; Zhao, Y. Digital Green Value Co-Creation Behavior, Digital Green Network Embedding and Digital Green Innovation Performance: Moderating Effects of Digital Green Network Fragmentation. Humanit. Soc. Sci. Commun. 2024, 11, 228. [Google Scholar] [CrossRef]
  36. Wang, M.; Zhu, X.; Yin, S. Spatial–Temporal Coupling Coordination and Interaction between Digitalization and Traditional Industrial Upgrading: A Case Study of the Yellow River Basin. Sci. Rep. 2023, 13, 17997. [Google Scholar] [CrossRef] [PubMed]
  37. Gao, D.; Zhou, X.; Wan, J. Unlocking Sustainability Potential: The Impact of Green Finance Reform on Corporate Esg Performance. Corp. Soc. Responsib. Environ. Manag. 2024, 31, 4211–4226. [Google Scholar] [CrossRef]
  38. Kuang, Y.; Fan, Y.; Bin, J.; Fan, M. Impact of the Digital Economy on Carbon Dioxide Emissions in Resource-Based Cities. Sci. Rep. 2024, 14, 16514. [Google Scholar] [CrossRef]
  39. Gao, D.; Feng, H.; Cao, Y. The Spatial Spillover Effect of Innovative City Policy on Carbon Efficiency: Evidence from China. Singap. Econ. Rev. 2024, 1–23. [Google Scholar] [CrossRef]
  40. Romero, I.; Mammadov, H. Digital Transformation of Small and Medium-Sized Enterprises as an Innovation Process: A Holistic Study of its Determinants. J. Knowl. Econ. 2024, 52, 96–120. [Google Scholar] [CrossRef]
  41. Meng, B.; Liu, Y.; Andrew, R.; Zhou, M.; Hubacek, K.; Xue, J.; Peters, G.; Gao, Y. More Than Half of China’s Co2 Emissions Are from Micro, Small and Medium-Sized Enterprises. Appl. Energy 2018, 230, 712–725. [Google Scholar] [CrossRef]
  42. Tan, Q.; Tan, J. Analysis of the Carbon Emission Law of the Transportation Industry in Beijing Based Oninput-Output Model. Ecolog. Econ. 2016, 32, 73–78. [Google Scholar] [CrossRef]
  43. Li, Z.; Miao, S.; Xu, L. Digital transformation and environmental, social, and governance greenwashing: Evidence from China. J. Environ. Manag. 2024, 365, 121460. [Google Scholar] [CrossRef]
  44. Xu, P.Y. Micro, Small and Medium-Sized Enterprises (Msmes) Have Exceeded 52 Million. People’s Daily Overseas Edition, 20 June 2023; p. 011. [Google Scholar]
  45. Elia, G.; Margherita, A.; Passiante, G. Digital entrepreneurship ecosystem: How digital technologies and collective intelligence are reshaping the entrepreneurial process. Technol. Forecast. Soc. Chang. 2020, 150, 119791. [Google Scholar] [CrossRef]
  46. Wang, Y.; Zhao, Z.; Zhang, S.; Su, Y. Research on the impact of digital inclusive finance on regional carbon emissions: Based on the sustainable green innovation of small and medium-sized enterprises. J. Clean. Prod. 2023, 428, 139513. [Google Scholar] [CrossRef]
  47. Ehrlich, P.R.; Holdren, J.P. Impact of Population Growth. Science 1971, 171, 1212–1217. [Google Scholar] [CrossRef]
  48. Pei, H.F.; Chen, J.R. Research on the Relationship between Technological Innovation and Carbon Productivity Based on Provincial Panel Data. Rev. Econ. Manag. 2023, 39, 109–119. [Google Scholar] [CrossRef]
  49. Liu, J.; Yang, Y.J.; Zhang, S.F. Research on the Measurement and Driving Factors of China’s Digital Economy. Shanghai J. Econ. 2020, 6, 81–96. [Google Scholar] [CrossRef]
  50. Guo, F.; Wang, J.Y.; Wang, F.; Kong, T.; Zhang, X.; Cheng, Z.Y. Measuring China’s Digital Financial Inclusion: Index Compilation and Spatial Characteristics. China Econ. Quart. 2020, 19, 1401–1418. [Google Scholar] [CrossRef]
  51. Wang, H.; Dong, Z.Q. How China’s Industrial Intelligence Is Reshaping the Distribution of Manufacturing Enterprises. Seek. Truth 2022, 49, 84–93. [Google Scholar] [CrossRef]
  52. Yan, Q.W.; Da, T.F.; Du, X.Y. Digital Financial Inclusion and Shared Prosperity—Empirical Evidence and Analyses from Entrepreneurial Activism. Wuhan Financ. 2023, 5, 70–81. [Google Scholar] [CrossRef]
  53. Lin, S.; Winkler, C.; Wang, S.; Chen, H. Regional Determinants of Poverty Alleviation through Entrepreneurship in China. Entrep. Reg. Devel. 2019, 32, 41–62. [Google Scholar] [CrossRef]
  54. Shao, S.; Zhang, K.; Dou, J.M. Effects of Economic Agglomeration on Energy Saving and Emission Reduction: Theoryand Empirical Evidence from China. J. Manag. World 2019, 35, 36–60+226. [Google Scholar] [CrossRef]
  55. Xiong, H.; Jiang, P.; Ju, C.; Peng, K.L. The Mechanism Underlying Farmers’spontaneous Land Transfer: Simulation, Validation and Application. J. Manag. World 2023, 39, 71–85+99+86-89. [Google Scholar] [CrossRef]
  56. Chishti, M.Z.; Alam, N.; Murshed, M.; Rehman, A.; Balsalobre-Lorente, D. Pathways Towards Environmental Sustainability: Exploring the Influence of Aggregate Domestic Consumption Spending on Carbon Dioxide Emissions in Pakistan. Environ. Sci. Pollut. Res. 2022, 29, 45013–45030. [Google Scholar] [CrossRef]
  57. Yin, C.Y.; Sun, S.Q.; Chen, M.M. The High-Quality Patent Development Trend and Driving Mechanism of Technological Innovation. J. Intell. 2022, 41, 70–76+97. [Google Scholar] [CrossRef]
  58. Ding, F.L. Effects of Digital Inclusive Finance on Carbon Intensity of China. Wuhan Univ. J. (Philos. Soc. Sci.) 2022, 75, 110–120. [Google Scholar] [CrossRef]
  59. Wang, J.M.; Yu, Z.L. Multiple Heterogeneity of Carbon Emission Reduction Driven by Low?Carbon Technology Progress in Resource-Based Cities. China Popul. Res. Env. 2022, 32, 156–170. [Google Scholar] [CrossRef]
  60. Wu, F.; Hu, H.Z.; Lin, H.Y.; Ren, X.Y. Corporate Digital Transformation and Capital Market Performance—Empirical Evidence from Equity Liquidity. J. Manag. World 2021, 37, 130–144+110. [Google Scholar] [CrossRef]
  61. Gu, J.; Liu, Z. A study of the coupling between the digital economy and regional economic resilience: Evidence from China. PLoS ONE 2024, 19, e0296890. [Google Scholar] [CrossRef]
  62. Sun, X.; Meng, Z.; Zhang, X.; Wu, J. The role of institutional quality in the nexus between green financing and sustainable development. Res. Int. Bus. Financ. 2025, 73, 102531. [Google Scholar] [CrossRef]
  63. Chen, X.Q.; Liu, X.W.; Zhu, Q.Y. Comparative analysis of total factor productivity in China’s high-tech industries. Technol. Forecast. Soc. Change 2022, 175, 121332. [Google Scholar] [CrossRef]
  64. Hayes, A.F. Introduction to Mediation, Moderation, and Conditional Process Analysis: A Regression-Based Approach; Guilford Press: New York, NY, USA, 2013; p. xvii, 507. [Google Scholar]
  65. Chen, M.; Zhao, S.; Wang, J. The Impact of the Digital Economy on Regional Carbon Emissions: Evidence from China. Sustainability 2023, 15, 14863. [Google Scholar] [CrossRef]
  66. Ge, W.; Xu, Y.; Liu, G.; Shen, B.; Su, X.; Liu, L.; Yang, X.; Ran, Q. Exploring the Impact of the Digital Economy on Carbon Emission Efficiency under Factor Misallocation Constraints: New Insights from China. Front. Environ. Sci. 2022, 10, 953070. [Google Scholar] [CrossRef]
Figure 1. Research conceptual model.
Sustainability 17 02133 g001
Figure 2. Structural framework. (Source(s): Authors’ work).
Sustainability 17 02133 g002
Table 1. Definitions of variables.
VariableSymbolMeasurementUnitRef.
Dependent variablesTotal carbon emissionslnTCTotal carbon emissions in each region10,000 tons[48]
Carbon emission intensitylnCICarbon emissions per unit of GDP in each regiontons/10,000 RMB
Independent variablesDigital economy levelDLDigitization index/[50]
Mediating/Independent variablesEntrepreneurship of SMMEslnmanuNumber of newly established SMMEsNo.[53]
Control Variables (CVs)Urbanization ratelnurbanUrban population/total population%[55]
Per capita GDPlnperGDPper capita GDP in each region100 million RMB/10,000 people[56]
PatentslnpatentNumber of patent applications/total populationunits/10,000 people[57]
Degree of opennesslnEDTotal import and export value10,000 USD[58]
Industrial structurelninstruTertiary industry/total GDP of the region%[59]
Table 2. Descriptive statistics of variables.
VariableExpected ValueSDMin.Max.
TCOverall42,319.9429,467.644885.54149,307.00
Between29,610.005909.02131,885.00
Within4155.6120,520.1659,741.87
CIOverall2.351.680.388.25
Between1.670.567.52
Within0.351.133.79
DLOverall263.53116.657.58453.66
Between7.22250.91286.12
Within116.4315.27450.46
manuOverall297.70450.645.00274 6
Between449.6114.382028.88
Within82.73−156.181014.83
urbanOverall57.1112.3034.9689.60
Between12.1641.1188.64
Within2.8050.9663.52
perGDPOverall52,817.8424,792.2616,413.00140,211.20
Between23,230.1225,773.27107,209.50
Within9530.1027,266.3185,819.55
patentOverall18.0219.891.2998.06
Between18.683.4368.56
Within7.56−11.9250.98
EDOverall13,500,00021,900,00066,839109,000,000
Between22,200,000125,543102,000,000
Within2,037,6043,123,61722,900,000
instruOverall45.489.5429.7081.00
Between8.4537.5378.61
Within4.6633.9955.50
Table 3. Regression results of DE, entrepreneurship of SMMEs, and CE.
Model (1)
lnTC
Model (2)
lnCI
Model (3)
lnTC
Model (4)
lnCI
DL−0.001 ***
(0.000)
−0.002 ***
(0.000)
−0.001 **
(0.000)
−0.001 **
(0.000)
lnmanu0.074 ***
(0.023)
0.076 **
(0.034)
0.081 ***
(0.028)
0.076 ***
(0.025)
lnurban 0.267
(0.353)
0.398
(0.368)
lnperGDP −0.282
(0.176)
−1.311 ***
(0.171)
lnpatent 0.019
(0.046)
0.008
(0.045)
lnED 0.010
(0.048)
0.014
(0.044)
lninstru −0.449 *
(0.240)
−0.397
(0.238)
Constant10.045 ***
(0.127)
0.601 ***
(0.183)
13.365 ***
(2.284)
13.986 ***
(2.355)
Time fixed effect (TFE)
Region fixed effect (RFE)
N240240240240
Adjusted-R20.1620.7410.1980.870
F8.18931.25615.97988.535
Note: The symbols ***, **, and * correspond to significance at the 0.01, 0.05, and 0.1 levels. Values in parentheses are standard errors,”√” means “YES”, respectively.
Table 4. Results of endogeneity test.
VariableStage 1Stage 2
Model (1)
lnmanu
Model (2)
lnTC
Model (3)
lnCI
Instrumental0.141 **
(0.052)
DL−0.001
(0.001)
−0.001 **
(0.000)
−0.001 *
(0.000)
lnmanu 0.183 **
(0.072)
0.183 ***
(0.070)
Constant−8.654 **
(4.230)
14.310 ***
(2.224)
14.970 ***
(2.256)
CV
TFE
RFE
N240240240
Adjusted-R20.386
Within-R2 0.1730.865
F19.486
Note: The symbols ***, **, and * correspond to significance at the 0.01, 0.05, and 0.1 levels. Values in parentheses are standard errors, “√” means “YES”, respectively.
Table 5. Results of robustness test (1).
Variable1% WinsorizationDependent Variable lnperC Replaced
Model (1)
lnTC
Model (2)
lnCI
Model (3)
DL−0.001 ***
(0.000)
−0.001 **
(0.000)
−0.001 **
(0.000)
lnmanu0.091 ***
(0.028)
0.084 ***
(0.025)
0.074 ***
(0.025)
Constant13.666 ***
(2.176)
14.304 ***
(2.277)
4.971 **
(2.324)
CV
TFE
RFE
N210210240
Adjusted-R20.2310.8790.143
F9.91661.2469.215
Note: The symbols *** and ** correspond to significance at the 0.01 and 0.05 levels. Values in parentheses are standard errors, “√” means “YES”, respectively.
Table 6. Results of robustness test (2).
VariableCore Independent Variable Replaced with lnpackCore Independent Variable Replaced with fi
Model (1)
lnTC
Model (2)
lnCI
Model (3)
lnTC
Model (4)
lnCI
lnpack−0.067 *
(0.038)
−0.063 *
(0.033)
fi 0.006 ***
(0.002)
0.005 **
(0.002)
lnmanu0.083 ***
(0.027)
0.078 ***
(0.024)
0.083 ***
(0.029)
0.078 ***
(0.025)
Constant13.453 ***
(2.231)
14.053 ***
(2.307)
13.544 ***
(2.284)
14.141 ***
(2.344)
CV
TFE
RFE
N240240240240
Adjusted-R20.1920.8700.1820.868
F6.99571.8125.262147.424
Note: The symbols ***, **, and * correspond to significance at the 0.01, 0.05, and 0.1 levels. Values in parentheses are standard errors, “√” means “YES”, respectively.
Table 7. Results of robustness test (3).
VariableRisk Factor Samples DeletedMunicipality Samples Deleted
Model (1)
lnTC
Model (2)
lnCI
Model (3)
lnTC
Model (4)
lnCI
DL−0.001 ***
(0.000)
−0.001 **
(0.000)
−0.001 **
(0.000)
−0.001 **
(0.000)
lnmanu0.089 ***
(0.027)
0.083 ***
(0.025)
0.081 ***
(0.028)
0.076 ***
(0.025)
Constant13.712 ***
(2.194)
14.351 ***
(2.293)
13.365 ***
(2.284)
13.986 ***
(2.355)
CV
TFE
RFE
N210210240240
Adjusted-R20.2310.8790.1980.870
F9.85261.10415.97988.535
Note: The symbols *** and ** correspond to significance at the 0.01 and 0.05 levels. Values in parentheses are standard errors, “√” means “YES”, respectively.
Table 8. Heterogeneity analysis—economic development level.
VariableHigher Economic Development LevelLower Economic Development Level
Model (1)
lnTC
Model (2)
lnCI
Model (3)
lnTC
Model (4)
lnCI
DL−0.000 **
(0.000)
−0.000
(0.000)
−0.001
(0.001)
−0.001
(0.001)
lnmanu0.052 **
(0.024)
0.057 **
(0.025)
0.036
(0.047)
0.021
(0.039)
Constant13.898 ***
(2.664)
14.223 ***
(3.006)
16.978 ***
(5.419)
17.829 ***
(4.850)
CV
TFE
RFE
N120120120120
Adjusted-R20.4650.9200.1490.863
F44.443187.872505.349185 0.262
Note: The symbols *** and ** correspond to significance at the 0.01 and 0.05 levels. Values in parentheses are standard errors, “√” means “YES”, respectively.
Table 9. Heterogeneity analysis—urbanization level.
VariableHigher Urbanization LevelLower Urbanization Level
Model (1)
lnTC
Model (2)
lnCI
Model (3)
lnTC
Model (4)
lnCI
DL−0.000 *
(0.000)
−0.000
(0.000)
−0.001 **
(0.000)
−0.001 **
(0.000)
lnmanu0.057 **
(0.020)
0.065 ***
(0.021)
−0.003
(0.035)
−0.013
(0.033)
Constant12.953 ***
(2.897)
13.619 ***
(3.182)
25.374 ***
(3.971)
24.799 ***
(3.799)
CV
TFE
RFE
N120120120120
Adjusted-R20.4150.9260.4520.897
F134.520193.44652.759497.727
Note: The symbols ***, **, and * correspond to significance at the 0.01, 0.05, and 0.1 levels. Values in parentheses are standard errors, “√” means “YES”, respectively.
Table 10. Heterogeneity analysis—institutional quality.
VariableHigher Institutional QualityLower Institutional Quality
Model (1)
lnTC
Model (2)
lnCI
Model (3)
lnTC
Model (4)
lnCI
DL0.000
(0.000)
0.000
(0.000)
−0.001 **
(0.000)
−0.001 **
(0.000)
lnmanu0.083 ***
(0.022)
0.091 ***
(0.019)
0.062
(0.057)
0.044
(0.049)
Constant14.521 ***
(1.573)
14.909 ***
(1.738)
8.159
(5.084)
9.971 *
(4.818)
CV
TFE
RFE
N120120120120
Adjusted-R20.3340.9370.2530.785
F12.135123 4.426443.349273.643
Note: The symbols ***, **, and * correspond to significance at the 0.01, 0.05, and 0.1 levels. Values in parentheses are standard errors, “√” means “YES”, respectively.
Table 11. Heterogeneity analysis—industrial development history.
VariableNon-Industrial Pilot AreaIndustrial Pilot Area
Model (1)
lnTC
Model (2)
lnCI
Model (3)
lnTC
Model (4)
lnCI
DL0.000
(0.001)
0.000
(0.001)
−0.001 **
(0.000)
−0.001 **
(0.000)
lnmanu0.100 ***
(0.030)
0.111 ***
(0.030)
0.063
(0.046)
0.046
(0.039)
Constant12.738 ***
(2.979)
13.578 ***
(3.392)
15.743 ***
(3.551)
16.994 ***
(3.223)
CV
TFE
RFE
N8888152152
Adjusted-R20.2890.9300.2000.844
F 63.36848.170
Note: The symbols *** and ** correspond to significance at the 0.01 and 0.05 levels. Values in parentheses are standard errors, “√” means “YES”, respectively.
Table 12. Regression results of mediation effect.
VariableTClnmanuTCCICI
Model (1)Model (2)Model (3)Model (4)Model (5)
DL−0.001 ***
(0.000)
−0.001
(0.001)
−0.001 **
(0.000)
−0.001 **
(0.000)
−0.001 *
(0.000)
lnmanu 0.081 ***
(0.028)
0.076 **
(0.025)
Constant12.615 ***
(2.423)
−9.258
(5.035)
13.365 ***
(2.283)
13.279 ***
(2.500)
13.986 ***
(2.355)
CV
TFE
RFE
N240240240240240
F4.9815.2515.9854.4715.98
Note: The symbols ***, **, and * correspond to significance at the 0.01, 0.05, and 0.1 levels. Values in parentheses are standard errors, “√” means “YES”, respectively.
Table 13. Test results of Bootstrap mediation effect.
95% Confidence IntervalSignificance
EffectPathEstimateUncorrectedBias-Corrected
Lower LimitUpper LimitedLower LimitUpper Limited
DirectDL-TC0.00060.00020.0010.00020.001Significant
DL-CI0.00020.000030.00050.000020.0005Insignificant
IndirectDL-TC0.0005−0.00020.001−0.00020.001Significant
DL-CI−0.0005−0.001−0.00001−0.001−0.00001Insignificant
Disclaimer/Publisher’s Note: The statements, opinions and data contained in all publications are solely those of the individual author(s) and contributor(s) and not of MDPI and/or the editor(s). MDPI and/or the editor(s) disclaim responsibility for any injury to people or property resulting from any ideas, methods, instructions or products referred to in the content.

