Abstract
To ascertain the impact of climate change on risk spillovers in energy markets, the vector autoregressive (VAR) model and the impulse response function (IRF) were utilized to analyze risk spillover effects in China’s energy markets between 2007 and 2023. The findings indicated that the risk spillover from climate change in China’s energy markets is characterized by asymmetric and time-varying characteristics. A substantial degree of heterogeneity exists among distinct energy markets. Climate physical risk has a detrimental effect on risk spillovers in energy markets, while transition risk has a positive impact on risk spillover in fuel, LPG, and natural gas markets, and a negative effect on risk spillover in alcohol, gasoline, and diesel markets.
1. Introduction
In the twenty-first century, the frequency of extreme weather events has posed a direct threat to the survival of the human environment and has also had an unprecedented impact on the stability of the global economic system, particularly the energy market [1]. A substantial corpus of research has demonstrated that climate change has become one of the most pressing challenges confronting the global community. Climate change has far-reaching implications for risk spillovers in energy markets. Risk spillover is defined as the transmission of risk from one market to other institutions or markets through related operations or inter-market linkages. Extreme climate change affects energy supply and demand and energy market transformations, which in turn affects energy market risk spillovers [2]. On the one hand, the increased frequency of extreme weather events has led to a rise in energy demand, which in turn has triggered an imbalance between energy supply and demand as well as large fluctuations in energy prices [3]. On the other hand, persistent climate change has prompted governments to implement stringent emission reduction policies and to promote the energy transition, which in turn has affected risk spillovers in energy markets [4]. Consequently, a comprehensive examination of the interplay between climate change and its repercussions on the energy market is imperative to ensure its stability.
As the world’s largest energy consumer and carbon emitter, China has a highly sophisticated and complex energy market. In recent years, the frequency and intensity of extreme weather events in China have significantly increased, further exacerbating the risk of spillover effects within the energy market [5,6]. Moreover, China’s energy market volatility exerts a substantial influence on the domestic economy, as well as on the global energy market through international trade and financial channels [7]. Therefore, this paper focuses on the impact of climate change on risk spillovers in China’s energy markets, identifying how different types of risks (physical and transition risks) affect market stability.
We used the vector autoregressive (VAR) model and impulse response function (IRF) to analyze risk spillover effects in China’s energy markets between 2007 and 2023 and found that the risk spillover from climate change of China’s energy markets is asymmetric and time-varying. Clear heterogeneity exists between various energy markets: alcohol, gasoline, and diesel markets play the role of net spillovers, fuel and LPG markets play the role of spillover recipients, with risk spillover fluctuating between −20% and 25%. Risks posed by climate change can be categorized into physical and transition risks. Physical risk negatively impacts risk spillover in energy markets, but the impact of transition risk shows a different result. Transition risk positively impacts risk spillover in fuel, LPG, and natural gas markets, and negatively impacts risk spillover in alcohol, gasoline, and diesel markets.
This paper makes a significant contribution to the extant literature in several ways. Firstly, it explores the impact of climate change on risk spillovers in energy markets in terms of both physical risk and transition risk dimensions. This expands the perspective of existing studies that focus on transition risk. For example, Liu, Z. et al. analyzed the impact of climate policy uncertainty on risk spillovers between energy markets. In contrast, this paper further complements the physical risk dimension [4]. Secondly, this paper utilizes extensive energy market data encompassing various sectors, including fuel, alcohol, LPG, natural gas, petrol, and diesel, thereby expanding the scope beyond the limitations of previous studies that predominantly focused on oil and gas markets [8]. The objective is to furnish a scientific foundation and decision support for the formulation of climate-proofing policies for the energy market.
The remainder of this paper is organized as follows. Section 2 describes the literature review on the relationship between climate change and the energy market, and risk spillover effects in energy markets. Section 3 delineates data, variables, and methods. Section 4 reports the empirical results. Section 5 concludes the paper.
2. Literature Review
A substantial body of research has demonstrated the impact of climate change on risk spillovers in energy markets [9]. To analyze the impact of climate change on the risk spillover effect of energy markets in depth, the following discussion will be carried out at two levels. Firstly, existing studies and relevant theories on the relationship between climate change and energy markets and their mechanism of action will be systematically summarized and analyzed. Secondly, the methodology of measuring the risk spillover effect of energy markets from the perspective of climate change influencing the risk spillover effect of energy markets will be analyzed.
2.1. Climate Change and Energy Markets
In recent years, the increase in extreme weather events has brought the issue of climate change in energy markets to the forefront of growing academic attention. It is widely recognized in academia that the physical and transition risks associated with climate change pose a dual threat to the stability of energy markets. The term “physical risk” is used to denote the direct impact of extreme weather events on the energy market, while “transition risk” refers to the consequences of human actions aimed at addressing climate change. These actions may include the implementation of climate policies, technological upgrades, shifts in public sentiment, and disruptive innovations in business models [10].
Physical risk has been shown to exert a significant influence on the energy supply balance. From the supply-side perspective, physical risks, including natural disasters and extreme weather events such as droughts, heavy rains, and floods, have the potential to damage energy infrastructure, thereby affecting energy production and transportation, and thus energy prices and market stability. Furthermore, climate change may also affect energy supply through impacts on hydroelectric power generation (due to declining water levels resulting from increased evaporation from rivers and lakes) and renewable energy output (due to changes in wind speeds affecting the efficiency of wind power generation and changes in precipitation patterns affecting solar power generation) [11]. From the demand-side perspective, shifts in temperature and an escalation in the frequency and intensity of extreme weather events have the potential to disrupt established energy demand patterns [12]. For instance, high-temperature heat waves may lead to an increased demand for electricity, while cold snaps may result in a heightened demand for heating energy. These changes may consequently exert an influence on prices and the equilibrium between supply and demand within energy markets. In the long term, frequent extreme weather events may compel energy companies to reassess their production strategies in favor of investing in more resilient infrastructure, thus affecting the stability of energy supply and cost structure. A substantial body of research has demonstrated a considerable correlation between energy market volatility and climate change, with the latter posing a challenge to the stability of energy markets [13,14].
Transition risk exerts its influence on energy markets principally through policy effects, namely a series of policy measures formulated and implemented by governments to achieve the objectives of reducing greenhouse gas emissions, enhancing energy efficiency, and promoting the development of renewable energy sources [15]. These policies impact the energy market in terms of energy prices, energy supply and demand, energy investment, market structure, and technological innovation. Specifically, China has implemented policies such as the carbon tax and the carbon emissions trading system, which have increased the cost of fossil energy and thus affected energy prices. Furthermore, China has promoted a clean energy strategy, which has led to a decline in the demand for some traditional energy sources and a rise in the demand for clean energy. China has promoted an energy transition policy, which has led to an increase in investment in research and development of clean energy, and a significant increase in the supply of clean energy. China has proposed a carbon-neutral target for carbon peaks, which has led to a transformation of the energy mix and has significantly increased the supply of clean energy. These have contributed to the transformation of the energy mix, leading to an increase in the share of renewable energy sources such as wind and solar in the energy mix. Furthermore, China has encouraged energy-intensive industries to invest in energy-efficient technologies, leading to enhanced energy efficiency and optimized energy utilization [16,17]. In summary, policies drive energy markets. However, uncertainty surrounding the precise design of policies and their implementation may lead to increased concerns among market participants regarding the direction and cost of the market. Investors in energy markets are more sensitive to information about climate policies, which contributes to heightened uncertainty and risk spillover in energy markets [18,19].
Furthermore, it is evident that physical and transition risks do not operate in isolation within the energy market. Rather, they interact with each other, contributing to a dynamic and evolving risk landscape. In the event of transition risk being disregarded and inadequate policy measures being implemented to address climate change, there will be an increased likelihood of facing physical risk. Conversely, if radical transition measures are taken without considering the current state of industry development, higher transition risk will be triggered in the short term. In summary, physical and transition risks interact in energy markets and together affect the stability of energy markets.
2.2. Risk Spillover Effects in Energy Markets
The energy market risk spillover effect is described as the process by which the risk of one market is transferred to another, thereby affecting the stability of the entire energy system [20]. In the context of globalization and the rapid development of financial markets, the increasing interdependence between energy markets has led to an increasingly significant risk spillover effect. In addressing this imperative, the academic community has devised an array of methodologies to investigate this phenomenon, encompassing vector autoregressive (VAR) models, generalized autoregressive conditional heteroskedasticity (GARCH) models, Copula methods and spillover index methods [21].
The utilization of VAR models, which possess the capacity to analyze the dynamic relationships between multiple time-series variables, can facilitate a more profound comprehension of the impacts of policy changes and external shocks on the energy market [22,23]. He Zhifang and Zhong Miaoqing examined the dynamic relationship between climate policy uncertainty, global energy prices, and stock prices through VAR models and found that the spillover effects of climate policy uncertainty on energy prices and stock prices have obvious time-varying characteristics [24]. Nonetheless, the majority of extant research in this area explores risk spillovers between energy markets from a single dimension only, thereby failing to fully integrate synergistic research on physical and transition risks.
GARCH models capture the volatility aggregation and conditional heteroskedasticity of time-series data, which helps to predict market volatility more accurately. Liu, Z. et al. utilized a GARCH model to analyze the impact of climate policy uncertainty on extreme risk spillover in the energy market [4]. Chai et al. utilized the DCC-GARCH model and the LSTAR model to analyze the time-varying linkages between the North American crude oil and natural gas markets, thereby providing insights into the nonlinear volatility characteristics of the trend-directed correlations between the two markets [25]. Qian et al. have investigated the intricate interdependency structure and risk spillovers among international markets by employing a range of models, including GARCH, EGARCH, and GJR-GARCH [25]. However, GARCH models present a challenge in analyzing the interdependencies among multiple time series simultaneously, thereby hindering the effective analysis of complex relationships among multiple energy markets.
The Copula approach has been extensively employed to model the dependence structure between markets, owing to its efficacy in handling nonlinear relationships and tail dependence. Chen Di et al. utilized the EVT-Copula-CoVaR model to quantify the risk spillover effects of the oil market on the Chinese carbon market, while the DCC-GARCH model was employed to capture the time-varying correlation of market fluctuations [26,27]. Diebold and Yilmaz proposed the spillover index method, which provides a direct measure to quantify the volatility spillover between markets [28]. Qingjun Zhang and Yanming Yang analyzed the risk spillover from carbon-intensive industries to the banking sector based on the DY index [29]. Nonetheless, the COVAR method prioritizes the examination of direct risk spillovers and places less emphasis on indirect risk spillover effects. This methodological approach may not always guarantee the requisite precision when confronted with nonlinear relationships. Furthermore, scholars have utilized Granger causal networks and dynamic network analysis to identify intricate relationships and risk propagation pathways between markets. Aiying Zhang et al. utilized nonlinear Granger causality to provide an in-depth analysis of the dynamic characteristics of China’s energy price and stock market [30].
In summary, the utilization of VAR models in the analysis of climate change’s impact on risk spillovers within energy markets offers three distinct advantages. Primarily, VAR models possess the capability to discern the dynamic interactions among multiple time series, rendering them well suited for the examination of the intricate relationship between climate change and energy markets. Secondly, the impact of climate change on the energy market is time-varying, particularly during extreme events (e.g., the New Crown epidemic, and the Russian–Ukrainian conflict). In such cases, the risk spillover effect is significantly enhanced, and the VAR model is capable of capturing this time-varying feature. Finally, the incorporation of multiple variables (e.g., various energy markets) into the VAR model facilitates simultaneous analysis, thereby enabling a comprehensive exploration of market interactions. In view of this, the present study adopts the VAR model combined with rolling windows to analyze the risk spillover effects in the energy market in order to reveal the trend of the risk spillover effects in different time periods. Through the utilization of impulse response analysis, the impact of climate change (physical risk and transition risk) on risk spillover in the energy market is explored in depth to reveal the dynamic transmission mechanism of climate change shocks and its characteristics over time. This provides a deeper understanding of how climate change propagates among energy markets and how climate change affects the stability of the energy market. Furthermore, it provides new perspectives and tools for the analysis of energy market stability and offers a more accurate perspective for relevant policy formulation and energy market risk management.
3. Data Description and Methodology
3.1. Data Description
Six representative energy prices of fuel (FM), alcohol (AM), liquefied petroleum gas (LPGM), natural gas (NGM), gasoline (GM), and diesel (DM) are selected as energy market metrics in China. We selected OPEC production cut data and WTI crude oil prices as our exogenous variables. The sample data of energy variables are obtained from the CEIC database. The OPEC production cut data are treated as a binary variable, where a value of 1 indicates the occurrence of an OPEC production cut in a given quarter, and a value of 0 indicates that no such cut occurred. The data were carefully compiled from the OPEC Monthly Oil Market Report. Considering the policy background, changes in the market environment, and data availability, the spot prices of the above six energy sources from January 2007 to December 2023 were selected as the study sample (see Table 1 and Figure 1).

Table 1.
Descriptive statistics.
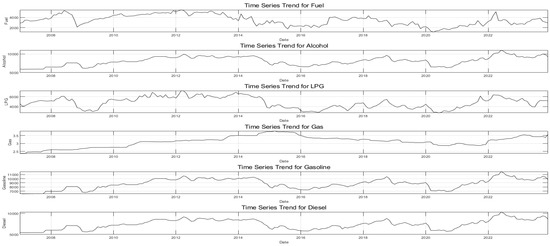
Figure 1.
Monthly energy market data.
Physical risk refers to the direct damage to economic activities caused by extreme weather events and long-term climate trends resulting from climate change. Transition risk, on the other hand, represents the economic and financial risks to markets arising from factors such as changes in policy, technology, market sentiment, and consumer preferences as societies transition to a low-carbon economy. To quantify these risks in China, we have selected the climate risk index (CRI) and the Climate Change Performance Index (CCPI), both published by Germanwatch, as metrics for climate physical risk (PR) and transition risk (TR), respectively. The sample data for climate risk spans from 2007 to 2023, with all data being annual.
As a region with high climate vulnerability, China is highly susceptible to the significant impacts of climate change, and its climate physical risk index has been at a high level for a long time. Similar to small island countries and low-lying areas such as Bangladesh and the Philippines, which are more vulnerable to extreme weather events such as typhoons and floods, the climate risk index has also remained high. Transition risk is influenced by factors such as greenhouse gas emissions, the promotion of renewable energy, energy consumption, and the effectiveness of climate policies. In contrast, the Nordic countries, which are leaders in renewable energy utilization and climate policy implementation, have relatively low transition risks. China, on the other hand, has been at a relatively high level of transition risk due to its rapid industrialization, its energy structure still dominated by traditional fossil energy sources, and the fact that it is still in a stage of perfection in the promotion of renewable energy technologies and the implementation of climate policies.
Figure 2 provides information on the monthly volatility of six energy markets. Table 1 provides a descriptive statistical analysis of the data on China’s energy market and climate risk indicators. The data in Table 1 demonstrates that, with regard to standard deviation, the volatility of the gasoline market (GM) is the most significant, with its standard deviation reaching 1236.96. This outcome aligns with market reality, given that gasoline, as the predominant energy source for transportation, possesses a relatively rigid demand, influenced by factors such as policy adjustments, international oil price fluctuations, and seasonal variations. Consequently, the gasoline market’s volatility stands out. The mean values for alcohol (AM), gasoline (GM), and diesel (DM) are notably higher compared to those of other energy markets. This observation may be indicative of the heightened sensitivity of these three markets to external shocks, which may be associated with the pervasive utilization of these energy products in economic activities and the inflexible demand characteristics. Additionally, a degree of variability is observed in the statistical data between the variables in the table, which suggests that the selected variables can more effectively represent the diverse market characteristics and the level of risk. The presence of such variability further validates the rationale behind the variable selection and establishes a robust foundation for the subsequent in-depth analysis. This discrepancy serves to reinforce the rationale behind variable selection, thereby establishing a robust foundation for the subsequent in-depth analysis.
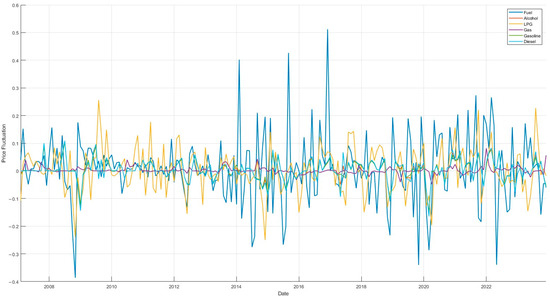
Figure 2.
Trends in price volatility.
The missing data are supplemented by the sample interpolation method, mainly because the energy market data involved in this study have certain nonlinear characteristics, and the sample interpolation method can better approximate these complex data relationships and provide more accurate estimates of the missing values. The effectiveness of this approach lies in its ability to reduce analytical bias due to missing data while preserving data smoothness and continuity, a crucial consideration in the study of dynamic relationships, such as those between climate change and its impact on the energy market. The spline interpolation method is notable for its numerical stability and convergence, which aid in avoiding the overfitting phenomenon and ensure the reliability of research outcomes.
This study employs the spline interpolation method for interpolation. To further evaluate the method’s potential for data distortion and its impact on results. Setting 20% as the proportion of simulated missing data, the Mean Absolute Error (MAE) was calculated to be 44.3772, and the Relative Error was about 0.72%, which is significantly less than 1%. These findings demonstrate that the interpolation method does not distort the results.
To evaluate the smoothness of the data, we conducted the Augmented Dickey–Fuller (ADF) and Kwiatkowski–Phillips–Schmidt–Shin (KPSS) tests. The KPSS results showed that we could not reject the null hypothesis for all variables, confirming that the data were indeed smooth. The results of the ADF test indicated that we could reject the hypothesis of a unit root at the 1-percent significance level, further supporting the conclusion that the series was smooth (see Table 1).
3.2. Methodology
In this paper, the vector autoregressive (VAR) modeling framework is utilized and based on the generalized forecast error variance decomposition (FEVD) method to measure the linkages between energy markets.
The VAR model, in its smooth VAR (p) form with N-dimensional variables, is expressed in Equation (1). In order to ascertain the lag order p of the VAR model, the BIC information criterion is employed as a judgmental basis for selecting the optimal p as the model’s final lag order.
(t = 1,…,T) is a column vector of N dimensions, with representing the disturbance vector. The AVR (p) model is represented in the form of a vector moving average (VMA), as shown in Equation (2).
is an N × N-dimensional coefficient matrix, satisfying , , = 0, if i < 0.
The variance decomposition assesses the degree of influence of different variables on stochastic shocks by analyzing the H-period forecast error of any endogenous variable in the VAR (p) model and decomposing it into the contribution of stochastic shocks of each variable within the model. The traditional orthogonal variance decomposition is able to deal with the problem of inter-correlation of the stochastic disturbance terms of the endogenous variables of the model over the same period, but its results are susceptible to the ordering of the variables. In contrast, the generalized prediction error variance decomposition provides more robust decomposition results by accounting for the correlation of random shocks among variables based on the distributional properties of the random error terms in the historical data.
contribution of the random shock, defined as the H-step forecast mean square error of (i ≠ j), is calculated as shown in Equation (3).
represents the standard deviation of the error term of the ith equation in the VAR model, and represents the N-dimensional column vector whose ith component is 1 and the rest are 0. Due to the correlation between the components of the vector of random perturbation terms in the generalized prediction error variance decomposition, it follows that .
In this paper, the comparability of the variance decomposition results is enhanced by standardizing the data across rows of the variance decomposition matrix. Concurrently, cognizance of the directionality of the role effect conduction is imperative, as it engenders an antithetical effect mechanism between each pair of variables. Consequently, is used to represent the net effect of on , as delineated in Equations (4)–(6). In this paper, the observed energy market is used as , and other energy markets are used as , respectively, to test the net effect of the interaction between the energy markets [31].
represents the mean of the effect of the influence of on variable , and represents the mean difference in the interaction effect between the variables. Given that the distribution of the mean data is non-normal, it follows that traditional parametric tests may not be applicable. Consequently, this study employed the one-sided Wilcoxon rank sum test to ascertain statistical significance by comparing the rank order of the data [32].
4. Empirical Results and Analysis
4.1. Analysis of Risk Spillover Within Energy Markets
4.1.1. Static Analysis of Risk Spillover Within Energy Markets
The net spillover indices of the six energy markets are calculated to be 8.10%, 15.90%, 7.89%, 0.25%, 15.71%, and 15.83%. The static analysis of spillover effects reveals several noteworthy results. Firstly, the average spillover from the energy market as a whole is 10.61%. These data indicate that, in addition to the variables themselves, 10.61% of the extreme risk in the market is derived from the spillover effect between the energy markets. Secondly, the alcohol market, the gasoline market, and the diesel market have high spillover indices across the entire energy market, and there is a strong bi-directional volatility. It is evident that these three markets exhibit reduced susceptibility to volatility spillovers from other markets. Their own volatility spillovers to other markets exert a more substantial impact on the net spillover. Thirdly, the natural gas market demonstrates the weakest risk spillover and spillover effects, primarily due to natural gas’s status as the most prevalent and relatively affordable energy source, which leads to a comparatively high level of price stability, and a comparatively limited ability to pass on volatility. Fourthly, the fuel and LPG markets both exhibit a net reception of spillovers from other markets, while being more influenced by spillovers from these markets.
4.1.2. Dynamic Analysis of Risk Spillover Within Energy Markets
In order to accurately capture the dynamic of the risk spillover effect within the energy market, this paper conducted a dynamic rolling spillover analysis of the sample data using a rolling window of 24 months to dissect the time-varying characteristics of the volatility spillover between the energy markets. The results of the analysis are shown in Figure 3 and Figure 4. As demonstrated in Figure 3 and Figure 4, the overall volatility level of energy markets is substantial, with a volatility range of −20% to 25%. This indicates that the total volatility spillover in energy markets exhibits significant time-varying characteristics and generally follows the law of gradual stabilization after sharp fluctuations.
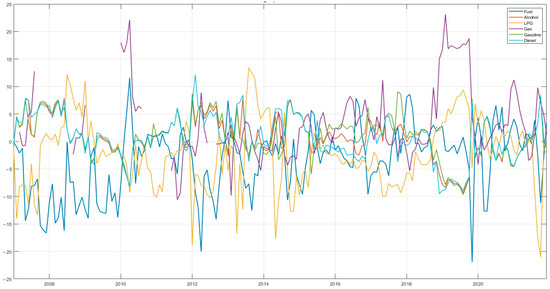
Figure 3.
Dynamic spillover of risks within energy markets.
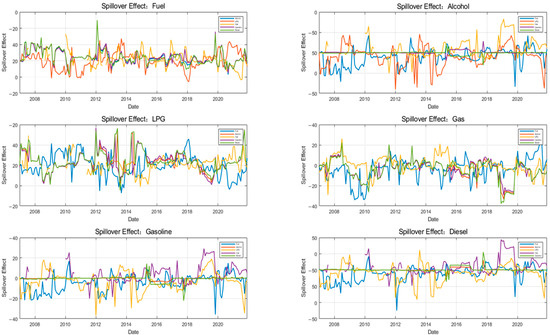
Figure 4.
Dynamic spillover of risks within energy markets.
Specifically, the risk premium of each energy market is characterized by a clear asymmetry. The risk premium of the fuel market exhibits significant fluctuations, ranging from −20% to 10%, with the widest range of fluctuation. The spillover effect is predominantly negative, indicating that the fuel market is a recipient of risk premiums. This phenomenon is primarily attributable to the pivotal role of fuel in global energy consumption, its profound sensitivity to international crude oil prices, and the potential for significant risk spillovers in the fuel market in the event of supply disruptions or shifts in demand [33].
The risk spillover ranges for alcohol, gasoline, and diesel markets are −10% to 10%, with analogous overall spillover trends. This phenomenon may be attributed to the fact that gasoline and diesel are derived from analogous fuels and share common steps in their production and refining processes. Conversely, alcohol is predominantly utilized as a substitute or supplement for gasoline and diesel in transport fuels. The interplay between supply and demand in the alcohol energy market exerts a significant influence on its prices and market volatility, which tend to exhibit a concomitant pattern [34].
The risk premium volatility of the LPG market ranges from −20% to 10%, with a wide range of fluctuations. This phenomenon can be attributed to the primary sourcing of LPG from refinery by-products, resulting in a strong correlation between LPG prices and international crude oil prices. Consequently, fluctuations in oil prices directly impact LPG prices. In contrast, the natural gas market exhibits a risk spillover volatility range of −10% to 20% and a frequent fluctuation range of between −10% and 10%, with a lower frequency of fluctuations. This is primarily attributable to the substantial size of the natural gas market, its relatively low price, and its relative stability.
It is evident that three distinct key points exist in the risk spillover across energy markets. Firstly, circa 2010, all five energy markets—fuel (FM), natural gas (NGM), alcohol (AM), gasoline (GM), and diesel (DM)—exhibited extreme values for that period. Specifically, the markets for fuel and natural gas exhibited remarkably high values, while the remaining three markets, namely alcohol, gasoline, and diesel, demonstrated significantly lower values. This observation suggests that the markets for fuel and natural gas experienced substantial risk spillovers during the observed period, while the markets for alcohol, gasoline, and diesel were subject to considerable risk spillover. This phenomenon may be attributed to the global economy’s recovery from the 2010 financial crisis and the subsequent rise in demand for fuel and natural gas, driven by increased industrial activity in China.
Secondly, around 2012, the energy markets once again exhibited the extremes of that period. The three markets of fuel, LPG, and natural gas reached the extreme values of this phase, and the three markets of alcohol, gasoline, and diesel reached the extreme values of this phase. This indicates that the three markets of fuel, LPG, and natural gas exhibit large risk spillover, while the three markets of alcohol, gasoline, and diesel are subject to large risk spillover.
Thirdly, risk spillover across energy markets demonstrates sharp fluctuations between 2019 and 2020. The spillover effects in the fuel, LPG, gasoline, and diesel markets exhibit a rapid rise from a minimum to a maximum, while the natural gas and alcohol markets experience spillover effects that reach an extreme value and then rapidly decrease to a very small value. This phenomenon can be attributed primarily to the substantial impact of the COVID-19 outbreak on energy markets, which resulted in a notable shift in risk spillover across various energy sectors. This observation underscores the existence of a discernible correlation between energy markets. Subsequent to this, the energy markets have exhibited a return to a median volatility level, indicative of the robust resilience of the energy markets and the relative stability of the market [35].
4.2. Impulse Response of Physical Risk
This paper employs the technique of impulse response analysis in order to comprehensively assess the impact of climate change on energy market risk spillover. The impact of climate change on energy market risk spillover has been classified into physical risk and transition risk [36]. Consequently, this paper will analyze their impact on energy market risk spillover from the perspectives of physical risk and transition risk.
The time-series characteristics of each variable and the data situation are taken into account in the setting of the rolling window, which is set to 50. The horizontal axis indicates the duration of the shock effect in quarters, and the vertical axis indicates the size of the shock. The results of the impulse response analysis of physical risk to energy market risk spillover are illustrated in Figure 5.
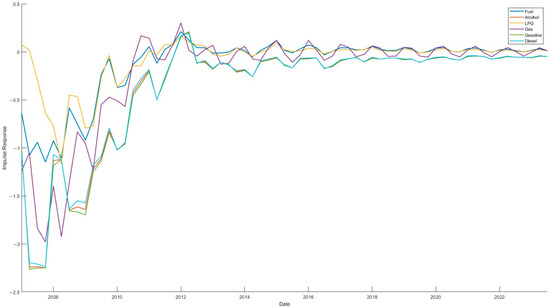
Figure 5.
Physical risk impulse response analysis.
The findings reveal predominantly negative shocks, with shock values generally below zero. The trend of the impact of physical risk on each energy market is relatively similar, with all the sharp fluctuations gradually tending to be stable. By period 25, the volatility of each energy market narrows, and the fluctuations in the later period are seasonal, which is consistent with the basic law of energy demand and supply. This finding is consistent with the conclusions of Gu et al., which further corroborates the association between physical risk and risk spillover in energy markets [10].
The overall impact of physical risk on risk spillover in the energy market is predominantly negative, with shock values predominantly below zero. Specifically, the overall trend of physical risk shocks to the three markets—gasoline, alcohol, and diesel—is similar, with impulse response values fluctuating between −2.5 and 0, reaching a maximum negative shock in period 3 and a minimum response in period 21, followed by a reduction in the magnitude of the fluctuations, which ultimately leveled off. This finding suggests that this market segment is particularly susceptible to physical risk, primarily due to the primary application of these energies as a means of transportation, a sector that is susceptible to the impacts of extreme weather events. For instance, extreme weather events can result in the disruption of transport routes, the closure of petrol stations, or sudden fluctuations in demand, which can influence prices and the balance of supply and demand within these energy markets [3].
The impulse response values of physical risk to the natural gas market are between −2.0 and 0, indicating moderate volatility, with the maximum negative shock value occurring in period 4 and the minimum response value in period 21. This is followed by gradual small upward and downward fluctuations, eventually leveling off, and more pronounced seasonal fluctuations in the later periods. The primary factor contributing to this phenomenon is the classification of natural gas as a clean energy source. The market scale of natural gas is expanding in a gradual manner under the influence of clean energy policy and consumer preferences. Additionally, natural gas’s predominant role as a heating energy source renders it more susceptible to seasonal fluctuations.
The impulse responses of physical risk to the LPG and fuel markets are all between −1.5 and 0, with maximum negative shocks in periods 4 and 6, respectively, and a minimum in period 21, followed by small upward and downward fluctuations and eventually leveling off. This observation indicates that the market demonstrates a relatively smoother response to physical risks, which may be attributable to the utilization of these energy sources being more decentralized and generally characterized by more stable supply and storage systems.
4.3. Impulse Response of Transition Risk
The time-series characteristics of each variable and the data situation are taken into account, and the rolling window is set to 50. The horizontal axis indicates the duration of the shock effect in quarters, and the vertical axis indicates the size of the shock. The results of the impulse response analysis of transition risk on energy market risk spillover are illustrated in Figure 6.
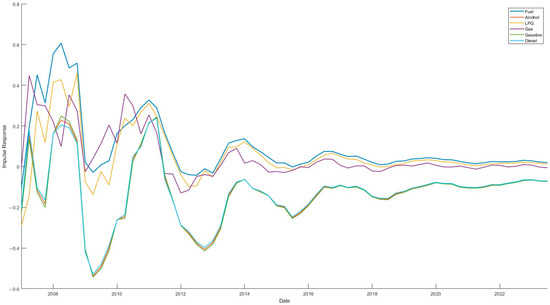
Figure 6.
Transition risk impulse response analysis.
The findings reveal a consistent trend in the transition risk shocks across various energy markets, with a gradual shift towards smoother performance as the volatility of sharp fluctuations diminishes. The initial shocks of transition risk to energy market risk spillover are predominantly negative, reflecting the concerns of each energy market about the uncertainty of transition, while subsequent positive shocks reflect the energy market’s awareness of the new opportunities that transition may bring. As the market becomes acclimatized to the transition risk, the shock to energy markets from this risk gradually diminishes and tends to zero, thereby demonstrating the market’s capacity for self-regulation and adaptation to the new normal.
The impact of transition risk on the gasoline, alcohol, and diesel markets has been shown to exhibit a similar overall trend, characterized by significant fluctuations in the impulse response value, ranging from −0.6 to 0.2. These fluctuations reach a negative maximum in period 10, a positive maximum in the 18th period, and subsequently a negative minimum in period 25. Thereafter, a gradual decrease in the magnitude of the fluctuations is observed, leading to a state of relative stability. This observation indicates that this market segment is more susceptible to transition risks, primarily due to the potential for significant fluctuations in demand during the transition phase. Conventional energy sources such as gasoline and diesel may be impacted by the substitution of novel energy sources, and the promotion of biofuels and renewable energy sources may exert an influence on the alcohol and diesel markets [3].
The impulse response values of transition risk to the natural gas market range from −0.1 to 0.4, indicating moderate volatility and predominantly positive shocks. It attains a positive maximum in period 3, after which the positive shocks exhibit a weakening trend, and the response value attains a negative maximum in period 21, followed by gradual small upward and downward fluctuations, which eventually level off, with seasonal fluctuations becoming more pronounced in the later period. This phenomenon can be attributed, at least in part, to the pivotal role that natural gas, recognized for its clean and efficient characteristics, plays in the broader context of the energy transition. The expansion of the natural gas market has been influenced by the implementation of clean energy policies and consumer preferences, resulting in a gradual increase in market size. Transition policies have had a strengthening effect on the construction and operation of the natural gas market, thus helping to guarantee the security and stability of natural gas supply [37].
The impulse response value of transition risk to fuel market shocks ranges from −0.1 to 0.6, reaching a negative maximum in period 1, a positive maximum in period 6, and a response value of 0 in period 21, after which it undergoes small upward and downward fluctuations before ultimately stabilizing. The impulse response value of the transition risk to the LPG market shock ranges from −0.3 to 0.4, reaching a negative maximum in period 1, a positive maximum in period 8, and a response value of 0 in period 21, after which it gradually fluctuates up and down by a small margin and eventually stabilizes.
4.4. External Factors Analysis
This study aims to further explore the impact of external variables on risk spillovers in energy markets. To this end, OPEC production reduction policy and WTI crude oil price volatility are selected as external variables to be analyzed. The results indicate that both OPEC production reduction policy and WTI crude oil price volatility have an impact on risk spillover in the energy market, with WTI crude oil price volatility exhibiting a more significant impact.
The results of the impulse response analysis of the OPEC production cut policy on risk spillovers in the energy market are shown in Figure 7. The impact of OPEC production cuts on the alcohol, gasoline, and diesel markets is relatively analogous, with all generating negative shocks that peak in period 5, followed by sharp fluctuations, and then converge to zero in period 30, followed by reduced fluctuations and eventual leveling off. This phenomenon is primarily attributable to the direct correlation between OPEC production cuts and the subsequent increase in crude oil prices. The alcohol, gasoline, and diesel markets exhibit a high degree of correlation with crude oil prices. An increase in crude oil prices leads to higher production costs for these products, thereby generating a negative shock to the market. There is a similar impact of OPEC production cuts on fuel and LPG markets: the former exhibits a more pronounced positive shock in period 1, followed by a period of heightened volatility, attaining its maximum negative shock value in period 14, with the shock eventually converging to 0 in period 20. This is followed by a decline in fluctuations and subsequent stabilization. This phenomenon is primarily attributable to the diminished sensitivity of the fuel and LPG markets to fluctuations in crude oil prices, coupled with the prevailing market assumption that diminished supply will result in price escalation during the nascent phase of production cuts. The impact of OPEC’s production cuts is most pronounced on the natural gas market, manifesting as a positive shock in period 1, followed by pronounced fluctuations, culminating in the maximum negative shock value in period 9, approaching zero in period 25, and subsequently exhibiting a decline in volatility. The fluctuations then decrease and eventually level off.
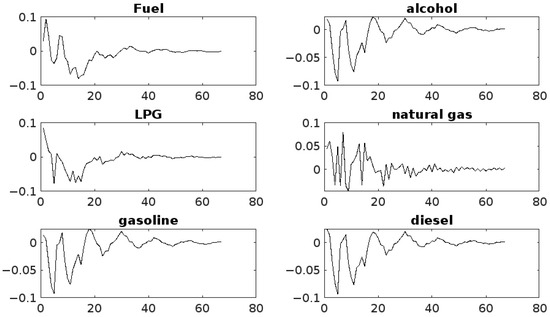
Figure 7.
OPEC production cuts impulse response analysis.
The results of the impulse response analysis of the WTI crude oil price on risk spillovers in the energy market are shown in Figure 8. The impact of WTI crude oil price volatility on the fuel, alcohol, LPG, gasoline, and diesel markets is relatively similar. Alcohol, gasoline, and diesel markets reach their maximum shocks in period 3, LPG in period 4, and fuel market in period 8, and then the shock response decreases gradually, approaching zero in period 25, and then the volatility decreases and eventually stabilizes. This is mainly due to the fact that these markets are highly correlated with crude oil prices, as their production costs are directly dependent on crude oil prices, and fluctuations in WTI crude oil prices are quickly transmitted to these markets, leading to price changes. Fuel markets are relatively less responsive to crude oil price fluctuations, possibly because their production processes and inventory adjustments take longer. WTI crude oil price fluctuations have a more frequent impact on natural gas markets, with a maximum shock in period 2, followed by sharp fluctuations, a maximum negative shock in period 9, a maximum shock in period 14, and then decreasing fluctuations and eventually leveling off. This is mainly due to the uniqueness of the natural gas market, which is linked to the crude oil market but has significant differences. The supply and demand structure of natural gas is more complex, and its price is not only affected by the volatility of crude oil prices, but is also closely related to seasonal demand (e.g., winter heating), regional supply capacity, and policy direction.
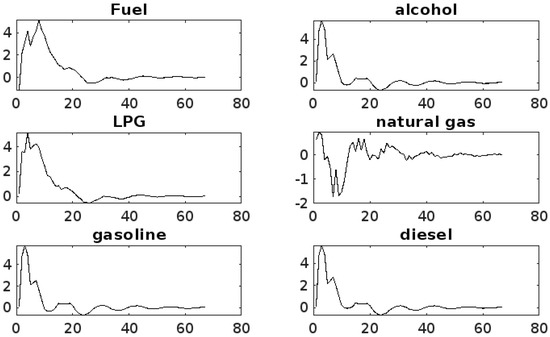
Figure 8.
WTI crude oil impulse response analysis.
4.5. Robustness Testing
In the preceding section of this paper, the VAR model was used to analyze the energy market risk spillover effect of the energy market, to further validate the model VAR robustness. In the following, the test is performed by adjusting the model, specifically by using the GARCH model to re-examine the energy market risk spillover effect.
The estimation results of the univariate GARCH (1,1) and GARCH (1,0) models for each energy submarket in China are reported in Table 2. ω is the constant term, β is the coefficient of the GARCH term, and α is the coefficient of the ARCH term. From the results of the GARCH (1,1) model test, the coefficients of the constant term, the coefficients of the ARCH term, and the coefficients of the GARCH term for alcohol, LPG, and gasoline are all significant at the 1% level. The coefficients of the constant term, and the coefficients of the ARCH term for fuel, natural gas, and diesel were significant, but the coefficients of the GARCH term were not significant, so GARCH (0,1) was used for reestimation.
Table 2.
GARCH model estimation result.
A thorough validation of the GARCH model and the VAR model’s impulse response analysis substantiates the rational self-consistency of the conclusions presented in this study. The study posits that the repercussions of climate change on risk spillover in the energy market can be elucidated by the differentiation mechanism of physical risk and transition risk. Furthermore, the volatility characteristics of disparate energy products are found to be intimately associated with their sensitivity and adaptive capacity to climate shocks. The short-term abruptness characteristics of physical risk (e.g., extreme weather) are significant in high-ARCH-effect products (gasoline, alcohol, and diesel), whose volatility is mainly driven by upfront shocks and decays quickly, consistent with the phenomenon of impulse response in which violent negative shocks are followed by rapid stabilization. Conversely, low-ARCH-effect products, such as natural gas and LPG, exhibit a greater reliance on long-term fundamentals, attributable to the enhanced stability of their supply chains. This observation is reflected in a flat trend in the impulse response, indicative of a more stable underlying dynamic.
The long-term policy effect of transition risk is reflected by products with significant GARCH terms (alcohol, LPG, gasoline), whose volatility persistence (α + β ≈ 0.7) reflects the market’s adaptation process to the gradual adjustment of the transition policy, and matches the dynamic path of the impulse response, whereby initial negative shocks gradually turn to the positive direction, and eventually stabilize. Conversely, the pure ARCH effect products (diesel, fuel) exhibit a lack of long-term volatility persistence, thereby directly reflecting the short-term impact of policy substitution. This observation aligns with the characteristics of the transition risk impulse response, which is characterized by small fluctuation amplitude and rapid decay. Additionally, natural gas, positioned as a clean energy transition catalyst, demonstrates low ARCH coefficients and seasonal fluctuation characteristics, thereby reinforcing its role as a policy dividend supporter. The impulse response of the positive shock dominant results is particularly noteworthy. In summary, the VAR model demonstrates robust performance.
5. Conclusions and Policy Implications
5.1. Conclusions
As the frequency and intensity of extreme weather events increased, energy markets faced more volatility and risk. China has implemented a variety of policies to address the energy market risks posed by climate change. However, frequent policy adjustments also affect energy markets and may exacerbate market volatility, thereby threatening energy security. In order to quantify the risk spillovers between energy markets in China and the impact of climate change on risk spillovers in energy markets, this study employs a VAR model to analyze risk spillovers between energy markets and applies an impulse response to analyze the impact of climate change on risk spillovers in energy markets. The primary conclusions that can be drawn from this analysis are as follows.
The average volatility spillover in the energy market is 10.61%, which is indicative of marked asymmetry, with heightened spillover levels observed in the alcohol, gasoline, and diesel markets, which are classified as net spillovers, in the fuel and LPG markets, designated as spillover recipients, and in the natural gas market, which exhibits the least pronounced risk spillover effect.
The overall volatility level of the energy market exhibits substantial fluctuations, ranging from −20% to 25%, and the total volatility spillover displays discernible time-varying characteristics. The total spillover level of the fuel market is more volatile, while the overall spillover level of the alcohol, gasoline, and diesel markets is similar, and the whole shows a flat state. The risk spillover of the natural gas market has a smaller range of fluctuations and a lower frequency of spillovers.
The physical risk significantly exacerbates the risk spillover between energy markets, and most of its impulse response values are below 0, and there is a clear negative shock. The transition risk exerts a divergent effect on the risk spillover of diverse energy markets. The nature of risk spillover is contingent on the specific market in question; for instance, shocks to the fuel, LPG, and natural gas markets predominantly engender positive shocks, while shocks to the alcohol, gasoline, and diesel markets predominantly engender negative shocks.
5.2. Policy Implications
Each energy market should consider its own risk volatility characteristics and response characteristics to different climate change risks to develop appropriate risk response policies to improve energy market stability: Establishing a risk-monitoring mechanism and strengthening market risk management. Developing and improving the risk-monitoring system for the energy market to monitor market fluctuations and risk spillover in real time. Constructing risk early warning indicators and utilizing big data and artificial intelligence technology to monitor and analyze market risks in multiple dimensions and frequencies. Setting risk thresholds so that timely early warning will be issued and measures are taken when market fluctuations exceed the normal range [38]. Stabilizing the policy environment and establishing risk buffer mechanisms. Establishing energy risk management tools to help companies and investors effectively manage market risks and reduce losses caused by uncertainty. Enhancing the transparency of market information disclosure, publishing regular market reports, analyzing market dynamics and potential risks, and ensuring that market participants have access to accurate market information. Establishing personalized risk buffer mechanisms according to different types of energy markets, such as strategic reserves to cope with market volatility for net spillovers (e.g., natural gas market) and risk funds for net recipients (e.g., fuel market) to mitigate the negative impact of risk spillover. Strengthening physical risk management and building energy security defenses. Strengthening the construction and maintenance of energy infrastructure, and improving the ability to withstand physical risks such as natural disasters by reinforcing key facilities, upgrading engineering design standards, and adopting advanced early warning systems. Formulating detailed contingency plans to ensure that prompt and effective action can be taken in the face of extreme weather events and other unforeseen circumstances. Strengthening cross-sectoral coordination to ensure the rational allocation and rapid deployment of resources in order to minimize the impact on energy supply. Developing adaptive strategies to address transition risks. Formulating flexible policies to support technological innovation and business model changes in the process of the energy transition. Encouraging energy enterprises to carry out technological upgrading and innovation to adapt to the new trend of low-carbon development and ensure the long-term sustainable development of the energy market. Strengthening regulation and policy implementation to ensure that all relevant measures are effectively implemented. Promoting cooperation between regulators and energy enterprises to ensure that risk management measures are adequately considered and implemented and regularly assess their effectiveness. Promoting international cooperation and exchanges, sharing best practices and experiences in energy transition, and utilizing international platforms to promote technology transfer and joint research and development, so as to jointly address the challenges of energy transition [39].
Author Contributions
Conceptualization, S.C. and M.P.; methodology, Y.M.; software, S.C. and Y.M.; validation, M.P., S.C. and Y.M.; formal analysis, S.C. and Y.M.; investigation, M.P.; resources, M.P.; data curation, S.C. and Y.M.; writing—original draft preparation, S.C.; writing—review and editing, S.C., M.P., Y.M., Q.D. and Y.T.; visualization, S.C.; funding acquisition, M.P. All authors have read and agreed to the published version of the manuscript.
Funding
This research was funded by the 2022 National Social Science Foundation Major Project, grant number 22&ZD105; 2020 National Social Science Foundation Western Program, grant number 20XJY006.
Data Availability Statement
The data used to support the findings of this study are available from the corresponding author upon request.
Conflicts of Interest
Author Yongping Tao was employed by the company China National Petroleum Corporation Drilling Fluid Technical Service Company of Sichuanqing Drilling Engineering Co. The remaining authors declare that the research was conducted in the absence of any commercial or financial relationships that could be construed as a potential conflict of interest.
References
- Shaw, R.; Luo, Y.; Cheong, T.S.; Halim, S.A.; Chaturvedi, S.; Hashizume, M.; Insarov, G.E.; Ishikawa, Y.; Jafari, M.; Kitoh, A.; et al. 2022: Asia. In Climate Change 2022: Impacts, Adaptation and Vulnerability; Contribution of Working Group II to the Sixth Assessment Report of the Intergovernmental Panel on Climate Change; Cambridge University Press: Cambridge, UK; New York, NY, USA, 2022; pp. 1457–1579. [Google Scholar]
- Chen, J.; Chen, Y.; Zhou, W. Relation exploration between clean and fossil energy markets when experiencing climate change uncertainties: Substitutes or complements? Humanit. Soc. Sci. Commun. 2024, 11, 691. [Google Scholar] [CrossRef]
- Gonçalves, A.C.R.; Costoya, X.; Nieto, R.; Liberato, M.L.R. Extreme weather events on energy systems: A comprehensive review on impacts, mitigation, and adaptation measures. Sustain. Energy Res. 2024, 11, 4. [Google Scholar] [CrossRef]
- Liu, Z.H.; Ding, Z.H.; Duan, Z.P. Does climate policy uncertainty exacerbate extreme risk spillovers among energy markets? Syst. Eng. Theory Pract. 2023, 43, 1651–1667. [Google Scholar]
- Zhang, S.; Aibai, A. The impact of extreme weather on regional financial risk. Financ. Econ. 2024, 1, 30–40. [Google Scholar] [CrossRef]
- Li, K.; Cai, B.; Wang, Z. Accessing the Climate Change Impacts in China Through a Literature Mapping. Int. J. Environ. Res. Public Health 2022, 19, 13411. [Google Scholar] [CrossRef]
- Ding, S.; Liang, Z.; Chen, J. A study on the spillover effects of climate policy uncertainty and energy and metal markets under the time-frequency perspective. Syst. Eng. Theory Pract. 2023, 43, 2222–2235. [Google Scholar]
- Guo, N.; Zhang, J. Study on the volatility spillover effect between China’s energy market and stock market--an empirical study based on TVP-VAR-DY model. J. Southwest Univ. Natl. (Humanit. Soc. Sci. Ed.) 2022, 43, 122–133. [Google Scholar]
- Jin, Y.; Zhao, H.; Bu, L.; Zhang, D. Geopolitical risk, climate risk and energy markets: A dynamic spillover analysis. Int. Rev. Financ. Anal. 2023, 87, 102597. [Google Scholar] [CrossRef]
- Zheng, L.; Ye, N.; Gan, Y.; Lai, C. The impact of extreme weather event shocks on bank stability. Wuhan Financ. 2024, 7, 28–37. Available online: https://kns.cnki.net/kcms2/article/abstract?v=CdHX_LbaUYy6TLvsH41oNRF6G7JIaNNlVIAElKHDHvVqWFqh7i9xMpe_XgxvoOrsjpKglo-W2SjruGut9xo1S8PdTTXizO2iEdVPvBDCuC-1MF9TmwsjhnQ8yVM_HsTn5SXzbEIg2o0EBNmYfJIXA6ZAsa_u4yKMwYQ1EF63n6HLi2bzhm0m5AMIqqTRNixK&uniplatform=NZKPT&language=CHS (accessed on 8 October 2024).
- Liu, L.; He, G.; Wu, M.; Liu, G.; Zhang, H.; Chen, Y.; Shen, J.; Li, S. Climate change impacts on planned supply–demand match in global wind and solar energy systems. Nat. Energy 2023, 8, 870–880. [Google Scholar] [CrossRef]
- Gong, X.; Lai, P.; He, M.; Wen, D. Climate risk and energy futures high frequency volatility prediction. Energy 2024, 307, 132466. [Google Scholar] [CrossRef]
- Liu, Z.; Xie, Y.; Niu, Y. Energy market, financial market green concern and commercial banks’ climate risk—a frequency domain analysis based on quantile vector autoregressive model. Shanghai Financ. 2024, 4, 56–69. [Google Scholar] [CrossRef]
- Li, J. How will climate change affect China in the future? Ecol. Econ. 2024, 40, 9–12. [Google Scholar]
- Moon, T.H.; Kim, D.-H.; Park, C.S.; Lee, D.-S. Policy Analysis to Reduce Climate Change-Induced Risks in Urban and Rural Areas in Korea. Sustainability 2017, 9, 524. [Google Scholar] [CrossRef]
- Calcaterra, M.; Reis, L.A.; Fragkos, P.; Briera, T.; de Boer, H.S.; Egli, F.; Emmerling, J.; Iyer, G.; Mittal, S.; Polzin, F.H.J.; et al. Reducing the cost of capital to finance the energy transition in developing countries. Nat. Energy 2024, 9, 1241–1251. [Google Scholar] [CrossRef]
- Guo, W.; Luo, S. Geopolitical risks, energy price volatility and global inflation. Financ. Econ. 2023, 4, 40–52. [Google Scholar]
- Gu, Q.; Li, S.; Tian, S.; Wang, Y. Impact of climate risk on energy market risk spillover: Evidence from dynamic heterogeneous network analysis. Energy Econ. 2024, 137, 107775. [Google Scholar] [CrossRef]
- Hafezi, M.; Sahin, O.; Stewart, R.A.; Mackey, B. Creating a Novel Multi-Layered Integrative Climate Change Adaptation Planning Approach Using a Systematic Literature Review. Sustainability 2018, 10, 4100. [Google Scholar] [CrossRef]
- Lupu, R.; Călin, A.C.; Zeldea, C.G.; Lupu, I. Systemic Risk Spillovers in the European Energy Sector. Energies 2021, 14, 6410. [Google Scholar] [CrossRef]
- Hwang, Q.; Yao, M.; Li, S.; Wang, F.; Luo, Z.; Li, Z.; Liu, T. Risk Spillovers Between China’s Carbon and Energy Markets. Energies 2023, 16, 6820. [Google Scholar] [CrossRef]
- Li, C.; Li, J.; Chen, W. Risk spillovers between financial markets and major sectors of the real economy. Financ. Econ. 2024, 1, 18–29. [Google Scholar]
- Du, R.; Xu, P. Time-Varying Spillover Effects Between Clean and Traditional Energy Under Multiple Uncertainty Risk: Evidence from the U.S. Market. Sustainability 2024, 16, 9164. [Google Scholar] [CrossRef]
- He, Z.; Zhong, M. A study of the dynamic impact of climate policy uncertainty on global energy prices and stock prices. Syst. Sci. Math. 2024, 1–24. Available online: https://link.cnki.net/urlid/11.2019.o1.20240903.1029.002 (accessed on 8 October 2024).
- Qian, L.; Jiang, Y.; Long, H. Extreme risk spillovers between China and major international stock markets. Mod. Financ. 2023, 21, 30–34. [Google Scholar] [CrossRef]
- Chen, D.; Hu, H.; Zhang, H. Research on risk spillover effect of oil market on China’s carbon market based on EVT-Copula-CoVaR. Oper. Res. Manag. 2024, 33, 108–115. [Google Scholar]
- Yao, C.-Z.; Zhang, Z.-K.; Li, Y.-L. The Analysis of Risk Measurement and Association in China’s Financial Sector Using the Tail Risk Spillover Network. Mathematics 2023, 11, 2574. [Google Scholar] [CrossRef]
- Chai, J.; Lin, J.; Liang, T. A study on the linkage of crude oil and natural gas in North American market-an empirical analysis based on Bayesian DCC-GARCH and LSTAR models. Manag. Rev. 2021, 33, 16–28. [Google Scholar] [CrossRef]
- Zhang, Q.; Yang, Y. Research on the risk spillover effect of carbon-intensive industries on the banking industry under the background of low-carbon transition. Financ. Econ. 2024, 7, 25–37. [Google Scholar]
- Zhang, A.-Y.; He, Y.-D.; Wen, H. Research on the interaction effect between energy price and energy stocks based on continuous wavelet. Econ. Issues 2020, 12, 18–28. [Google Scholar]
- Ma, Y.; Lu, J.; Lin, P.; Xie, Q. Structural correlation effect of global financial development and economic growth—an analysis based on financial cycle and financial stability mechanism. Financ. Sci. 2021, 10, 1–14. [Google Scholar]
- Zhu, B.; Ma, Y.; Chen, D. The mechanism of the role of debt financing mode on the spillover effect of industry financial risk. Financ. Sci. 2018, 1, 15–27. Available online: https://kns.cnki.net/kcms2/article/abstract?v=CdHX_LbaUYxuq-yQd0ka7kSkiqvEZUqhn9OsoJn3yTgQIAYETXIeK8pau5K-zxF0cRX48WMW_2i2fCu2zAy2vwf8ij_44mQVOmfrqvif9QymEkSCBsdJrh-fzYOyDg7o46p1NmfsGHMpKKEgjxLRGW3H7WbAciZIXyPNrFd1bRh2_gDiyHDMhy-7RsH4RRlB&uniplatform=NZKPT&language=CHS (accessed on 8 October 2024).
- Zhong, W.; Li, H. A study of tail risk spillover effects of international oil prices, macroeconomic variables and Chinese stock market. China Manag. Sci. 2022, 30, 27–37. [Google Scholar] [CrossRef]
- Li, H.; Li, W.; Hu, Y.; Zhang, R.; Li, Y.; Chang, Y. Analysis and trend forecast of refined oil prices in 2024. J. Beijing Inst. Technol. (Soc. Sci. Ed.) 2024, 26, 59–67. [Google Scholar]
- Akyildirim, E.; Cepni, O.; Molnár, P.; Uddin, G.S. Connectedness of energy markets around the world during the COVID-19 pandemic. Energy Econ. 2022, 109, 105900. [Google Scholar] [CrossRef]
- Li, B.; Zhang, J.; Shen, X. Is there a stock premium effect for climate change risk. Financ. Sci. 2024, 6, 31–47. Available online: https://kns.cnki.net/kcms2/article/abstract?v=CdHX_LbaUYw3zwiiDXo1eBosuXZ5t81JTNREzqZB45Q7k5EhPGK9o0mCE4GDsF6eias0Mn12BS10ejazNpTqYqTciK-JsRhD2KNlDLtMzcTq179rJti0G4cRpESB6ubehR-OKuIl_eofyXt6C6nH6ifoUSwTiCigV9E3mlnVanlMUDeXGP61NkBhTGG9UQvc&uniplatform=NZKPT&language=CHS (accessed on 8 October 2024).
- Wang, L.; Wang, X.; Liang, C. Natural gas volatility prediction via a novel combination of GARCH-MIDAS and one-class SVM. Q. Rev. Econ. Financ. 2024, 98, 101927. [Google Scholar] [CrossRef]
- Bao, M.; Ding, Y.; Zhou, X.; Guo, C.; Shao, C. Risk assessment and management of electricity markets: A review with suggestions. CSEE J. Power Energy Syst. 2021, 7, 1322–1333. [Google Scholar] [CrossRef]
- Zhang, D.; Zhao, M.; Wang, Y.; Vigne, S.A.; Benkraiem, R. Technological innovation and its influence on energy risk management: Unpacking China’s energy consumption structure optimisation amidst climate change. Energy Econ. 2024, 131, 107321. [Google Scholar] [CrossRef]
Disclaimer/Publisher’s Note: The statements, opinions and data contained in all publications are solely those of the individual author(s) and contributor(s) and not of MDPI and/or the editor(s). MDPI and/or the editor(s) disclaim responsibility for any injury to people or property resulting from any ideas, methods, instructions or products referred to in the content. |
© 2025 by the authors. Licensee MDPI, Basel, Switzerland. This article is an open access article distributed under the terms and conditions of the Creative Commons Attribution (CC BY) license (https://creativecommons.org/licenses/by/4.0/).