Abstract
As a national strategic development area, the Yellow River Basin (YRB) has seen progress in research on the synergy efficiency of pollution reduction and carbon reduction (SEPCR). However, there are still notable gaps. The theoretical framework for this area is lacking, leading to diverse and inconsistent conclusions. Additionally, difficulties in data collection and processing, along with incomplete and inconsistent data, negatively affect the accuracy of research findings. Current studies tend to focus on single aspects and lack a comprehensive and systematic analysis of the SEPCR across the entire basin. There is insufficient understanding of key network nodes, connections, and overall structural characteristics. A scientific assessment of its spatial correlation structure has far-reaching implications for the national battle against pollution and the realization of “dual carbon” goals. This study is based on panel data from 75 cities in the YRB from 2006 to 2022. It employs an ultra-efficiency SBM model to measure the SEPCR. Additionally, it utilizes a modified gravity model and social network analysis to explore the spatial network correlation structure in depth. Furthermore, the QAP model is used to clarify the mechanisms of various influencing factors. The research findings indicate that there is an imbalance in the spatial and temporal distribution of the SEPCR in the YRB. Although there is a fluctuating upward trend over time, significant internal spatial disparities exist. While the gaps between regions are gradually narrowing, there are still evident research disparities. Moreover, the spatial connectivity of the SEPCR in the YRB is gradually strengthening, with overall network connectivity also improving, yet there remains a considerable distance from an ideal state. The network density shows a decreasing trend from the downstream to the midstream and then to the upstream regions, with significant differences in spatial network centrality among these areas, particularly pronounced between the midstream and upstream regions. Differences in economic development levels, technological development levels, and industrial structure development levels promote the formation of spatial correlations in SEPCR, while disparities in energy utilization have a suppressive effect.
1. Introduction
In the context of increasingly severe global climate change and environmental pollution, SEPCR has become an important topic in global environmental governance [1]. The proposal of carbon peak and carbon neutrality goals marks a new phase in China’s ecological and environmental protection, entering a stage of synergistic governance for SEPCR [2]. This synergy has become a crucial mechanism for promoting a comprehensive low-carbon and green transformation of socio-economic development. In June 2022, the Ministry of Ecology and Environment, along with six other departments, jointly issued the “Implementation Plan for SEPCR”, emphasizing cities as one of the key focus areas and encouraging the organization of pilot projects for SEPCR.
The YRB, as an important ecological security barrier and economic development area in China, holds significant strategic importance for ecological environment protection and governance [3]. However, ecological environmental issues in the YRB remain severe, including water pollution, air pollution, and soil pollution. These issues not only affect the ecological environment quality within the basin but also impose serious constraints on its economic and social development [4].
As the nation increasingly emphasizes ecological civilization construction, SEPCR has become an important direction for ecological environment governance in the YRB [5]. This strategic approach aims to collaboratively promote SEPCR to achieve a win-win situation for economic development and environmental protection. The report of the 19th National Congress of the Communist Party of China stressed the need to establish a more effective new mechanism for regional coordinated development, improve resource allocation efficiency, and enhance the synergy, linkage, and integrity of regional development [6]. This implies that the SEPCR in the YRB cannot overlook the internal linkage effects and must strengthen information sharing and factor flow between regions [6].
Therefore, this paper focuses on the “SEPCR” as its research subject, aiming to provide scientific evidence and decision-making support for ecological environmental protection and economic development in the YRB through an in-depth analysis of the spatial correlation network structure of pollution and carbon reduction efficiency and its influencing factors. The main contributions of this research are as follows: First, based on a rich panel dataset, the study employs a super-efficient SBM model for undesirable outputs to scientifically measure the SEPCR in 75 cities of the YRB, providing precise efficiency evaluations. Second, by utilizing a modified gravity model and social network analysis, the study empirically analyzes the spatial correlation structure of SEPCR in the YRB, revealing its spatial interconnected characteristics. Furthermore, an in-depth analysis using the QAP model identifies the factors influencing the spatial correlation of SEPCR, offering a scientific basis for formulating differentiated management measures. Compared to other studies, the novelty of this research is primarily reflected in the following aspects: First, it focuses on the YRB, a strategically significant national development region with distinct regional characteristics. Second, the use of a super-efficient SBM model for undesirable outputs enhances the accuracy of the efficiency assessment. Third, the comprehensive application of various methods, including the modified gravity model, social network analysis, and QAP model, allows for a thorough analysis of the spatial correlation network structure of SEPCR and its influencing factors, revealing intrinsic patterns and mechanisms. These innovations not only enrich the research content of environmental economics and regional economics but also provide new insights and methods for ecological environmental governance and sustainable development in the YRB and nationally.
The structure of this paper includes the following sections: Introduction: this section elaborates on the research background, significance, and issues. Literature Review: this section organizes and reviews existing research on SEPCR, highlighting the deficiencies and providing theoretical support. Research theory and methods: this section introduces the theoretical foundation, design, and methods used in the study. Results analysis: this section reveals the spatial network correlation structure and interconnected characteristics of SEPCR in YRB, while also exploring the influencing factors. Discussion: this section interprets the research results and analyzes their policy and practical implications. Conclusion and recommendations: the section summarizes the findings and offers suggestions.
2. Literature Review
In recent years, research on the SEPCR has become a focal point of attention. Scholars have primarily concentrated on exploring the connotations, measurement and evaluation, and influencing mechanisms of this synergy.
In the field of theoretical analysis of SEPCR, recent studies have mainly focused on the synergistic carbon reduction effects in air pollution control across different regions, industries, or sectors, as well as the synergistic pollution reduction effects in greenhouse gas governance [7,8]. Researchers have delved into how to achieve effective control of air pollution and significant reductions in carbon emissions through the collaborative effects of policies. From the perspective of policy synergy, the effectiveness of carbon reduction policies in pollution reduction and the effectiveness of air pollutant control policies in carbon reduction have been assessed [9,10]. Scholars have attempted to quantify the environmental benefits of these policies in order to provide scientific evidence for policymakers. Additionally, discussions have included the dual environmental welfare effects of other types of policies, such as energy rights trading systems and fiscal expenditure policies, in terms of SEPCR [2,11]. These policies not only promote improvements in environmental quality but may also yield economic benefits, thus achieving a win-win situation for environmental protection and economic development.
Scholars have also regarded the spatiotemporal evolution characteristics of the SEPCR as a research focus [12]. In assessing these synergistic effects, existing studies typically employ methods such as the synergistic control coordinate system [13,14], the coupling coordination degree model [15,16,17], or the construction of evaluation indicator systems for SEPCR [18,19], as well as the formulation of equations to measure these synergistic effects [20]. These approaches are aimed at evaluating the synergistic effects across different provinces, cities, and urban agglomerations in China.
In the process of SEPCR, multiple factors interact to influence its development [21,22]. Scholars have explored a wide range of influencing factors from different perspectives. Li et al. [23] used Panzhihua as a case study and conducted an in-depth analysis of the influencing factors of the SEPCR based on the methods of “engineering emission reduction”, “structural emission reduction”, and “management emission reduction”. Their findings revealed that different emission reduction technologies and measures had a significant positive synergistic effect on the collaborative reduction of pollution and carbon emissions. Gu et al. [24] selected three typical industries—electricity, steel, and cement—as research objects, and the results indicated that “structural emission reduction” was the most effective in reducing atmospheric pollutants and carbon dioxide emissions. Some researchers have focused on the relationship between socio-economic factors and the SEPCR. Fan et al. [25] utilized environmental input-output structural decomposition and synergistic effect assessment methods to analyze the collaborative impact of socio-economic factors on industrial air pollutants and carbon dioxide emissions in China. Kang Zhe et al. [26] pointed out that industrial added value and energy consumption per ten thousand CNY of industrial added value are key common factors affecting carbon dioxide emissions and industrial air pollutants in the urban agglomeration of the YRB. Qiu et al. [27] Based on the spatial effect, this paper analyzes the collaborative management of environmental pollution and carbon emissions in 30 provinces of China and points out that the key factor is to promote local green growth. Additionally, some scholars have comprehensively considered indicators from both natural and socio-cultural perspectives to explore the factors influencing the SEPCR [28,29]. Liu et al. [30] noted that the SEPCR in Chinese cities are more influenced by human factors. The prevailing research viewpoint suggests that economic development and energy consumption are the two core factors affecting the changes in the SEPCR [31,32,33].
Related studies have also demonstrated that, due to spatial effects, the driving factor indicators for SEPCR are not isolated; rather, they constitute significant spatial interactions that subsequently influence the development of SEPCR [34]. With the continuous development of socio-economic conditions and the increasingly diversified and intensified interactions among cities, the importance of urban spatial connections for coordinating regional sustainable development has become increasingly pronounced [35]. Existing research indicates that understanding the spatial correlation of SEPCR, while transcending the limitations of traditional spatial effect and clustering methodologies, will aid in revealing the internal linkage structures of various research areas [36]. In the study of the spatial association network for collaborative SEPCR, scholars both domestically and internationally have often employed methods such as the gravity model to depict micro-level spatial connections and regional centrality analysis to describe the characteristics of core network nodes [37,38].
In summary, as research on SEPCR continues to deepen, spatial network studies have gradually become a focal point in the field, providing a solid theoretical foundation for this study. Given the severe reality of SEPCR in the YRB, addressing the supply-demand contradictions within the basin requires further in-depth exploration. Currently, there is relatively limited research on the spatial structure of SEPCR in the YRB. There is a lack of in-depth exploration regarding the differences in synergistic efficiency, spatial correlation characteristics, and dynamic evolution patterns among different regions within the YRB. Moreover, investigating how the assessment of collaborative efficiency adapts to the concept of green development, and whether the increased exchange of information, technologies, and experiences related to industrial pollution reduction and carbon reduction among cities has led to a tight spatial network association, as well as differences in central transmission capabilities among city nodes in the network, will provide scientific references for governments at all levels in the basin to formulate development strategies. Based on this, this study selects 75 cities in the YRB as research subjects and utilizes the Super-SBM model to assess the SEPCR, considering undesirable outputs. Additionally, improved gravity models, social network analysis, and geographically weighted regression models will be employed to explore the network of SEPCR and its influencing factors in the basin. This research aims to provide theoretical support and practical guidance for cities within the basin to achieve green development and enhance their SEPCR. By systematically reviewing existing research findings, this study aims to enrich the research on the spatial structure of SEPCR within the YRB, further promoting the in-depth development of research in this field. Additionally, this study will provide reference methodologies and ideas for the research on SEPCR in other basins or regions.
3. Theoretical Analysis and Method
3.1. Theoretical Analysis Framework
The SEPCR refers to the dual goals of reducing pollutant emissions and lowering carbon emissions through means such as technological innovation, structural adjustments, and institutional innovation during the process of economic development, while maintaining or enhancing the quality and efficiency of economic growth [39]. It emphasizes the importance of seeking a balance between environmental protection and economic development, meaning that while pursuing economic growth, effective control of environmental pollution and carbon emissions must be achieved to realize green development. The level of SEPCR not only reflects the effectiveness of regional or industrial efforts in environmental protection but also embodies the quality and sustainability of economic development [40]. Therefore, enhancing this collaborative efficiency is a vital pathway to achieving green and sustainable development. The core objective of SEPCR is to achieve a win-win situation for economic development and environmental protection. Specifically, it aims to reduce pollutant and carbon emissions through scientific planning and technological innovation while also improving resource utilization efficiency and promoting the optimization and upgrading of economic structures. This aligns with the urgent global need to address climate change and environmental protection, and it serves as an important pathway to drive high-quality economic development in our country.
The relationship between urban network structure and the SEPCR is intricate and multifaceted [41]. At the level of network structure, the tight connections among urban nodes reflect the depth of resource flow and cooperation. The degree of this interconnectedness directly relates to the smoothness of resource flow, which may positively impact the SEPCR in cities. Furthermore, in the evaluation system for green transformation performance, the investment of knowledge and technological resources plays a critical role, serving not only as the core driving force for promoting green transformation but also as a key factor determining whether urban industries can achieve green development [42]. Additionally, the siphoning effect between cities should not be overlooked; it reveals the phenomenon of resources, capital, and technologies flowing from less efficient cities to more efficient ones. This flow pattern not only exacerbates the disparities in SEPCR between cities but also provides support for the sustainable development of high-efficiency cities [43]. Lastly, the establishment of intervention and adjustment mechanisms is crucial for optimizing urban network structures, guiding rational resource flows, and enhancing SEPCR. By implementing effective intervention measures and establishing dynamic adjustment mechanisms, urban networks can be directed toward a more sustainable development trajectory, ultimately enhancing overall SEPCR [44]. In summary, the urban network structure, investment in knowledge and technological resources, intercity siphoning effects, and intervention and adjustment mechanisms collectively form a multidimensional and multilevel theoretical framework that seeks to analyze and explain the generative mechanisms and influencing factors of SEPCR (Figure 1).
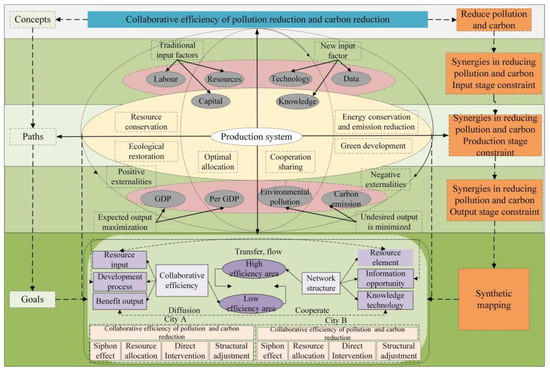
Figure 1.
Theoretical relationship between urban network structure and collaborative efficiency of pollution and carbon reduction.
3.2. Research Area
The YRB is not only an important base for energy, chemical, raw materials, and basic industries in China but also a crucial component of the country’s ecological security pattern, known as the “Two Screens and Three Belts”. However, among the numerous challenges faced in the development of the YRB, the issues of SEPCR are particularly prominent. With the rapid economic and social development, the industrialization and urbanization processes within the basin have accelerated, leading to increased environmental pollution and carbon emissions, which pose significant pressure on the ecological environment and sustainable development of the region. Therefore, in-depth research on the SEPCR in the YRB is of great significance for promoting green development and ensuring ecological security within the region.
Based on existing research, the study sample of the YRB includes 75 prefecture-level cities from 8 provinces (excluding Sichuan Province). Among them, 19 prefecture-level cities within Gansu Province, Qinghai Province, Inner Mongolia Autonomous Region, and Ningxia Hui Autonomous Region are classified as the upper reaches; 27 prefecture-level cities within Shanxi Province and Shaanxi Province are classified as the middle reaches; and 29 prefecture-level cities within Shandong Province and Henan Province are classified as the lower reaches.
3.3. Measurement of Collaborative Efficiency of Pollution Reduction and Carbon Reduction
Super-SBM Model Considering Unexpected Outputs
The model enables a more comprehensive assessment of resource utilization efficiency and environmental pollution conditions. Traditional Data Envelopment Analysis (DEA) models often focus solely on desirable outputs, neglecting the presence of undesirable outputs (such as pollutant emissions), which can lead to biased efficiency evaluation results. In contrast, the Super-SBM model incorporates undesirable outputs, making the assessment outcomes more reflective of actual conditions and allowing for a more accurate representation of the SEPCR in cities within the YRB. Additionally, the Super-SBM model possesses super-efficiency characteristics, enabling further differentiation and ranking of efficient decision-making units, thereby providing more refined decision support for the green development of cities in the YRB [45]. Therefore, this paper selects the Super-SBM model to measure the SEPCR in cities within the YRB. The specific formula is as follows:
In the formula, δ represents the efficiency value; m, q1, and q2 denote inputs, desirable outputs, and undesirable outputs, respectively. j means every DMU. is the intensity variable; are the input-output variables of the j decision-making unit; represent the slack variables for inputs, desirable outputs, and undesirable outputs, respectively; and denote the variables.
3.4. Spatial Association Network Structure Analysis Method
3.4.1. Social Network Analysis Method
The Social Network Analysis Method quantitatively analyzes the relationships among individuals or groups to reveal characteristics and patterns in social structure, information dissemination, and group behavior. The core of this method lies in constructing a social network diagram, which visually presents the connections between the research subjects. By analyzing indicators such as the topological structure of the network diagram, the strength of relationships between nodes, and network density, one can gain a deeper understanding of the interactive relationships, influence, and status among the subjects being studied. In practical applications, the Social Network Analysis Method is widely used across various fields. This study employs Ucinet 6 and Gephi 0.10.1 software to conduct a holistic and centrality analysis of the SEPCR in the YRB cities, with the relevant indicator calculation formulas detailed in Table 1.

Table 1.
Description of social network analysis indicators.
3.4.2. Modified Gravity Model
The modified gravity model, by incorporating various variables and factors, can better reflect the complexity of the real world and provide valuable reference information for policymakers. As a key technique for assessing spatial relationships, it can accurately depict the dynamic evolution characteristics of networks. To more accurately reveal the spatial association network SEPCR among cities in the YRB, the modified gravity model is constructed, with the specific formula as follows:
In the formula, Fij represents the spatial connection strength of SEPCR between city i and city j; Kij indicates the contribution of city i to the collaborative efficiency connection between cities i and j; Di and Dj denote the SEPCR for cities i and j, respectively; Pi, Pj, Gj, gi and gj represent the annual resident population, GDP, and per capita GDP of city i and city j; and dij is the economic distance between cities i and j.
3.5. Quadratic Assignment Procedure Model (QAP Model)
The Quadratic Assignment Procedure (QAP) is a powerful analytical tool that plays a significant role in fields such as social network analysis, management science, and operations research. The core idea of QAP is to reveal potential associations or patterns between two or more matrices through similarity comparisons. In social network analysis, it helps researchers compare the similarities between different network structures and further explore the impact of network structure on individual behavior, information dissemination, and other aspects. This study employs the QAP model, and the specific formula is as follows:
In the formula, represents the spatial network relationship matrix, and Xm (m = 1, 2, …, n) denotes the influencing factor matrix.
3.6. Construction of the Indicator System and Data Sources
3.6.1. Construction of the Input-Output Indicator System
A scientifically sound and reasonable input-output indicator system is fundamental and core in measuring the SEPCR. This study references and organizes previous research to clarify the development mechanism of SEPCR in cities within the YRB. Based on economic principles, this paper selects labor, capital, and resources as input indicators, represented by the average number of employees at the end of the year, fixed capital stock, and energy consumption, respectively. The expected output is characterized by actual GDP, while the unintended outputs are represented by the emissions of atmospheric pollutants and carbon emissions. Accordingly, an evaluation indicator system for the SEPCR in cities of the YRB has been constructed.
3.6.2. Data Sources
The data used in this study consists of panel data from 75 cities in the YRB from 2012 to 2022. The indicator data mainly come from sources such as the “China Urban Statistical Yearbook”, the “China Urban Construction Statistical Yearbook”, and the “China Energy Statistical Yearbook”, as well as statistical yearbooks from various provinces and environmental bulletins from prefecture-level cities. Focusing on the strong spatial aggregation of atmospheric pollutant emissions and carbon emissions, this paper limits “pollution reduction” to the field of air pollution, using the emission of the primary pollutant SO2 to represent it, while carbon emissions are represented by CO2 emissions. The measurement data primarily come from the “China Statistical Yearbook”, the “China Environmental Statistical Yearbook”, the “China Labor Statistical Yearbook”, and the China Carbon Accounting Database (CEADs).
4. Result Analysis
4.1. Analysis of the Spatial and Temporal Evolution of Collaborative Efficiency in Pollution Reduction and Carbon Decrease in the Yellow River Basin
Temporal Dynamic Evolution Characteristics
This study calculates the SEPCR in 75 cities of the YRB from 2012 to 2022, based on input-output indicator data. As shown in Figure 2, the average collaborative efficiency during this period is 0.306, which is significantly below the effective level. This indicates that the overall SEPCR in the YRB is in an ineffective state, failing to achieve optimal resource utilization and minimal environmental pollution. Over the past decade, the collaborative efficiency has shown a fluctuating upward trend, suggesting that certain progress has been made SEPCR in the YRB, but there is still substantial room for improvement. Specifically, from 2012 to 2015, the collaborative efficiency remained at a low level with little fluctuation, which may be related to the rapid economic development in the YRB during this stage, coupled with relatively lagging environmental protection measures. From 2016 to 2020, there was a significant improvement in collaborative efficiency, attributed to the strengthening of national environmental protection policies and the active response from various cities in the YRB. Between 2020 and 2022, although the collaborative efficiency continued to rise, the growth rate slowed down, which may be related to structural adjustments in the economy and bottlenecks in environmental protection technologies. Furthermore, from the perspective of the coefficient of variation, there are significant differences in collaborative efficiency among the cities in the YRB, possibly due to factors such as economic development levels, industrial structures, and environmental protection investments in each city.
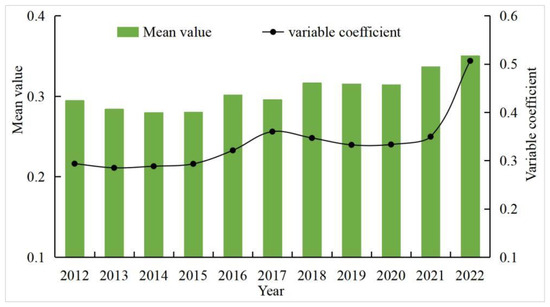
Figure 2.
Mean and coefficient of variation of collaborative efficiency for pollution reduction and carbon reduction in the Yellow River Basin.
To further reveal the temporal dynamics, a kernel density function estimation is used (Figure 3). The kernel density function shows a significant right-tail phenomenon in the SEPCR in the YRB under a polarized state. This phenomenon indicates that there is a certain polarized distribution of collaborative efficiency in the YRB, meaning that some regions exhibit relatively high industrial SEPCR. Observing the evolution of the peak, it is evident that the position of the main peak in the kernel density curve has shifted to the right, indicating an overall upward trend in the SEPCR in the YRB. During the period from 2012 to 2014, a notable change in the peak shape was observed, transitioning from a “sharp” characteristic to a more flattened form, with an increase in peak width and a declining trend in height. This suggests that the improvement in collaborative efficiency during this period was not evenly distributed but driven by a few regions that lifted the overall level. Additionally, the kernel density estimation reveals the diversity of efficiency distribution, indicating the presence of multiple groups with varying efficiency levels. This distribution characteristic may be related to factors such as regional economic development levels, industrial structures, resource endowments, and policy orientation. From 2015 to 2022, the peak significantly increased, and the peak width gradually narrowed, suggesting that the gap in collaborative efficiency among regions in the YRB is decreasing. This indicates that the number of regions with improved efficiency is increasing, and the efficiency levels are tending to converge. This improvement may be attributed to a series of ecological governance and protection measures implemented in recent years in the YRB, as well as the optimization and adjustment of industrial structures. Furthermore, policy support and guidance have also played a role in promoting the enhancement of SEPCR. In summary, the changes in the shape of the kernel density curve indicate that the temporal dynamics of collaborative efficiency in the YRB not only show an overall upward trend but also reflect a gradual optimization of the efficiency distribution pattern. These changes collectively demonstrate the positive progress made by the YRB in promoting green and low-carbon development.
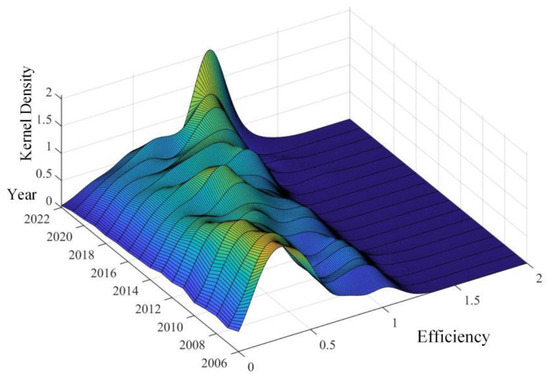
Figure 3.
Kernel density of collaborative efficiency for pollution reduction and carbon decrease in the Yellow River Basin.
4.2. Spatial Pattern of Synergistic Efficiency of Pollution Reduction and Carbon Reduction in the Yellow River Basin
Characteristics of Spatial Pattern Evolution
Using Arc GIS 10.2 software for visualizing the distribution of efficiency in spatial allocation, the natural breaks classification method was employed to categorize the SEPCRn into three levels: low efficiency, medium efficiency, and high efficiency (Figure 4). The study indicates that there are significant differences in the spatial distribution of the SEPCR.
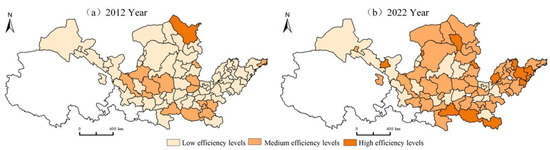
Figure 4.
Spatial pattern of synergistic efficiency of pollution reduction and carbon reduction in the Yellow River Basin.
The SEPCR in the YRB has significantly improved, with the number of cities achieving high efficiency levels increasing from 15 in 2012 to 34 in 2022. The efficiency values in the mid-lower reaches are generally higher than those in the mid-upper reaches. Cities in Shandong and Ningxia have consistently maintained high efficiency levels, attributed to their strong economic strength, advanced production techniques, and well-established environmental protection facilities. Additionally, these regions have adopted stricter measures for pollution management and carbon emission control, which have contributed to the enhancement of synergistic efficiency. In contrast, the mid-upper reaches, particularly certain economically disadvantaged areas, while striving to strengthen environmental governance in recent years, still face challenges in improving synergistic efficiency due to numerous historical issues and relatively simple industrial structures. Compared to the generally low efficiency levels observed in 2012, cities such as Baotou and Ordos in Inner Mongolia, Taiyuan in Shanxi, and most cities in Shandong transitioned from low efficiency to high efficiency by 2022, indicating significant progress in management practices related to synergistic efficiency. Cities like Jiuquan, Zhangye, and Wuwei in the upper reaches of the Yellow River, as well as Yinchuan, Guyuan, and Shizuishan in Ningxia, have remained at low efficiency levels from 2012 to 2022. This situation is primarily due to their reliance on a heavy industrial structure, with coal as the main energy source, and relatively low levels of environmental protection technology. Although the government has implemented a series of environmental governance policies in these areas, the effects of these measures have not yet fully materialized due to accumulated historical issues and regional development disparities. Additionally, the relatively lagging economic development and limited investment in environmental governance in these cities further constrain the enhancement of SEPCR.
Over the past decade, the SEPCR in the YRB has significantly improved, with an increasing number of high-efficiency cities. Cities in the middle and lower reaches generally have higher efficiency due to their advantages in economy, technology, and environmental protection facilities compared to those in the upper and middle reaches. Cities in Shandong and Ningxia have maintained high efficiency over the long term, benefiting from stringent pollution and carbon emission controls. In the upper and middle reaches, particularly in economically disadvantaged areas, despite efforts to improve the environment, the simple industrial structure and historical issues have limited efficiency gains. Some cities, such as Baotou, Ordos, Taiyuan, and many in Shandong, have achieved efficiency improvements, while upstream cities like Jiuquan, Zhangye, Wuwei, and those in Ningxia such as Yinchuan, Guyuan, and Shizuishan remain in a low-efficiency state due to problems related to industrial structure, energy consumption, and environmental protection technology. The lagging economic development and insufficient investment in environmental governance in these cities also restrict the improvement of SEPCR.
4.3. Spatial Network Structure of the Synergistic Efficiency of Pollution Reduction and Carbon Reduction in the Yellow River Basin
4.3.1. Spatial Strength of the Synergistic Efficiency of Pollution Reduction and Carbon Reduction
Based on the modified gravity model, the spatial strength of the SEPCR in the YRB was calculated, utilizing cross-sectional data from 2012 and 2022 for demonstration (Figure 5).
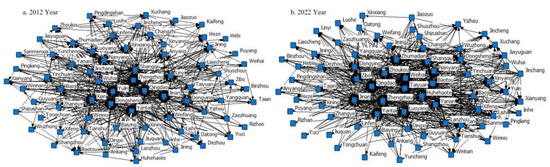
Figure 5.
The spatial correlation strength of synergistic efficiency in pollution reduction and carbon reduction in the Yellow River Basin.
Observing the data presented in Figure 4, from 2012 to 2022, the spatial relationships among cities in the YRB regarding SEPCR exhibited complex and networked characteristics. There were no completely isolated cities within the entire network structure; each city’s efficiency was influenced by neighboring cities. Cities such as Luoyang, Yantai, Nanyang, and Jinan played key leading and promoting roles during the transformation of synergistic efficiency, establishing close spatial connections with other cities. Additionally, varying degrees of connections existed between upstream and downstream cities within the basin. By the end of the study period, the spatial correlation strength of SEPCR in the YRB had weakened geographically. Some cities displayed significant advantages in economic levels, resource utilization, and pollution reduction technologies, leading to an expansion of the efficiency gap among cities and a reduction in the spatial correlation strength of their synergistic efficiency. Therefore, it is essential to strengthen the guidance and regulation of collaborative governance among cities within the YRB, particularly in terms of SEPCR, to promote resource sharing and technological exchange among cities. Additionally, in response to the widening gap in the SEPCR among cities that emerged towards the end of the study, differentiated policy measures should be developed. More support and assistance should be provided to cities with lower economic levels, inefficient resource utilization, or lagging pollution reduction technologies in order to narrow the gap between cities.
4.3.2. Overall Characteristics of the Spatial Correlation Network of Synergistic Efficiency in Pollution Reduction and Carbon Reduction
Using data from the years 2012 and 2022, the spatial correlation network evolution diagram of SEPCR among cities in the YRB was created using the social network analysis tool Ucinet 6 software, as shown in Figure 6.
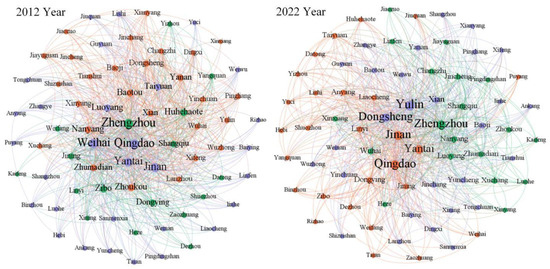
Figure 6.
Evolution of spatial correlation network assess urban resilience and associated weights. Note: The color shade of the network evolution represents the size of the node in the spatial correlation network, and the darker the color, the larger the degree value.
From Figure 6, it can be seen that the SEPCR in the YRB has transcended the traditional model based on spatial geographic proximity and spillover attributes. Over time, the overall network connections have become increasingly tight. The central positions in the network have gradually evolved from cities such as Qingdao, Jinan, Yantai, Weihai, and Zhuzhou in 2012 to cities like Yantai, Xi’an, Zhengzhou, Jinan, and Dongsheng in 2022. This reflects a shift in the focus of SEPCR among cities in the YRB. In this process, Xi’an and Zhengzhou, as regional central cities, have had a positive demonstration effect on surrounding cities through their improvement in synergistic efficiency. Additionally, Dongsheng, as an emerging energy city, has provided valuable experiences for other cities through its innovative practices in SEPCR management and utilization. The article employs indicators such as network density, network degree, network correlation, network efficiency, and recent upper limits to conduct an in-depth analysis of the overall characteristics of the spatial correlation network structure of SEPCR among cities in the YRB (see Table 2).
Table 2.
Network density and correlation analysis.
The research findings reveal the following: (1) During the study period, the performance of various cities in the YRB in the process of SEPCR showed significant differences due to various factors such as resources, technology, and policies. The network density exhibited a fluctuating downward trend, indicating that the cooperation network structure among regions is undergoing reorganization. Some cities enhanced their green development capabilities by strengthening regional cooperation, while others lagged in the transformation process due to a lack of effective cooperation mechanisms. (2) The network correlation remained at a level of 1 throughout the study period, indicating a close interdependence among cities in the YRB regarding SEPCR. This high degree of correlation may stem from the shared responsibilities and interests of cities in environmental protection within the basin, as well as the need for cooperation in the face of common environmental challenges. Additionally, the stability of the network central nodes reflects the core role of several key cities in promoting regional collaborative emissions reduction. These cities are not only important hubs for resource and technology exchange but also key nodes for policy dissemination and implementation. (3) From 2012 to 2022, the network hierarchy degree in the YRB decreased from 0.4470 to 0.3199, indicating a significant change in the original internal hierarchical structure of SEPCR, showing a trend towards dynamism and balance. With the deepening of environmental protection concepts and the government’s emphasis on sustainable development, these cities have gradually abandoned traditional resource-intensive development models and started exploring green and low-carbon development paths. (4) The upper limit of SEPCR among cities in the YRB has stabilized at a level above approximately 0.75, reflecting an improvement in the stability of the spatial network, indicating that the performance of cities in collaborative efficiency during the green transformation process is tending to stabilize. To further enhance overall efficiency, it is recommended that relevant cities strengthen regional cooperation, share green technologies and management experiences, and optimize industrial structures. (5) In the spatial correlation network, the recent upper limit of SEPCR among cities in the YRB shows an overall upward trend, rising from 0.9141 in 2012 to 0.9708 in 2022. This increase indicates a gradual reduction in redundant relationships within the network and a growing number of spillover relationships among regions, leading to enhanced network stability. This improvement is mainly attributed to the joint efforts and significant achievements of cities in the YRB in green development in recent years. At the same time, this trend also reflects an increased awareness among cities in the YRB regarding environmental protection and sustainable development, as well as improved policy enforcement. By continuously optimizing regional cooperation mechanisms and strengthening technological exchanges and policy coordination, the YRB is expected to achieve more efficient and greener collaborative SEPCR in the future, laying a solid foundation for the sustainable development of the entire basin.
4.3.3. The Evolution of Network Centrality in Industrial Green Water Resource Efficiency
Network centrality is a quantitative measure of a city’s position within the spatial correlation network of SEPCR. Figure 7 illustrates the degree centrality, closeness centrality, and betweenness centrality of the network for SEPCR in the YRB.
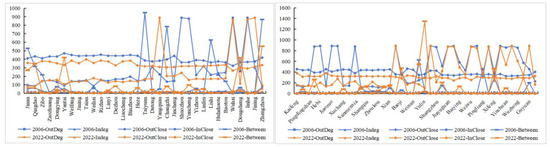
Figure 7.
Yellow River Basin centrality analysis.
(1) Degree Centrality: As an indicator of the importance of network nodes, degree centrality reveals the role and position of cities in the YRB within the spatial correlation network for SEPCR. Based on the trend analysis of data from 2012 to 2022, degree centrality shows a fluctuating upward trend, indicating that these cities are increasingly becoming receiving nodes within the network on the path to green development. This reflects an increasing dependence of cities in the YRB on external resources and information during the collaborative process of SEPCR. It is noteworthy that the rise in degree centrality does not imply complete passivity in the green transformation of these cities. Cities such as Dongying, Jinan, Zibo, Zhengzhou, and Taiyuan exhibit relatively high degree centrality, demonstrating strong capacity for attracting elements and occupying a dominant position in the spatial correlation network. In contrast, cities with lower degree centrality, including Sanmenxia, Shuozhou, Datong, Tai’an, and Jining, are mainly located in regions with relatively underdeveloped economies and technologies, thus playing a more subordinate role in the spatial correlation network.
(2) Closeness Centrality: During the research process, the closeness centrality indicators of most cities in the YRB have shown an upward trend, indicating that the connections among these cities regarding SEPCR are becoming increasingly tight, enhancing their development capacity. Among them, Taiyuan, Zhengzhou, Jinan, and Xi’an have higher closeness centrality. In the spatial correlation network, these cities can quickly establish communication channels with other cities, playing the role of central actors and generating positive leading effects. However, cities such as Yangquan, Wuhai, Hebi, Sanmenxia, Baotou, and Yulin have relatively low closeness centrality, exerting less influence on other provinces and occupying a dominated position within the network.
(3) Betweenness Centrality: The average value of betweenness centrality shows a fluctuating upward trend. This phenomenon reveals that the role of intermediary institutions is gradually becoming prominent in the process of enhancing SEPCR among cities in the YRB, playing a crucial role in promoting this collaborative efficiency. However, with the strengthening of national environmental protection policies and the widespread dissemination of sustainable development concepts, these cities have gradually recognized the significant importance of collaborative development in SEPCR, actively seeking pathways for transformation. Cities such as Xianyang, Yantai, Jincheng, Baoji, Weifang, and Weihai have betweenness centrality values above the average, reflecting that the quality and efficiency of their services are continuously improving, and their influence on SEPCR is becoming increasingly significant, thereby contributing to the gradual rise in the average betweenness centrality. Through spatial correlation analysis, cities like Shangqiu, Xinyang, Yuncheng, and Linfen play a core role in regional economic cooperation, promoting coordinated regional development and optimizing resource allocation.
4.4. Analysis of Influencing Factors of Spatial Network of Collaborative Efficiency of Pollution Reduction and Carbon Reduction in the Yellow River Basin
4.4.1. Influencing Factor Index Selection
The spatial heterogeneity and complex diversity of influencing factors of the SEPCR in the YRB were considered. The level of economic development reflects the regional economic strength and consumption capacity and is one of the important factors affecting the SEPCR. The level of scientific and technological development reflects the innovation ability of the region, which plays a key role in promoting the progress of green technology and realizing energy conservation and emission reduction. The upgrading level of industrial structure is related to the quality and sustainability of regional economic development, and optimizing industrial structure helps to reduce pollution emissions and improve energy efficiency. The intensity of environmental regulations reflects the government’s emphasis on environmental protection, and strict environmental regulations can encourage enterprises to adopt more environmentally friendly production methods. The level of energy consumption is directly related to carbon emissions, and reducing the intensity of unit energy consumption is an important way to achieve carbon emission reduction. The development level of green finance reflects the regional financial system’s support for green economy. The development of green finance can guide funds to the environmental protection industry and promote the improvement of the SEPCR. With comprehensive reference to existing relevant research results, this paper selects six indicators, namely economic development level, scientific and technological development level, industrial structure upgrading level, environmental regulation intensity, energy consumption level, and green finance development level, respectively, as shown in Table 3. Per capita GDP, the number of green invention patent applications, the proportion of the secondary industry in GDP, the proportion of environmental protection words in the total words of the work report, the intensity of unit energy consumption, and the green finance development index, respectively, were used to characterize the results.
Table 3.
Selected influencing factors.
4.4.2. QAP Correlation Analysis
By using the QAP correlation analysis of Ucinet 6 software, the matrix data were randomly arranged 5000 times and the correlation between the SEPCR in the YRB and each explanatory variable was obtained, and the results were shown in Table 4. The correlation coefficient between the spatial network of SEPCR in the YRB and scientific and technological innovation is 0.286; the correlation coefficient with the level of economic development is −0.113. The correlation coefficient with environmental regulation intensity was 0.208, and both passed the 1% significance level test. The effects of industrial structure upgrading level, energy consumption level, and green finance development level on the spatial network of the SEPCR in the YRB all passed the 10% significance level test, indicating that the improvement of scientific and technological innovation ability and the strengthening of environmental regulation intensity are conducive to the improvement of the SEPCR in the YRB. However, the negative correlation between economic development level and the spatial network of the SEPCR in the YRB may indicate that at the current stage, the improvement of economic development level has not led to the improvement of the SEPCR simultaneously, and it is necessary to further optimize the economic development model to achieve green development. In addition, although the level of industrial structure upgrading, energy consumption and green finance development have passed the significance level test, the specific mechanism of their impact on the spatial network of the SEPCR in the YRB needs to be further studied.
Table 4.
QAP correlation analysis.
4.4.3. QAP Regression Analysis
Through Ucinet software, QAP regression analysis of the above six variables was further carried out. In order to solve the multicollinearity problem of independent variables, the study set the number of random permutations to 10,000, and the regression results obtained are shown in Table 5. The adjusted coefficient of determination is 0.526, indicating that six factors, including economic development level, scientific and technological development level, industrial structure upgrading level, environmental regulation intensity, energy consumption level, and green finance development level, can explain 52.6% of the spatial correlation effect of the SEPCR in the YRB. Specifically, the regression coefficient of industrial structure and green finance development level, which affect the SEPCR in the YRB, passed the significance test of 1%, and the regression coefficient was positive, indicating that with the optimization and upgrading of industrial structure and the continuous development of green finance, the SEPCR in the YRB will be improved. The optimization of industrial structure may promote the efficient use of resources and the reduction of pollution, while the development of green finance provides financial support for environmental protection and low-carbon projects and promotes the progress of SEPCR. The regression coefficient of economic development level shows a significant negative correlation. The more economic development, the more pollution, which affects the improvement of the SEPCR. Environmental regulation intensity, scientific and technological innovation, and energy consumption level have significant effects at the level of 5%. The regression coefficient of environmental regulation intensity is significantly positive, which means that the difference in environmental regulation intensity will positively affect the spatial correlation of the SEPCR, that is, the region with stricter environmental regulation has a stronger spatial correlation of the SEPCR. This may be due to the fact that strict environmental regulations promote regional cooperation in environmental protection and carbon reduction, thus enhancing synergistic efficiency. The regression coefficient of scientific and technological innovation is also significantly positive, indicating that the difference in scientific and technological innovation level has a positive impact on the spatial correlation of the SEPCR. The improvement of scientific and technological innovation ability is conducive to the exchange and cooperation between regions on environmental protection technology and emission reduction technology, so as to promote the improvement of SEPCR. The regression coefficient of energy consumption level is significantly negative, indicating that the difference in energy consumption has a negative influence on the spatial correlation of the SEPCR. Regions with higher energy consumption levels may also have relatively higher environmental pollution and carbon emissions, which may hinder regional cooperation in SEPCR.
Table 5.
QAP regression analys.
5. Discussion
This study employs a super-efficient SBM model for undesirable outputs to measure the SEPCR in the YRB. Compared to traditional models, this approach can more comprehensively consider the impact of undesirable outputs, such as environmental pollution, on efficiency, leading to a more accurate assessment of synergistic efficiency. Methodologically, this research presents innovations that offer new perspectives on the SEPCR in the YRB and other regions.
In analyzing the spatial correlation network structure, this study utilizes a modified gravity model and social network analysis to empirically demonstrate the spatial network correlation structure of efficiency. This finding not only reveals the transmission relationships of SEPCR among cities within the YRB but also provides empirical support for understanding the complexity of inter-regional environmental governance. Unlike existing literature that often focuses on the environmental efficiency of individual cities or regions, this study significantly extends the analysis into the spatial dimension, offering substantial theoretical and practical value.
Regarding the analysis of influencing factors, this study employs the QAP model to explore the impacts of economic development level, technological development level, industrial structure development level, and energy utilization differences on the spatial correlation of SEPCR. This analysis deepens the understanding of the factors influencing synergistic efficiency in the YRB and provides a scientific basis for formulating differentiated management measures. In contrast to previous studies that often focus on the impact of single factors on efficiency, this research makes breakthroughs in the diversity and complexity of influencing factors.
The results of this paper are of great significance to the existing theory and practice. First of all, this study reveals the spatial correlation network structure characteristics of the SEPCR in the YRB, which provides a scientific basis for formulating regional green development policies. Secondly, through QAP analysis, we identified the key factors affecting the spatial correlation of the SEPCR in the YRB and provided targeted policy suggestions for improving the overall SEPCR in the basin. In addition, this study also emphasizes the importance of information sharing and collaboration among cities, which provides new ideas for promoting green development of river basins.
However, there are some limitations in this study. First of all, due to the limitation of data availability, this study failed to cover all cities in the YRB. The cities not included in the study mainly consist of the following: in Qinghai Province, Yushu Prefecture, Guoluo Prefecture, Hainan Prefecture, and Huangnan Prefecture; in Sichuan Province, Aba Prefecture; and in Gansu Province, Gannan Prefecture and Linxia Prefecture, which may affect the comprehensiveness of the study results. Secondly, this study mainly focuses on the spatial correlation of the SEPCR, while other factors that may affect the efficiency, such as policy environment and social culture, are not discussed in depth. Future studies can further expand the scope of the study to include more cities and data and further explore other factors that may affect the SEPCR, so as to more comprehensively reveal the internal mechanisms of green development in the YRB. In addition, more advanced models and methods, such as machine learning and deep learning, can be used to more accurately analyze and predict the SEPCR in the YRB.
6. Conclusions and Implications
6.1. Conclusions
(1) The SEPCR in the YRB showed a fluctuating growth trend, and its average efficiency level was relatively low. In the YRB, the SEPCR showed a trend of fluctuation and increase in the time dimension, while in the spatial dimension, the gap between regions was gradually narrowing and gradually formed a distribution pattern of utilization efficiency being higher in the lower reaches than the upper reaches and higher in the upper reaches than the middle reaches.
(2) With the increasing attention of the country to the construction of ecological civilization and green development, the spatial linkage strength of the SEPCR in the YRB shows a gradually increasing trend, but there is still a certain gap compared with the ideal state. The connectivity of the overall urban network in the YRB is also increasing, which helps to promote the flow and optimal allocation of key factors such as resources, technology, and talent, thus promoting the improvement of the process of the overall SEPCR. However, the spatial correlation network structure of each city has not achieved balanced development.
(3) From the analysis of network centrality characteristics, the spatial network centrality of the SEPCR in the YRB has significant differences. The upstream cities show a high factor attraction ability and occupy a dominant position in the connection of cyberspace. The centrality of the middle and upstream cities is low, and the improvement of the SEPCR has little impact on other cities, meaning they are in a subordinate position in the network. The mean value of intermediate centrality shows an increasing trend, which indicates that the dominant role of the central node in the network is strengthening, and the network structure presents a significant non-equilibrium feature.
(4) According to the results of QAP analysis, economic development level, scientific and technological development level, and industrial structure are the key factors affecting the formation and development of spatial correlation of the SEPCR in the YRB. In the process of promoting the SEPCR, we must pay attention to the accumulation of environmental regulations and green finance, promote the information operation among cities, and enhance the closeness of spatial correlation.
6.2. Policy Implications
(1) The SEPCR in the YRB showed a fluctuating growth trend, with a relatively low average efficiency level. In order to further improve the SEPCR in midstream cities, it is necessary to strengthen policy guidance and capital investment, especially support for midstream cities. Such measures are expected to effectively narrow the gap between regions, promote the coordinated development of various regions in the basin, and jointly achieve a win-win situation of environmental improvement and economic development.
(2) The spatial linkage strength of the SEPCR in the YRB has gradually increased, but there is still a certain gap compared with the ideal state. In order to further improve the structural optimization of spatial correlation networks, effective measures should be taken to promote the balanced flow and optimal allocation of key elements such as resources, technologies, and talent within the basin. This includes a detailed analysis and adjustment of the existing network structure to ensure that every link can operate efficiently. In particular, attention should be paid to strengthening the linkage between the middle and upstream cities and the downstream cities, and a more efficient and collaborative spatial correlation network should be formed by establishing closer ties and cooperation mechanisms. Such a network can not only promote resource sharing and complementary advantages within the region but also enhance the competitiveness and sustainable development capacity of the entire basin.
(3) The SEPCR in the YRB shows significant regional differences in terms of spatial network centrality. The centrality index of middle- and upper-reaches cities is low, and these cities play a subordinate role in the network structure. In order to further strengthen the leading role of network central cities, efforts should be made to enhance the dominant position of upstream cities in cyberspace correlation. This requires not only the efforts of the upstream cities themselves but also the positive response of the middle and upstream cities to strengthen their own construction and improve their SEPCR. Through such efforts, middle and upstream cities can increase their influence in the network, resulting in a more cohesive and efficient network city system.
(4) Economic development, scientific and technological progress, and industrial structure are the key factors affecting the spatial correlation of SEPCR in the YRB. However, differences in energy consumption have significant negative effects on this spatial correlation. There is a need to pay close attention to the level of economic development, scientific and technological progress, and the coordinated optimization of industrial structure so as to promote the industrial transformation and upgrading of the YRB in order to achieve sustainable green development. In addition, the strengthening of environmental regulations and the accumulation of green finance play a crucial role in improving the SEPCR, which will provide solid support and guarantee for our environmental protection work. At the same time, the influence of energy consumption differences on the SEPCR in the YRB should be fully considered when formulating relevant policies. By optimizing the energy structure, promoting the use of clean energy, and reducing the proportion of high-pollution and high-energy-consumption industries, the negative impact of energy consumption differences can be effectively reduced. Increasing the research and development and promotion of energy-saving and emission reduction technologies and improving energy efficiency are also important ways to improve the SEPCR in the YRB.
Author Contributions
Conceptualization, F.Y. and J.Z.; methodology and software, X.C.; validation, F.Y., J.Z., and X.C.; formal analysis, X.C.; data curation, X.C.; writing—original draft preparation, F.Y.; writing—review and editing, F.Y.; visualization, J.Z.; supervision, J.Z.; project administration, X.C.; funding acquisition, X.C. All authors have read and agreed to the published version of the manuscript.
Funding
This article was funded by the Inner Mongolia Autonomous Region Graduate Research Innovation Project (No. B20231054Z); National Natural Science Foundation of China (No. 42361029).
Institutional Review Board Statement
Not applicable.
Informed Consent Statement
Not applicable.
Data Availability Statement
The data can be obtained from the corresponding authors upon reasonable request.
Conflicts of Interest
The authors declare no conflicts of interest.
Abbreviations
The following abbreviations are used in this manuscript:
| SEPCR | Synergy Efficiency of Pollution Reduction and Carbon Emission Reduction |
| YRB | Yellow River Basin |
References
- Liang, C.; Chen, X.; Di, Q. Path to pollution and carbon reduction synergy from the perspective of the digital economy: Fresh evidence from 292 prefecture-level cities in China. Environ. Res. 2024, 252, 119050. [Google Scholar] [CrossRef]
- Wang, H.; Gu, K.; Dong, F.; Sun, H. Does the low-carbon city pilot policy achieve the synergistic effect of pollution and carbon reduction? Energy Environ. 2024, 35, 569–596. [Google Scholar] [CrossRef]
- Chen, Y.P.; Fu, B.J.; Zhao, Y.; Wang, K.B.; Zhao, M.M.; Ma, J.F.; Wu, J.H.; Xu, C.; Liu, W.G.; Wang, H. Sustainable development in the Yellow River Basin: Issues and strategies. J. Clean. Prod. 2020, 263, 121223. [Google Scholar] [CrossRef]
- Feng, Y.; Liu, W.; Zhang, H.; Li, Q.; Zhu, A. Synergistic assessment of environmental pollutants and carbon emissions in the Yellow River Basin, China: An integrated study based on scenario simulation and process decomposition. Ecol. Indic. 2024, 166, 112334. [Google Scholar] [CrossRef]
- Cai, Z.; Yang, X.; Lin, H.; Yang, X.; Jiang, P. Study on the co-benefits of air pollution control and carbon reduction in the Yellow River Basin: An assessment based on a spatial econometric model. Int. J. Environ. Res. Public Health 2022, 19, 4537. [Google Scholar] [CrossRef] [PubMed]
- Deng, G.; Li, M.; Liu, Y. Study on spatial correlation network and influencing factors of environmental efficiency of major cities in Yellow River Basin. Energy Rep. 2025, 13, 525–537. [Google Scholar] [CrossRef]
- Chien, F.; Sadiq, M.; Nawaz, M.A.; Hussain, M.S.; Tran, T.D.; Le Thanh, T. A step toward reducing air pollution in top Asian economies: The role of green energy, eco-innovation, and environmental taxes. J. Environ. Manag. 2021, 297, 113420. [Google Scholar] [CrossRef] [PubMed]
- Wei, X.; Tong, Q.; Magill, I.; Vithayasrichareon, P.; Betz, R. Evaluation of potential co-benefits of air pollution control and climate mitigation policies for China’s electricity sector. Energy Econ. 2020, 92, 104917. [Google Scholar] [CrossRef]
- Liu, J.Y.; Woodward, R.T.; Zhang, Y.J. Has carbon emissions trading reduced PM2.5 in China? Environ. Sci. Technol. 2021, 55, 6631–6643. [Google Scholar] [CrossRef] [PubMed]
- Yang, X.; Yang, X.; Zhu, J.; Jiang, P.; Lin, H.; Cai, Z.; Huang, H.; Long, J. Synergic emissions reduction effect of China’s “Air pollution prevention and control action plan”: Benefits and efficiency. Sci. Total Environ. 2022, 847, 157564. [Google Scholar] [CrossRef] [PubMed]
- Tian, J.; Fu, S.; Liu, X. Can the fiscal expenditure policy achieve the synergistic effect of reducing pollution and carbon? J. Financ. Sci. 2012, 74, 100–115. [Google Scholar]
- Nie, C.; Lee, C.C. Synergy of pollution control and carbon reduction in China: Spatial–temporal characteristics, regional differences, and convergence. Environ. Impact Assess. Rev. 2023, 101, 107110. [Google Scholar] [CrossRef]
- Li, Y.M.; Cui, Y.F.; Cai, B.F.; Guo, J.; Cheng, T.; Zheng, F. Spatial characteristies of CO2 emissions and PM2.5 conentrations in China based on gridded data. Appl. Energy 2020, 266, 114852. [Google Scholar] [CrossRef]
- Tang, X.B.; Zhang, Y.; Cao, L.Z.; Zhang, J.M.; Chen, X.H. Spatial and temporal characteristics of synergistic effects on carbon reduction in China and their influencing mechanisms. Res. Environ. Sci. 2022, 35, 2252–2263. [Google Scholar]
- Chen, S.Y.; Tan, Z.X.; Mu, S.Y.; Wang, J.; Chen, Y.; He, X. Synergy level of pollution and carbon reduction in the Yangtze River Economic Belt: Spatial-temporal evolution characteristics and driving factors. Sustain. Cities Soc. 2023, 98, 104859. [Google Scholar] [CrossRef]
- Yang, X.; Ran, G. Factors influencing the coupled and coordinated development of cities in the Yangtze River Economic Belt: A focus on carbon reduction, pollution control, greening, and growth. J. Environ. Manag. 2024, 370, 122499. [Google Scholar] [CrossRef] [PubMed]
- Li, J.; Wei, W.; Zhang, P.; Han, X.; Yang, Y.X.; Xue, J.; Yu, Y.M. Promoting effect and spatial differentiation of urban digital economy development on synergies of pollution reduction and carbon reduction in China. Econ. Geogr. 2023, 43, 169180. [Google Scholar]
- Alimujiang, A.; Jiang, P. Synergy and co-benefits of reducing CO2 and air pollutant emissions by promoting electric vehicles: A case of Shanghai. Energy Sustain. Dev. 2020, 55, 181–189. [Google Scholar] [CrossRef]
- Cui, L.; Chen, H. Spatio-temporal characteristics and drivingfactors of pollution and carbon reduction in Beijing-Tianjin-Hebeiurban agglomeration. J. Ind. Technol. Econ. 2023, 42, 87–96. [Google Scholar]
- Xue, W.; Lei, Y.; Liu, X.; Shi, X.; Liu, Z.; Xu, Y.; Chen, X.; Song, X.; Zheng, Y.; Zhang, Y.; et al. Synergistie assessment of air pollution and carbon emissions from the economic perspective in China. Sci. Total Environ. 2023, 858, 159736. [Google Scholar] [CrossRef]
- Chen, W.; Tang, H.; He, L.; Zhang, Y.; Ma, W. Co-effect assessment onregional air quality: A perspective of policies and measures with greenhouse gas reduetion potential. Sci. Total Environ. 2022, 851, 158119. [Google Scholar] [CrossRef]
- Ahmad, M.; Ahmed, N.; Jabeen, M.; Jabeen, G.; Qamar, S.; Chandio, A.A.; Rehman, A.; Rauf, A. Empirics on heterogeneous links among urbanization, the intensity of electric power consumption, water-based emissions, and economic progress in regional China. Environ. Sci. Pollut. Res. 2020, 27, 38937–38950. [Google Scholar] [CrossRef]
- Li, L.P.; Zhou, G.M.; Ji, H.Y. Study of co-benefits assessment of pollution reduction: A case study in Panzhihua. China Popul. Resour. Environ. 2010, 20 (Suppl. S2), 91–95. [Google Scholar]
- Gu, A.; Teng, F.; Feng, X. Assessment and analysis on cobenefits of pollution control and greenhouse gases emission reduction in key sectors. China Popul. Resour. Environ. 2016, 26, 10–17. [Google Scholar]
- Fan, Y.; Jing, S.; Wang, N.; Zhang, J. Our Country Social Economy Driven Collaborative Reducing Carbon Footprint Reduction Study. Ecol. Econ. 2025, 1–18. Available online: http://kns.cnki.net/kcms/detail/53.1193.F.20240722.1403.002.html (accessed on 1 January 2025).
- Kang, Z.; Li, W.; Liu, W. Influencing factors and promotingmeasures of industrial pollution abatement and carbon reduction of the city clusters in the Yellow River Basin. China Environ. Sci. 2023, 43, 1946–1956. [Google Scholar]
- Qiu, L.; Xia, W.; Wei, S.; Hu, H.; Yang, L.; Chen, Y.; Zhou, H.; Hu, F. Collaborative management of environmental pollution and carbon emissions drives local green growth: An analysis based on spatial effects. Environ. Res. 2024, 259, 119546. [Google Scholar] [CrossRef]
- Yuan, W.; Sun, H.; Wang, J.; Li, J.; Ma, D. Spatial-temporal evolution and driving forces of urban pollution and carbon reduction in China. Econ. Geogr. 2022, 42, 72–82. [Google Scholar]
- Li, W.; Wen, C.; Su, X.Y.; Chen, B.S. Spatiotemporal evolution and driving factors of synergistic effect of urban pollution reduction and carbon reduction in Yangtze River Economic Belt. Res. Environ. Sci. 2024, 37, 1641–1653. [Google Scholar]
- Liu, K.; Ren, G.X.; Dong, S.M.; Xue, Y. The synergy between pollutionr eduction and carbon reduction in Chinese cities and its influencing factors. Sustain. Cities Soc. 2024, 106, 105348. [Google Scholar] [CrossRef]
- Jiang, F.; Chen, B.; Li, P.; Jiang, J.; Zhang, Q.; Wang, J.; Deng, J. Spatio-temporal evolution and influencing factors of synergizing the reduction of pollution and carbon emissions: Utilizing multi-source remote sensing data and GTWR model. Environ. Res. 2023, 229, 115775. [Google Scholar] [CrossRef] [PubMed]
- Zha, Q.; Liu, Z.; Wang, J. Spatial pattern and driving factors of synergistic governance efficiency in pollution reduction and carbon reduction in Chinese cities. Ecol. Indic. 2023, 156, 111198. [Google Scholar] [CrossRef]
- Zhang, Q.-Y.; Cai, B.-F.; Wang, M.-D.; Wang, J.-X.; Xing, Y.-K.; Dong, G.-X.; Zhang, Z.; Mao, X.-Q. City level CO2 and local air pollutants co-control performance evaluation:a case study of 113 key environmental protection cities in China. Adv. Clim. Change Res. 2022, 13, 118–130. [Google Scholar] [CrossRef]
- Han, D.; Diao, Y.; Wang, X. Spatial network correlation characteristics and driving factors of collaborative governance efficiency for pollution reduction and carbon reduction in the Yellow River Basin. Environ. Sci. 2025, 1–15. [Google Scholar] [CrossRef]
- Yin, H.; Zhang, Z.; Wan, Y.; Gao, Z.; Guo, Y.; Xiao, R. Sustainable network analysis and coordinated development simulation of urban agglomerations from multiple perspectives. J. Clean. Prod. 2023, 413, 137378. [Google Scholar] [CrossRef]
- Chen, X.; Di, Q.; Jia, W.; Hou, Z. Spatial correlation network of pollution and carbon emission reductions coupled with high-quality economic development in three Chinese urban agglomerations. Sustain. Cities Soc. 2023, 94, 104552. [Google Scholar] [CrossRef]
- Duan, Y.; Han, N.; Sun, C.; Li, D. Reducing the pollution to decarbonise synergies space correlation and the driving factors study. J. Environ. Sci. Res. 2024, 37, 2413–2422. [Google Scholar]
- Chen, X.; Di, Q.; Liang, C. The mechanism and path of pollution reduction and carbon reduction affecting high quality economic development-taking the Yangtze River Delta urban agglomeration as an example. Appl. Energy 2024, 376, 124340. [Google Scholar] [CrossRef]
- Nie, C.; Li, R.; Feng, Y. Analyzing Coupling Coordination of Pollution and Carbon Reduction with High-Quality Economic Development: A Case Study of China’s Yangtze River Economic Belt. Sustainability 2024, 16, 4892. [Google Scholar] [CrossRef]
- Sun, B.; Feng, T.; Du, M.; Liang, Y.; Feng, T. Spatially Correlated Network Structure and Influencing Factors of Carbon Emission Efficiency in the Power Industry: Evidence from China. Systems 2025, 13, 30. [Google Scholar] [CrossRef]
- Yang, Y.; Su, X. Spatial correlation network structure of carbon emission reduction capacity on urban agglomerations and its driving factors: A perspective of Sustainable Development Goals. Sustain. Cities Soc. 2024, 113, 105646. [Google Scholar] [CrossRef]
- Dong, J.; Li, C. Structure characteristics and influencing factors of China’s carbon emission spatial correlation network: A study based on the dimension of urban agglomerations. Sci. Total Environ. 2022, 853, 158613. [Google Scholar] [CrossRef]
- Zhang, X.; Zhou, J.; Wu, R.; Wang, S. Spatial network analysis and driving forces of urban carbon emission performance: Insights from Guangdong Province. Sci. Total Environ. 2024, 951, 175538. [Google Scholar] [CrossRef] [PubMed]
- Huo, T.; Cao, R.; Liu, B. Spatial correlation network structure of China’s building carbon emissions and its driving factors: A social network analysis method. J. Environ. Manag. 2022, 320, 115808. [Google Scholar] [CrossRef]
- Ren, L.; Yi, N.; Li, Z.; Su, Z. Research on the Impact of Energy Saving and Emission Reduction Policies on Carbon Emission Efficiency of the Yellow River Basin: A Perspective of Policy Collaboration Effect. Sustainability 2023, 15, 12051. [Google Scholar] [CrossRef]
Disclaimer/Publisher’s Note: The statements, opinions and data contained in all publications are solely those of the individual author(s) and contributor(s) and not of MDPI and/or the editor(s). MDPI and/or the editor(s) disclaim responsibility for any injury to people or property resulting from any ideas, methods, instructions or products referred to in the content. |
© 2025 by the authors. Licensee MDPI, Basel, Switzerland. This article is an open access article distributed under the terms and conditions of the Creative Commons Attribution (CC BY) license (https://creativecommons.org/licenses/by/4.0/).