Article

A Study on the Impact of New Urbanisation on Green Total Factor Productivity in Agriculture in Jilin Province

College of Economics and Management, Jilin Agricultural University, Changchun 130118, China
*
Author to whom correspondence should be addressed.
Sustainability 2025, 17(5), 2070; https://doi.org/10.3390/su17052070
Submission received: 14 December 2024 / Revised: 21 February 2025 / Accepted: 26 February 2025 / Published: 27 February 2025

Abstract

:
New urbanisation is crucial for agricultural green transformation and ensuring food and ecological security. Taking Jilin Province as its focus, this study constructs a new urbanisation index system covering four dimensions—population, economy, society, and ecology—and adopts the entropy method to assess its development level and measures agricultural green total factor productivity (GTFP) with the SBM-GML model, which accounts for non-desired outputs. The analysis of panel data and a fixed effects model from 2008 to 2022 finds that both new urbanisation and agricultural GTFP in Jilin Province show an upward trend. Additionally, new urbanisation has a significant positive impact on agricultural GTFP and indirectly enhances efficiency through the proportion of employees in the primary industry. Regional analyses show that the central region has a leading urbanisation level, but regional development is imbalanced; the growth of agricultural GTFP mainly relies on green technology progress, and the decline in technical efficiency requires careful attention. Based on this, it is recommended to promote urban–rural integration and high-quality agricultural development by optimising the spatial layout of new urbanisation, promoting agricultural technological innovation, and promoting industrial restructuring and synergistic development policies.

1. Introduction

Since the reform and opening up, China’s agriculture has achieved remarkable results. But, the long-term reliance on the crude production mode has wasted resources and damaged the environment, restricting modern agricultural development. In the report of the 19th CPC National Congress, the objectives of building a green development mode and strengthening the management of agricultural surface pollution are put forward. At the same time, new urbanisation, as the core driving force of China’s modernisation, is not only a key engine for the sustained and healthy development of the economy but also plays an important role in leading the optimisation and upgrading of industrial structure and economic growth, as well as in promoting the green development of agriculture. At the Central Economic Work Conference held in December 2023, the strategic requirement of “coordinating new urbanisation and comprehensive revitalisation of the countryside” was explicitly put forward, and “promoting urban–rural integration and coordinated regional development” was listed as one of the nine key tasks for achieving high-quality development in 2024. The meeting stressed the importance of organically integrating the promotion of new urbanisation with the comprehensive revitalisation of the countryside, promoting the two-way flow of all kinds of factors, promoting the construction of new urbanisation with county towns as important carriers, forming a new pattern of urban–rural integration and development, and deepening the leading role of new urbanisation in the development of green agriculture, which is of far-reaching significance in promoting China’s agriculture to a higher level and realising high-quality development.
Jilin Province, located in the middle of northeast China, is known as “the source of three rivers”. It has 1648 large and small rivers with a watershed area of at least 20 square kilometres, which belong to the Songhua, Liao, Yalu, Tumen, and Suifen River systems. The province has a temperate continental monsoon climate, with four distinct seasons and hot and rainy seasons coinciding. It is also part of the world-famous “Golden Corn Belt”, with per capita food possession, the food commodity rate, food exports, and corn exports ranking first in the country for many years. Jilin Province is also one of the key forestry provinces in China; it is rich in forest resources, and numerous areas in the province have been included in the national demonstration zones related to the construction of ecological civilisation. As an important commodity grain base in China, the green transformation of agriculture in Jilin Province is not only related to regional economic development but is also of strategic significance to national food security and ecological safety. Therefore, an in-depth exploration of the impact of new urbanisation on agricultural GTFP in Jilin Province can also provide a scientific basis for the formulation of differentiated policies.

2. Literature Review

2.1. New Urbanisation Study

New urbanisation is urbanisation characterised by the integration of urban and rural areas, interaction between industries and cities, economical and intensive development, ecological liveability, and harmonious development. Compared to traditional urbanisation, more emphasis is placed on the overall improvement of internal quality. Early studies tended to use a single indicator to measure the level of urbanisation [1], but this resulted in significant shortcomings in reflecting the quality and sustainability of urbanisation [2,3]. With a deepening understanding of the meaning of urbanisation, academics have gradually shifted to the construction of a multi-dimensional comprehensive evaluation system. For example, a systematic assessment of Russia’s urbanisation was achieved by constructing an indicator system in four dimensions: demographic, economic, social, and ecological [4]. Scholars further expanded the system to include seven major areas such as demography, energy, and healthcare, providing a more comprehensive analytical framework for the measurement of Iran’s urbanisation [5].
Existing studies propose three types of paths in indicator assignment methods. The subjective assignment method relies on experts’ experience but is easily affected by human bias. The objective assignment method (e.g., entropy value method) assigns weights based on data characteristics but lacks theoretical interpretations. Finally, the comprehensive assignment method combines subjective and objective methods to balance robustness and rationality [2]. The current research trend shows that the comprehensive assignment method has gradually become the mainstream choice because of its balance between science and operability.

2.2. Research on Green Total Factor Productivity (GTFP) in Agriculture

Agricultural green total factor productivity refers to an index to measure agricultural production efficiency and sustainable development capacity in the process of agricultural production after comprehensively considering resource input and environmental influence. Its main calculation methods are divided into two categories. Parametric methods (C-D function, transcendental logarithmic production function, etc.) need a preset production function form, making them simple but inflexible [6]. In contrast, non-parametric methods (e.g., DEA model and its derivatives) assess efficiency by constructing the production frontier, avoiding functional form constraints but potentially ignoring the effect of random errors [7].
In terms of models, scholars have incorporated non-expected outputs into the radial DEA framework [7], and the super-efficient SBM model has further solved the slack variable problem of the traditional model [8]. For indexing combined with DEA, scholars have adopted the SBM-GML index to measure China’s provincial GTFP, which has significantly improved the accuracy of dynamic analysis [9] and optimised inter-period comparability through the SBM-GML index [10]. However, the non-transferability and unsolvable problem of the traditional ML index still restrict its application [11].

2.3. Study on Mechanism of Linkage Between Urbanisation and Agricultural GTFP

Urbanisation influences agricultural GTFP both positively and negatively. Positive drivers include the following: urbanisation promotes GTFP through labour migration [12], economies of scale [13], and industrial structure upgrading [14]. Negative spillovers include the following: a widening urban–rural income gap [15] and resource mismatch [16] may inhibit the green transformation of agriculture, highlighting the “efficiency–equity” trade-off [17,18,19,20].
There are limitations in the research perspective. The existing literature mostly treats urbanisation as a control variable and adopts a single-dimensional analysis, such as focusing only on population urbanisation. A few studies have tried to explore the complex mechanisms of spatial spillovers and threshold effects from the comprehensive urbanisation level, but the following issues have not yet been addressed: Is there regional heterogeneity in the impact of urbanisation on GTFP? How do dynamic evolutionary trends (e.g., technology path dependence) moderate the relationship? Despite the fruitful results, the following deficiencies need to be remedied: (1) there is fragmentation in the indicator system, the quantitative criteria for agricultural GTFP have not yet been harmonised, and there is a lack of in-depth dissection of typical regions; and (2) the intermediate transmission paths (e.g., technological innovation, policy intervention) between urbanisation and GTFP have not been systematically revealed.

3. Theoretical Analysis and Research Hypothesis

3.1. Direct Impact of New Urbanisation on Green Total Factor Productivity in Agriculture

New urbanisation is an important factor affecting the green total factor productivity of agriculture in China [21]. This study conducts an in-depth analysis across the following three dimensions: (1) Through industrial expansion and structural upgrading, new urbanisation propels the migration of urban and rural labour forces and the liberation of land resources. In this transformative process, the deepening of agricultural capital directly facilitates the enhancement of production efficiency, thereby augmenting agricultural GTFP [22,23]. (2) Characterised by urban–rural coordination, new urbanisation reconfigures the traditional agricultural factor endowment pattern by dismantling institutional barriers and intensifying factor flows. Traditional agriculture adheres to a crude model centred around land and labour. The inefficient allocation of resources inherent in this model impedes the improvement of agricultural GTFP. Conversely, the factor radiation effect of urbanisation has the potential to optimise the technology absorption capacity and management level in rural areas. This, in turn, promotes the dissemination of green technologies and the enhancement of agricultural GTFP [24]. (3) The rapid expansion during the early phase of urbanisation may give rise to issues such as the encroachment of arable land, resource misallocation, and ecological stress, exerting a short-term inhibitory impact on agricultural GTFP [25]. Nevertheless, as urbanisation deepens, accompanied by the improvement of ecological protection systems, the strengthening of environmental regulation, and the emergence of a green technology spill-over effect, the construction of urban ecological civilization can stimulate the environmental protection awareness of rural producers. Ultimately, this fosters the long-term growth of agricultural GTFP [26]. In conclusion, this study posits the following research hypothesis:
H1: 
New urbanisation can significantly contribute to higher agricultural GTFP.

3.2. Indirect Impact of New Urbanisation on Green Total Factor Productivity in Agriculture

The Lewis dual-economic model identifies labour migration as a crucial impetus for agricultural modernization. In Jilin Province, the proportion of the agricultural labour force decreased from 45% in 2010 to 32% in 2020. Concurrently, the level of agricultural mechanisation increased from 68% to 85% during the same time frame. Urbanisation serves as a magnet for rural labour migration by offering non-agricultural employment opportunities. This phenomenon results in a decline in the proportion of the agricultural workforce and facilitates the transformation of agricultural production towards mechanisation and large-scale operations. As the labour supply diminishes, there is an incentive for capital and technological inputs to substitute for labour, thereby enhancing green productivity [27]. Nonetheless, in the course of urbanisation, the preferential transfer of high-quality labour to the urban non-agricultural sector can potentially impede the dissemination of agricultural technologies. This may lead to insufficient adoption of green production techniques and ultimately hinder the improvement of GTFP [28]. In summary, this study proposes the following research hypothesis:
H2: 
New urbanisation indirectly impacts AGTFP via changes in the proportion of employees in the primary sector [29].

4. Research Design

4.1. Modelling

(1)
Super-efficient SBM model
In this study, the super-efficient SBM (slacks-based measure) global Malmquist–Luenberger model is used to measure green total factor productivity in agriculture. The super-efficient SBM model, as a non-radial model, has a unique advantage in dealing with non-expected outputs [30]. Traditional radial models assume that all inputs or outputs change in the same proportion, which often does not hold true in practice. Undesired outputs, such as environmental pollution, cannot simply be reduced by scaling inputs equally. The non-radial model, on the other hand, allows inputs and outputs to be adjusted in different proportions, which can more flexibly and accurately reflect the complex relationship between inputs and outputs in the actual production process and thus more accurately measure efficiency in the case of including non-desired outputs. Compared with the general SBM model, this model also solves the difficulty of ranking efficiency in the traditional SBM model when multiple decision units reach the efficient state at the same time [31]. The basic principle of the SBM model is as follows.
Assume that the kth decision unit (j = 1, 2, … n) has the input vector x R m , the desired output vector y g R s 1 , and the undesired output vector   y g R s 2 , respectively. Also, define the following matrices: X = x 1 , x 2 , x n R m × n y g = y 1 g , y n g R s 1 × n and y b = y 1 b , y n b R s 2 × n . The decision unit k can be measured as follows:
min ρ = 1 + 1 m i = 1 m s i ¯ x i k 1 1 s 1 + s 2 t = 1 s 1 s r g / y r k g + t = 1 s 2 s t b / y t k b
j = 1 , j k n x i j λ j s i ¯ x i k
j = 1 , j k n y t j λ j s t b y t k b
j = 1 , j k n y r j λ j + s r g y r k g
λ 0 , s g 0 , s b 0 , s 0
where λ is the weight vector; s i ¯ represents the relaxation vector of input factors; s r g and s t b are the relaxation vectors of desired and undesired outputs, respectively; 1 m i = 1 m s i ¯ x i k represents the average degree of the inefficiency of the inputs; and 1 s 1 + s 2 ( r = 1 s 1 s r g / y r k g + t = 1 s 2 s t b / y t k b ) is the average degree of the inefficiency of the outputs. ρ represents the level of efficiency of the decision unit, which can be more than 1, so as to identify the effective decision unit.
(2)
GML Index
The GML index (global Malmquist–Luenberger index) stands out for its comparability across time. Compared to some other indices, the GML index constructs a common reference set of production technologies, allowing efficiency comparisons across time to be based on the same criteria. This overcomes the impact of production technology changes in different periods on efficiency assessment, ensures the accuracy and reliability of inter-period efficiency analyses, and provides a more effective measure of the dynamic change in total factor productivity over time, which provides strong support for the study of long-term efficiency trends. The traditional Malmquist index can reflect dynamic changes in DMU efficiency, but the impact of non-desired outputs is not taken into account in the calculation process [32]. The value of technical efficiency is measured using the super-efficient SBM model, which is a static analysis of the technical efficiency of the production of decision-making units, while agricultural production is long-term and dynamic. In order to explore the dynamic evolution of green full factor productivity in agriculture, this study uses the ML index calculated by the global DEA model with a non-expected output, i.e., the GML index, which is expressed as
G M L t , t + 1 ( x t , y t , b t , x t + 1 , y t + 1 , b t + 1 ) = 1 + D G T ( x t , y t , b t ) 1 + D G T ( x t + 1 , y t + 1 , b t + 1 )
The GML index can be structured as the product of the green technical efficiency (GEC) index, which characterises the movement of the production frontier, and the green technical progress (GTC) index, which reflects the extent to which the decision-making units move towards the production frontier.
G M L t , t + 1 ( x t , y t , b t , x t + 1 , y t + 1 , b t + 1 ) = G E C t , t + 1 × G T C t , t + 1
If   G M L t , t + 1 > 1 , this means that the green total factor productivity of agriculture grows; otherwise, it indicates a decline. In particular, if   G M C t , t + 1 > 1 , it means that the production frontier is expanding outward, at which time green technology progresses, and if it is vice versa, it means that there is regression; when   G T C t , t + 1 > 1 , it means that output efficiency improves, i.e., green technological efficiency is improved, and if it is vice versa, it means that green technological efficiency deteriorates.
(3)
Panel regression models
In order to clarify how new urbanisation in Jilin Province affects green total factor productivity in agriculture, this study applies a panel data regression model, which is characterised by its ability to handle multiple dimensions of data simultaneously. The panel data model is generally as follows:
Y i t = α i + β i t x i t + μ i t
where i denotes different cities, with i = 1, 2, 3, … N; t denotes different years, with t = 1, 2, 3, … T; α i denotes the constant term of the model; β i t denotes the coefficient term of the corresponding explanatory variables; Y i t denotes the explanatory variables in the regression model; and   μ i t denotes the random error term.
(4)
Mediation effect modelling
In order to verify the validity of the mediating mechanism proposed in this study, stepwise regression analysis was used [33].
Y = β 0 + β U R B + γ X i + ε 2
L 1 i = β 0 + β U R B + γ X i + ε 3
Y = β 0 + β U R B + λ L 1 i + γ + ε 4
In Equations (8)–(10), URB denotes new urbanisation; L 1 i is the mediator variable; X i is the control variable; β , λ , and γ are the estimated coefficients; and ε 2 , ε 3 , and ε 4 are the random disturbance terms.

4.2. Selection of Variables

4.2.1. Explained Variables

Taking the agricultural green total factor productivity (AGTFP) in 2008 as the base period, we treat it in a cumulative way, i.e., we set the AGTFP in 2008 as 1. The AGTFP in 2009 is the product of the AGTFP in 2008 and the GML index in 2009. By analogy, we calculate the AGTFP in subsequent years. Then, the cumulative index is used as the explanatory variable. The input indicators are selected based on the existing literature and the availability of data [34], and the indicator system is shown in Table 1. In the output indicators, the desired output is represented by the gross output value of agriculture, forestry, animal husbandry, and fishery. To eliminate the interference stemming from price fluctuations, this research designates 2008 as the base year and adopts the deflator approach for data processing. This enables the conversion of the nominal gross output value of agriculture, forestry, animal husbandry, and fishery into the real gross output value of the same sectors. The non-desired output is quantified by agricultural carbon emissions [35]. Given that there is no uniform regulation for the carbon emission standard of agricultural production yet, this study is based on the IPCC inventory method, drawing on the agricultural carbon emission measurement method in [36], and selects six kinds of carbon sources. The following model is constructed to measure the carbon emissions from agricultural production in Jilin Province.
E c = E = T i δ i
In the model, E c denotes the total carbon emissions from agricultural production; E i denotes the agricultural carbon emissions caused by the i type of carbon source; and T i and   δ i denote the ith type of carbon source and carbon emission coefficient, respectively (see Table 2).

4.2.2. Explanatory Variables

New Urbanisation Level Composite Index (urb): In this study, the evaluation index system is constructed from the population, the economy, society, and ecology, and each dimension is divided into 17 indicators [37]. The entropy value method is used to measure the new urbanisation level, and the results are shown in Table 3.

4.2.3. Mediating Variables

In this study, we use the share of workers in the primary sector as the mediating variable, which refers to the ratio of the number of workers engaged in the primary sector to the total number of workers [38].

4.2.4. Control Variables

(1)
Strength of financial support for agriculture: This is characterised by the proportion of expenditure on agriculture, forestry, and water affairs in local finance to total financial expenditure. It maps out the strength of national support for agricultural development in Jilin Province. The stronger the support is, the more significant the guiding and incentivising effect on agricultural development is.
(2)
Industrial structure: This is characterised by the proportion of the added value of the primary industry to the gross regional product. The adjustment and optimisation of industrial structure plays a pivotal role in social, economic, and agricultural development. This transformation not only promotes the prosperity of the secondary and tertiary industries but also brings rich resources and advanced technological support to agricultural production [39].
(3)
Level of regional economic development: Characterised by the per capita GDP of each region, this reflects the level of local economic development, which plays an important role in the selection of green agricultural production methods, technological progress, and agricultural transformation and upgrading.
(4)
Level of agricultural mechanisation: Characterised by the total power of agricultural machinery per unit of sown area [40], agricultural mechanisation is a significant indicator of the process of agricultural modernisation, which, through the large-scale application of agricultural machinery, can significantly improve the efficiency and effectiveness of agricultural production but can also lead to an increase in undesired outputs such as greenhouse gases. Table 4 is the descriptive statistics performed for the variables.

4.3. Data Sources

In order to deeply explore the changes in agricultural green total factor productivity in Jilin Province, this study is based on the panel data of nine prefectural-level cities in Jilin Province from 2008 to 2022. The data for the explanatory variables, core explanatory variables, and control variables come from the China Statistical Yearbook, China Rural Statistical Yearbook, Jilin Statistical Yearbook, and statistical yearbooks and communiqués of each prefectural-level city. For a small amount of missing data, the interpolation method and mean value method are used. Table 5 shows the descriptive statistics of the variables.

5. Analysis of Empirical Results

5.1. Analysis of Regional Variability in Green Total Factor Productivity in Agriculture and New Urbanisation

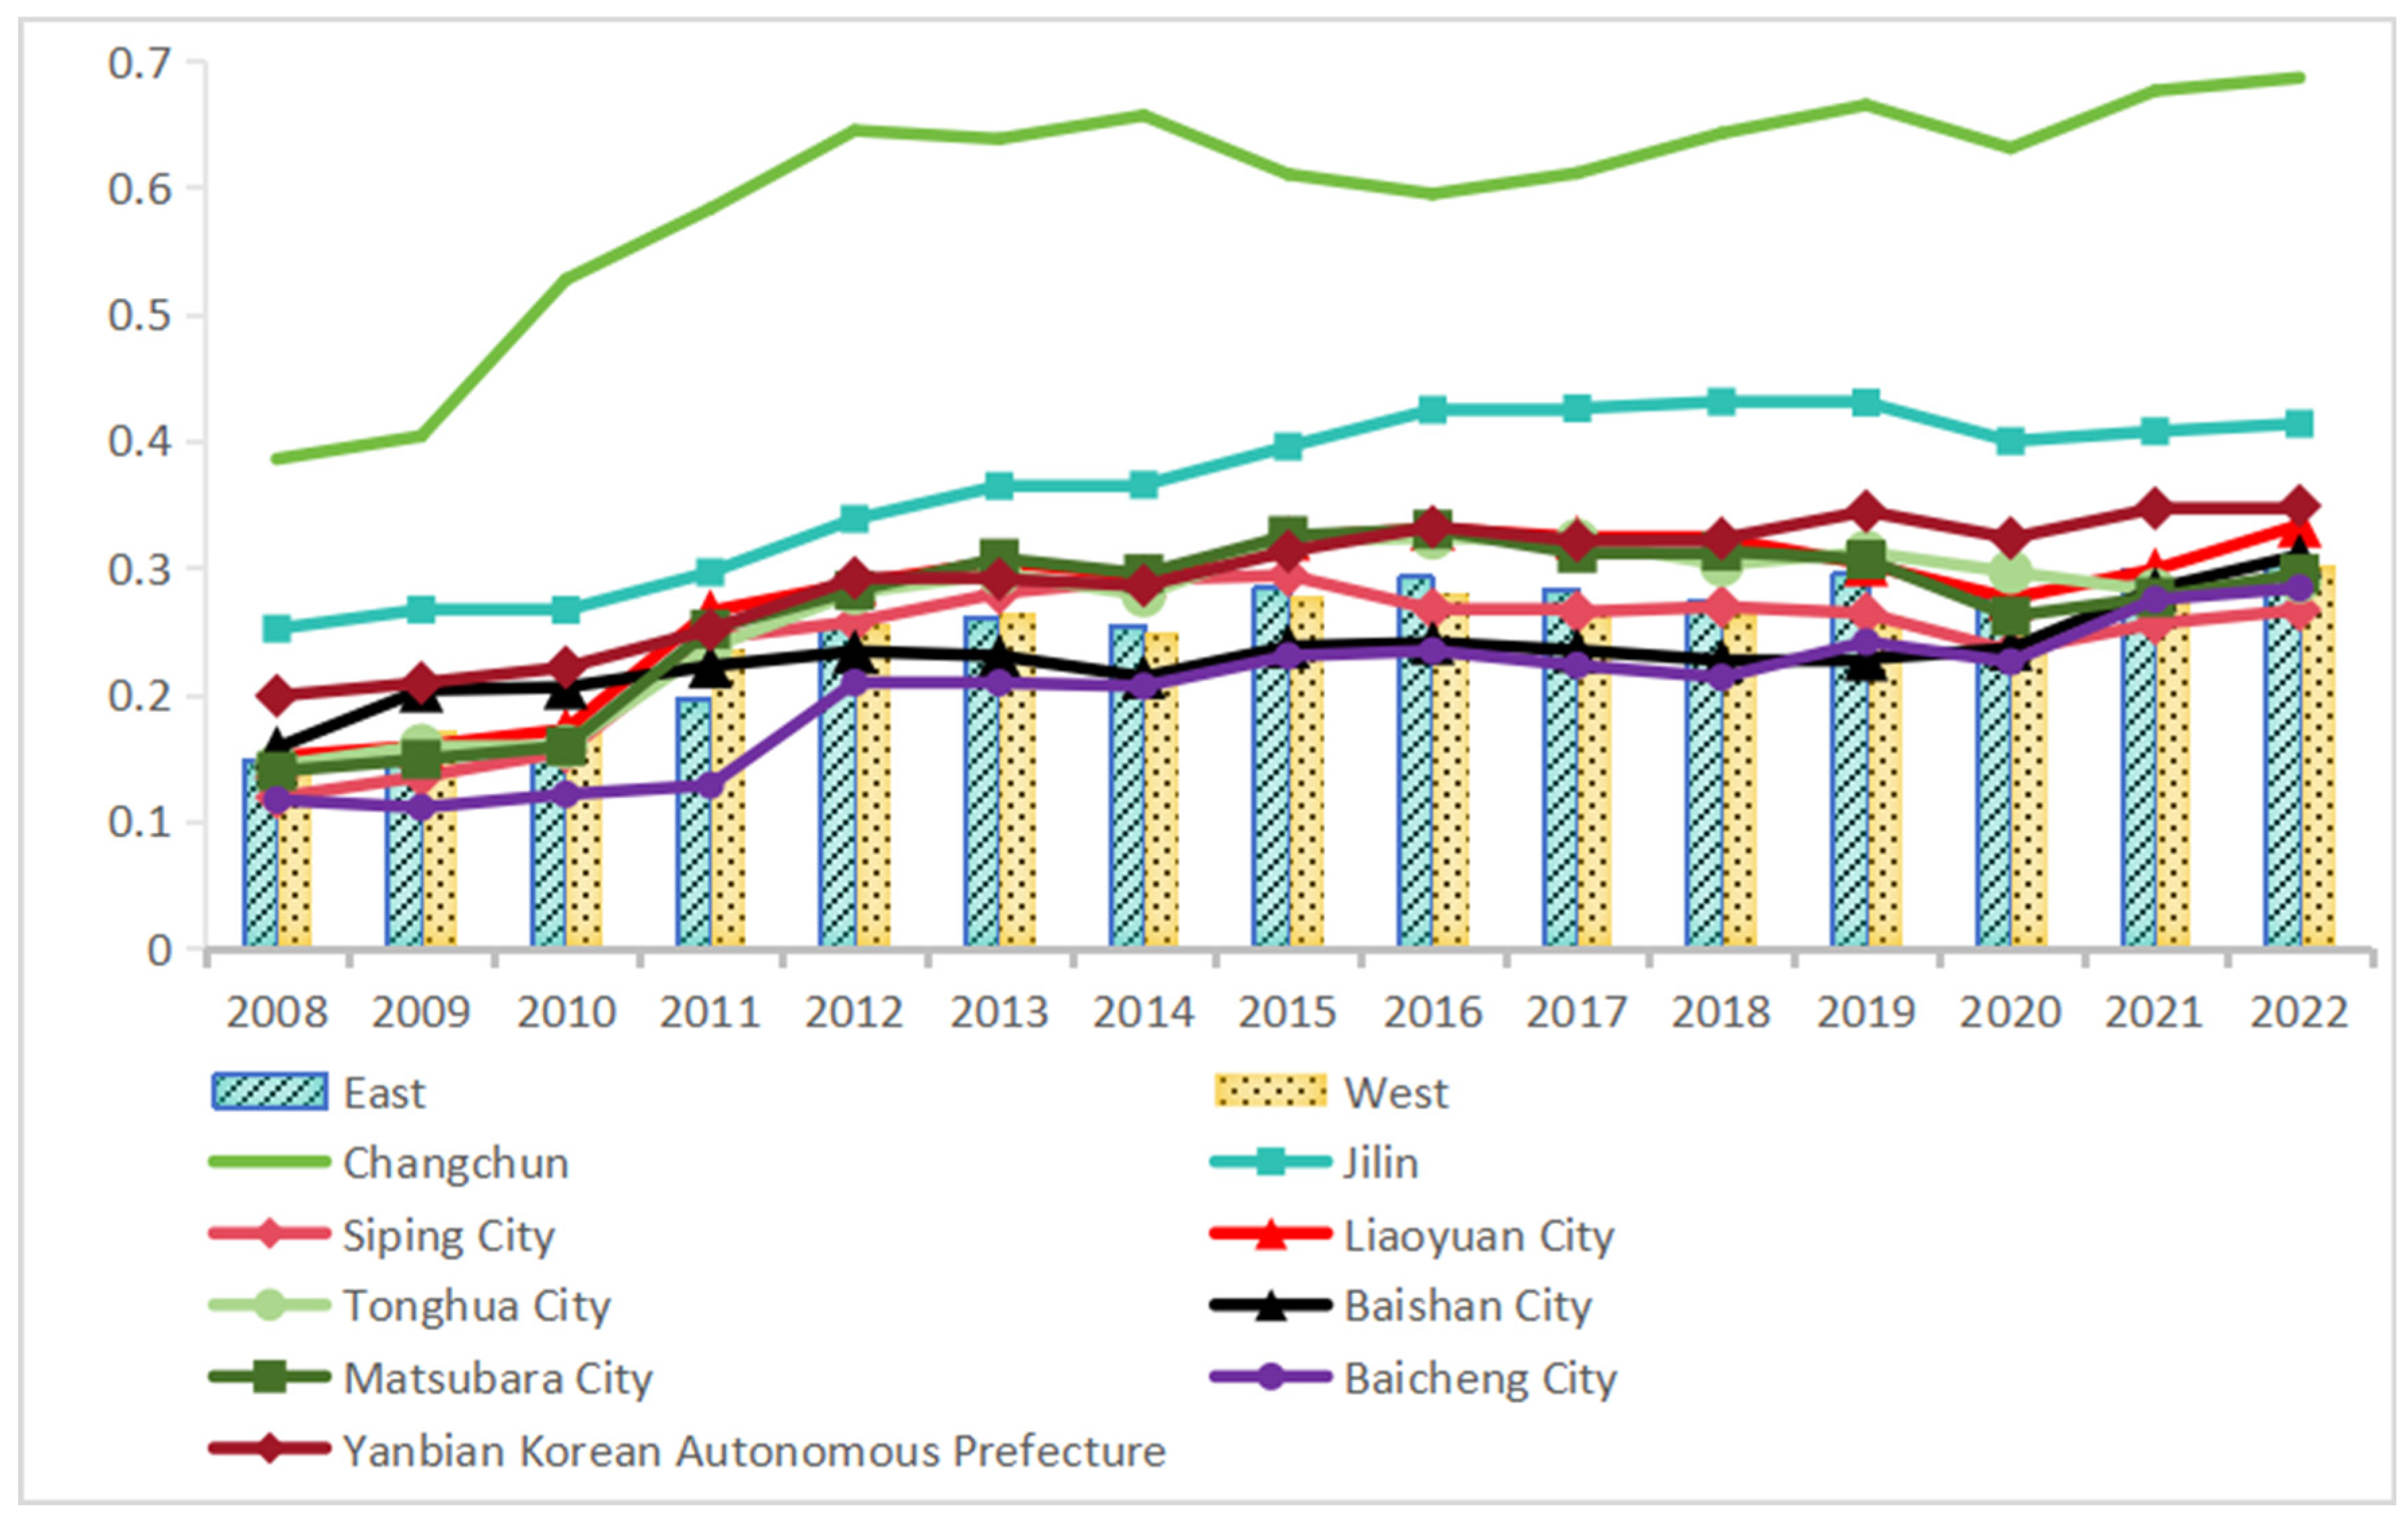
5.1.1. Analysis of Regional Differences in New Urbanisation

(1)
Overall analysis
As can be seen from Figure 1, the average score of the comprehensive development level shows an upward trend, and despite significant growth, the score of the comprehensive level of new urbanisation in Jilin Province is still at a generally low level. Further analysis of the distribution of the standard deviation reveals that there are significant geographical differences among the prefecture-level cities in Jilin Province. Over time, the standard deviation shows an overall increasing trend, from 0.0863 in 2008 to 0.1306 in 2022, indicating that the differences in the development level of new urbanisation among the prefecture-level cities in Jilin Province are gradually expanding.
(2)
Regional analyses
This study explores the development of new urbanisation in nine prefecture-level cities and three major regions in Jilin Province: the eastern, central, and western regions. According to the Strategic Plan for Rural Revitalisation in Jilin Province (2018–2022), Jilin Province is divided into the eastern region (Yanbian Korean Autonomous Prefecture, Baishan City, Tonghua City), the central region (Changchun City, Jilin City, Liaoyuan City, Siping City), and the western region (Baicheng City, Songyuan City).
As shown in Figure 2, from 2008 to 2022, the overall level of new urbanisation development in the three major regions of Jilin Province increased, yet the increase was small, with fluctuations, and the scores remain low. The central region takes the lead, with an average annual composite score of 0.3385. Jilin Province presents a spatial pattern featuring high urbanisation in the centre and low urbanisation on both sides. At the prefecture-level city level, the new urbanisation level of Changchun City is significantly higher than that of other cities. Its average annual score is 0.5892, ranking first, while Baicheng City ranks last with an average annual score of 0.1933, showing a clear gap compared with Changchun City. The regional development of new urbanisation in Jilin Province is uneven, with severe polarisation at two levels.

5.1.2. Regional Variability in Green Total Factor Productivity in Agriculture

In this study, based on the agricultural input–output data of nine prefectural-level cities in Jilin Province from 2008 to 2022, we applied a super-efficient SBM-GML index model that included non-desired outputs and performed calculation with the help of Matlab2022b software. It needs to be explained in advance that the result measured using this method is a dynamic index, which indicates the change in period t + 1 compared with period t. If the value of the GML (green total factor productivity growth for agriculture) index is greater than 1, this indicates that green total factor productivity in agriculture has grown compared to the previous period; if the converse is observed, it has declined. GML is further decomposed into the GEC (green technical efficiency) index and GTC (green technical progress) index. By comparing these two indices with the benchmark value of 1, their impact in the change in agricultural green total factor productivity can be judged. If the value of GEC or GTC is greater than 1, it indicates that the index positively promotes the growth of green total factor productivity in agriculture; if the converse if observed, it inhibits its growth.
(1)
Overall analysis
Figure 3 depicts the trends of the GML growth index and its decomposition indices in Jilin Province, visually presenting the changes and development directions of these three indices. The GTC in Jilin Province follows a trend remarkably similar to that of the GML growth index. By contrast, the GEC remains at a relatively low level and scarcely fluctuates except during 2016–2017. In the period of 2021–2022, the GTC and the GML growth index peak at 1.3823 and 1.2896, respectively, with the GEC standing at 0.9329. In 2016–2017, these two indices reach their lowest points, at 0.7288 and 0.7606, while the GEC is 0.9583. The GEC exerts no significant influence on the direction of GML growth, suggesting that the GTC is more crucial in promoting the growth of GML. The enhancement of GML in Jilin Province is mainly propelled by GTC, with GEC playing a relatively minor role. In most periods, the GEC is lower than the GTC and the GML growth index, indicating that the issue of resource allocation efficiency restricts the sustainable growth of GML in agriculture.
(2)
Regional analyses
Figure 4 depicts the data regarding the growth index of GML and its decomposition index for nine prefecture-level cities in Jilin Province. All nine prefecture-level cities in Jilin Province have a GML growth index of more than 1, with regional differences. The ranking shows that Baicheng City has the highest (1.0771) and Siping City has the lowest (1.0040). The general growth of GML in Jilin Province shows the positive momentum of agricultural green development, balancing the environment and efficiency. The GTCs of all prefecture-level cities in Jilin Province are higher than 1, while the GECs of Siping City, Liaoyuan City, Tonghua City, and Yanbian Korean Autonomous Prefecture are lower than 1. Nonetheless, the GML growth indexes and the GTCs of these regions are higher than 1, indicating that the facilitating effect of green technological progress on the growth of GML is greater than the deteriorating technical efficiency’s hindering effect. Therefore, GTC in agriculture is the key to raising GML in Jilin Province and can compensate for the negative impact of deteriorating technical efficiency.

5.2. Benchmark Regression Test and Analysis of Results

Prior to conducting panel regression analysis, a rigorous diagnostic procedure was implemented to ensure model validity. First, variance inflation factor (VIF) diagnostics were performed to assess multicollinearity, with all variables demonstrating VIF values below the critical threshold of 10, thereby confirming the absence of significant collinearity. Second, the LLC panel unit root test was employed to examine stationarity, with statistically significant results (p < 0.05) validating the data series’ stability. Finally, to select the optimal model, we conducted the fixed-effects F test, LM test, and Hausman test. The results showed a p-value of 0.0000. Consequently, this study prioritised building a fixed-effects panel regression model and performed fixed-effects regression analysis on the panel model using Stata 17.0 software.
For the first regression analysis, this study focused on the single core explanatory variable of new urbanisation and analysed its independent impact on agricultural green total factor productivity without adding other control variables for the time being. Immediately after that, four control variables, namely financial support for agriculture (fs), industrial structure (is), regional economic development level (gdp), and agricultural mechanisation level (mac), were included in the model for panel regression. The regression results are shown in Table 6.

5.2.1. Results of Regression Analyses on Core Explanatory Variables

Based on the results in columns 1 and 2, the comprehensive development level of new urbanisation passes the 1%-significance-level test. Evidently, new urbanisation significantly promotes the growth of AGTFP. This study reveals that even when a variety of control factors are taken into account, the positive impact of new urbanisation on AGTFP remains significant, which proves that it serves as a crucial driving force for the growth of AGTFP. Moreover, compared to other control variables, the comprehensive development level of new urbanisation has a higher impact coefficient. This indicates that it plays a key role in influencing the growth of AGTFP, thus validating Hypothesis H1.

5.2.2. Exploring the Effects of the Four Control Variables on the Target Variables Through Regression Analyses

(1)
Possible explanations for the inhibitory effect of fiscal support for agriculture on AGTFP in Jilin Province are that fiscal funds are prioritised for agricultural infrastructure construction, which has a lagged effect, and that the government pays more attention to yield increases than to green technology research and development and environmental protection [41,42]. Inadequate financial subsidy mechanisms have led to farmers failing to effectively adopt green production technologies, instead increasing the use of chemical fertilisers and pesticides, leading to an increase in undesired output.
(2)
The industrial structure has a negative impact on AGTFP in Jilin Province, probably because the flow of agricultural labour to these industries has led to a decline in the quantity and quality of agricultural human resources, with a low-skilled labour force remaining in the villages, and the weak acceptance of green technology, which inhibits productivity growth [43,44]; although the secondary and tertiary industries can drive the flow of capital, the bandwidth of these industries in Jilin Province is insufficient, and the negative effect on agriculture is greater than the positive promotion effect.
(3)
The regression result of economic development level is not significant. The reason may be that the impact of the level of economic development on AGTFP in agriculture may be achieved through a variety of indirect ways; the direction and size of these indirect effects may offset each other, resulting in the overall performance of the coefficient being negative and insignificant.
(4)
The level of agricultural mechanisation has a positive effect on AGTFP in Jilin Province, probably because it frees up the labour force, improves productivity and yields, ensures the rational use of agrochemicals, and protects the production environment [45,46].

5.3. Analysis of the Regression Results of the Mediation Effect

In this study, stepwise regression analysis and the Sobel test were employed to examine the presence of a mediation effect. The results of the mediation-effect regression are presented in Table 7. As can be gleaned from these results, new urbanisation exerts a significantly positive influence on AGTFP. New urbanisation exerts a remarkably negative impact on the proportion of employees in the primary industry. The possible reason is that in the process of the rapid advancement of new urbanisation, a large number of labourers are transferred from the primary industry to other industries, which theoretically helps to optimise the industrial structure and thus improve the overall productivity, but it cannot be ignored that the quality of the transferred labourers varies greatly. If a relatively small proportion of the transferred labour force is of high quality, and low-skilled labourers are unable to adapt quickly to the new working environment and technological requirements after entering the new industry and are unable to produce efficiently, it is then possible that the overall quality of the labour force will decline to a certain extent. This decline in the quality of the labour force might weaken, to a considerable extent, the positive effect of the efficiency enhancement of new urbanisation due to the transfer of labour force. The p-value obtained from Sobel’s test amounts to 0.0055. This result serves to further corroborate the presence of the mediating effect and lends support to Hypothesis H2.

5.4. Robustness Tests

In order to further validate the robustness of the findings, a robustness test was conducted through the following methodology:
  • Introduction of control variables: Cultivation structure was introduced as a control variable in the model for robustness testing. According to the estimation results in column (1) of Table 8, the impact of new urbanisation on AGTFP is significantly positive at the 1% significance level. This indicates that new urbanisation makes a significant contribution to the improvement of AGTFP, thereby verifying the robustness of the findings of this study.
  • Data exclusion test: After randomly excluding 20% of the data sample, empirical regression analysis was conducted. The findings presented in column (2) of Table 8 suggest that the outcomes related to new urbanisation align with those of the previous benchmark regression analysis. This alignment further validates the robustness and reliability of the results obtained in this study.

5.5. Heterogeneity Test

According to the “Strategic Plan for Rural Revitalization in Jilin Province (2018–2022)”, Jilin Province is divided into three regions: the eastern, central, and western regions. Heterogeneity analysis was conducted. The analysis results are presented in Table 9. The level of new urbanisation has a significantly positive impact on AGTFP in all three regions. The results indicate that new urbanisation has the strongest promoting effect on the agricultural green total factor productivity in the western region, followed by the central region, and it is relatively weaker in the eastern region, confirming the existence of significant differences among regions.

6. Discussion

In comparison with the existing body of literature, the potential marginal contributions of this study are as follows: Firstly, existing studies mostly use a single indicator to measure the level of urbanisation, while this study breaks through the traditional paradigm and constructs a comprehensive evaluation system of urbanisation containing 17 indicators in four dimensions—demographic, economic, social, and ecological—and empowers them with an entropy method, which not only circumvents the bias of subjective empowers but also strengthens the explanatory power of the indicator system. This multidimensional framework provides a new paradigm for systematically assessing the quality of urbanisation and makes up for the one-sided perception of urbanisation connotations in existing studies. Secondly, traditional studies mostly adopt a radial DEA model or static parameter method to measure GTFP, which has the defects of ignoring non-desired outputs and insufficient inter-period comparability [7,11]. This study employs the super-efficient SBM-GML model, which remarkably enhances the flexibility of efficiency measurement. Meanwhile, the GML index based on the global production technology reference set effectively addresses the issue of non-transferability of the traditional Malmquist index. This study finds that the average annual growth rate of AGTFP in Jilin Province is positive, and the growth is driven by the progress of green technology, while the technical efficiency is negative, which inhibits the growth of AGTFP. This decomposition result offers a crucial basis for optimising resource allocation. Third, the existing literature mostly focuses on national or provincial panel analyses and lacks the in-depth dissection of typical agricultural regions. This study takes Jilin Province as the research object and, through spatial difference analysis, finds that new urbanisation shows a polarised pattern of being “high in the centre and low in the east and west”, pointing out that poor inter-regional factor flows and limited technology diffusion are the main causes of this imbalance. This finding not only verifies the applicability of the “core–periphery” theory in the agricultural field [5] but also provides empirical support for regional, differentiated governance in urban–rural integration policy design in the old industrial bases in northeast China. Fourthly, most of the existing studies take urbanisation as a control variable or only focus on the superficial effect of population transfer [14]. Although scholars have mentioned the agricultural labour force, they have not explicitly focused on the mediating role of the proportion of employees in the primary industry in the relationship between urbanisation and agricultural GTFP. This study is the first to empirically test the mediating role of the proportion of employees in the primary industry in the relationship between urbanisation and agricultural GTFP. It also reveals that there may be a “quantity–quality” imbalance in labour migration, a finding that may open up new perspectives for subsequent research.

7. Conclusions of This Study and Recommendations for Countermeasures

7.1. Conclusions of This Study

The empirical results reveal four principal conclusions:
(1)
The empirical results demonstrate a statistically significant positive correlation between urbanisation levels and agricultural GTFP in Jilin Province.
(2)
New urbanisation in Jilin Province shows a spatial pattern of being “high in the centre and low in the east and west”, with regional polarisation being prominent.
(3)
Agricultural GTFP growth is dependent on technological progress, limiting the potential for sustainable development.
(4)
New urbanisation exerts an indirect impact on agricultural GTFP via the proportion of the primary-sector-employed population.

7.2. Recommendations for Countermeasures

The empirical findings suggest the following policy optimisation framework:
(1)
Optimise the spatial layout of new urbanisation: To address Jilin Province’s urbanisation spatial pattern (“central, high; east–west, low”) and regional polarisation, the following strategies are recommended: First, strengthen regional coordination and planning mechanisms. Second, allocate preferential policies and resources to eastern and western regions. Third, implement guided industrial relocation programmes. Fourth, enhance regional industrial absorption capacity. Fifth, promote a balanced distribution of population and economic activities. These interventions aim to mitigate regional disparities and foster coordinated urban development.
(2)
Promote agricultural technological innovation and sustainable development: In response to the problem that agricultural GTFP growth is dependent on technological progress, which limits the potential for sustainable development, it is necessary to increase investment in agricultural research; encourage cooperation between universities, research institutes, and agricultural enterprises to carry out research and development in green agricultural technology; and enhance the efficiency of agricultural resource utilisation. Concurrently, an agricultural technology extension system should be established to enhance farmer technical training programmes, improve the adoption rate of advanced agricultural technologies, and facilitate positive feedback loops between technological innovation and sustainable agricultural development.
(3)
Promote industrial structural adjustment and synergistic development: The urbanisation–agricultural productivity nexus operates through labour reallocation mechanisms, with workforce distribution patterns in primary industries serving as critical transmission channels, necessitating accelerated industrial restructuring. This strategic development should focus on expanding agriculture-related secondary and tertiary industries, extending agricultural value chains, enhancing agricultural added value, creating rural employment opportunities, and reducing excessive reliance on primary industry labour. The synergistic development between urbanisation and agricultural modernization should be promoted to facilitate bidirectional factor flows across urban–rural boundaries and enable urbanisation outcomes to effectively enhance agricultural productivity.

7.3. Research Limitations and Prospects

Subsequent scholarly inquiries may systematically explore the following dimensions: (1) The unitary nature of intermediary mechanisms, such as potential intermediary variables such as technological innovation, financial support, and infrastructure improvement, are not included in the model, which limits the completeness of the mechanism explanation; subsequent research could construct a multiple intermediary model, combining the “technology–institution–behaviour” synergistic framework to systematically analyse the complex network of transmission paths. (2) This study relies on statistical yearbook data and lacks matching data at the micro-farm, household-survey, or enterprise level, which may overlook the impact of individual heterogeneity on GTFP; future studies could thus expand the data breadth. (3) In this study, the entropy method was used for index empowerment, and although it ensured objectivity, subjective empowerment methods such as AHP were not included for comparison. Future studies could combine subjective and objective empowerment methods to further verify the robustness of the study results. (4) In the spatial dimension, we can compare the urbanisation–GTFP relationship between Jilin Province and other provinces in the northeast to identify regional common patterns and differentiated features; in the temporal dimension, we can extend the data observation period to 2023 to analyse the policy stacking effect of the “dual-carbon” targets and the rural regeneration policies. (5) In addressing the effects of different types of agricultural machinery, future research can further expand the data sources, deeply explore the carbon emission data of various kinds of agricultural machinery in different regions and different operating environments, and more comprehensively consider the impact of this factor on agricultural green total factor productivity so as to improve relevant research.

Author Contributions

Conceptualization: G.Z.; data curation: L.W.; formal analysis: L.W.; funding acquisition: G.Z.; investigation: L.W.; methodology: G.Z.; project administration: G.Z.; software: L.W.; supervision: G.Z.; validation: L.W.; visualisation: L.W.; writing—original draft: L.W.; writing—review and editing: L.W. All authors have read and agreed to the published version of the manuscript.

Funding

This study received support from the Social Science Fund project of Jilin Province “Research on Optimization Strategy of Corn Sales Channel in Jilin Province-Based on Farmers’ Selection” (2022B052149) and Humanities and Social Sciences Research Program of Jilin Provincial Department of Education “An Empirical Study on the Impact of New Urbanization on Farmers’ Income in Jilin Province: A Perspective of Urban-Rural Integration and Development” (JJKH20240476SK).

Institutional Review Board Statement

Not applicable.

Informed Consent Statement

Informed consent was obtained from all subjects involved in the study.

Data Availability Statement

The original contributions presented in this study are included in the article. Further inquiries can be directed to the corresponding author.

Acknowledgments

I would like to express my gratitude to my tutor, Zhao Guiyu, who guided me to choose a topic that was both research-worthy and aligned with my interests from the very beginning. Along the path of research, whenever a difficult problem arose, my tutor was always able to point me in the right direction. My tutor’s rigorous academic attitude is reflected in the precise demands for each datum and the strict scrutiny of each theoretical basis. Whether it was the complex model construction or the tedious data analysis, my tutor patiently guided me, allowing me to deeply understand that the rigour of academic research cannot be overlooked. I also thank my classmates for helping me when I encountered difficulties. We shared materials, exchanged insights, and encouraged each other.

Conflicts of Interest

The authors declare that they have no known competing financial interests or personal relationships that could have appeared to influence the work reported in this study.

References

  1. Poumanyvong, P.; Kaneko, S. Does urbanization lead to less energy use and lower CO2 emissions? A cross-country analysis. Ecol. Econ. 2010, 70, 434–444. [Google Scholar] [CrossRef]
  2. Zhang, B.; Zhang, J.; Miao, C. Urbanization Level in Chinese Counties: Imbalance Pattern and Driving Force. Remote Sens. 2022, 14, 2268. [Google Scholar] [CrossRef]
  3. Kang, J.; Duan, X.; Yun, R. The Impact of Urbanization on Food Security: A Case Study of Jiangsu Province. Land 2023, 12, 1681. [Google Scholar] [CrossRef]
  4. Chu, N.; Zhang, P.; Wu, X. Spatiotemporal evolution characteristics of urbanization and its coupling coordination degree in Russia—Perspectives from the population, economy, society, and eco-environment. Environ. Sci. Pollut. Res. Int. 2022, 29, 61334–61351. [Google Scholar] [CrossRef] [PubMed]
  5. Lou, F.Y. The Urban-rural Income Gap, Urbanization, the Upgrading of Industrial Structure, and Agricultural Labor Productivity. Sci. Soc. Res. 2024, 6, 80–85. [Google Scholar] [CrossRef]
  6. Jiang, Q.; Wu, M.; Zhang, D. Evidence of the Contribution of the Technological Progress on Aquaculture Production for Economic Development in China—Research Based on the Transcendental Logarithmic Production Function Method. Agriculture 2023, 13, 544. [Google Scholar] [CrossRef]
  7. Xiao, Q.; Luo, Q.Y.; Zhou, Z.Y. Dynamic Evolution and Spatial Differentiation of Agricultural Green Production Efficiency in China: An Analysis Based on DDF—Global Malmquist—Luenberger Index. J. Agro—For. Econ. Manag. 2020, 19, 537–547. [Google Scholar]
  8. Tone, K. A slacks-based measure of super-efficiency in data envelopment analysis. Eur. J. Oper. Res. 2002, 143, 32–41. [Google Scholar] [CrossRef]
  9. Zhan, X.; Li, R.Y.M.; Liu, X.; He, F.; Wang, M.; Qin, Y.; Xia, J.; Liao, W. Fiscal decentralisation and green total factor productivity in China: SBM-GML and IV model approaches. Front. Environ. Sci. 2022, 10, 989194. [Google Scholar] [CrossRef]
  10. Xueli, W.; Lei, W.; Song, W.; Fei, F.; Xiaohua, Y. Marketisation as a channel of international technology diffusion and green total factor productivity: Research on the spillover effect from China’s first-tier cities. Technol. Anal. Strateg. Manag. 2021, 33, 491–504. [Google Scholar]
  11. Chen, Y.; Miao, J.; Zhu, Z. Measuring green total factor productivity of China’s agricultural sector: A three-stage SBM-DEA model with non-point source pollution and CO2 emissions. J. Clean. Prod. 2021, 318, 128543. [Google Scholar] [CrossRef]
  12. Yang, J.; Chen, L.; Zhang, Y. Rural industrial convergence, urbanization development, and farmers’ income growth—Evidence from the Chinese experience. Front. Sustain. Food Syst. 2023, 7, 1237844. [Google Scholar] [CrossRef]
  13. Davis, J.C.; Henderson, J.V. Evidence on the political economy of the urbanization process. J. Urban Econ. 2003, 53, 98–125. [Google Scholar] [CrossRef]
  14. Corral, L. Rural Nonfarm Incomes in Nicaragua. World Dev. 2001, 29, 427–442. [Google Scholar] [CrossRef]
  15. Deng, X.; Guo, M.; Liu, Y. Digital economy development and the urban-rural income gap: Evidence from Chinese cities. PLoS ONE 2023, 18, e0280225. [Google Scholar] [CrossRef]
  16. Wang, J.; Wu, H.; Xiao, D.; Luo, X.; Liu, Y.; Wang, W. Can the digital economy address the loss of green development efficiency due to resource mismatch? Evidence from China’s land transaction markets. J. Environ. Plan. Manag. 2025, 68, 406–436. [Google Scholar] [CrossRef]
  17. Chen, W.; Yao, L. Evaluating the carbon total factor productivity of China: Based on Cobb-Douglas production function. Environ. Sci. Pollut. Res. Int. 2024, 31, 13722–13738. [Google Scholar] [CrossRef]
  18. Zeng, S.; Shu, X.; Ye, W. Total Factor Productivity and High-Quality Economic Development: A Theoretical and Empirical Analysis of the Yangtze River Economic Belt, China. Int. J. Environ. Res. Public Health 2022, 19, 2783. [Google Scholar] [CrossRef]
  19. Wang, X.; Wang, H.; Liang, S.; Xu, S. The Influence of Energy Price Distortion on Region Energy Efficiency in China’s Energy-Intensive Industries from the Perspectives of Urban Heterogeneity. Sustainability 2021, 14, 88. [Google Scholar] [CrossRef]
  20. Fan, Z.; Shujie, Y.; Feng, W. The role of high-speed rail on green total factor productivity: Evidence from Chinese cities. Environ. Sci. Pollut. Res. Int. 2022, 30, 15044–15058. [Google Scholar]
  21. Wang, G.; Salman, M. The driving influence of multidimensional urbanization on green total factor productivity in China: Evidence from spatiotemporal analysis. Environ. Sci. Pollut. Res. Int. 2023, 30, 52026–52048. [Google Scholar] [CrossRef] [PubMed]
  22. Deng, W.; Zhang, S.; Zhou, P.; Peng, L.; Liu, Y.; Wan, J. Spatiotemporal Characteristics of Rural Labor Migration in China: Evidence from the Migration Stability under New-type Urbanization. Chin. Geogr. Sci. 2020, 30, 749–764. [Google Scholar] [CrossRef]
  23. Wang, S.X.; Benjamin, F.Y. Labor mobility barriers and rural-urban migration in transitional China. China Econ. Rev. 2018, 53, 211–224. [Google Scholar] [CrossRef]
  24. Zhang, Y.F.; Ji, M.X.; Zheng, X.Z. Digital Economy, Agricultural Technology Innovation, and Agricultural Green Total Factor Productivity. SAGE Open 2023, 13. [Google Scholar] [CrossRef]
  25. Qiu, B.; Yang, X.; Tang, Z.; Chen, C.; Li, H.; Berry, J. Urban expansion or poor productivity: Explaining regional differences in cropland abandonment in China during the early 21st century. Land Degrad. Dev. 2020, 31, 2540–2551. [Google Scholar] [CrossRef]
  26. Yuan, J.; Zhang, D. Research on the Impact of Environmental Regulations on Industrial Green Total Factor Productivity: Perspectives on the Changes in the Allocation Ratio of Factors among Different Industries. Sustainability 2021, 13, 12947. [Google Scholar] [CrossRef]
  27. Singh, B. Decline in agricultural employment and adjustment through labour commuting: A case study from Punjab. Indian J. Labour Econ. 2006, 49, 855–861. [Google Scholar]
  28. Ge, P.; Liu, T.; Wu, X.; Huang, X. Heterogenous Urbanization and Agricultural Green Development Efficiency: Evidence from China. Sustainability 2023, 15, 5682. [Google Scholar] [CrossRef]
  29. Li, J.; Chen, J.; Liu, H. Sustainable Agricultural Total Factor Productivity and Its Spatial Relationship with Urbanization in China. Sustainability 2021, 13, 6773. [Google Scholar] [CrossRef]
  30. Mulwa, R.; Emrouznejad, A.; Nuppenau, E.-A. An overview of Total Factor Productivity estimations adjusted for pollutant outputs: An application to sugarcane farming. Int. J. Environ. Technol. Manag. 2012, 15, 1–15. [Google Scholar] [CrossRef]
  31. Tone, K. A slacks-based measure of efficiency in data envelopment analysis. Eur. J. Oper. Res. 2001, 130, 498–509. [Google Scholar] [CrossRef]
  32. Liu, J.; Yuan, Y.; Lin, C.; Chen, L. Do agricultural technical efficiency and technical progress drive agricultural carbon productivity? based on spatial spillovers and threshold effects. Environ. Dev. Sustain. 2023, 1–25. [Google Scholar] [CrossRef]
  33. Wen, Z.; Chang, L.; Hau, K.T.; Liu, H. Testing and Application of the Mediating Effects. Acta Psychol. Sin. 2004, 5, 614–620. [Google Scholar]
  34. Huang, X.; Feng, C.; Qin, J.; Wang, X.; Zhang, T. Measuring China’s agricultural green total factor productivity and its drivers during 1998–2019. Sci. Total Environ. 2022, 829, 154477. [Google Scholar] [CrossRef] [PubMed]
  35. Zhang, N. Carbon total factor productivity, low carbon technology innovation and energy efficiency catch-up: Evidence from Chinese thermal power enterprises. Econ. Res. J. 2022, 57, 158–174. [Google Scholar]
  36. Hörtenhuber, S.J.; Größbacher, V.; Schanz, L.; Zollitsch, W.J. Implementing IPCC 2019 Guidelines into a National Inventory: Impacts of Key Changes in Austrian Cattle and Pig Farming. Sustainability 2023, 15, 4814. [Google Scholar] [CrossRef]
  37. Tan, K.G.; Zhang, X.; Song, L. An urban composite development index based on China’s five development concepts. Compet. Rev. Int. Bus. J. 2020, 30, 137–149. [Google Scholar] [CrossRef]
  38. Zhong, X.Y.; Liu, E.A.; Wang, W.D. Research on the Spatiotemporal Evolution and Influencing Factors of Grain Production Efficiency in Gansu Province. Manag. Agric. Sci. Technol. 2024, 43, 16–21. [Google Scholar]
  39. Pan, H.; Liu, Y.; Gao, H. Impact of agricultural industrial structure adjustment on energy conservation and income growth in Western China: A statistical study. Ann. Oper. Res. 2015, 228, 23–33. [Google Scholar] [CrossRef]
  40. Abate, M.C.; Kuang, Y.-P. The impact of the supply of farmland, level of agricultural mechanisation, and supply of rural labour on grain yields in China. Stud. Agric. Econ. 2021, 123, 33–42. [Google Scholar]
  41. Zou, W.; Zhang, Z.; Yang, F. Does Land Fragmentation Affect the Effectiveness of Fiscal Subsidies for Agriculture: Evidence from China. Land 2023, 13, 43. [Google Scholar] [CrossRef]
  42. Wang, L.; Tang, J.; Tang, M.; Su, M.; Guo, L. Scale of Operation, Financial Support, and Agricultural Green Total Factor Productivity: Evidence from China. Int. J. Environ. Res. Public Health 2022, 19, 9043. [Google Scholar] [CrossRef] [PubMed]
  43. Zeng, H.; Cheng, L.; Ma, G.; Luo, Y. How free trade pilot zones enhance agricultural green total factor productivity? Theory and evidence from China. Front. Sustain. Food Syst. 2024, 8, 1429687. [Google Scholar] [CrossRef]
  44. Gao, W.; Wang, X. The Influence of Foreign Investment on the Optimization of Industrial Structure in Jilin Province Based on the Background of Ecological Protection. IOP Conf. Ser. Earth Environ. Sci. 2019, 252, 052055. [Google Scholar] [CrossRef]
  45. Lu, S.; Zhuang, J.; Sun, Z.; Huang, M. How can rural digitalization improve agricultural green total factor productivity: Empirical evidence from counties in China. Heliyon 2024, 10, e35296. [Google Scholar] [CrossRef]
  46. Zhou, X.; Zhang, Y. Administration or marketization: Environmental regulation, marketization and agricultural green total factor productivity. J. Environ. Manag. 2024, 370, 122433. [Google Scholar] [CrossRef]
Figure 1. Time series evolution of comprehensive development level of new urbanisation in Jilin Province between 2008 and 2022.
Sustainability 17 02070 g001
Figure 2. Comprehensive development level of new urbanisation in three major regions and prefectural-level cities of Jilin Province between 2008 and 2022.
Sustainability 17 02070 g002
Figure 3. Trends in the green total factor productivity growth index and its decomposition index for agriculture in Jilin Province.
Sustainability 17 02070 g003
Figure 4. Green total factor productivity growth index for agriculture and its decomposition index for each prefecture-level city in Jilin Province.
Sustainability 17 02070 g004
Table 1. Indicator system for measuring green total factor productivity in agriculture.
Variable ClassificationNormSpecific Indicators (Units)
InputsLabour inputsNumber of people employed in primary sector (10,000 people)
Land inputsArea sown with crops (thousands of hectares)
Water inputsEffective irrigated area (thousands of hectares)
Mechanical inputsTotal power of agricultural machinery (10,000 kW)
Specific indicators (units)
Fertiliser inputsFertiliser application (tonnes)
OutputsExpected outputsGross output value of agriculture, forestry, animal husbandry, and fishery (billion CNY)
Non-expected outputsCarbon emissions from agriculture (tonnes)
Table 2. Agricultural carbon sources, carbon emission factors, and sources.
Source of Carbon EmissionsFertiliserPesticidesAgro-FilmDiesel OilTurning the SoilIrrigation
Carbon emission factor0.8956 kg/kg4.9341 kg/kg5.18 kg/kg0.5927 kg/kg312.6 kg/hm2266.48 kg/hm2
Reference sourceOak Ridge National Laboratory, USAOak Ridge National Laboratory, USAInstitute of Agricultural Resources and Ecological Environment, Nanjing Agricultural UniversityIPCC; United Nations’ Intergovernmental Panel on Climate ChangeCollege of Agronomy and Biotechnology, China Agricultural UniversityCollege of Agriculture, Nanjing Agricultural University
Table 3. Weight table of comprehensive evaluation index system for new urbanisation in Jilin Province.
Target LevelNormative LayerWeightIndicator LayerWeight
level of new development urbanisationurbanisation of population0.2134urbanisation rate of household population (%)0.0467
urban registered unemployment rate (%)0.0445
share of employed population in secondary and tertiary industries (%)0.0238
urban population density (square metres per person)0.0984
economic urbanisation0.3054GDP per capita (USD)0.0437
value added of secondary and tertiary industries as share of GDP (%)0.0224
per capita disposable income of urban residents (CNY)0.0550
total retail sales of consumer goods (million USD)0.1732
ratio of urban to rural per capita income (times)0.0110
social urbanisation0.4312number of health technicians (people)0.1417
financial expenditure on education as percentage (%)0.0384
public library collections (thousands of volumes)0.1895
roads per capita in towns and cities (square metres per person)0.0494
city gas penetration rate (%)0.0123
ecological urbanisation0.0501green coverage of built-up areas (%)0.0079
per capita green space in parks (square metres per person)0.0281
non-hazardous treatment rate of domestic waste (%)0.0141
Table 4. Variable selection.
Variable TypeVariable NameNotationVariable Meaning
Explanatory variableGreen total factor productivity in agricultureAGTFPAuthor’s calculations
Core explanatory variablesNew urbanisation levelUrbAuthor’s calculations
Intermediary variableShare of employees in primary sectorL1(Number of people employed in primary sector ÷ total number of people employed) × 100%.
Control variableFinancial support for agricultureFSExpenditure on agriculture, forestry, and water affairs/general public budget expenditure
Industrial structureISAdded value of secondary and tertiary industries/gross regional product
Level of regional economic developmentGDPGDP per capita/USD
Level of agricultural mechanisationMACTotal power of agricultural machinery/area sown with crops
Table 5. Descriptive statistics of variables.
VariableObs.MeanStd. Dev.Min.Max.
AGTFP1351.37190.39320.67932.8297
Urb1350.32140.12450.12110.6864
L113539.772614.059021.648380.1937
FS13514.34975.60595.313331.0689
IS13586.35507.334465.280095.5000
GDP13511,274.91003441.60304504.000018,919.0000
MAC1355.64072.88742.095519.1574
Table 6. Descriptive statistics of variables.
(1)(2)
agtfpagtfp
urb2.984 ***4.038 ***
(4.29)(4.36)
fs −0.0361 ***
(−3.41)
is −0.0537 ***
(−4.89)
dpi −0.0000142
(−0.93)
mac 0.0231 *
(1.85)
_cons0.413 *5.262 ***
(1.83)(5.46)
N135135
R20.1470.341
control variablecloggedbe
individual control effectcontainmentcontainment
year control effectscontainmentcontainment
Note: *** and * indicate that the estimates are significant at the 0.01, and 0.1 levels; numbers in parentheses are t-values.
Table 7. Intermediation-effect regression results.
(1)(2)(3)
agthpL1agthp
urb3.994 ***−0.454 ***3.010 ***
(0.935)(0.143)(0.951)
L1 −0.451 ***
(0.145)
cons5.223 ***4.268 ***7.570 ***
(0.973)(0.751)(1.199)
province fixed effectsYESYESYES
time fixed effectsYESYESYES
N135.000135.000135.000
R20.6370.5810.650
SobelZ −2.776
p 0.0055
Note: *** indicates that the estimates are significant at the 0.01 level.
Table 8. Robustness test results.
(1)(2)
Introduction of control variablesData exclusion test
urb3.994 ***4.290 ***
(0.935)(1.118)
fs−0.035 ***−0.037 ***
(0.011)(0.013)
is−0.054 ***−0.052 ***
(0.011)(0.013)
dpi−0.000−0.000
(0.000)(0.000)
mac0.0110.025
(0.031)(0.015)
ps0.001
(0.002)
_cons5.223 ***5.025 ***
(0.973)(1.201)
N135.000108.000
r2_a0.2520.219
Note: *** indicates that the estimates are significant at the 0.01 level.
Table 9. Results of regional heterogeneity analysis.
(1)(2)(3)
eastmiddlewest
urb4.1951 ***1.8868 **6.5897 ***
(3.1810)(2.2035)(4.3598)
control variablecontrolcontrolcontrol
_cons5.11632.29034.9974 ***
(1.6390)(1.5372)(3.4844)
province fixed effectsYESYESYES
time fixed effectYESYESYES
F5.29436.94917.2427
r2_a0.36100.41170.4997
N45.000060.000030.0000
Note: ***and ** indicate that the estimates are significant at the 0.01and 0.05 levels.
Disclaimer/Publisher’s Note: The statements, opinions and data contained in all publications are solely those of the individual author(s) and contributor(s) and not of MDPI and/or the editor(s). MDPI and/or the editor(s) disclaim responsibility for any injury to people or property resulting from any ideas, methods, instructions or products referred to in the content.

