
Bridging the Green Space Divide: A Big Data-Driven Analysis of Park Accessibility Inequities in Chinese Megacities Using Enhanced 3SFCA Modeling


Abstract
1. Introduction
2. Literature Review
2.1. Evolution of the Concept of Accessibility and Its Measurement Methods
2.2. Research Progress on Accessibility of Urban Parks
2.3. Research Deficiencies and Innovations
3. Data and Methods
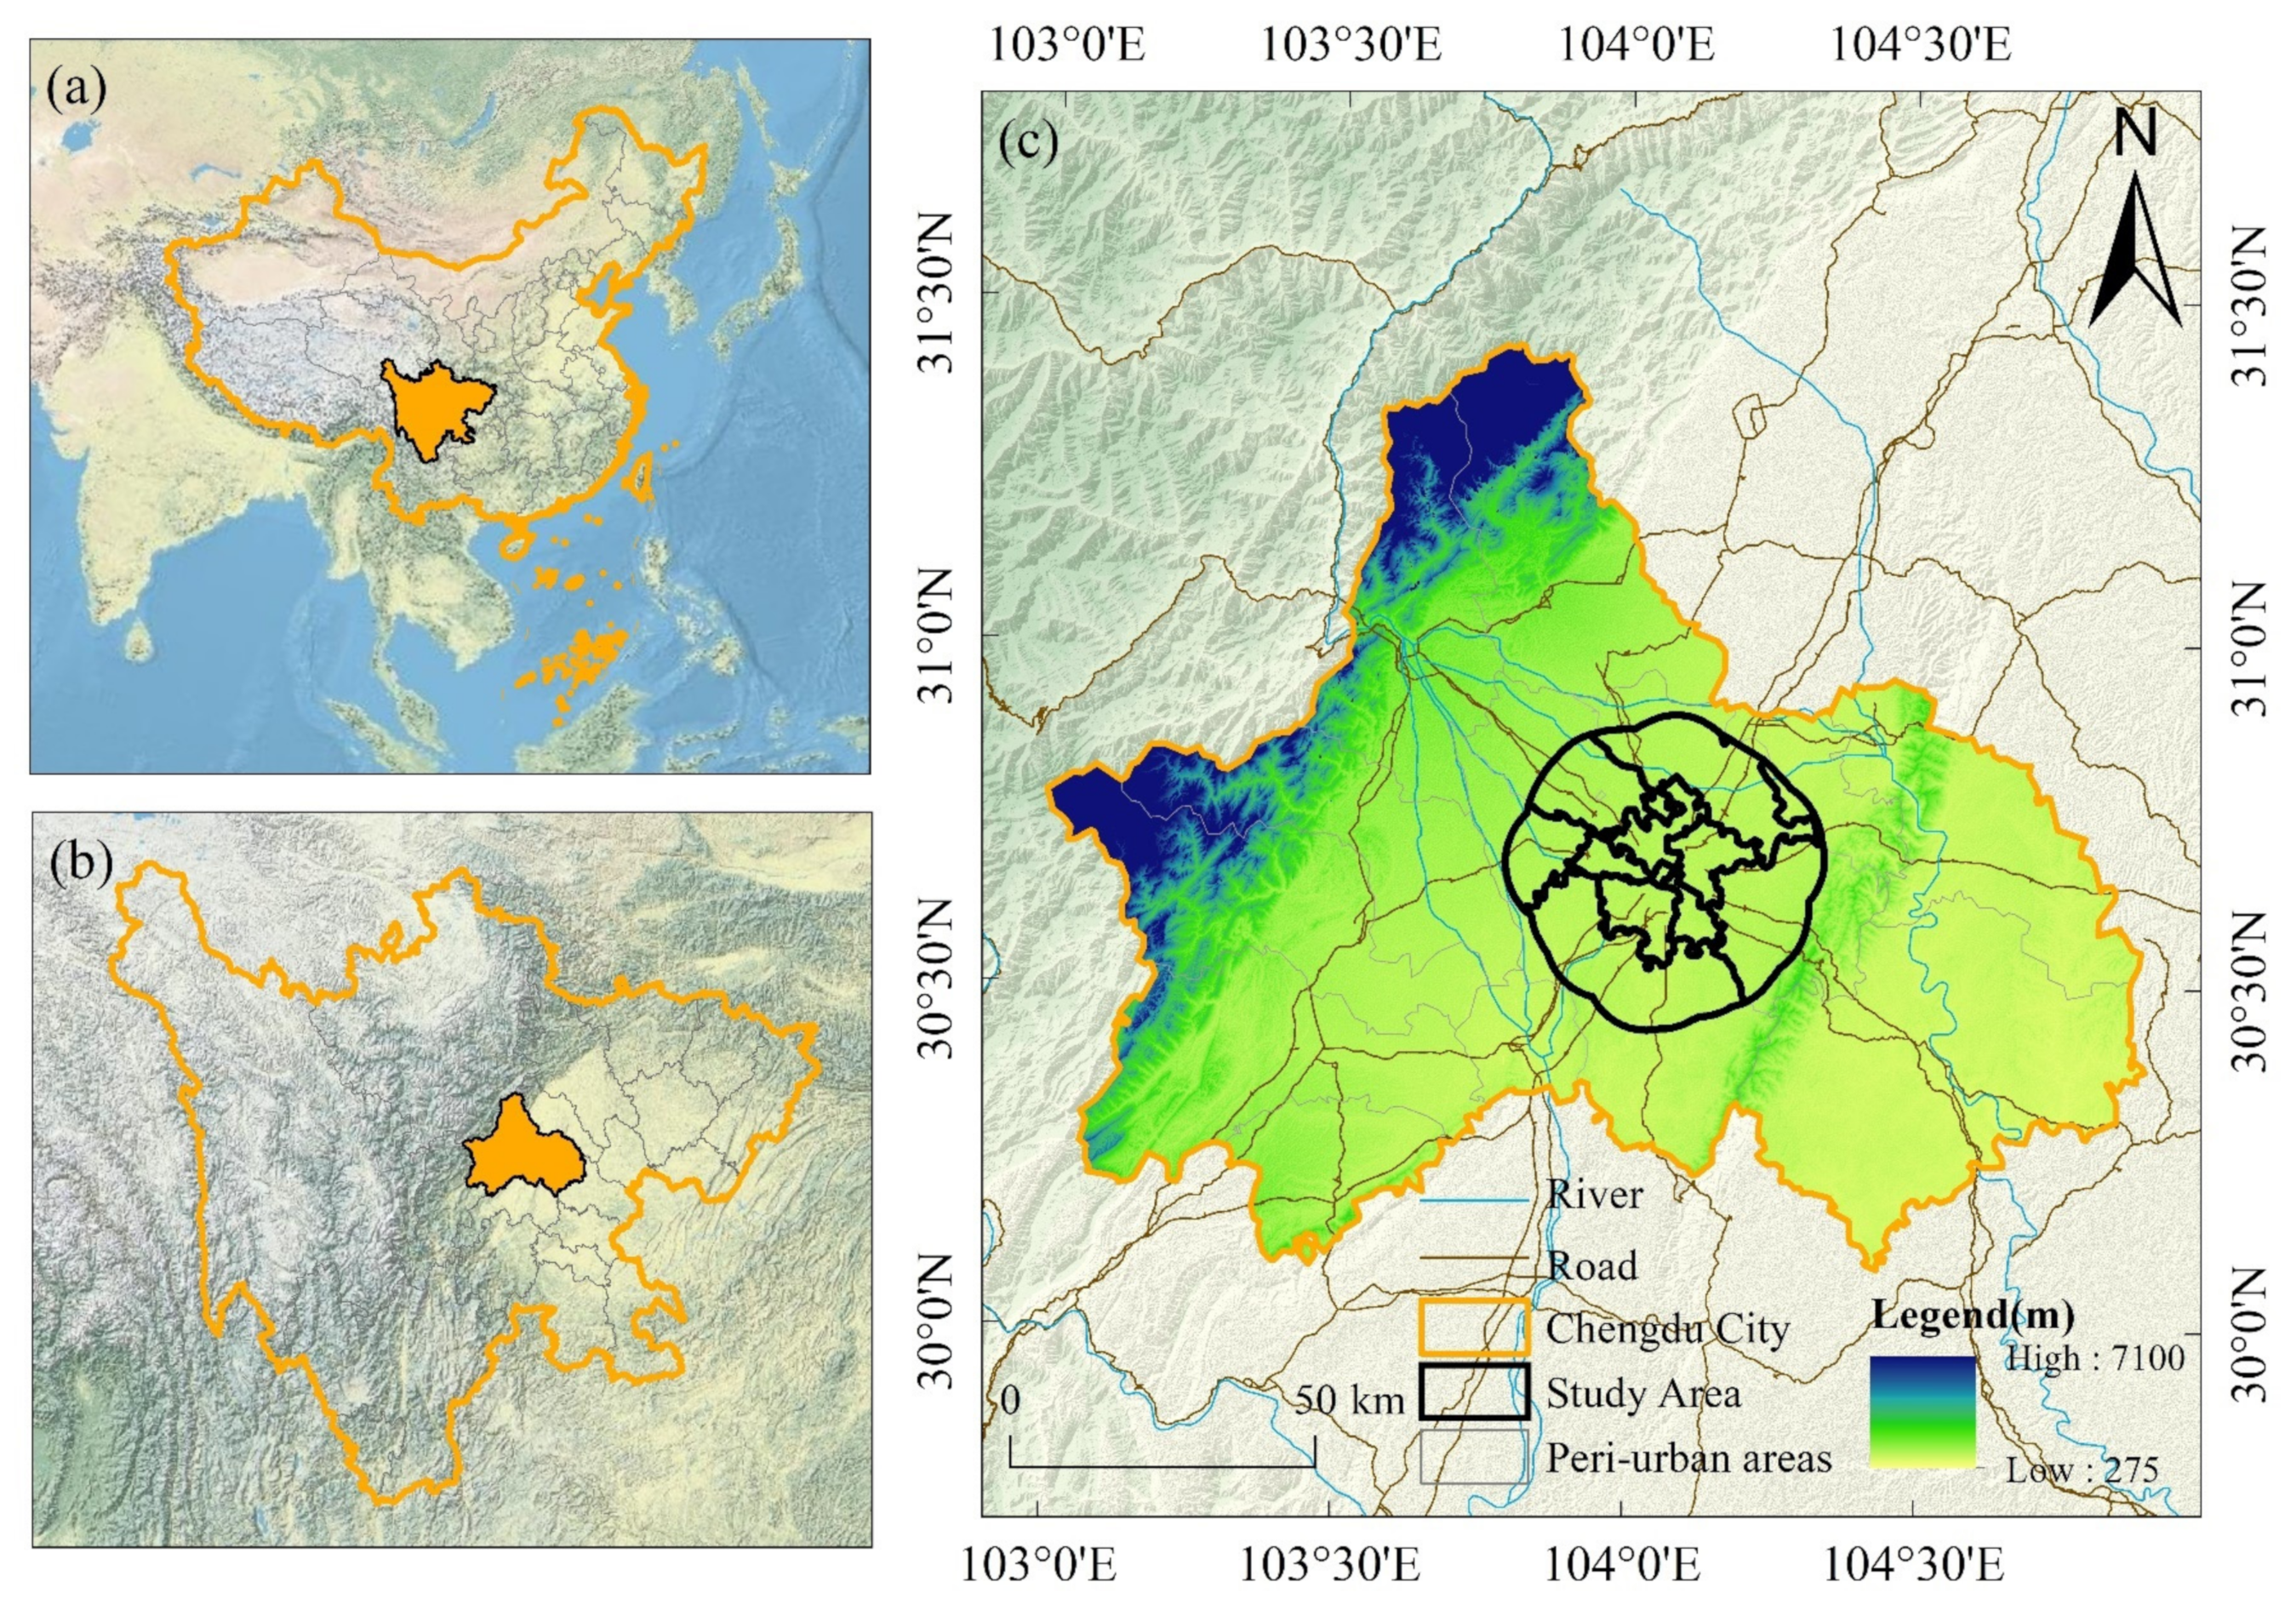
3.1. Study Area
3.2. Data Collection and Processing
3.2.1. Supply Data Processing
3.2.2. Demand Data Processing
3.2.3. Road Network Data Processing
3.2.4. Residents’ Travel Modes and Travel Behavior Management
3.2.5. Baidu Heat Map Data Processing
3.3. Research Methods
3.3.1. Calculation of Angle Step Depth Based on Space Syntax Line Segment Model
3.3.2. The Improvement of the Basic Gravity Model Is the Two-Step Floating Catchment Area (2SFCA) Method
3.3.3. Enhanced 3SFCA Method for Multimodal UGSA
3.3.4. Construct an Equity Index to Evaluate the Spatial Equity of UGSA (Urban Green Space Accessibility) Supply
3.3.5. Construct a Four-Quadrant Model to Evaluate the Resource Matching Between UGSA (Urban Green Space Accessibility) and Equity
4. Results
4.1. Analysis of Spatial Disparities in UGSA (Urban Green Space Accessibility)
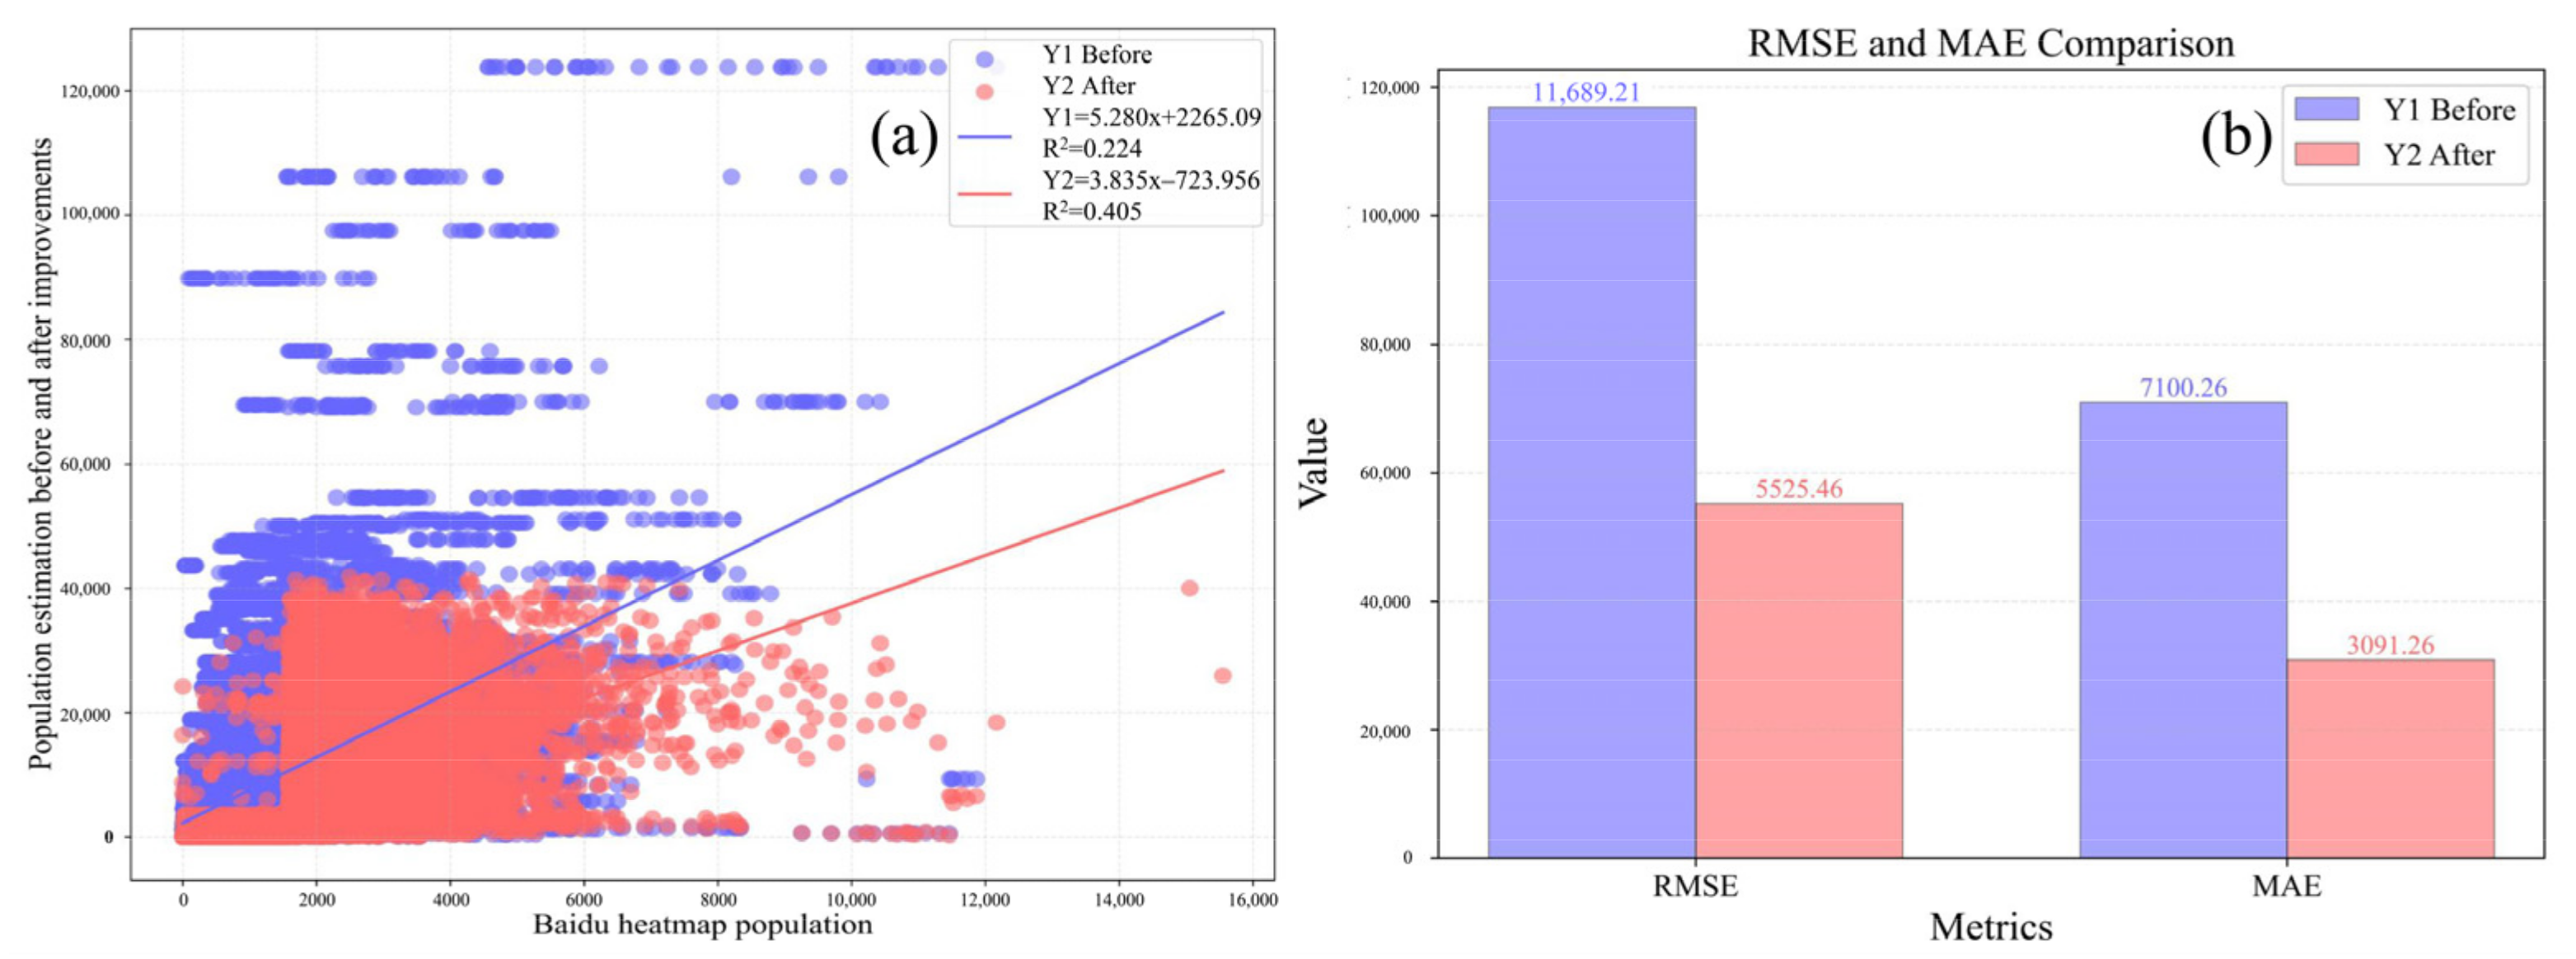
4.1.1. Comparative Analysis of Population Demand Points Based on Baidu Heatmap Data Validation
4.1.2. Analysis of Spatial Distribution Differences in UGSA Based on the 3SFCA Method
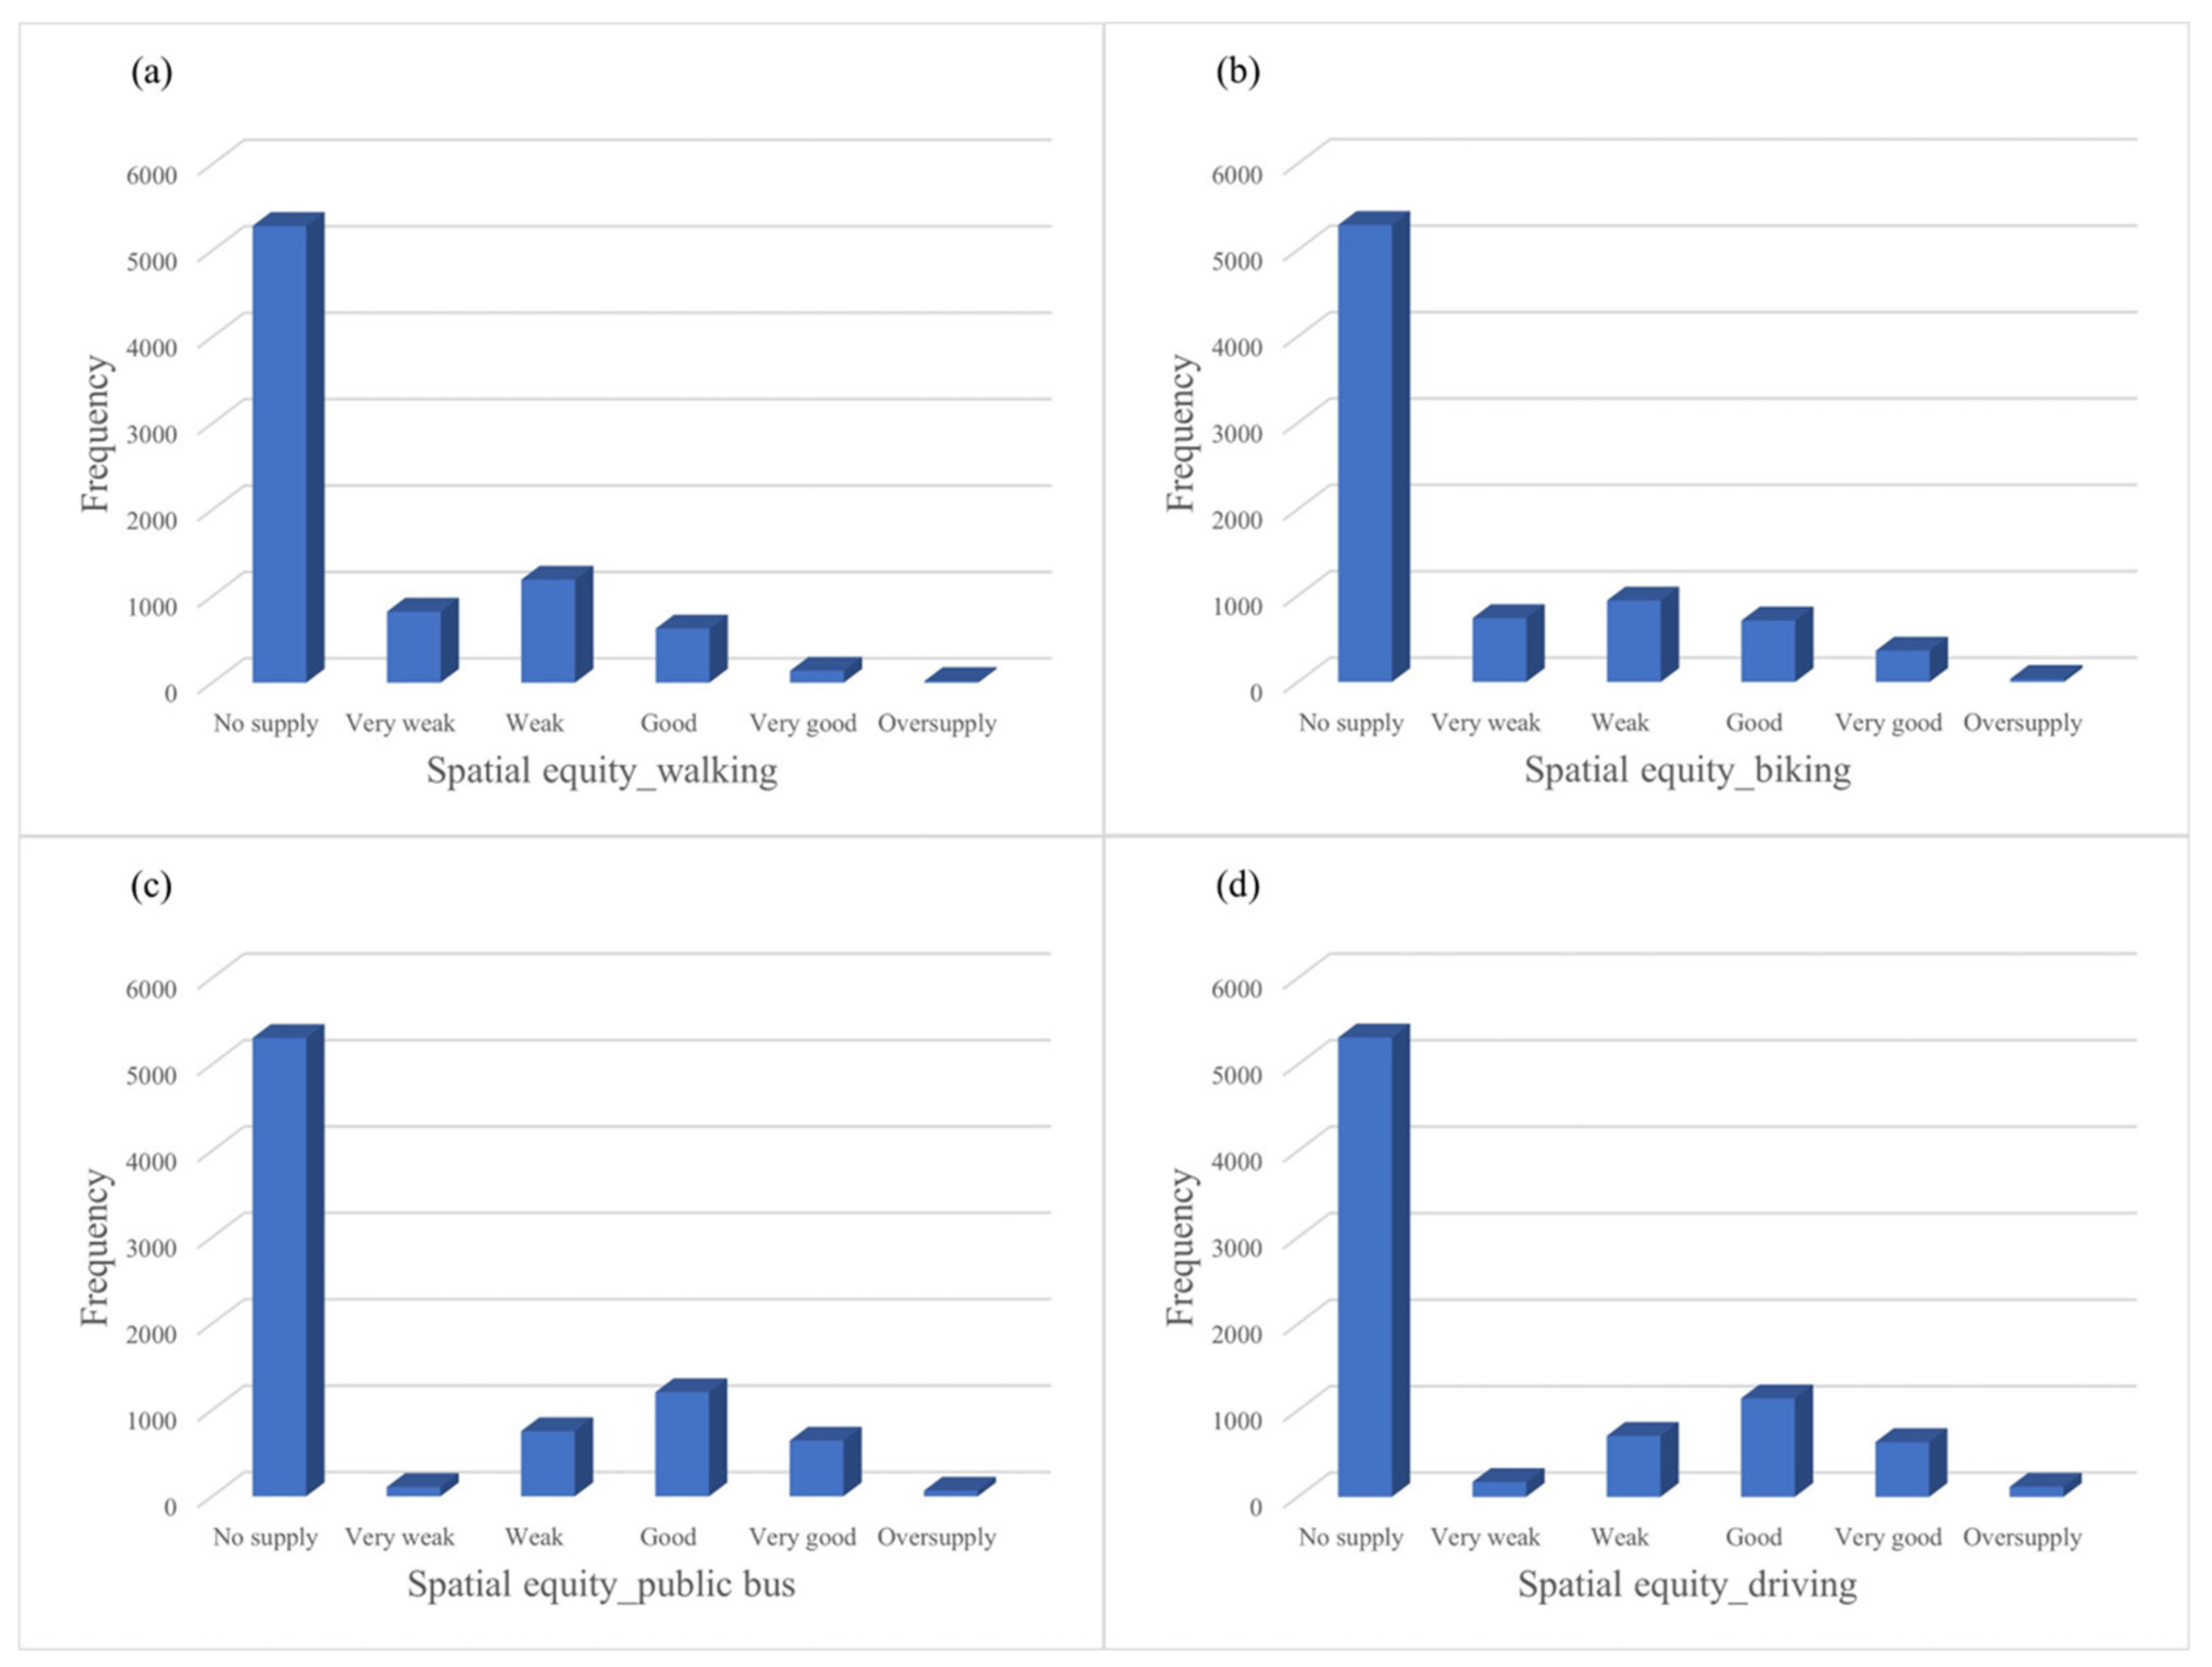
4.2. Comparative Analysis of Single-Mode UGSA Equity Based on the 3SFCA Method
4.3. Spatial Disparities in Park Accessibility Equity and Travel Behavior
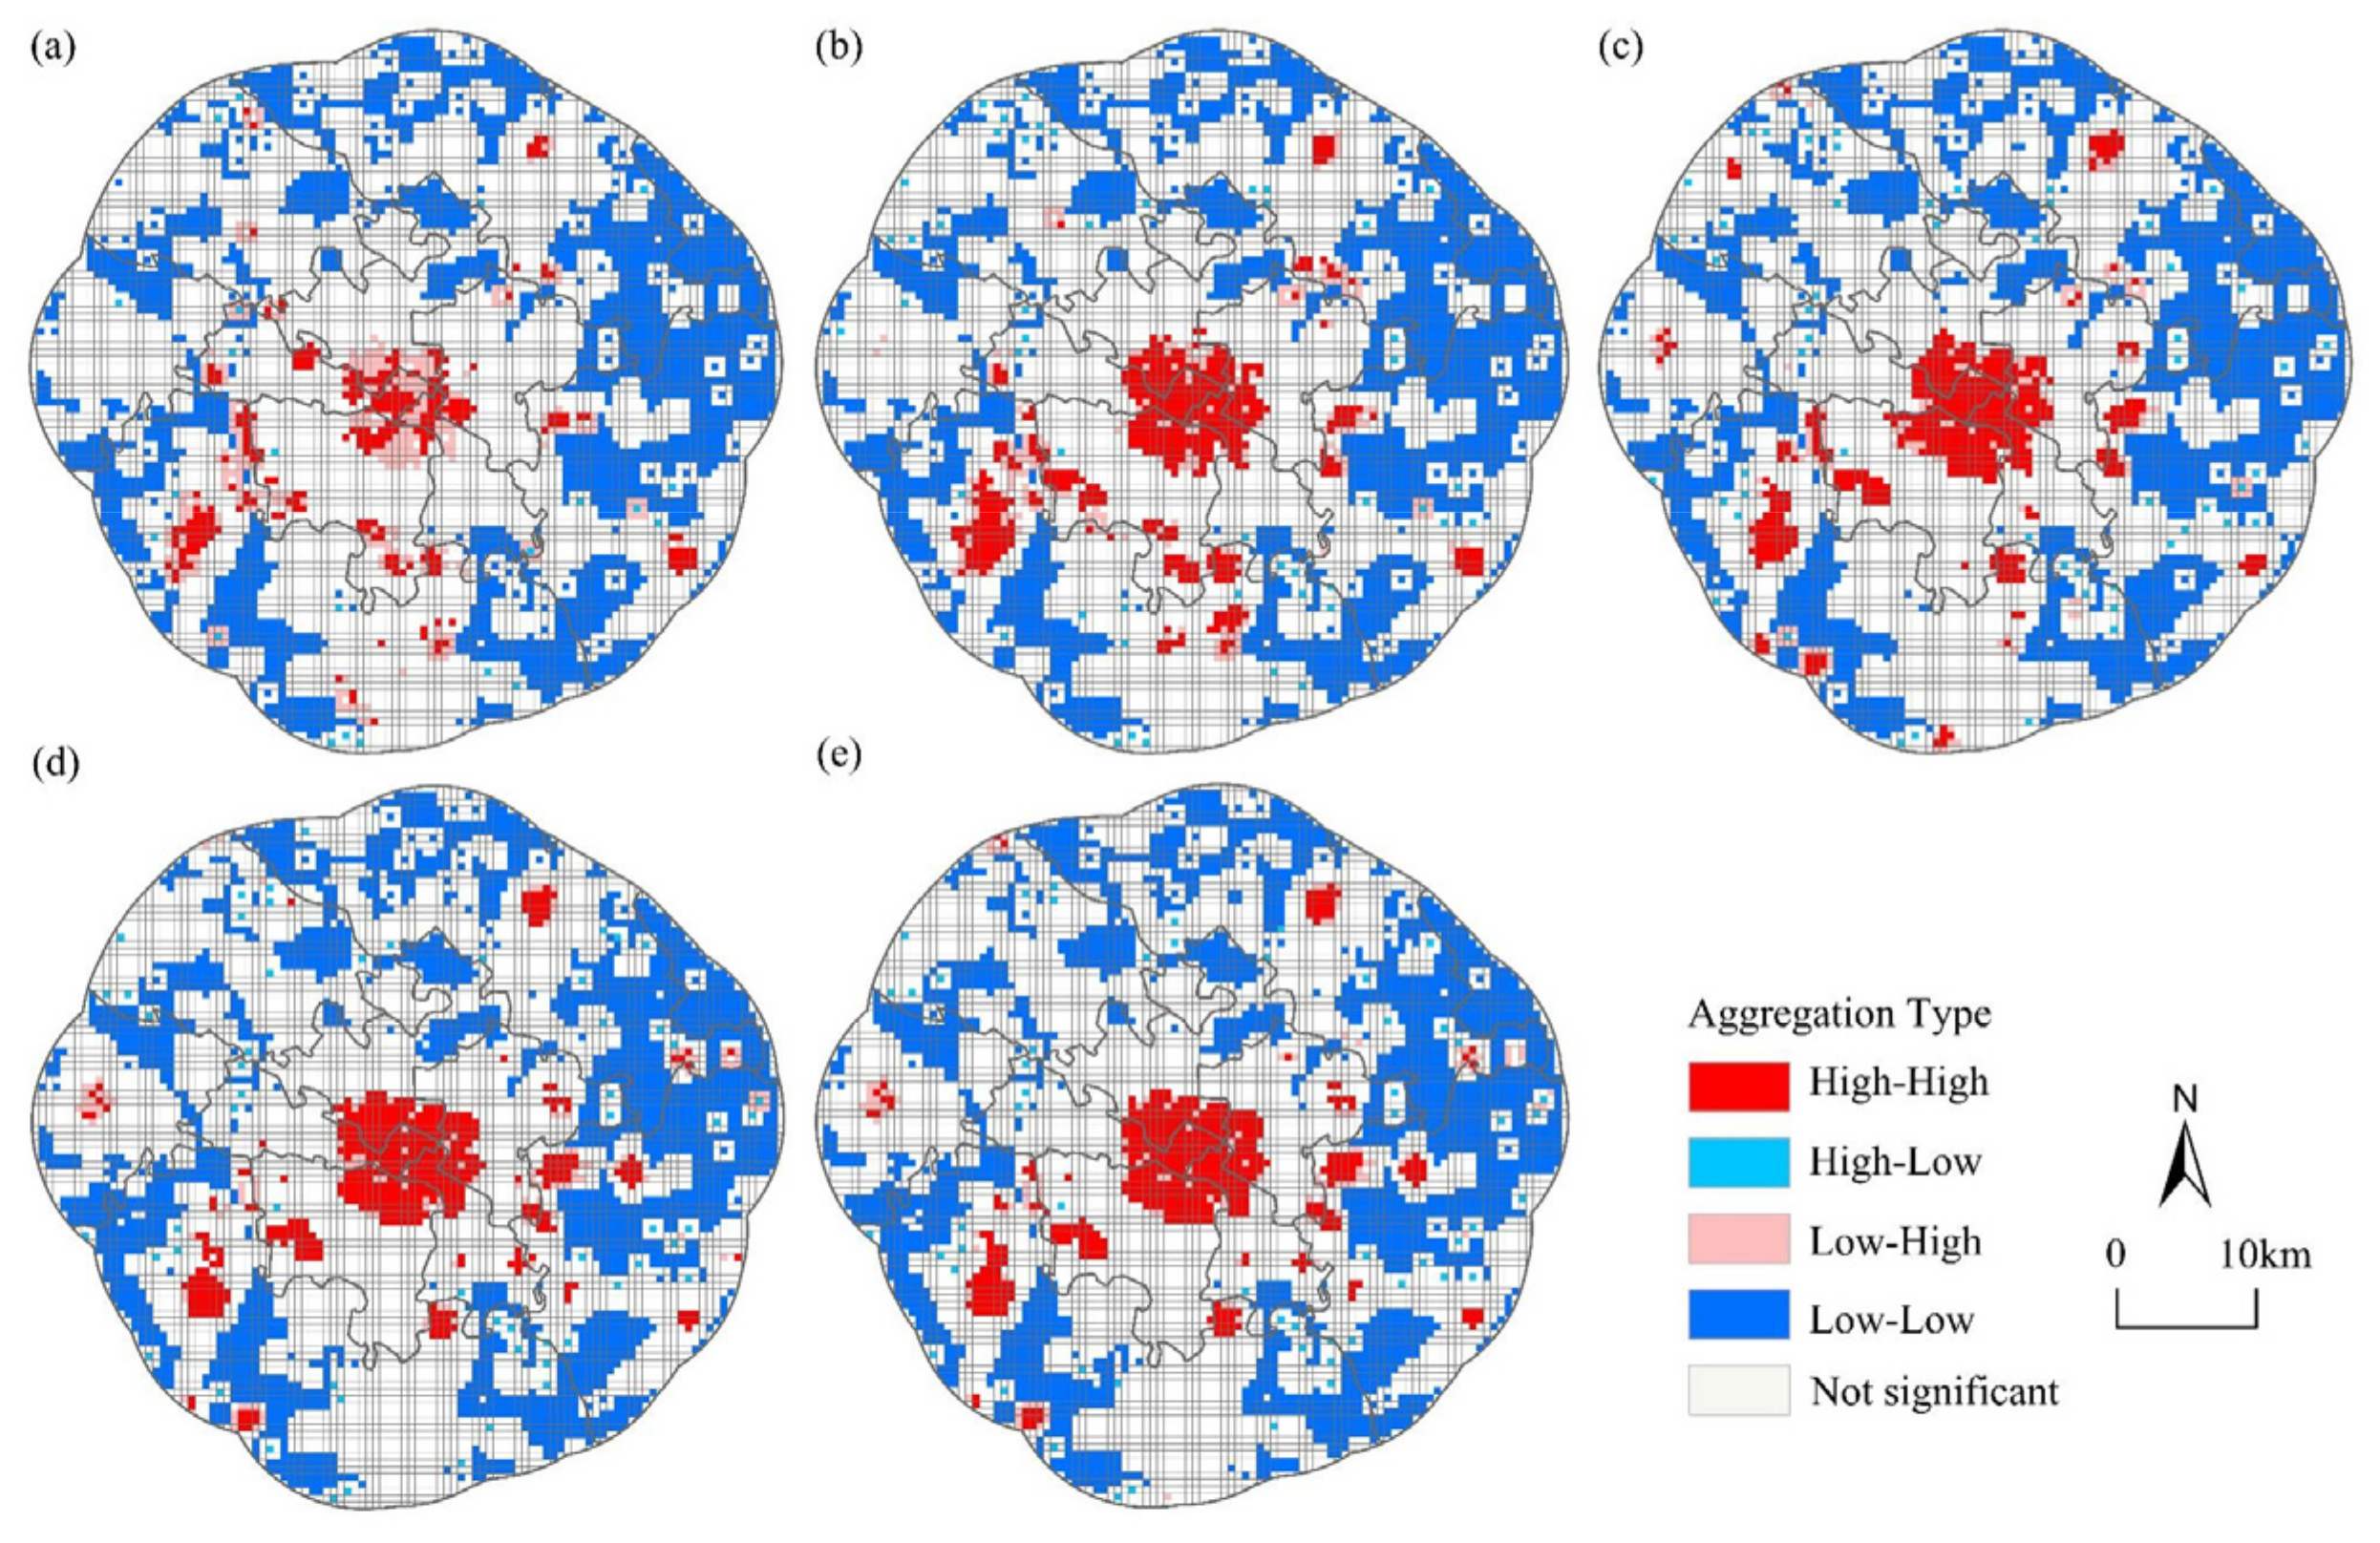
4.3.1. Spatial Clustering Pattern of Park Accessibility Equity Based on the Local Moran’s I Index
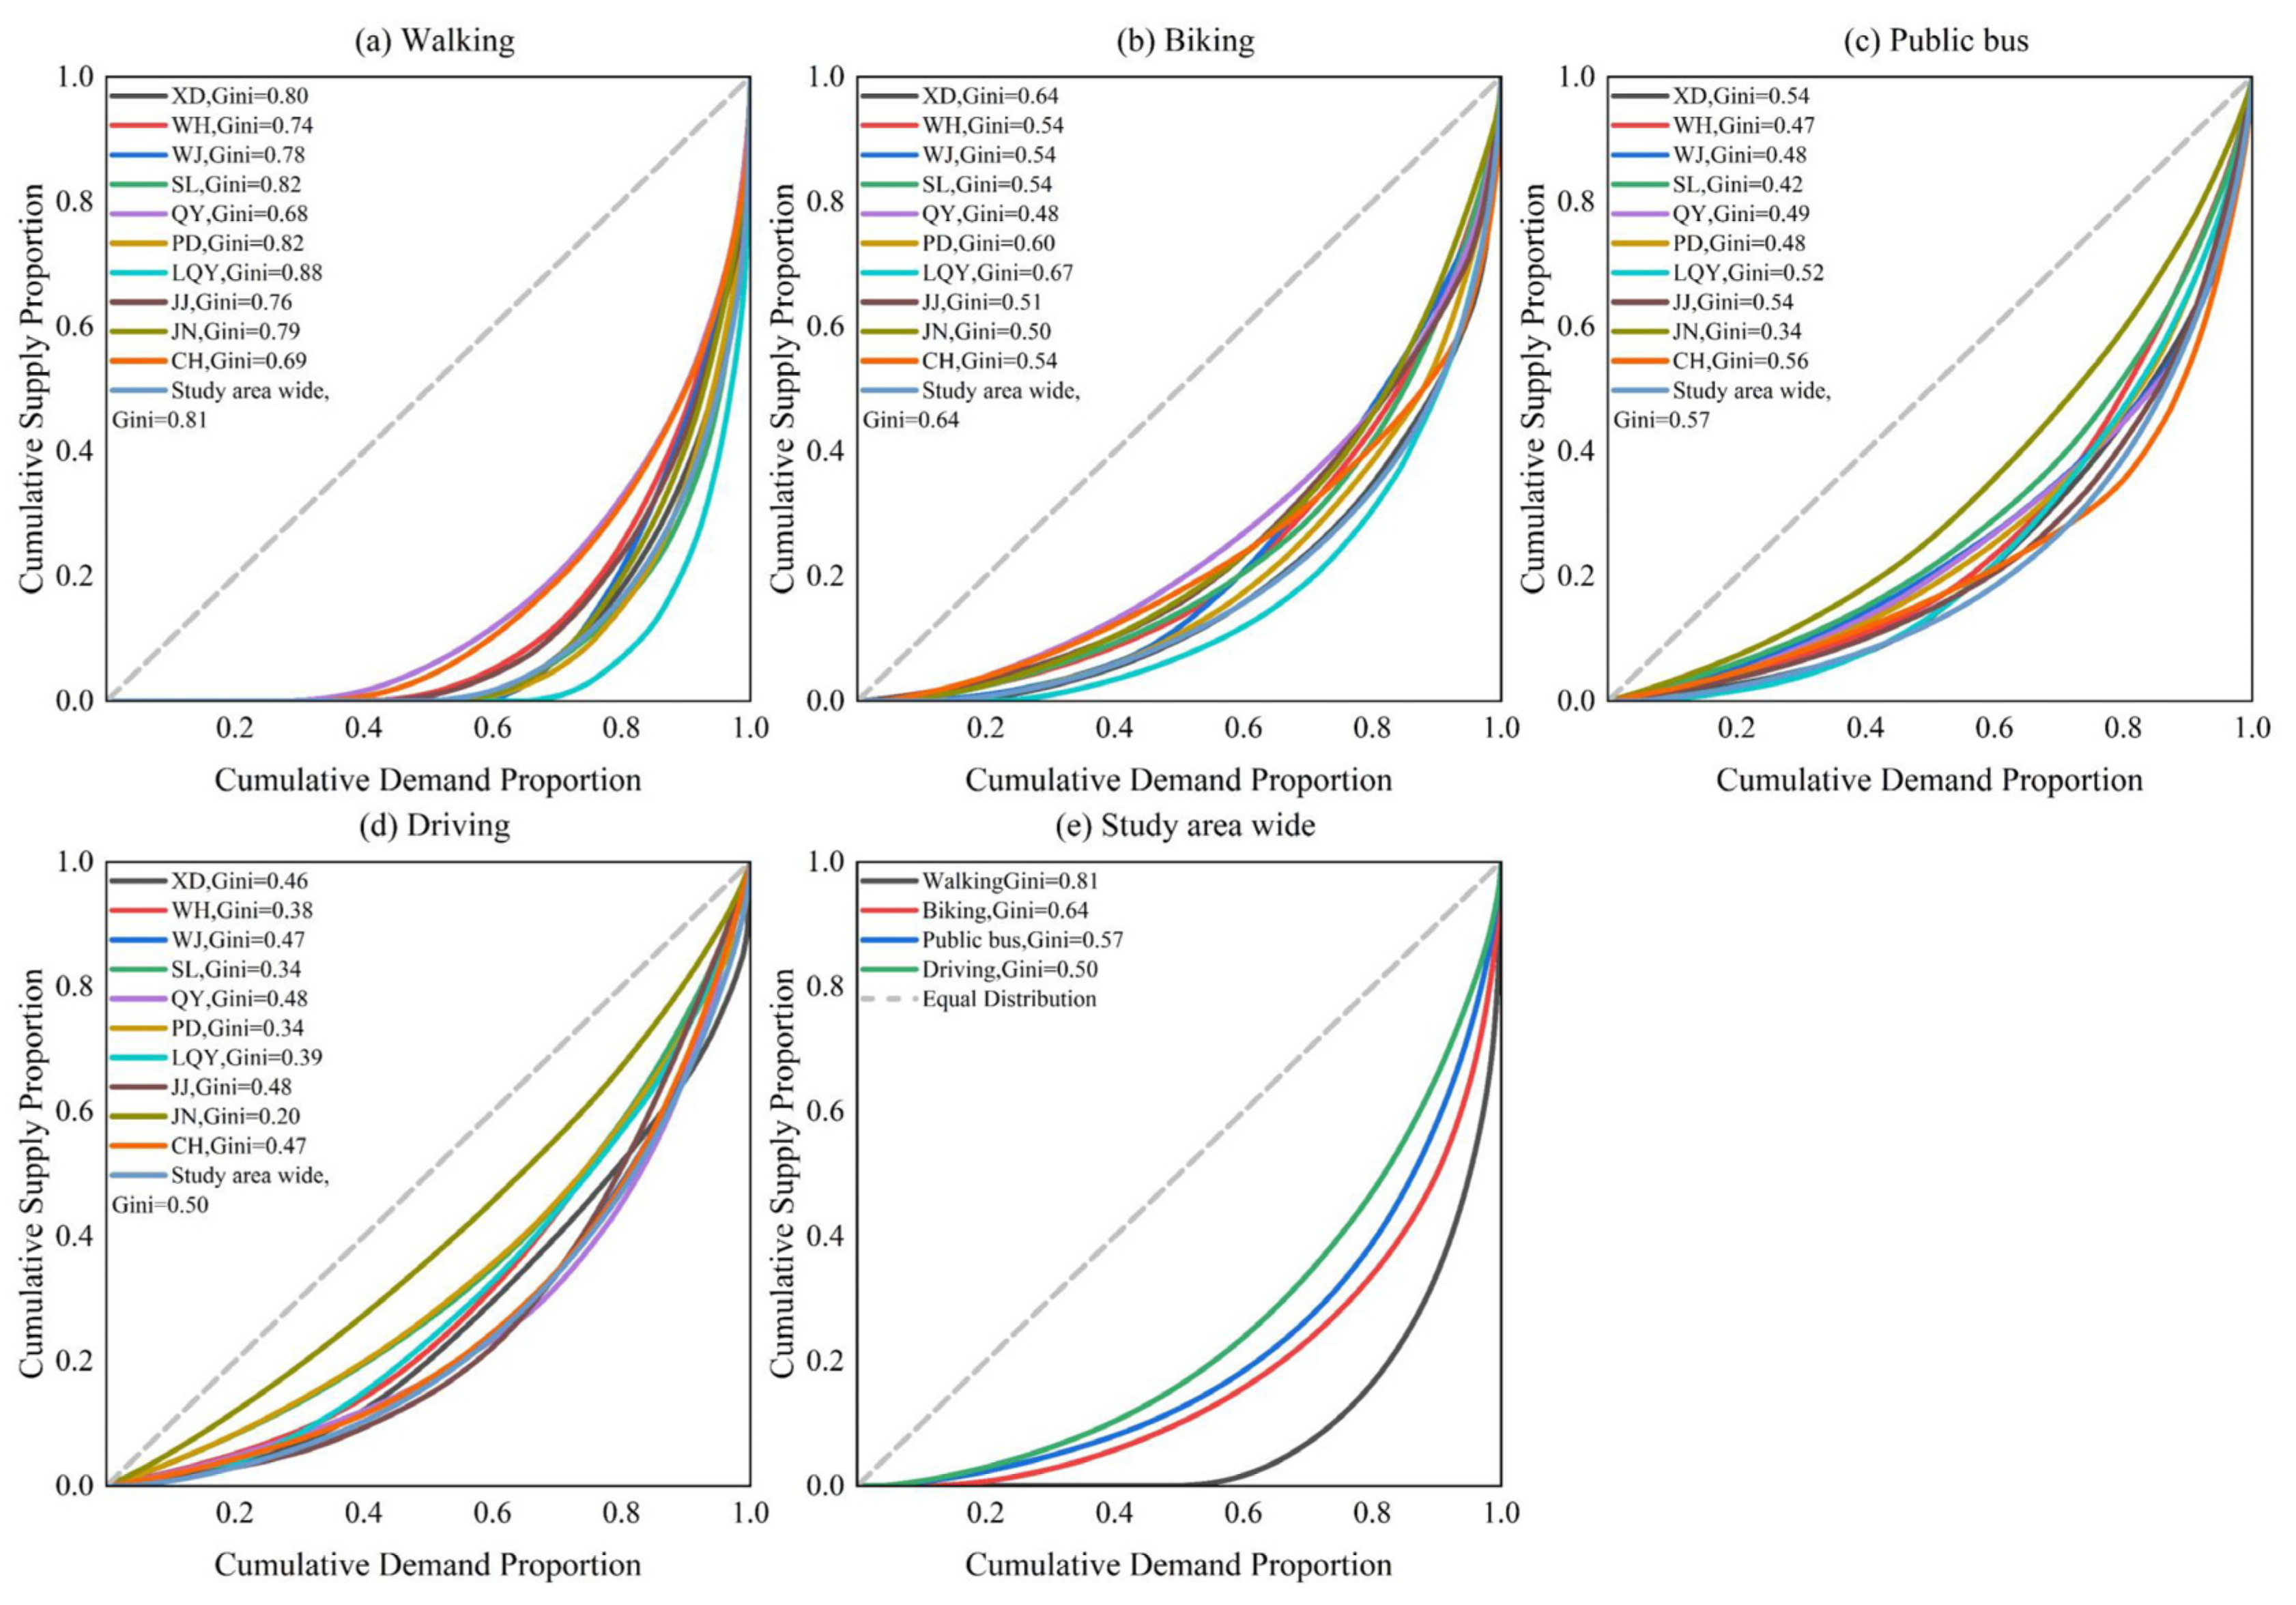
4.3.2. Comprehensive Analysis of Park Accessibility Equity Based on the Lorenz Curve and Gini Index
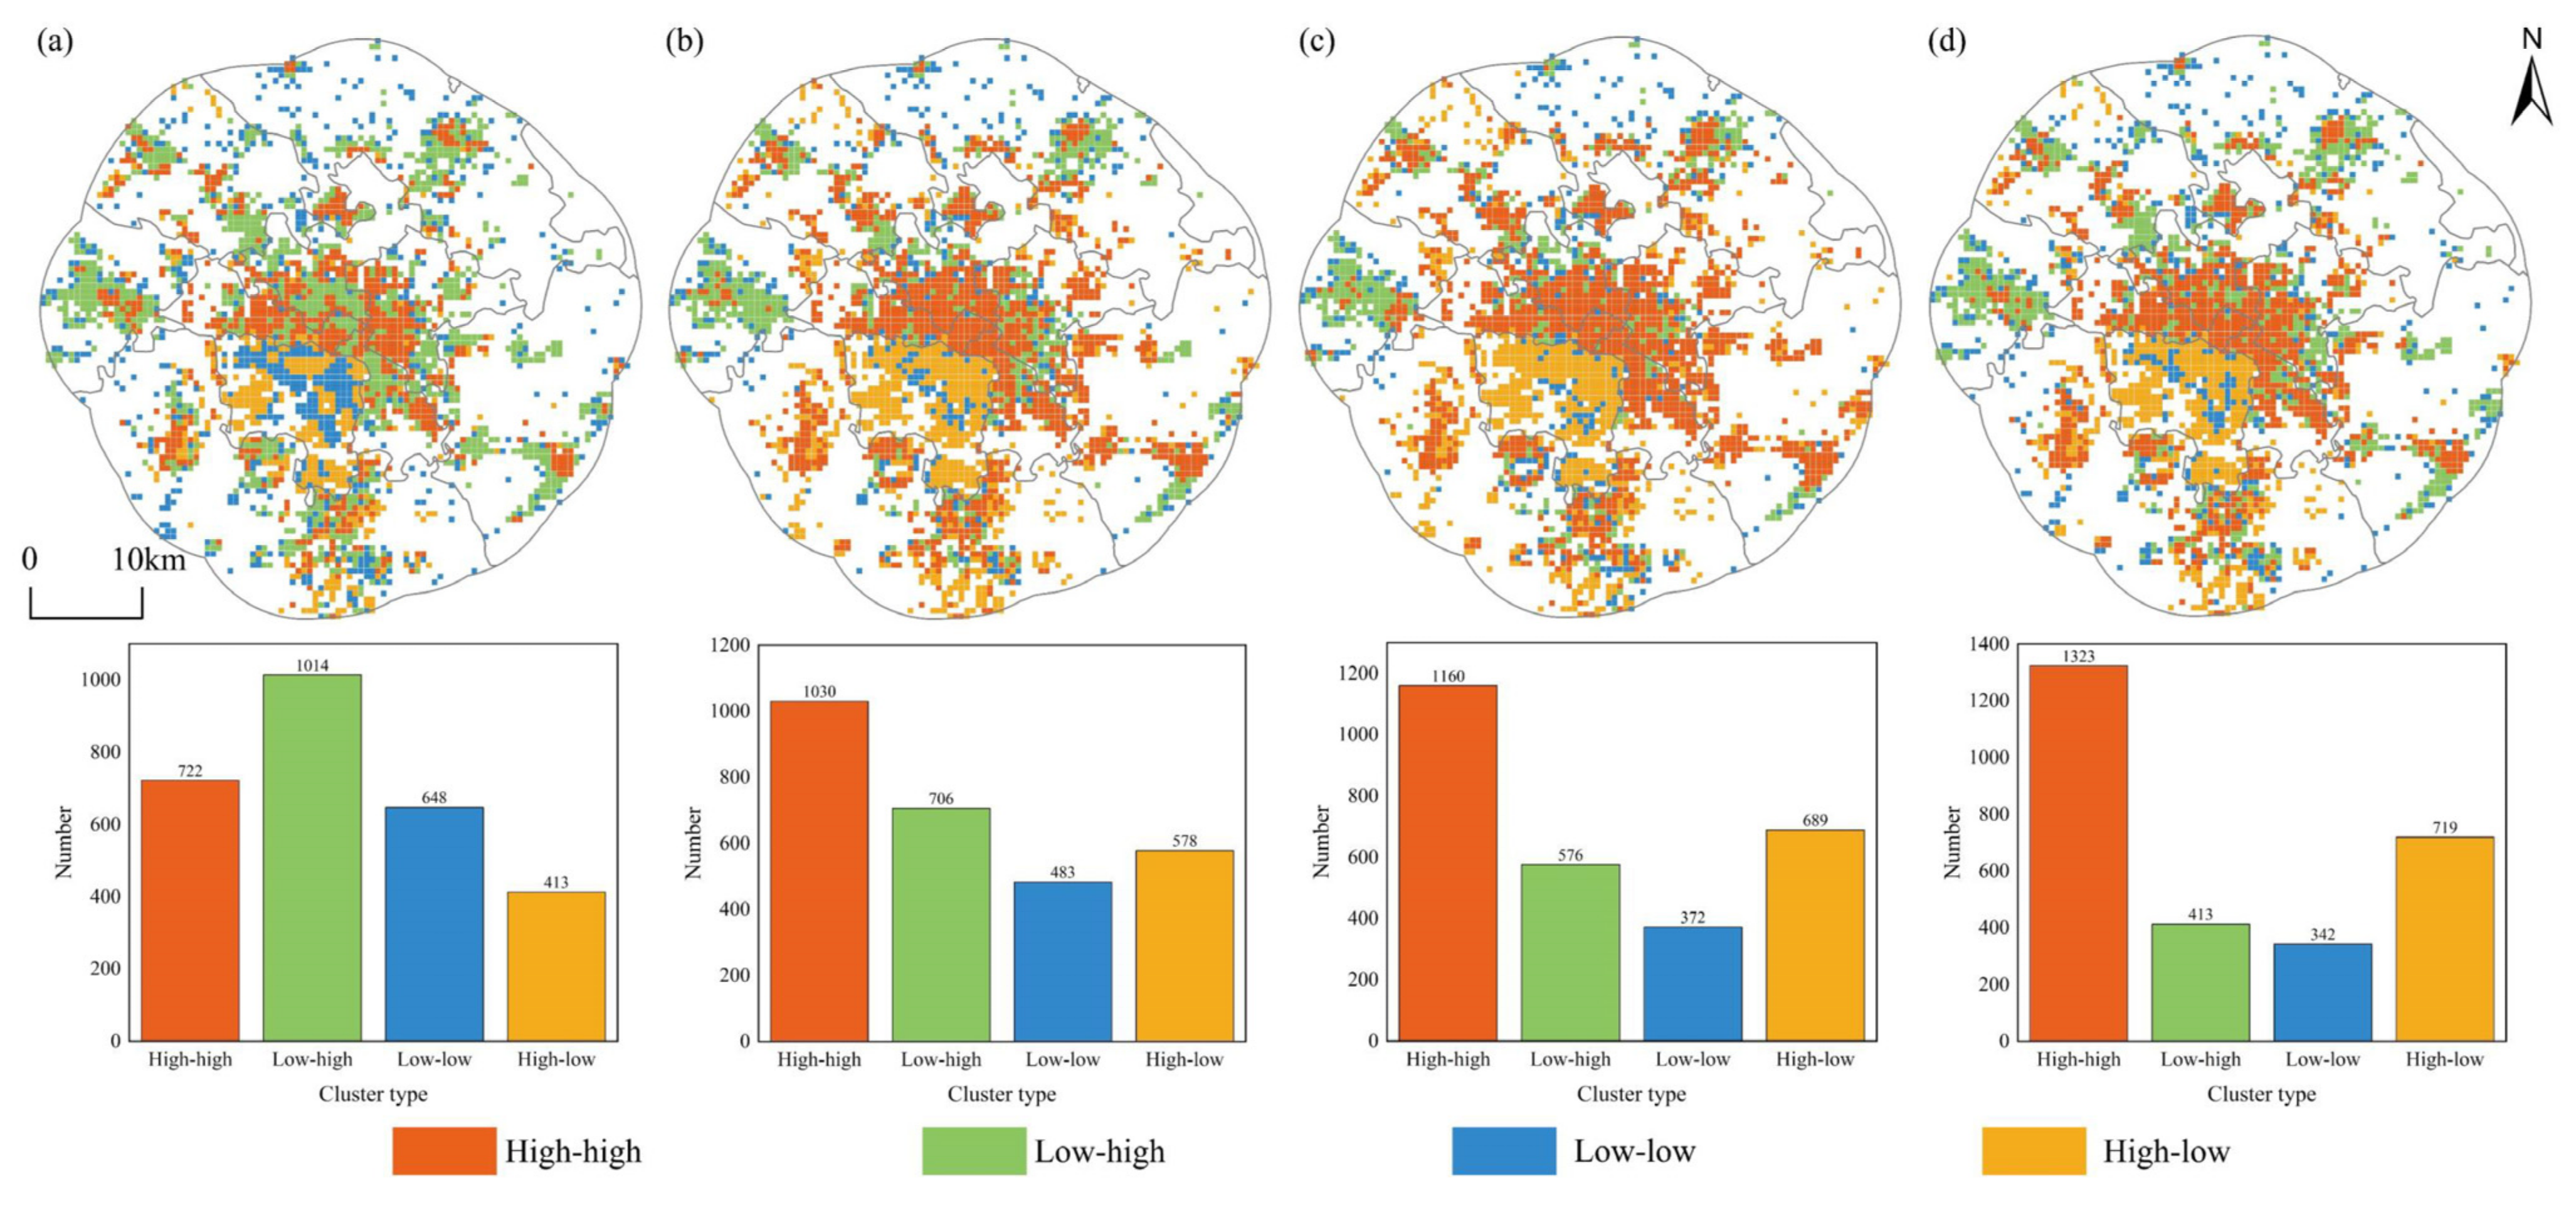
4.4. Analysis of Vulnerable Population Density and UGSA Resource Matching Based on the Four-Quadrant Model
4.4.1. Resource Matching Analysis of Children and the Elderly in UGSA
4.4.2. Optimization Recommendations for Addressing UGSA Equity Matching Issues for Children and the Elderly
5. Discussion
5.1. The Spatial Inequality of UGSA Distribution and Its Influencing Factors
5.2. Innovations and Optimizations in UGSA Evaluation Methods
5.3. The Applied Value and Future Development Directions of UGSA Research
6. Conclusions
Author Contributions
Funding
Institutional Review Board Statement
Informed Consent Statement
Data Availability Statement
Acknowledgments
Conflicts of Interest
References
- World Health Organization; United Nations Human Settlements Programme. Integrating Health in Urban and Territorial Planning: A Sourcebook; World Health Organization: Geneva, Switzerland, 2020; ISBN 978-92-4-000317-0. [Google Scholar]
- Li, Z.; Wang, X.; Feng, Z.; Zheng, Y.; Wang, J.; Wu, K. Progress toward Some of Sustainable Development Goals in China’s Population-Shrinking Cities. J. Clean. Prod. 2024, 448, 141672. [Google Scholar] [CrossRef]
- Bi, X.; Gan, X.; Jiang, Z.; Li, Z.; Li, J. How Do Landscape Patterns in Urban Parks Affect Multiple Cultural Ecosystem Services Perceived by Residents? Sci. Total Environ. 2024, 946, 174255. [Google Scholar] [CrossRef] [PubMed]
- Ye, C.; Hu, L.; Li, M. Urban Green Space Accessibility Changes in a High-Density City: A Case Study of Macau from 2010 to 2015. J. Transp. Geogr. 2018, 66, 106–115. [Google Scholar] [CrossRef]
- Zhang, L.; Zhou, S.; Kwan, M.-P.; Chen, F.; Lin, R. Impacts of Individual Daily Greenspace Exposure on Health Based on Individual Activity Space and Structural Equation Modeling. Int. J. Environ. Res. Public Health 2018, 15, 2323. [Google Scholar] [CrossRef]
- Moulay, A.; Ujang, N.; Said, I. Legibility of Neighborhood Parks as a Predicator for Enhanced Social Interaction towards Social Sustainability. Cities 2017, 61, 58–64. [Google Scholar] [CrossRef]
- Luo, C.; Yu, H.; Liu, Y.; Yang, W. Supply and Demand Assessment of Physical Activity Services Provided by Urban Green Spaces: A Case Study of Chongqing, China. Urban For. Urban Green. 2024, 95, 128315. [Google Scholar] [CrossRef]
- Haaland, C.; van den Bosch, C.K. Challenges and Strategies for Urban Green-Space Planning in Cities Undergoing Densification: A Review. Urban For. Urban Green. 2015, 14, 760–771. [Google Scholar] [CrossRef]
- Wüstemann, H.; Kalisch, D.; Kolbe, J. Access to Urban Green Space and Environmental Inequalities in Germany. Landsc. Urban. Plan. 2017, 164, 124–131. [Google Scholar] [CrossRef]
- Zhan, P.; Guo, Q.; Chen, H.; Wu, Y. Antecedents and Consequences of Park Crowding: Linking Park Attractiveness, Perceived Crowding, and Revisit Intention. Landsc. Urban. Plan. 2024, 245, 105015. [Google Scholar] [CrossRef]
- Li, L.; Li, X.; Niu, N.; He, J. Uneven Impacts of COVID-19 on Residents’ Utilization of Urban Parks: A Case Study of Guangzhou, China. Appl. Geogr. 2023, 153, 102905. [Google Scholar] [CrossRef]
- Ren, X.; Guan, C. Evaluating Geographic and Social Inequity of Urban Parks in Shanghai through Mobile Phone-Derived Human Activities. Urban For. Urban Green. 2022, 76, 127709. [Google Scholar] [CrossRef]
- Stewart, J.Q. Demographic Gravitation: Evidence and Applications. Sociometry 1948, 11, 31–58. [Google Scholar] [CrossRef]
- Hansen, W.G. How Accessibility Shapes Land Use. J. Am. Inst. Plan. 1959, 25, 73–76. [Google Scholar] [CrossRef]
- Talen, E.; Anselin, L. Assessing Spatial Equity: An Evaluation of Measures of Accessibility to Public Playgrounds. Environ. Plan. A 1998, 30, 595–613. [Google Scholar] [CrossRef]
- Nicholls, S. Measuring the Accessibility and Equity of Public Parks: A Case Study Using GIS. Manag. Leis. 2001, 6, 201–219. [Google Scholar] [CrossRef]
- Luo, W.; Wang, F. Measures of Spatial Accessibility to Health Care in a GIS Environment: Synthesis and a Case Study in the Chicago Region. Environ. Plann. B 2003, 30, 865–884. [Google Scholar] [CrossRef]
- Smoyer-Tomic, K.E.; Hewko, J.N.; Hodgson, M.J. Spatial Accessibility and Equity of Playgrounds in Edmonton, Canada. Can. Geogr./Géographies Can. 2004, 48, 287–302. [Google Scholar] [CrossRef]
- Luo, W.; Qi, Y. An Enhanced Two-Step Floating Catchment Area (E2SFCA) Method for Measuring Spatial Accessibility to Primary Care Physicians. Health Place 2009, 15, 1100–1107. [Google Scholar] [CrossRef]
- Radke, J.; Mu, L. Spatial Decompositions, Modeling and Mapping Service Regions to Predict Access to Social Programs. Ann. GIS 2000, 6, 105–112. [Google Scholar] [CrossRef]
- McGrail, M.R.; Humphreys, J.S. Measuring Spatial Accessibility to Primary Care in Rural Areas: Improving the Effectiveness of the Two-Step Floating Catchment Area Method. Appl. Geogr. 2009, 29, 533–541. [Google Scholar] [CrossRef]
- Dai, D. Racial/Ethnic and Socioeconomic Disparities in Urban Green Space Accessibility: Where to Intervene? Landsc. Urban Plan. 2011, 102, 234–244. [Google Scholar] [CrossRef]
- Luo, W.; Whippo, T. Variable Catchment Sizes for the Two-Step Floating Catchment Area (2SFCA) Method. Health Place 2012, 18, 789–795. [Google Scholar] [CrossRef] [PubMed]
- Wan, N.; Zou, B.; Sternberg, T. A Three-Step Floating Catchment Area Method for Analyzing Spatial Access to Health Services. Int. J. Geogr. Inf. Sci. 2012, 26, 1073–1089. [Google Scholar] [CrossRef]
- Wang, F. Measurement, Optimization, and Impact of Health Care Accessibility: A Methodological Review. Ann. Assoc. Am. Geogr. 2012, 102, 1104–1112. [Google Scholar] [CrossRef]
- Peng, J.; Liu, Y.; Ruan, Z.; Yang, H. Study on the Optimal Allocation of Public Service Facilities from the Perspective of Living Circle—A Case Study of Xiangyang High-Tech Zone, China. J. Urban. Manag. 2023, 12, 344–359. [Google Scholar] [CrossRef]
- Wu, W.; Zheng, T. Establishing a “Dynamic Two-Step Floating Catchment Area Method” to Assess the Accessibility of Urban Green Space in Shenyang Based on Dynamic Population Data and Multiple Modes of Transportation. Urban For. Urban Green. 2023, 82, 127893. [Google Scholar] [CrossRef]
- Wang, H.; Kang, Q.; Mou, S.; Nie, X.; Chen, Z.; Wu, T. How Does the Spatial Accessibility of Medical Resources Change during a Public Health Crisis? A Perspective Based on Residents’ Healthcare Preferences. J. Urban Manag. 2024, in press. [Google Scholar] [CrossRef]
- Mao, L.; Nekorchuk, D. Measuring Spatial Accessibility to Healthcare for Populations with Multiple Transportation Modes. Health Place 2013, 24, 115–122. [Google Scholar] [CrossRef]
- Tao, Z.; Cheng, Y.; Dai, T.; Rosenberg, M.W. Spatial Optimization of Residential Care Facility Locations in Beijing, China: Maximum Equity in Accessibility. Int. J. Health Geogr. 2014, 13, 33. [Google Scholar] [CrossRef]
- Talen, E. The Social Equity of Urban Service Distribution: An Exploration of Park Access in Pueblo, Colorado, and Macon, Georgia. Urban Geogr. 1997, 18, 521–541. [Google Scholar] [CrossRef]
- Crawford, D.; Timperio, A.; Giles-Corti, B.; Ball, K.; Hume, C.; Roberts, R.; Andrianopoulos, N.; Salmon, J. Do Features of Public Open Spaces Vary According to Neighbourhood Socio-Economic Status? Health Place 2008, 14, 889–893. [Google Scholar] [CrossRef] [PubMed]
- Fu, Y.; Yang, J.; Wang, Z.; Zhang, B.; Xue, J.; Zeng, Y.; Li, F. Reassessing Urban Park Accessibility: An Improved Two-Step Floating Catchment Area Method Based on the Physical Activity Services Perspective. Urban For. Urban Green. 2024, 101, 128446. [Google Scholar] [CrossRef]
- Dong, X.; Ye, Y.; Yang, R.; Li, X. Planning for Green Infrastructure Based on Integration of Multi-Driving Factors: A Case Study in Pilot Site of Sponge City. Sustain. Cities Soc. 2023, 93, 104549. [Google Scholar] [CrossRef]
- Yin, Z.; Li, W.; Li, C.; Zheng, Y. The Relationship between Accessibility and Land Prices: A Focus on Accessibility to Transit in the 15-Min City. Travel. Behav. Soc. 2025, 38, 100914. [Google Scholar] [CrossRef]
- Jiang, Z.; Wu, C.; Chung, H. The 15-Minute Community Life Circle for Older People: Walkability Measurement Based on Service Accessibility and Street-Level Built Environment—A Case Study of Suzhou, China. Cities 2025, 157, 105587. [Google Scholar] [CrossRef]
- Yenisetty, P.T. Assessing Accessibility to ASFs from Bus Stops Using Distance Measures: Case of Two Indian Cities. Land. Use Policy 2021, 108, 105567. [Google Scholar] [CrossRef]
- Liu, R.; Pan, X.; Xia, Z.; Gou, J.; Han, J.; Cao, K.; Wang, D.; Xue, C. How to Lead the Optimization of Parks Spatial Patterns More Comprehensively with the Philosophy of Green Equity: A Case of Chengdu. Habitat. Int. 2025, 157, 103318. [Google Scholar] [CrossRef]
- Huang, Y.; Hong, X.; Zheng, Y.; Zhang, Y.; Li, Z. Assessment and Optimization of Spatial Equity for Urban Parks: A Case Study in Nanjing, China. Ecol. Indic. 2024, 166, 112449. [Google Scholar] [CrossRef]
- Dai, W.; Yuan, S.; Liu, Y.; Peng, D.; Niu, S. Measuring Equality in Access to Urban Parks: A Big Data Analysis from Chengdu. Front. Public Health 2022, 10, 1022666. [Google Scholar] [CrossRef]
- Li, Z.; Fan, Z.; Song, Y.; Chai, Y. Assessing Equity in Park Accessibility Using a Travel Behavior-Based G2SFCA Method in Nanjing, China. J. Transp. Geogr. 2021, 96, 103179. [Google Scholar] [CrossRef]
- Millward, H.; Spinney, J.; Scott, D. Active-Transport Walking Behavior: Destinations, Durations, Distances. J. Transp. Geogr. 2013, 28, 101–110. [Google Scholar] [CrossRef]
- Tan, R.; Wang, R.; Wang, Y.; Yi, D.; Chen, Y.; Cai, W.; Wang, X. The Park City Perspective Study: Revealing the Park Accessibility Influenced by Experiences of Visitors under Different Travel Modes. Front. Environ. Sci. 2022, 10, 924996. [Google Scholar] [CrossRef]
- Luo, L.; Chao, Y.; Liu, S.; Shuai, W.; Shang, F. Multi-Feature Clustering Approach for Firearm Wound Identification on CT Images. In Proceedings of the 2019 IEEE International Conference on Mechatronics and Automation (ICMA), Tianjin, China, 4–7 August 2019; pp. 1594–1599. [Google Scholar]
- Li, J.; Li, J.; Yuan, Y.; Li, G. Spatiotemporal Distribution Characteristics and Mechanism Analysis of Urban Population Density: A Case of Xi’an, Shaanxi, China. Cities 2019, 86, 62–70. [Google Scholar] [CrossRef]
- Lyu, F.; Zhang, L. Using Multi-Source Big Data to Understand the Factors Affecting Urban Park Use in Wuhan. Urban For. Urban Green. 2019, 43, 126367. [Google Scholar] [CrossRef]
- Fang, L.; Huang, J.; Zhang, Z.; Nitivattananon, V. Data-Driven Framework for Delineating Urban Population Dynamic Patterns: Case Study on Xiamen Island, China. Sustain. Cities Soc. 2020, 62, 102365. [Google Scholar] [CrossRef]
- Fan, Z.; Duan, J.; Lu, Y.; Zou, W.; Lan, W. A Geographical Detector Study on Factors Influencing Urban Park Use in Nanjing, China. Urban For. Urban Green. 2021, 59, 126996. [Google Scholar] [CrossRef]
- Alalouch, C.; Al-Hajri, S.; Naser, A.; Al Hinai, A. The Impact of Space Syntax Spatial Attributes on Urban Land Use in Muscat: Implications for Urban Sustainability. Sustain. Cities Soc. 2019, 46, 101417. [Google Scholar] [CrossRef]
- Li, X.; Yang, T.; Zhu, Z.; Zeng, Z.; Zeng, G.; Liang, J.; Chen, X.; Li, X. A Study on Air Pollution Exposure of “First and Last Mile” Urban Commuters under Space-Behavior Dual Verification Based on Big Data, Land-Use Regression Model and Space Syntax. J. Clean. Prod. 2023, 419, 138244. [Google Scholar] [CrossRef]
- Lyu, Y.; Abd Malek, M.I.; Ja’afar, N.H.; Sima, Y.; Han, Z.; Liu, Z. Unveiling the Potential of Space Syntax Approach for Revitalizing Historic Urban Areas: A Case Study of Yushan Historic District, China. Front. Archit. Res. 2023, 12, 1144–1156. [Google Scholar] [CrossRef]
- Mahmoud, A.H.; Omar, R.H. Planting Design for Urban Parks: Space Syntax as a Landscape Design Assessment Tool. Front. Archit. Res. 2015, 4, 35–45. [Google Scholar] [CrossRef]
- Murgante, B.; Valluzzi, R.; Annunziata, A. Developing a 15-Minute City: Evaluating Urban Quality Using Configurational Analysis. The Case Study of Terni and Matera, Italy. Appl. Geogr. 2024, 162, 103171. [Google Scholar] [CrossRef]
- Omer, I.; Kaplan, N. Using Space Syntax and Agent-Based Approaches for Modeling Pedestrian Volume at the Urban Scale. Comput. Environ. Urban Syst. 2017, 64, 57–67. [Google Scholar] [CrossRef]
- Wu, Y.; Liu, Q.; Hang, T.; Yang, Y.; Wang, Y.; Cao, L. Integrating Restorative Perception into Urban Street Planning: A Framework Using Street View Images, Deep Learning, and Space Syntax. Cities 2024, 147, 104791. [Google Scholar] [CrossRef]
- Yunitsyna, A.; Shtepani, E. Investigating the Socio-Spatial Relations of the Built Environment Using the Space Syntax Analysis—A Case Study of Tirana City. Cities 2023, 133, 104147. [Google Scholar] [CrossRef]
- Zhai, Y.; Korça Baran, P.; Wu, C. Can Trail Spatial Attributes Predict Trail Use Level in Urban Forest Park? An Examination Integrating GPS Data and Space Syntax Theory. Urban For. Urban Green. 2018, 29, 171–182. [Google Scholar] [CrossRef]
- Taleai, M.; Sliuzas, R.; Flacke, J. An Integrated Framework to Evaluate the Equity of Urban Public Facilities Using Spatial Multi-Criteria Analysis. Cities 2014, 40, 56–69. [Google Scholar] [CrossRef]
- Anselin, L. Local Indicators of Spatial Association—LISA. Geogr. Anal. 1995, 27, 93–115. [Google Scholar] [CrossRef]
- Lorenz, M.O. Methods of Measuring the Concentration of Wealth. Publ. Am. Stat. Assoc. 1905, 9, 209–219. [Google Scholar] [CrossRef]
- Abumaizar, R.J.; Smith, E.H. Heavy Metal Contaminants Removal by Soil Washing. J. Hazard. Mater. 1999, 70, 71–86. [Google Scholar] [CrossRef]
- Yongxiu, S.; Shiliang, L.; Fangning, S.; Yi, A.; Mingqi, L.; Yixuan, L. Spatio-Temporal Variations and Coupling of Human Activity Intensity and Ecosystem Services Based on the Four-Quadrant Model on the Qinghai-Tibet Plateau. Sci. Total Environ. 2020, 743, 140721. [Google Scholar] [CrossRef]
- Vijhani, A.; Sinha, V.S.P.; Govindan, M. Assessing Resource Vulnerability Quadrants under Changing Precipitation Trends in Uttarakhand, Central Himalayan Region. J. Mt. Sci. 2021, 18, 2722–2741. [Google Scholar] [CrossRef]
- Zhang, J.; Yin, N.; Wang, S.; Yu, J.; Zhao, W.; Fu, B. A Multiple Importance–Satisfaction Analysis Framework for the Sustainable Management of Protected Areas: Integrating Ecosystem Services and Basic Needs. Ecosyst. Serv. 2020, 46, 101219. [Google Scholar] [CrossRef]
- Liang, H.; Yan, Q.; Yan, Y.; Zhang, Q. Using an Improved 3SFCA Method to Assess Inequities Associated with Multimodal Accessibility to Green Spaces Based on Mismatches between Supply and Demand in the Metropolitan of Shanghai, China. Sustain. Cities Soc. 2023, 91, 104456. [Google Scholar] [CrossRef]
- Ye, Y. Revealing Urban Greenspace Accessibility Inequity Using the Carrying Capacity-Based 3SFCA Method and Location Big Data. Sustain. Cities Soc. 2024, 108, 105513. [Google Scholar] [CrossRef]
- Blumenberg, E.; Yao, Z.; Wander, M. Variation in Child Care Access across Neighborhood Types: A Two-Step Floating Catchment Area (2SFCA) Approach. Appl. Geogr. 2023, 158, 103054. [Google Scholar] [CrossRef]
- Li, C.; Wang, J. Using an Age-Grouped Gaussian-Based Two-Step Floating Catchment Area Method (AG2SFCA) to Measure Walking Accessibility to Urban Parks: With an Explicit Focus on Elderly. J. Transp. Geogr. 2024, 114, 103772. [Google Scholar] [CrossRef]


| Category | Park Grade | Target Population | Suitable Area (hm2) | Service Radius (m) | Transportation Mode |
|---|---|---|---|---|---|
| Comprehensive park | 1 | Urban residents | ≥38.12 | 5000 | Walking, bicycle, public bus, private car |
| Specialized park | 2 | 4.82 < 38.12 | 2500 | Walking, bicycle, public bus | |
| Community park | 3 | Residential area residents | 2.85 < 4.82 | 1000 | Walking, bicycle |
| Miniature garden or pocket park | 4 | Elderly and children in residential areas | 0.5 < 2.8 | 500 | Walking |
| Type | Num | Percent (%) | Mean | |
|---|---|---|---|---|
| Gender | Male | 273 | 54.6 | /(not applicable) |
| Female | 227 | 45.4 | ||
| Age | 0–18 | 16 | 3.3 | Average age 48.19 |
| 18–30 | 192 | 39.7 | ||
| 30–45 | 126 | 26 | ||
| 45–60 | 104 | 21.5 | ||
| >60 | 46 | 9.5 | ||
| Educational level | Primary school (or below) | 34 | 7 | / |
| Middle school | 101 | 20.8 | ||
| High school | 179 | 36.9 | ||
| Bachelor’s degree | 145 | 29.9 | ||
| Master’s degree | 19 | 3.9 | ||
| PhD | 6 | 1.2 | ||
| Occupation | Student | 38 | 7.8 | / |
| Corporate employee | 72 | 14.8 | ||
| Government employee | 14 | 2.8 | ||
| Public institution Employee | 48 | 9.9 | ||
| Retiree | 232 | 47.9 | ||
| Freelancer and others | 77 | 15.9 | ||
| Income (CNY/month) | <3000 | 183 | 37.8 | Average income 4124.72 |
| 3000–6000 | 198 | 40.9 | ||
| 6000–10,000 | 67 | 13.8 | ||
| 10,000–20,000 | 29 | 5.9 | ||
| >20,000 | 4 | 0.8 | ||
| Travel time (min) | <10 | 179 | 36.9 | Average time 12.95 |
| 15–20 | 116 | 23.9 | ||
| 20–30 | 96 | 29.8 | ||
| 30–45 | 50 | 10.3 | ||
| >45 | 43 | 8.8 | ||
| Travel distance (m) | <500 | 165 | 34.1 | Average distance 1328 |
| 500–1000 | 144 | 29.7 | ||
| 1000–2000 | 78 | 16.1 | ||
| 2000–4000 | 58 | 11.9 | ||
| >4000 | 39 | 8 |
| Mode of Transportation | Walking | Cycling (Shared Bikes, Personal Bicycles) | Public Transportation (Bus, Excluding Rail Transit) | Private Car (Private Vehicles, Taxis, Ride-Hailing Services) |
|---|---|---|---|---|
| Proportion of transportation Mode choice | 22.20% | 10.40% | 29.60% | 37.80% |
| Travel time | 15 min | 15 min | 15 min | 15 min |
| Travel speed | 4 km/h | 10 km/h | 20 km/h | 40 km/h |
| Travel distance | 1 km | 2.5 km | 5 km | 10 km |
| Class | Range of Ei Value | Supply and Demand Status | Spatial Equality |
|---|---|---|---|
| I | = 0 | No supply | High inequality |
| II | 0.25 > > 0 | Very weak | High inequality |
| III | 0.5 > ≥ 0.25 | Weak | Relative inequality |
| IV | 0.75 > ≥ 0.5 | Good | Equality |
| V | 1 ≥ ≥ 0.75 | Very good | Relative equality |
| VI | > 1 | Oversupply | High inequality |
Disclaimer/Publisher’s Note: The statements, opinions and data contained in all publications are solely those of the individual author(s) and contributor(s) and not of MDPI and/or the editor(s). MDPI and/or the editor(s) disclaim responsibility for any injury to people or property resulting from any ideas, methods, instructions or products referred to in the content. |
© 2025 by the authors. Licensee MDPI, Basel, Switzerland. This article is an open access article distributed under the terms and conditions of the Creative Commons Attribution (CC BY) license (https://creativecommons.org/licenses/by/4.0/).
Share and Cite
Sun, Y.; Li, H.; Guo, X.; Gao, C. Bridging the Green Space Divide: A Big Data-Driven Analysis of Park Accessibility Inequities in Chinese Megacities Using Enhanced 3SFCA Modeling. Sustainability 2025, 17, 2059. https://doi.org/10.3390/su17052059
Sun Y, Li H, Guo X, Gao C. Bridging the Green Space Divide: A Big Data-Driven Analysis of Park Accessibility Inequities in Chinese Megacities Using Enhanced 3SFCA Modeling. Sustainability. 2025; 17(5):2059. https://doi.org/10.3390/su17052059
Chicago/Turabian StyleSun, Yiwen, Hang Li, Xianhua Guo, and Chao Gao. 2025. "Bridging the Green Space Divide: A Big Data-Driven Analysis of Park Accessibility Inequities in Chinese Megacities Using Enhanced 3SFCA Modeling" Sustainability 17, no. 5: 2059. https://doi.org/10.3390/su17052059
APA StyleSun, Y., Li, H., Guo, X., & Gao, C. (2025). Bridging the Green Space Divide: A Big Data-Driven Analysis of Park Accessibility Inequities in Chinese Megacities Using Enhanced 3SFCA Modeling. Sustainability, 17(5), 2059. https://doi.org/10.3390/su17052059