

Resilience Assessment Framework for High-Penetration Renewable Energy Power System


Abstract
1. Introduction
- (1)
- This study extends traditional power system modeling by incorporating the effects of renewable energy. It considers the complementary generation characteristics of different power sources, and cascading failure from the randomness of renewable energy is studied based on complex network theory. A new resilience curve is proposed based on this model.
- (2)
- A resilience evaluation index system for renewable energy power systems is developed based on the largest cluster size, power flow entropy, and loss in power flow. Two attack modes of random disaster and deliberate disaster are introduced, offering a comprehensive framework for assessing system resilience and providing key insights into its robustness.
- (3)
- A key node identification method is developed based on the centrality index. Simulations are conducted to analyze system resilience under different renewable energy operation scenarios and different attack modes. This study examines the effects of attack timing, penetration levels, and integration locations of renewable energy, providing valuable guidance for the safe and stable operation of renewable energy power systems.
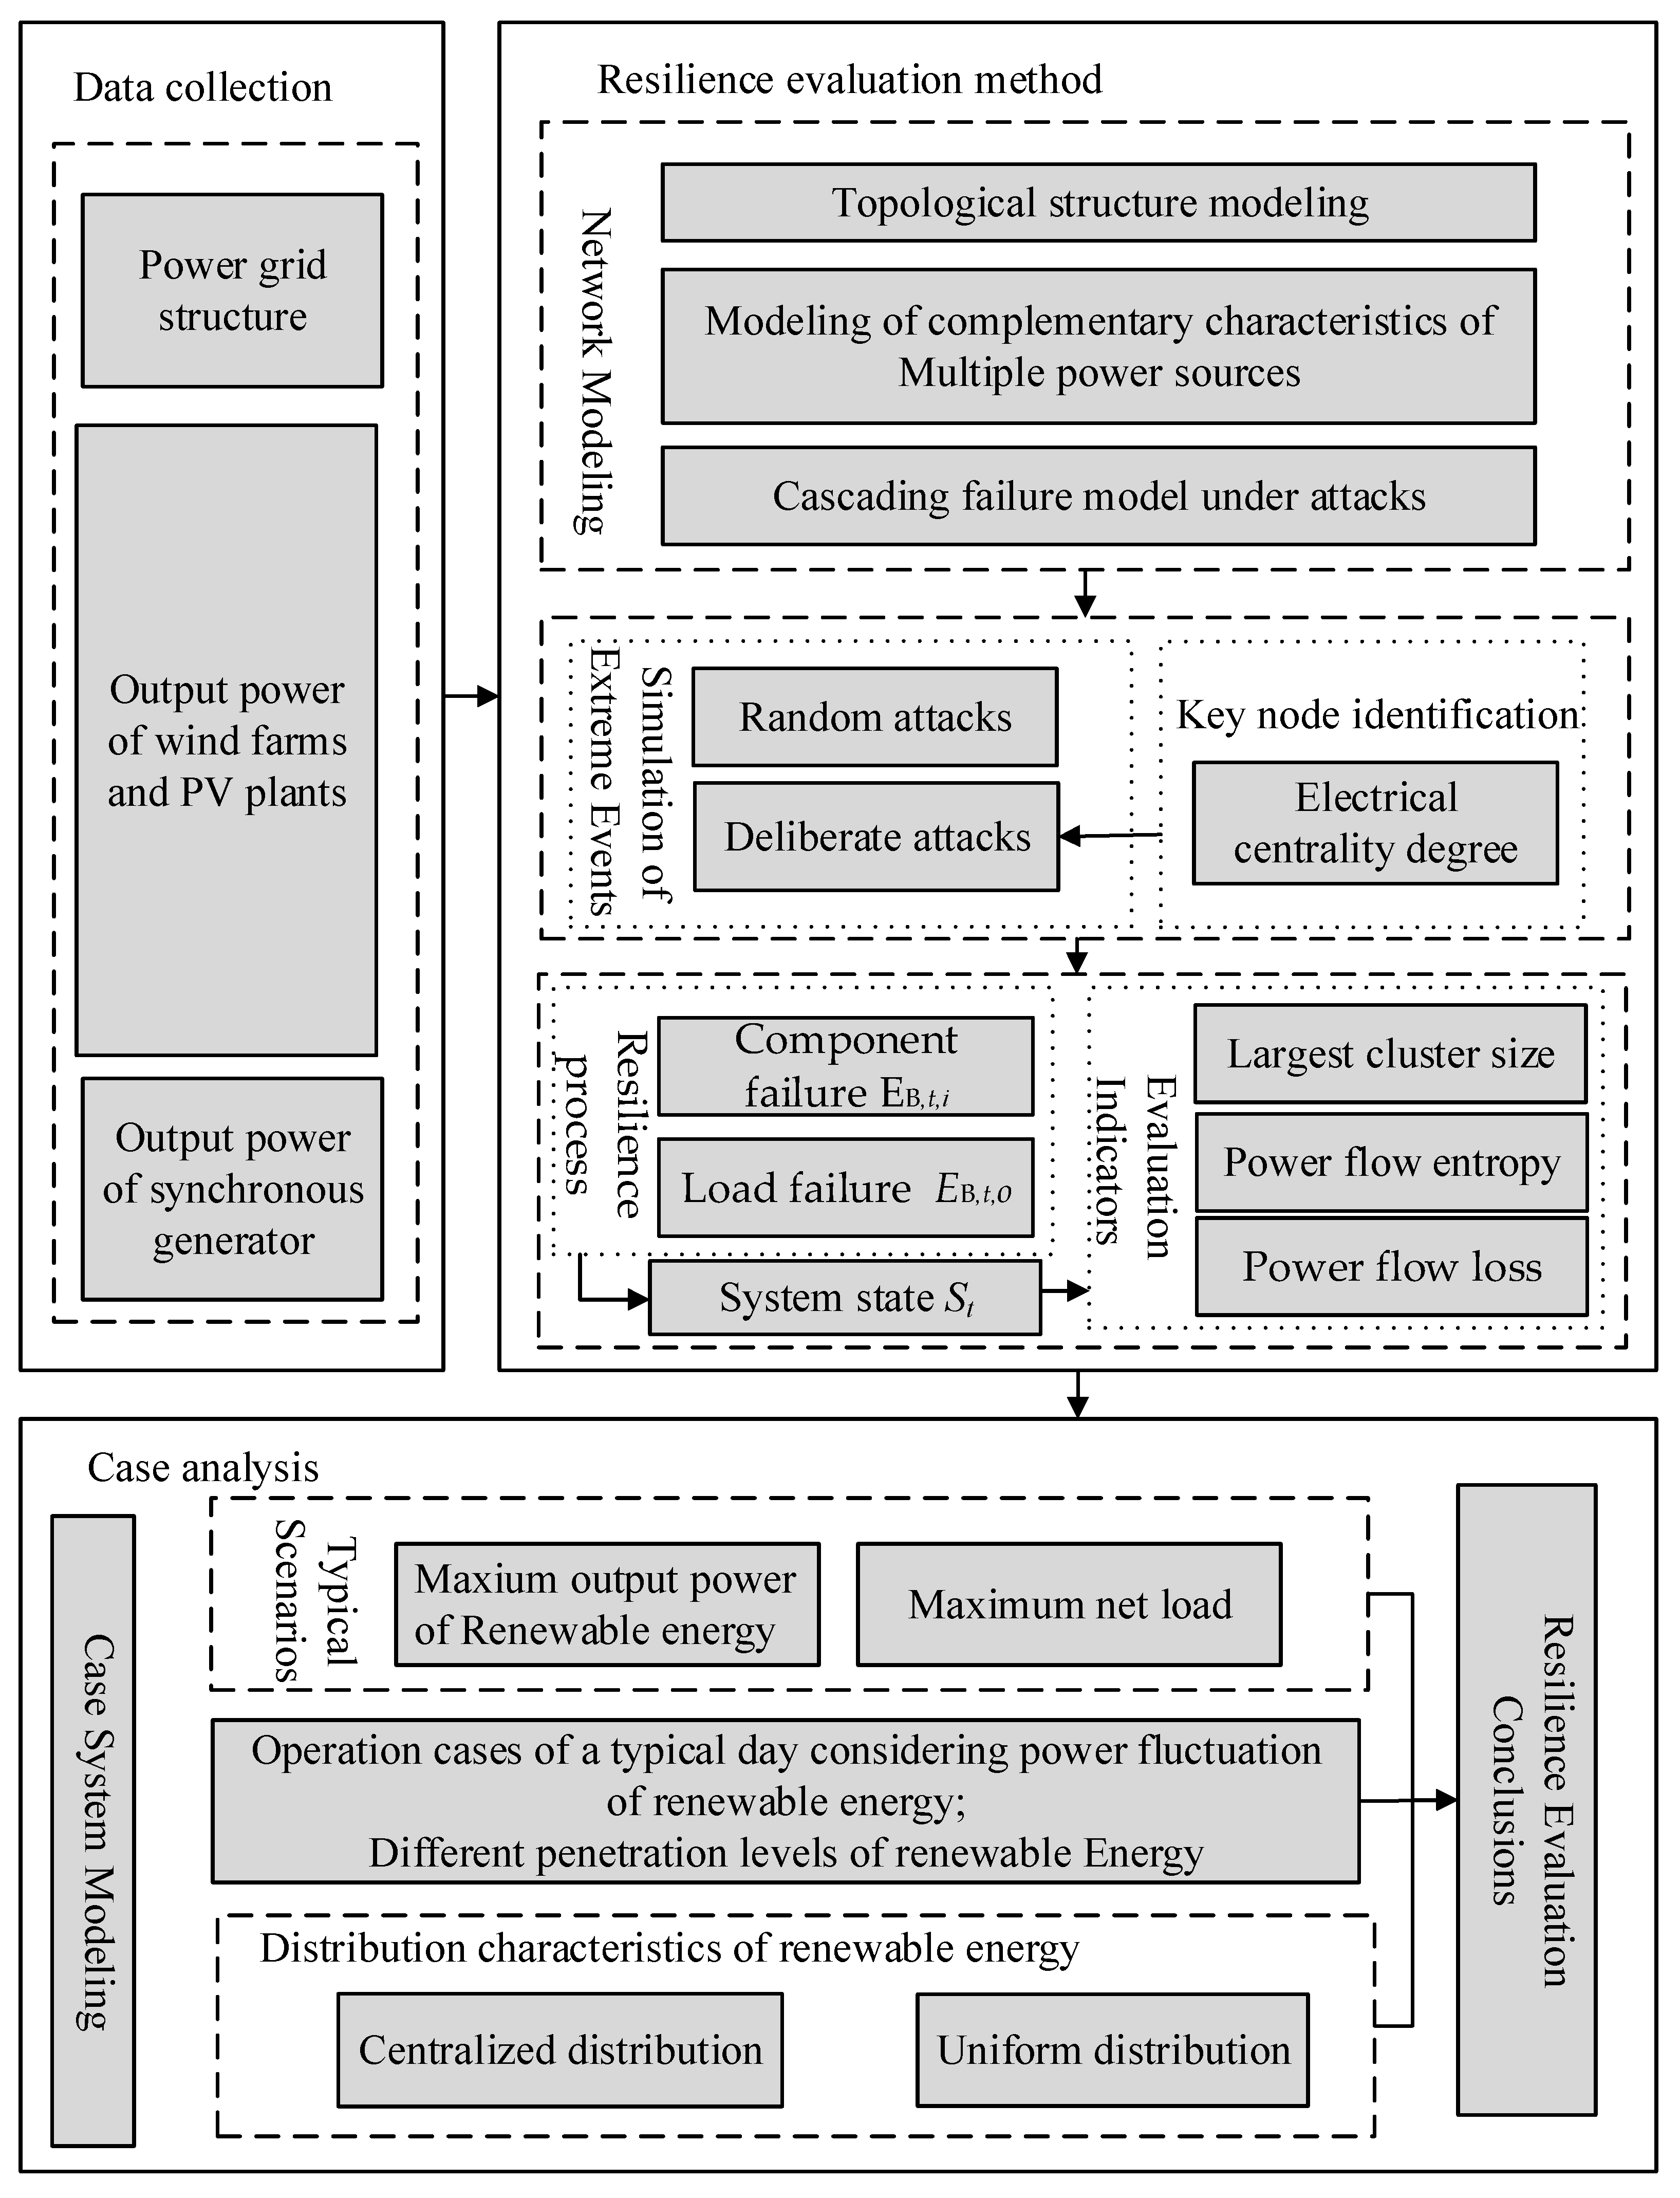
2. Resilience Evaluation Framework and Network Modeling
2.1. Infrastructure and Operational Resilience Indexes
2.2. Resilience Curve Based on Multi-Energy Complementary Characteristics
2.3. Resilience Evaluation Framework
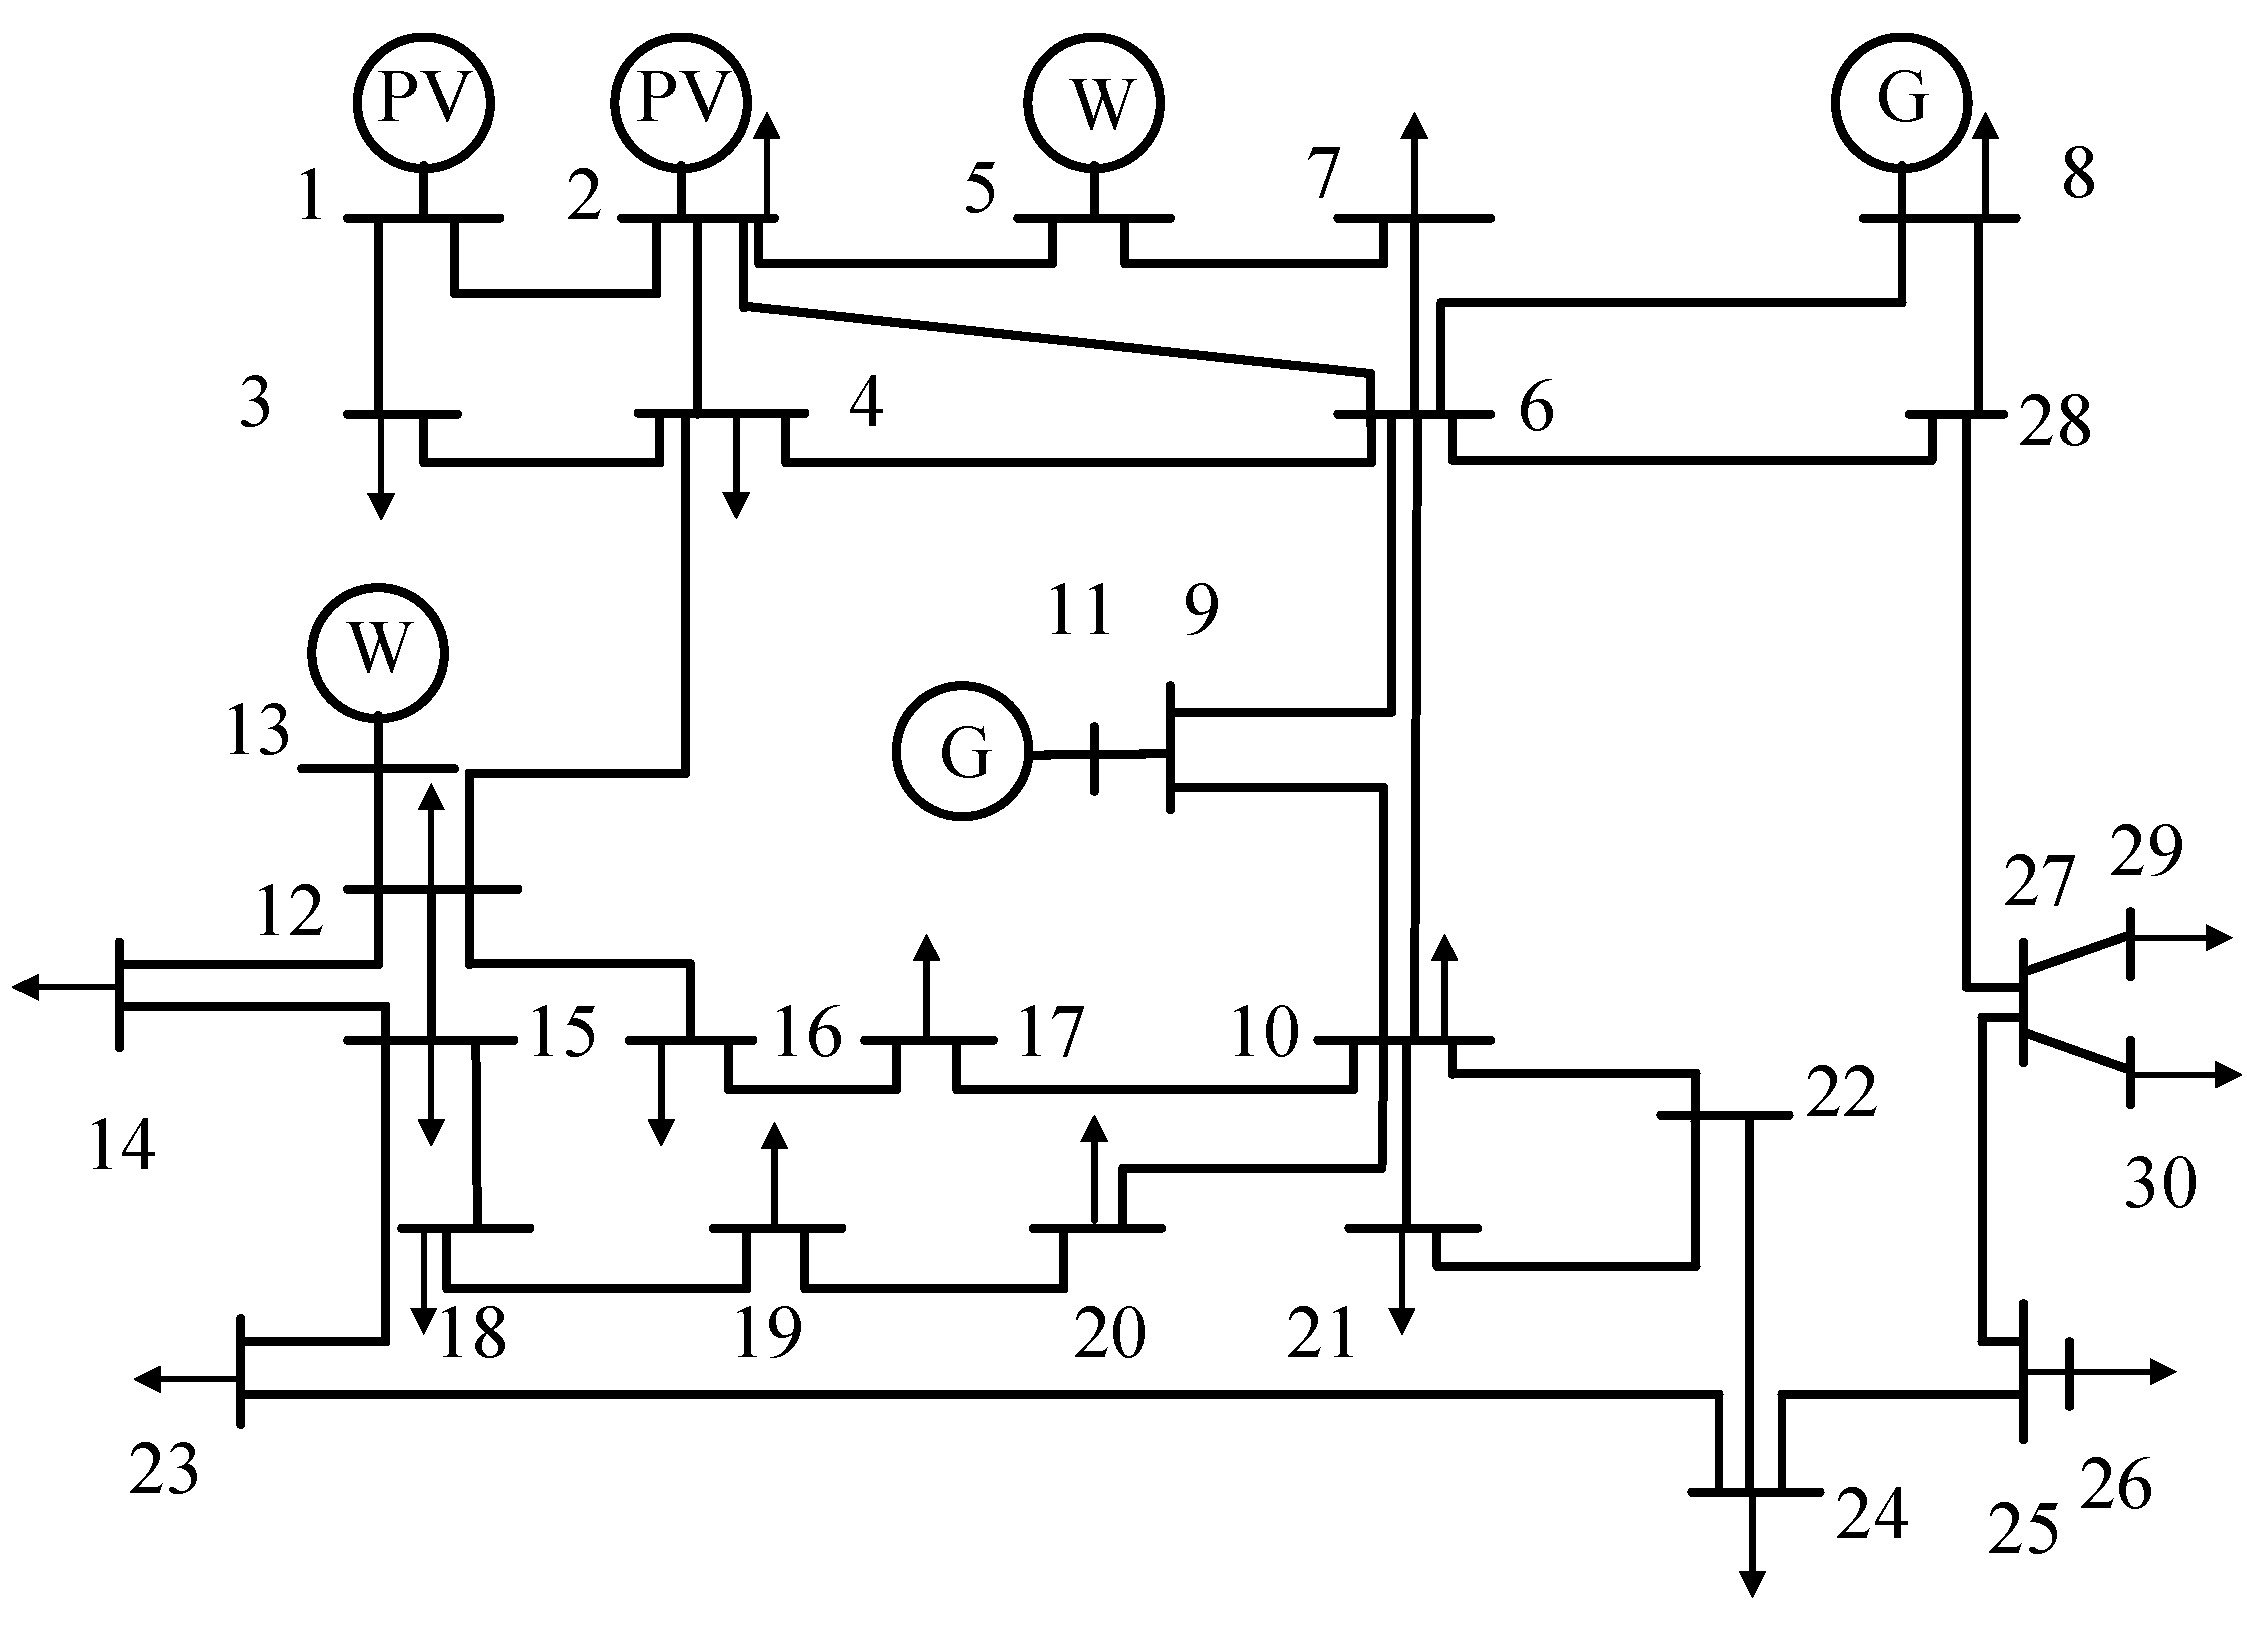
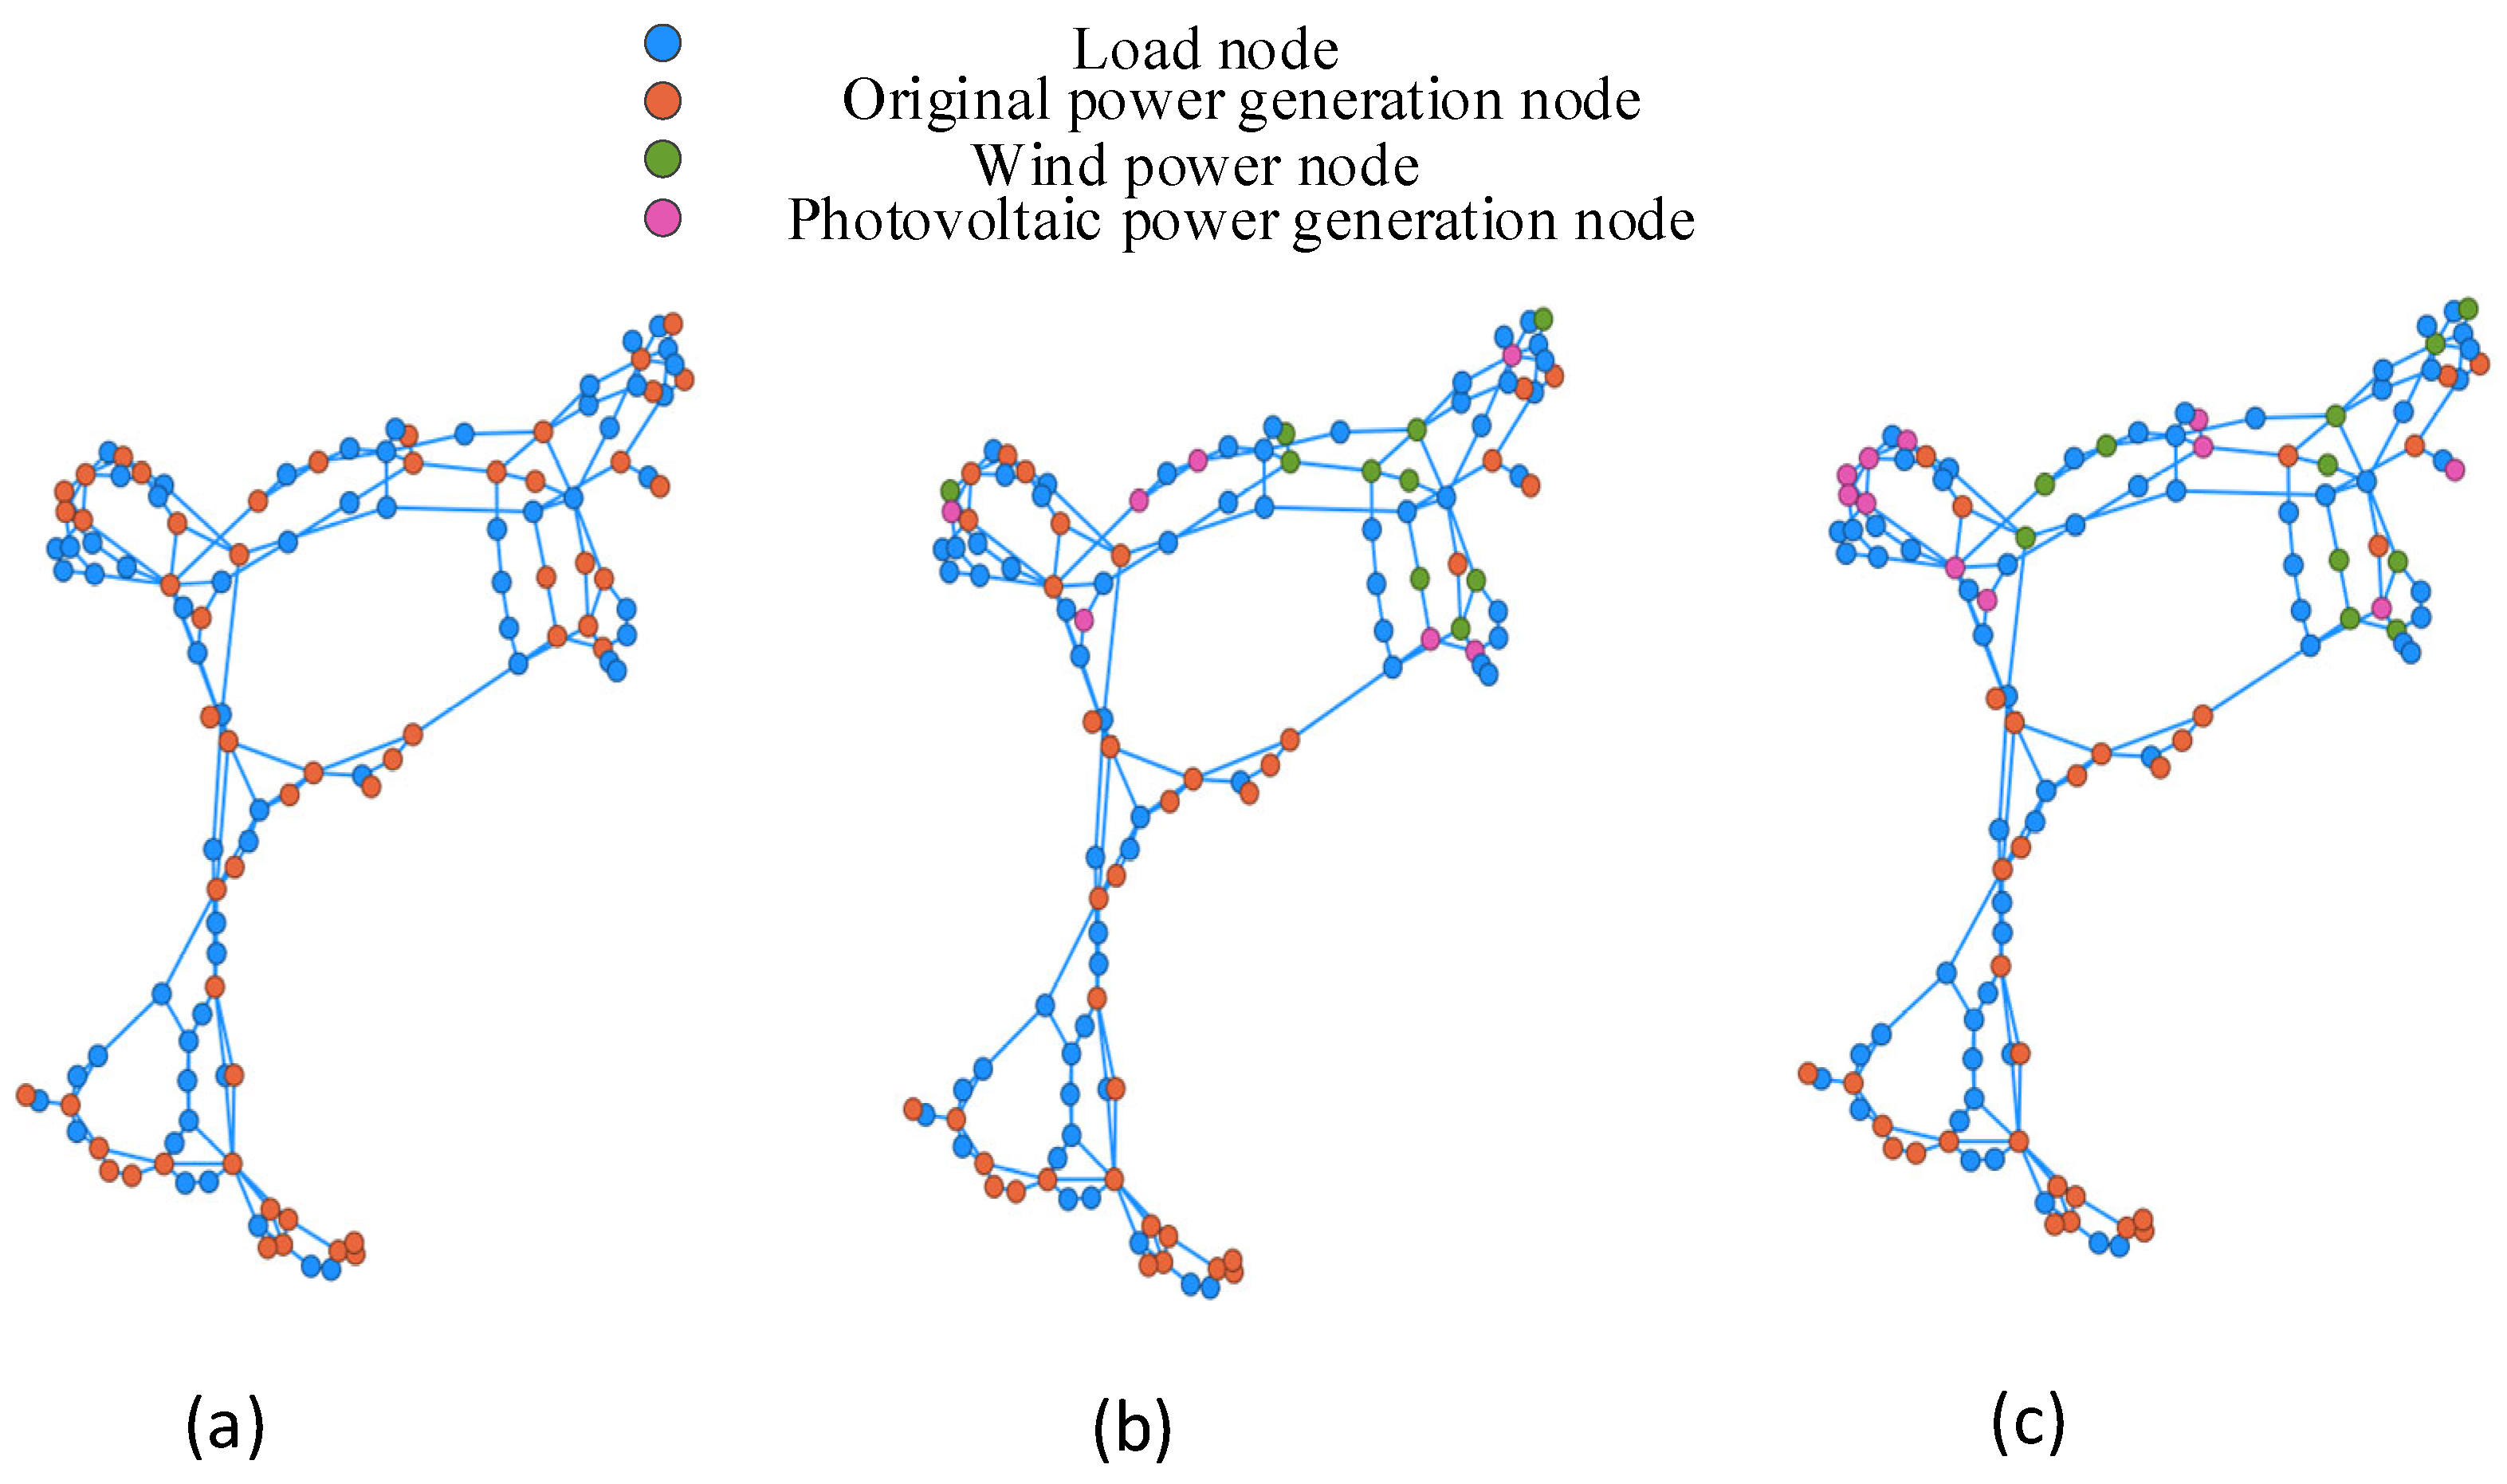
2.4. Graphical Modeling of Power Systems
2.5. Multi-Energy Complementary Characteristics
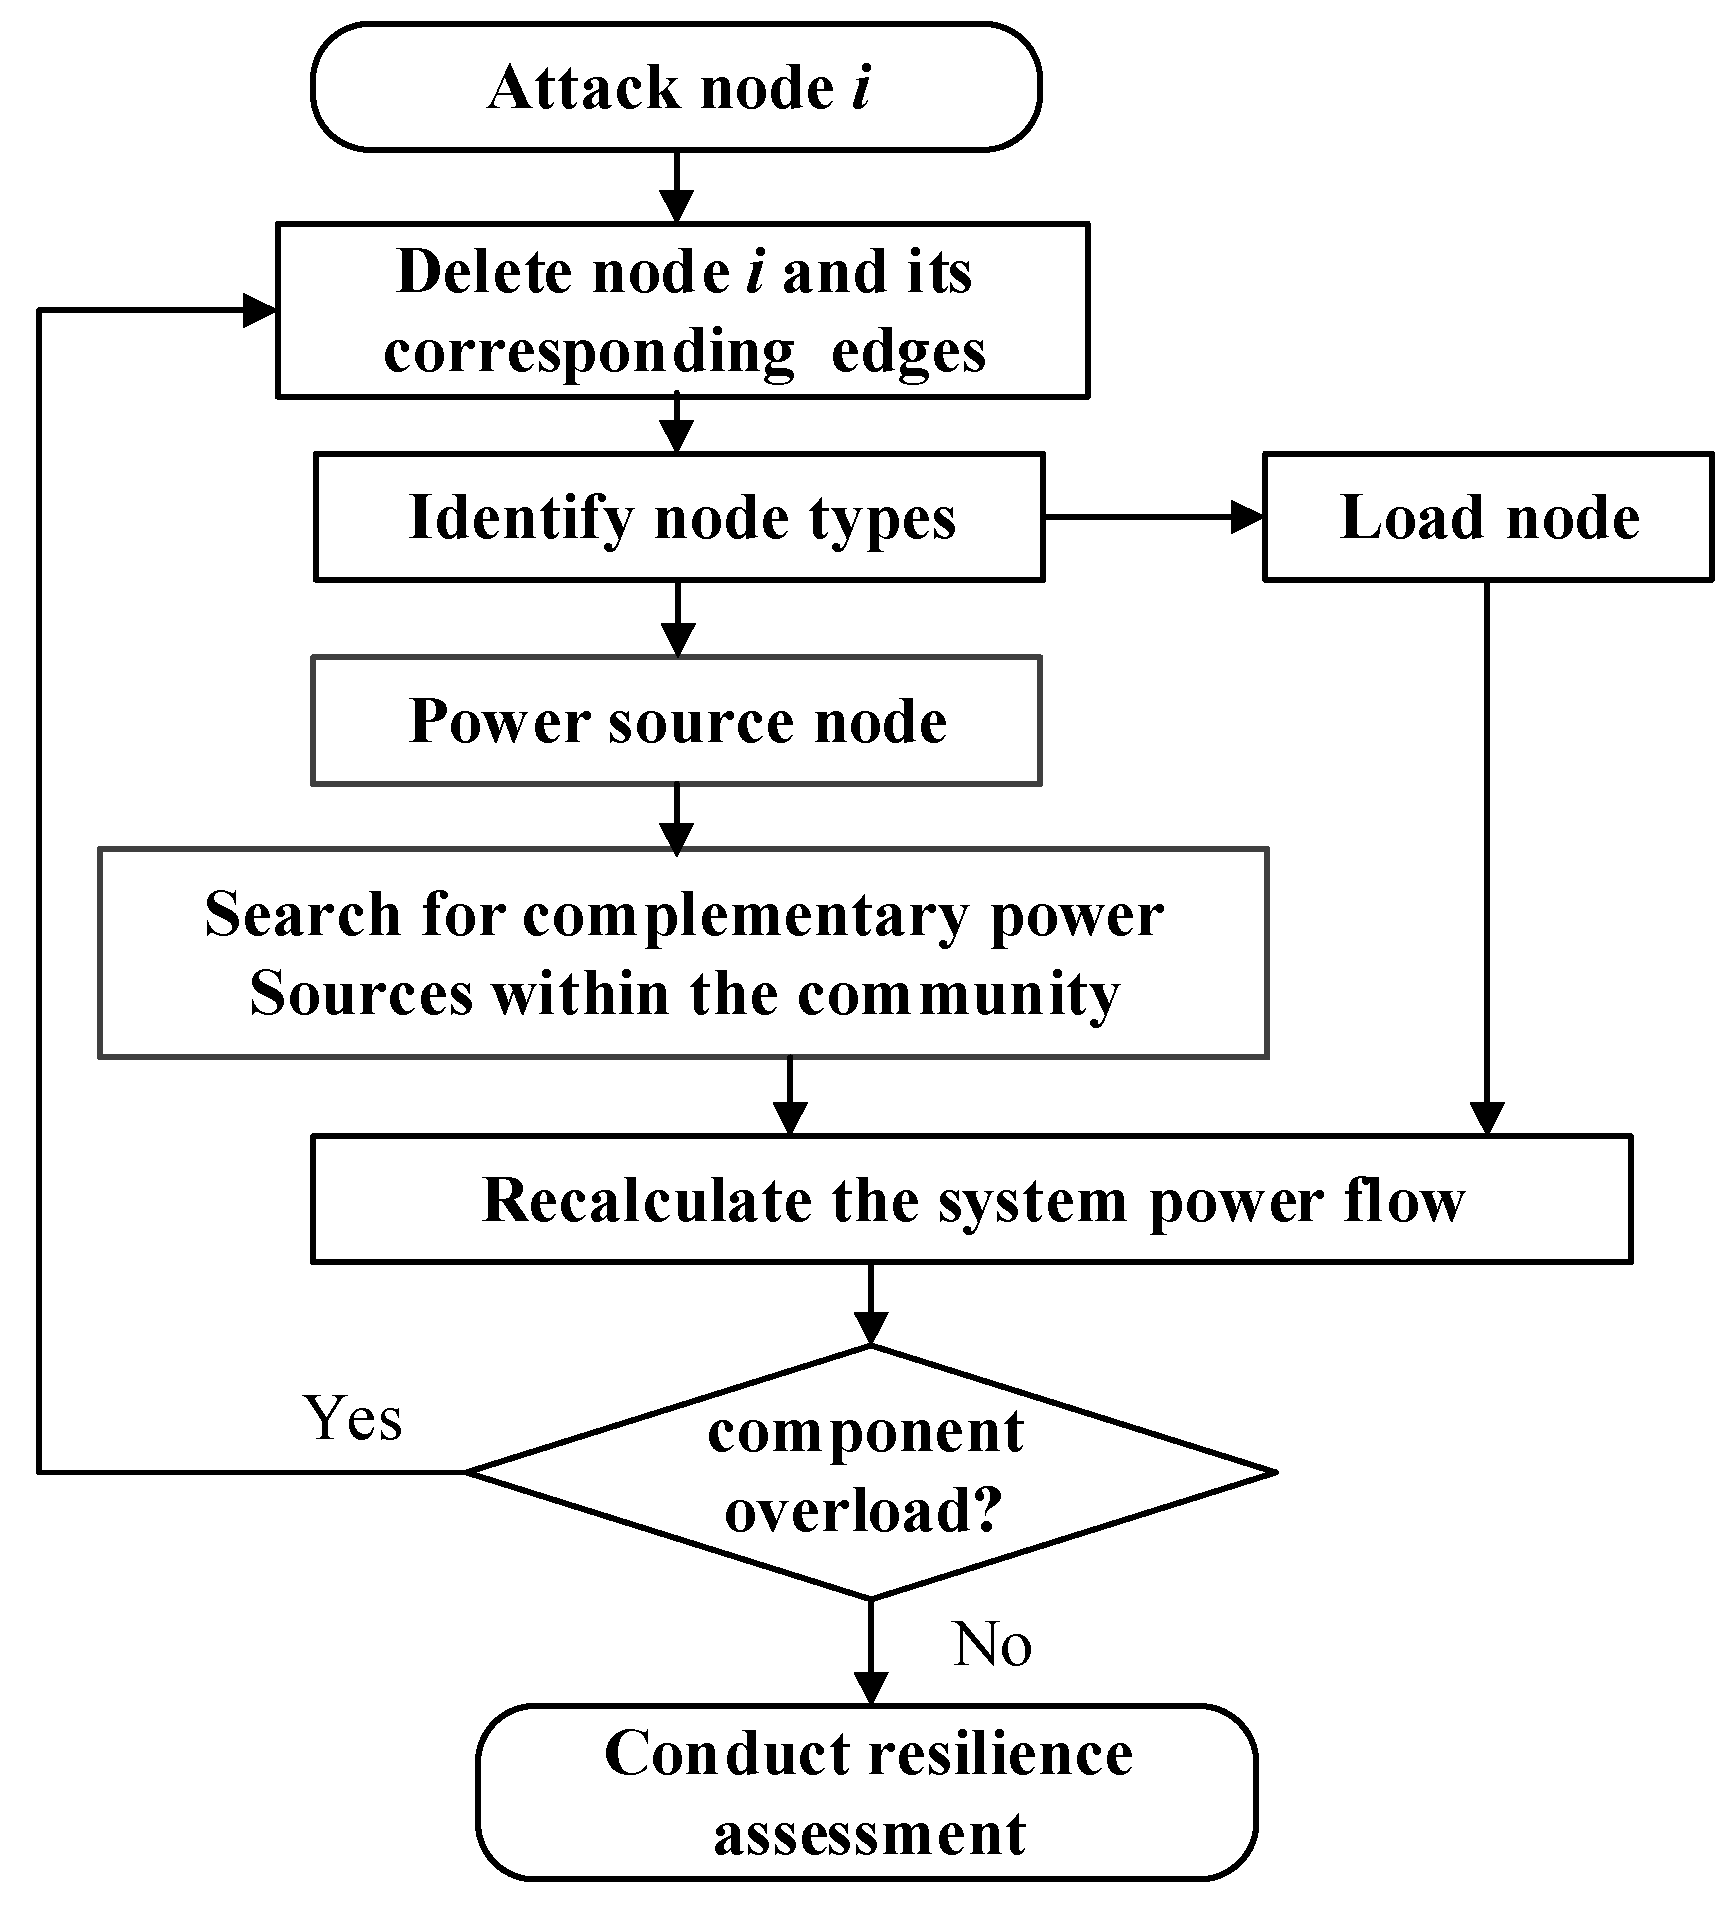
2.6. Cascading Failure Process
- Step 1: Determine the attacked node i, and confirm the type of node.
- Step 2:
- a.
- If node i is a load node, remove the node and its connected edges.
- b.
- If node i is a synchronous generator node, remove the node and its connected edges, and then, under the constraints of Formulas (5) and (6), search for the remaining synchronous generators at the same time to provide complementary power within their limits.
- c.
- If node i is a renewable energy node, remove the node and its connected edges. Under the constraints of Formulas (5) and (6), the synchronous generators will provide complementary generation within their limits.
- Step 3: Recalculate the system’s power flow. If the fault causes a transmission line to exceed its capacity, cascading failures are triggered.
- Step 4: The overloaded transmission line will be tripped off, and the power flow will be recalculated. This process will continue until there are no more overloaded components in the system.
3. Resilience Evaluation Indicators and Disaster Simulation
3.1. Resilience Evaluation Indicators
- (1)
- Largest Cluster Size (LCS)
- (2)
- Power Flow Entropy (PFE)
- (3)
- Loss in Power Flow (LP)
3.2. Attack Simulation
3.2.1. Key Nodes Based on Electrical Degree Centrality
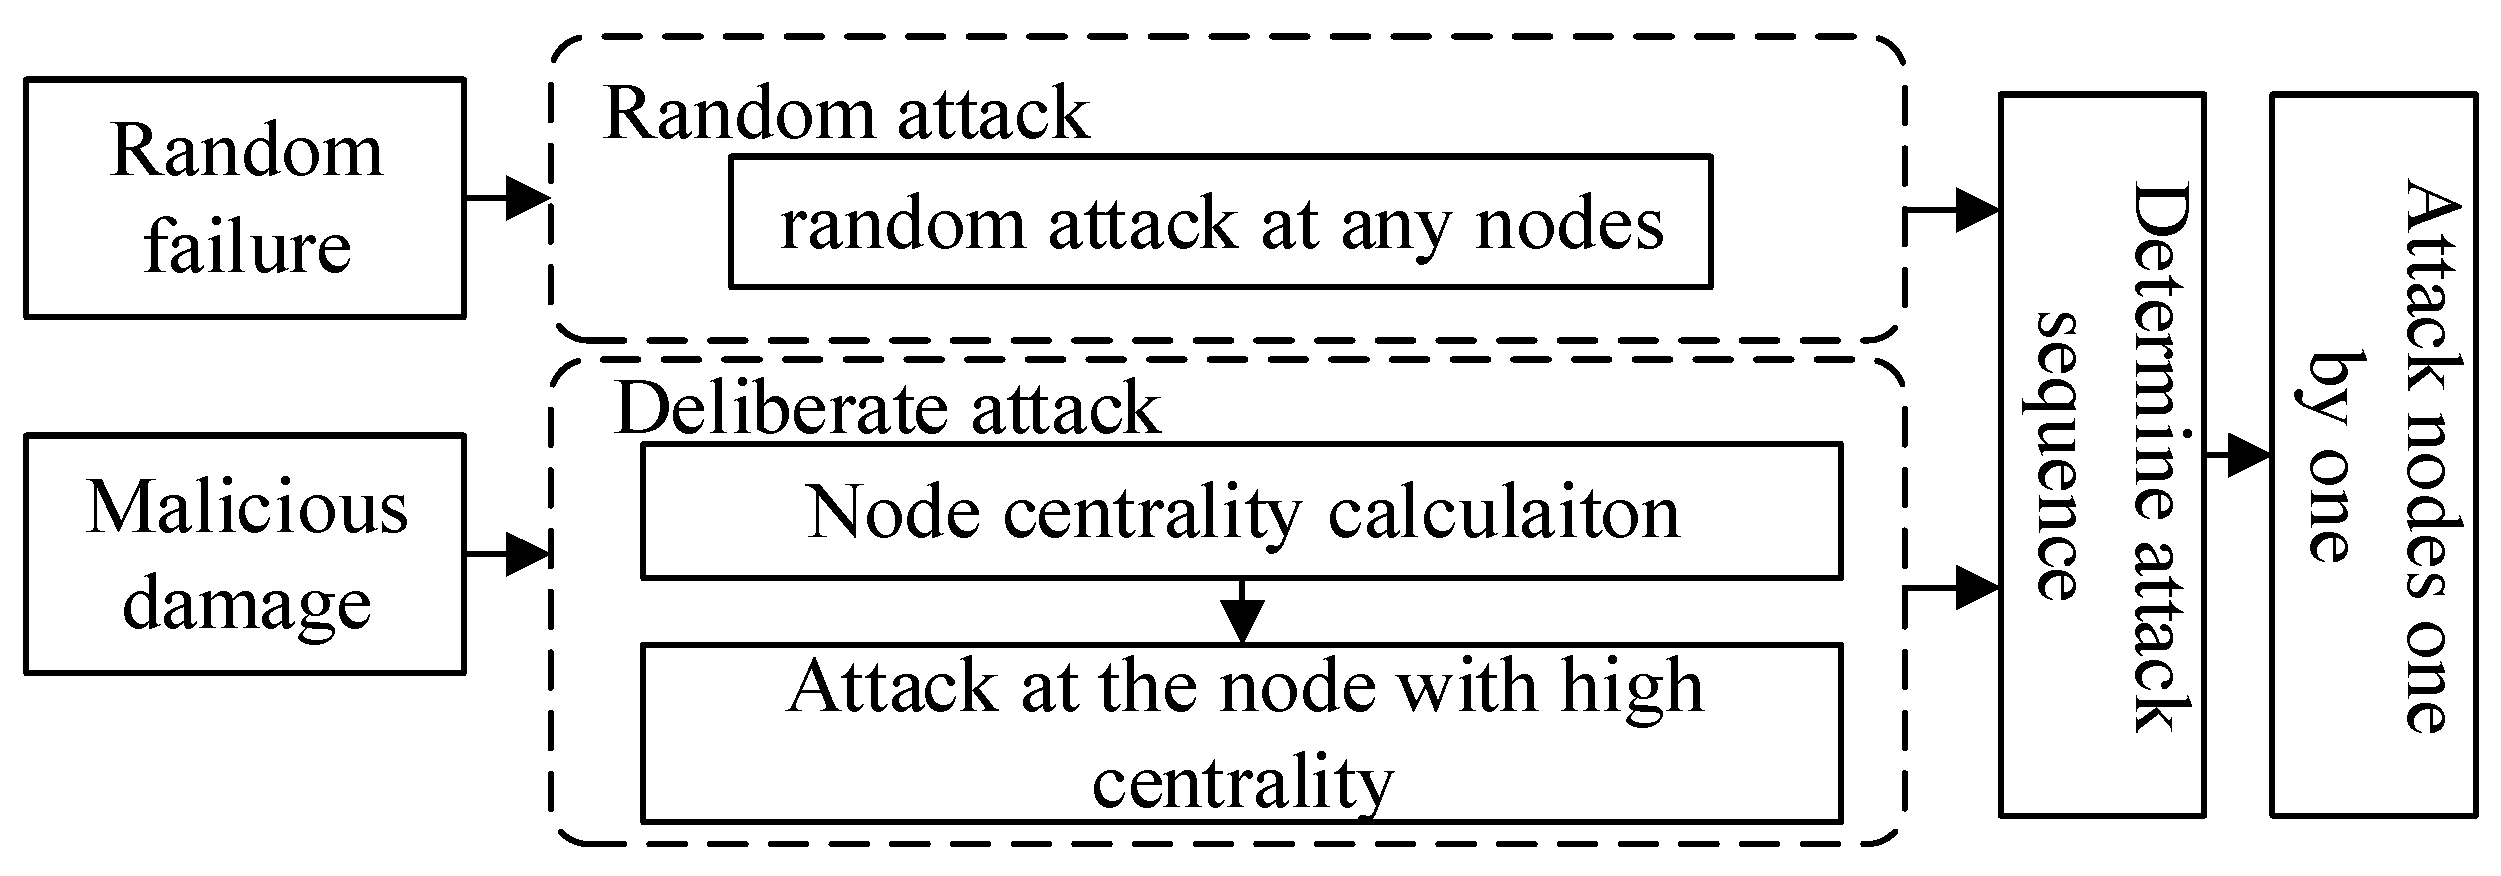
3.2.2. Attack Mode
- Random Attack: A random attack may happen at any node of the system.
- Deliberate Attack: Key nodes with high electrical degree centrality or high load will be attacked deliberately, and the system’s resilience is then evaluated based on the attack.
4. Case Analysis
4.1. Case Study
4.2. Resilience Curves
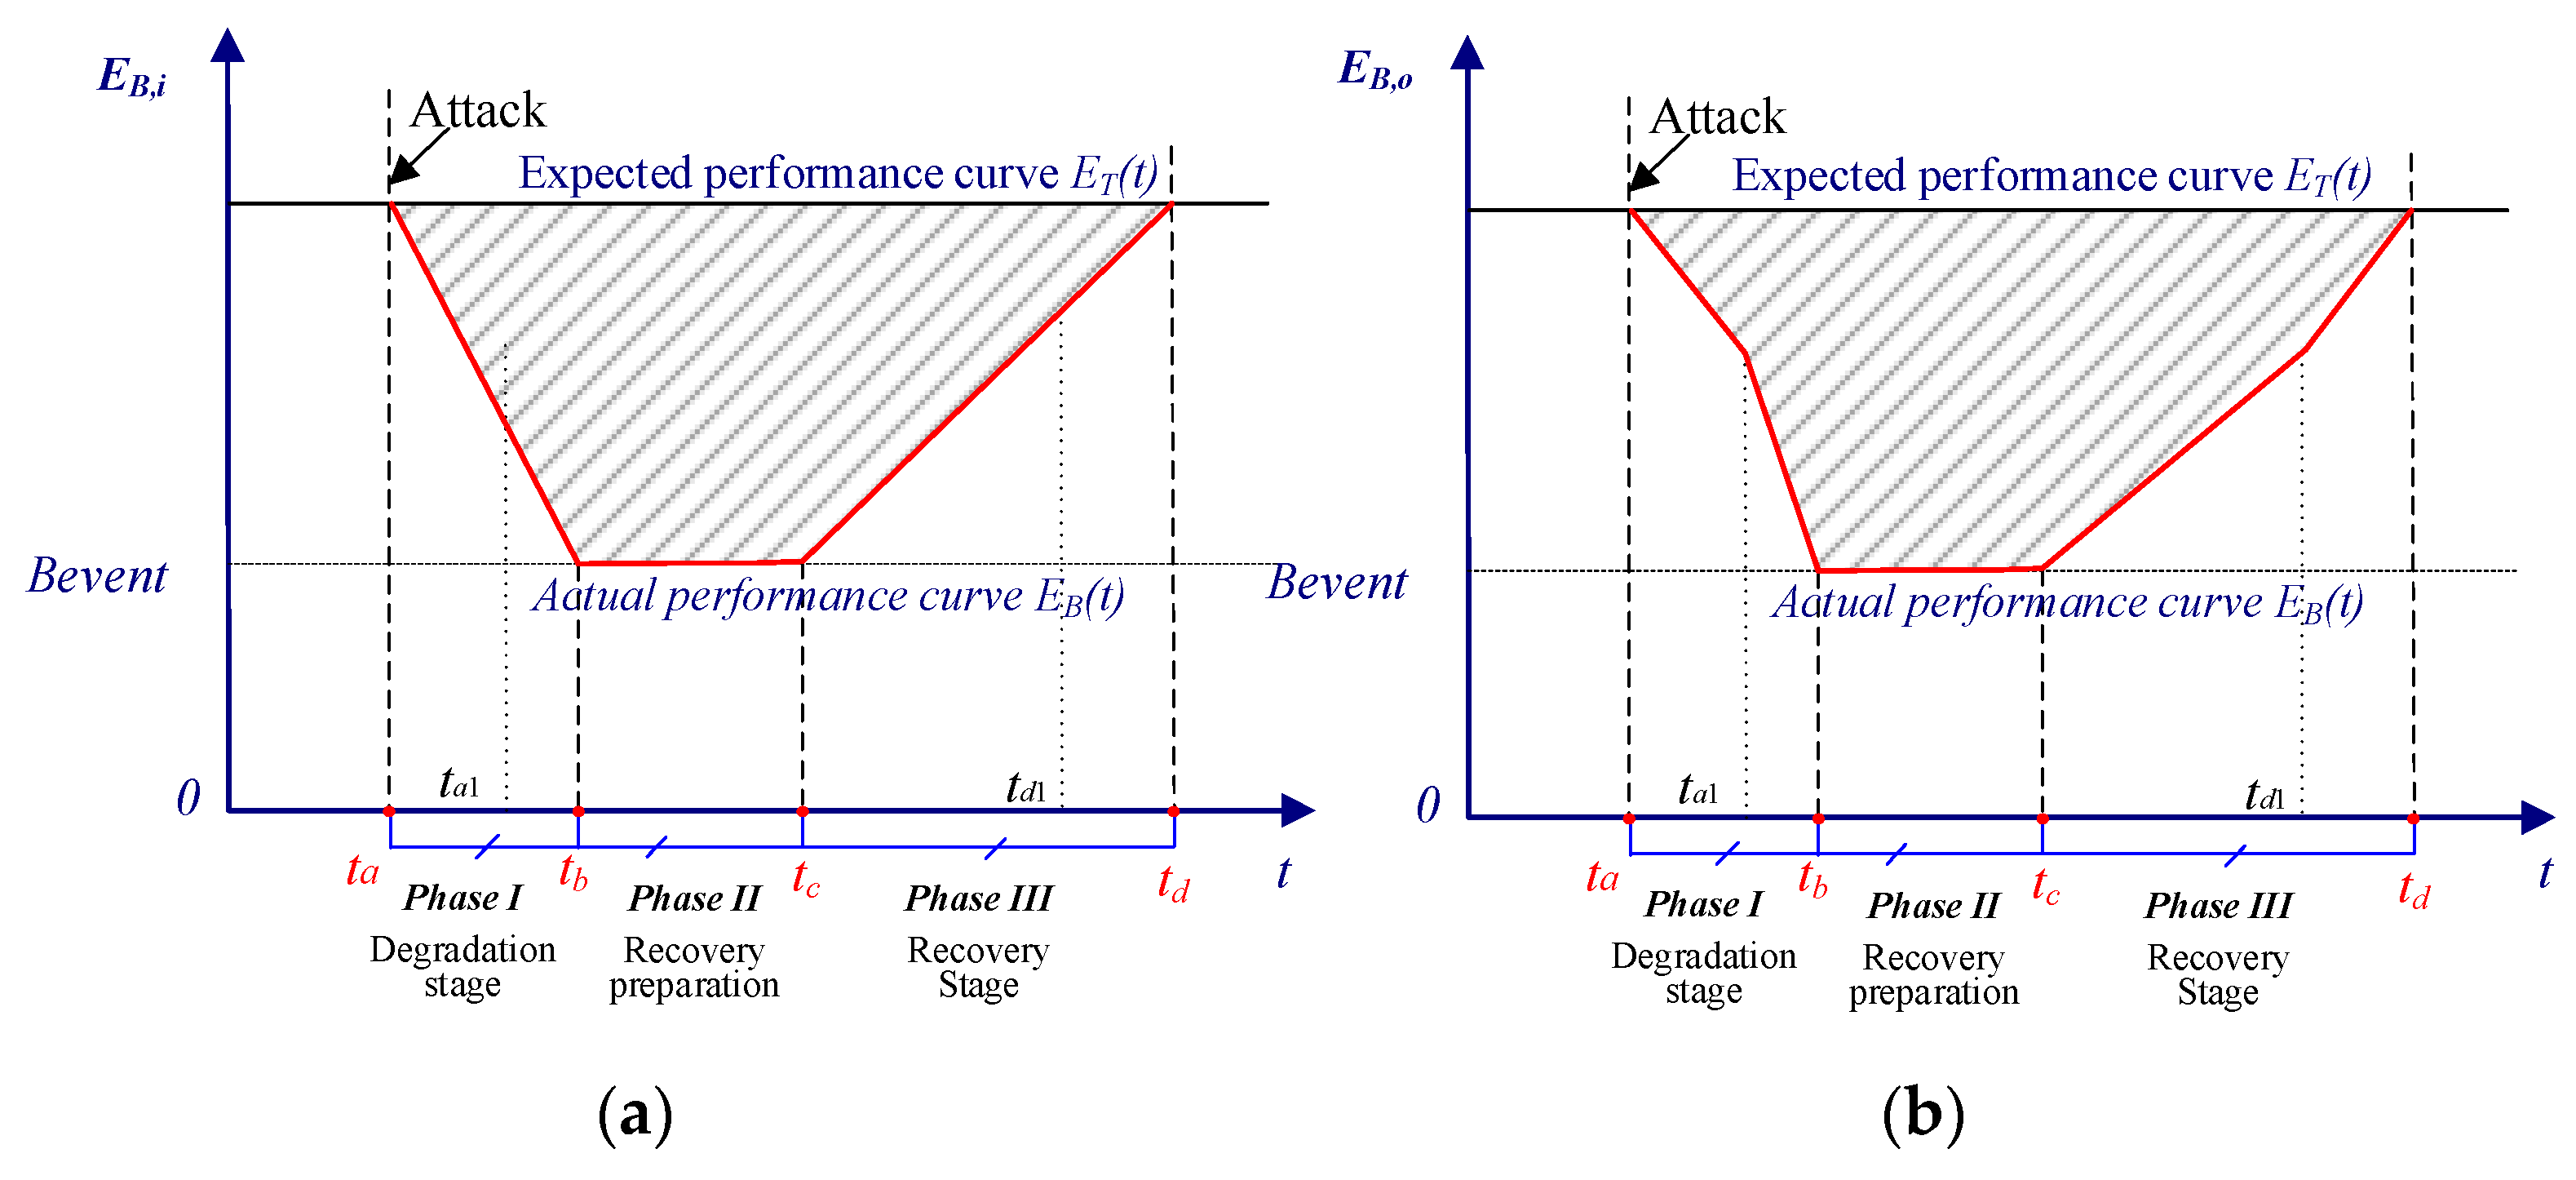
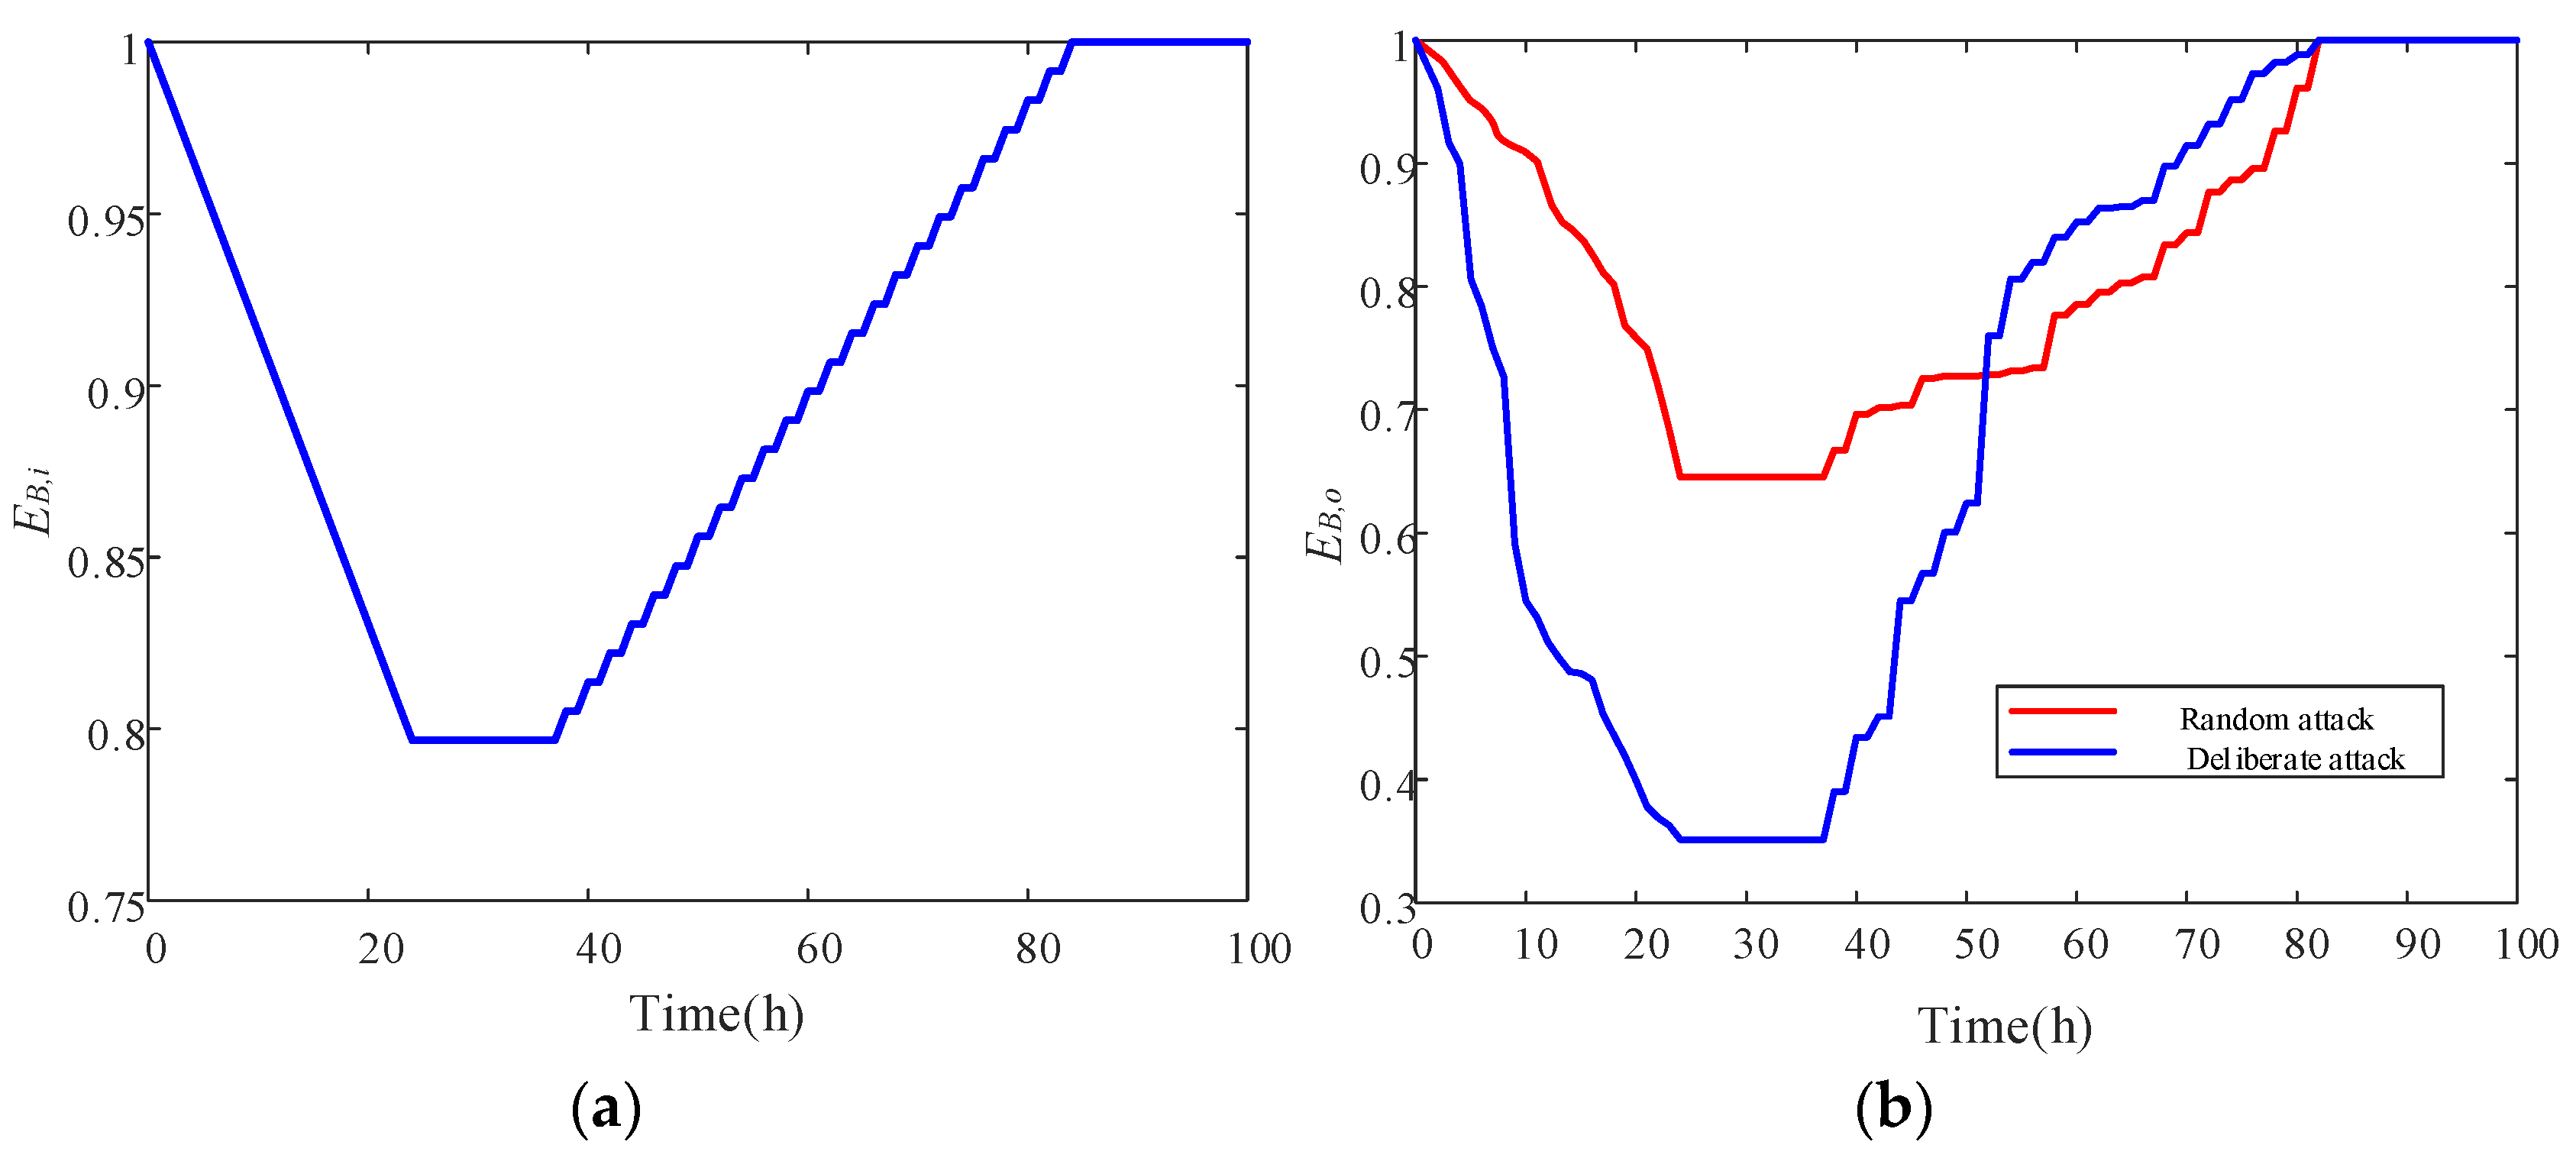
- (1)
- Resilience curves of EB,i and EB,o exhibit typical polygonal characteristics. In both scenarios, the resilience curves of EB,i and EB,o show three distinct phases: the degradation stage, recovery preparation stage, and recovery stage.
- (2)
- The functional resilience indicator EB,o is much lower than the infrastructure resilience indicator EB,i, indicating that the system’s degradation rate and recovery rate are different from different evaluation perspectives. Therefore, infrastructure indicators and functional indicators need to be considered simultaneously.
- (3)
- The infrastructure resilience EB,i is only influenced by the number of attacked nodes, resulting in identical curves under random attack and deliberate attack. The EB,o under deliberate attack is much lower than the one under random attack; this is because the most important node is selected to disrupt under deliberate attack. However, the recovery rate under deliberate attack is faster than the one under random attack, causing the two curves to cross during the recovery stage.
4.3. Impact of Attack Time
- (1)
- Attack at maximum power of renewable energy (11:30 a.m.)
- (1)
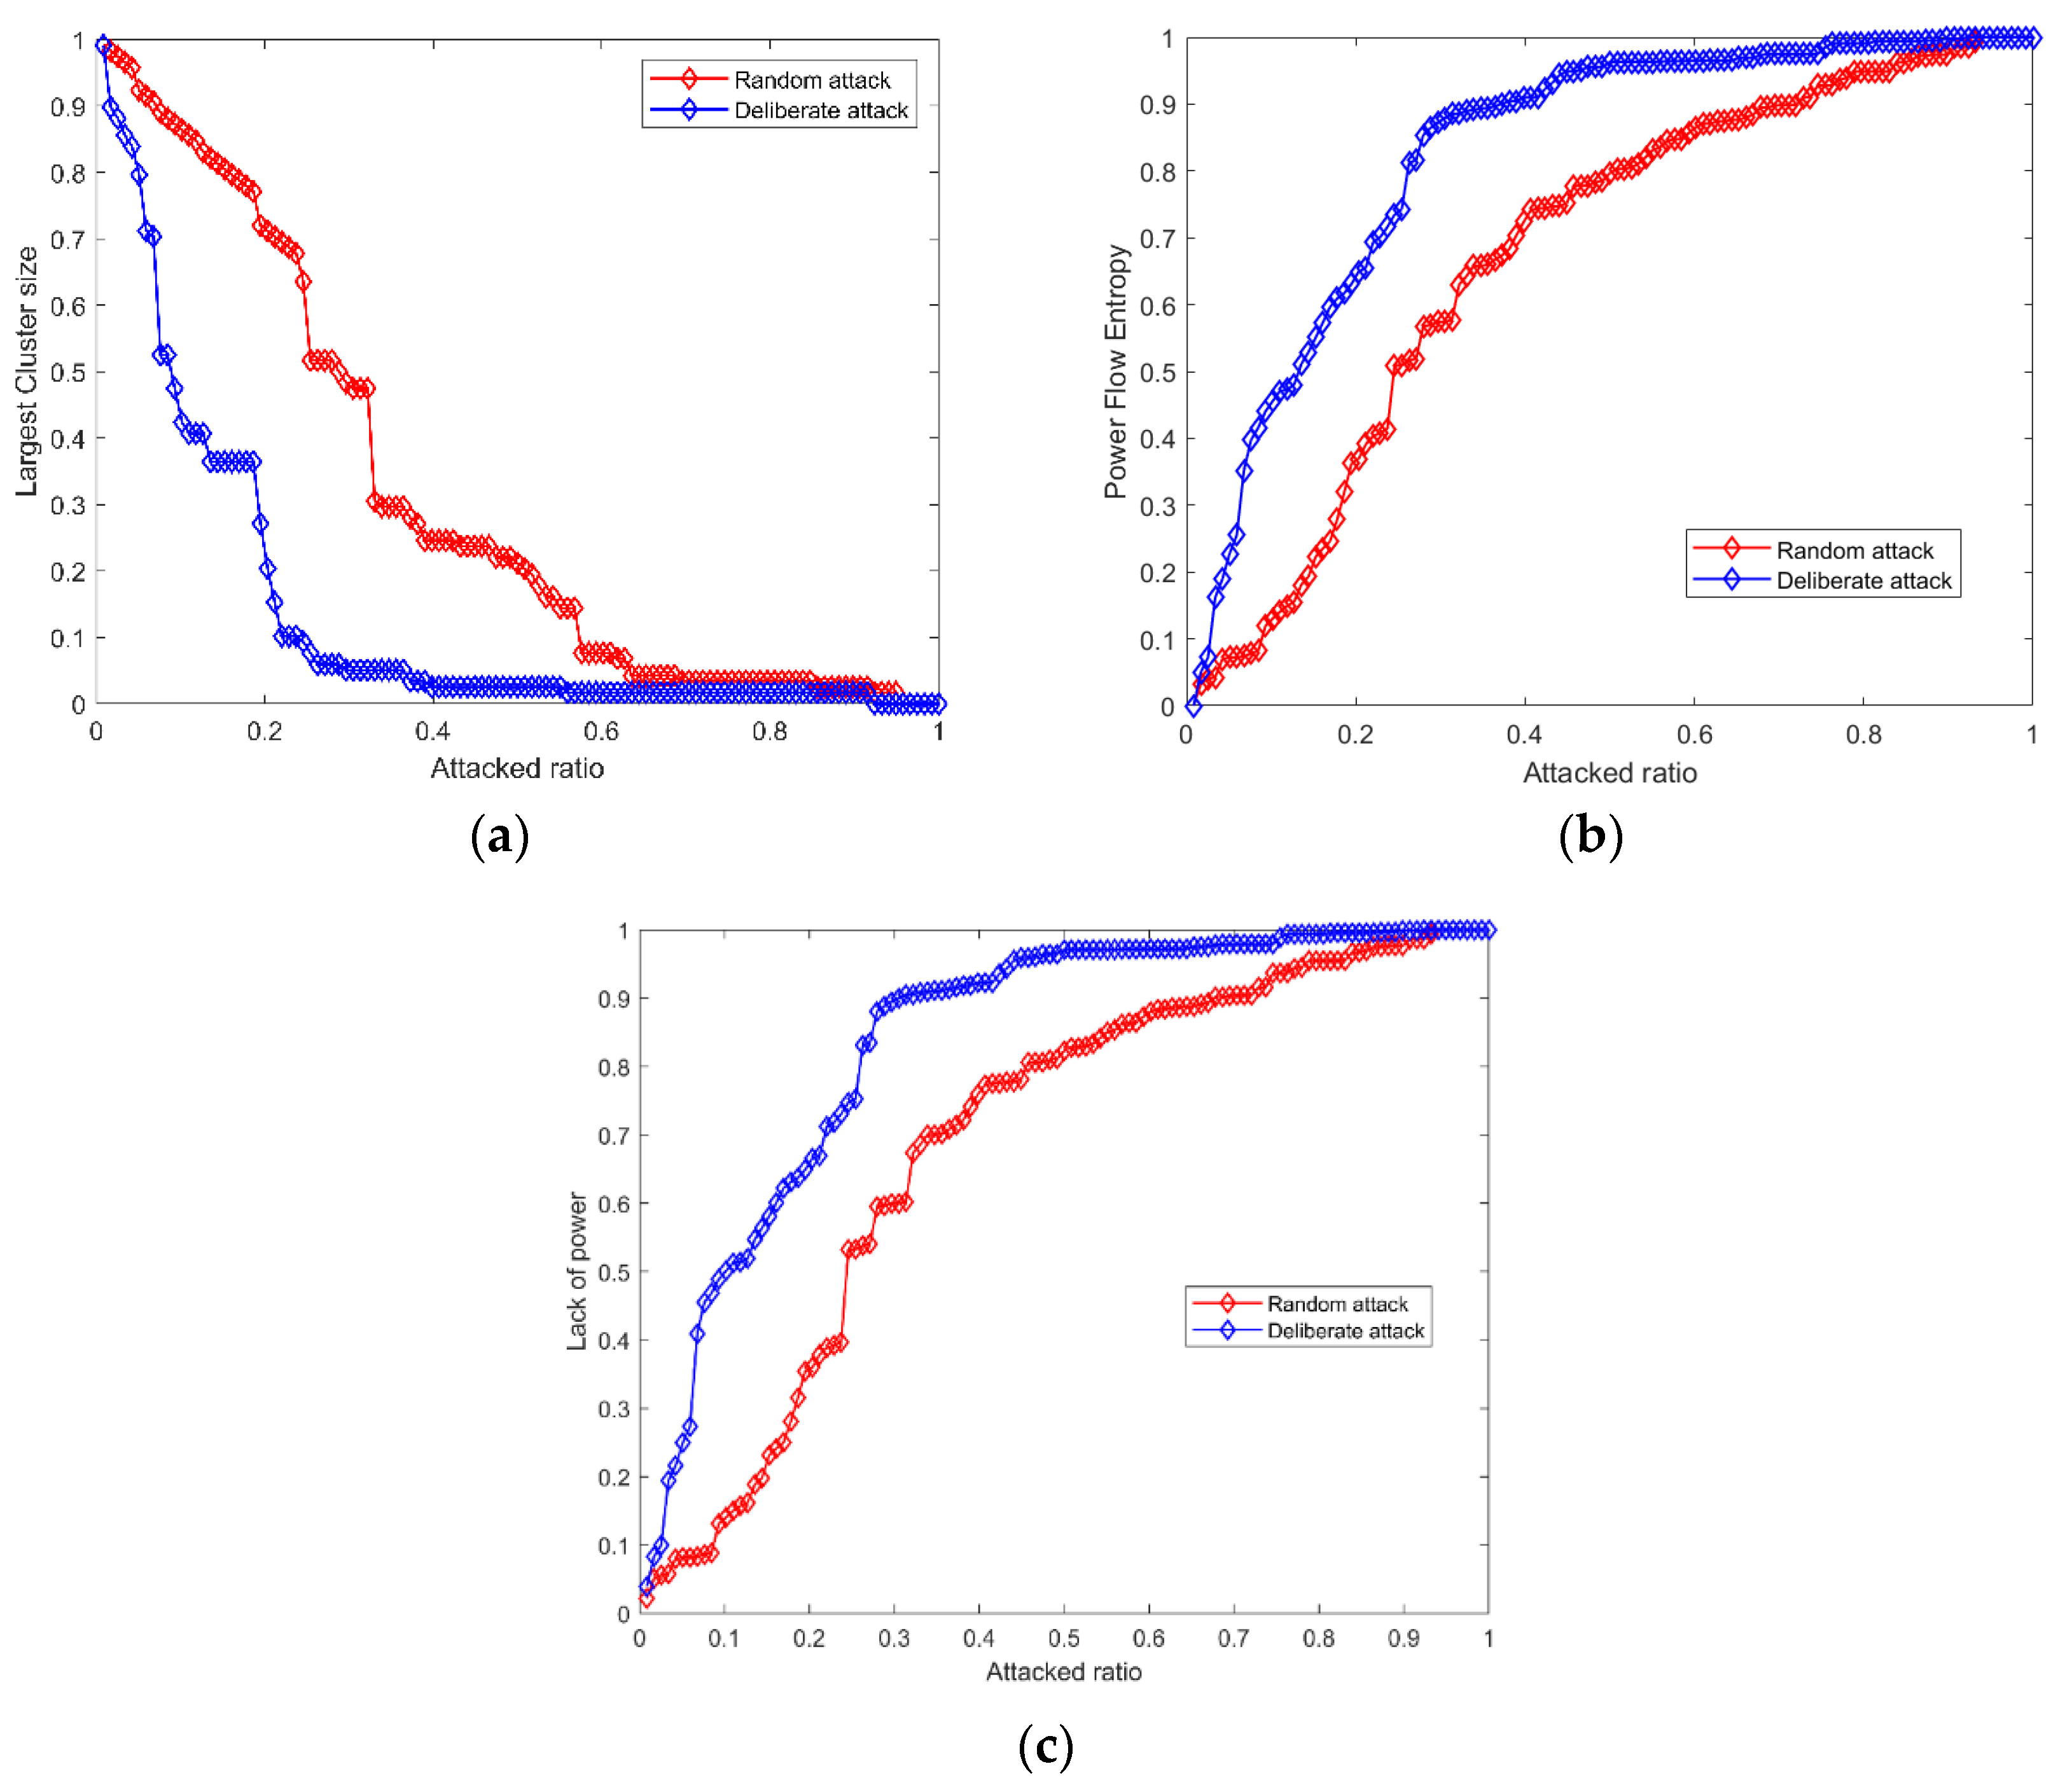
- The LCS index is smaller under a deliberate attack than that under a random attack. Specifically, under a random attack, the LCS index drops significantly if the attack ratio is larger than 0.23, and the system will collapse if the attack ratio is larger than 0.57. Under a deliberate attack, the LCS index drops sharply when the attack ratio is larger than 0.05, and the system may crash when the attack ratio is larger than 0.24.
- (2)
- The PFE index is smaller under a deliberate attack than that under a random attack. Specifically, under a random attack, the PFE index drops at a high speed if the attack ratio is larger than 0.23; after that, the index will decrease continuously at a slow rate, and the system may collapse when the attack ratio is larger than 0.68. This is because, after a certain proportion of nodes are removed, the structure of the system changes, and may form a new sub-community. As the attack continues, the index will decrease sharply, resulting in system collapse. However, under a deliberate attack, the system will collapse if the attack ratio is larger than 0.37 owing to the continuous selective attack on important nodes.
- (3)
- The LP index is larger under a deliberate attack than that under a random attack. The system will collapse if the attack ratio is larger than 0.22 and 0.07, respectively, under a random attack and deliberate attack.
- (2)
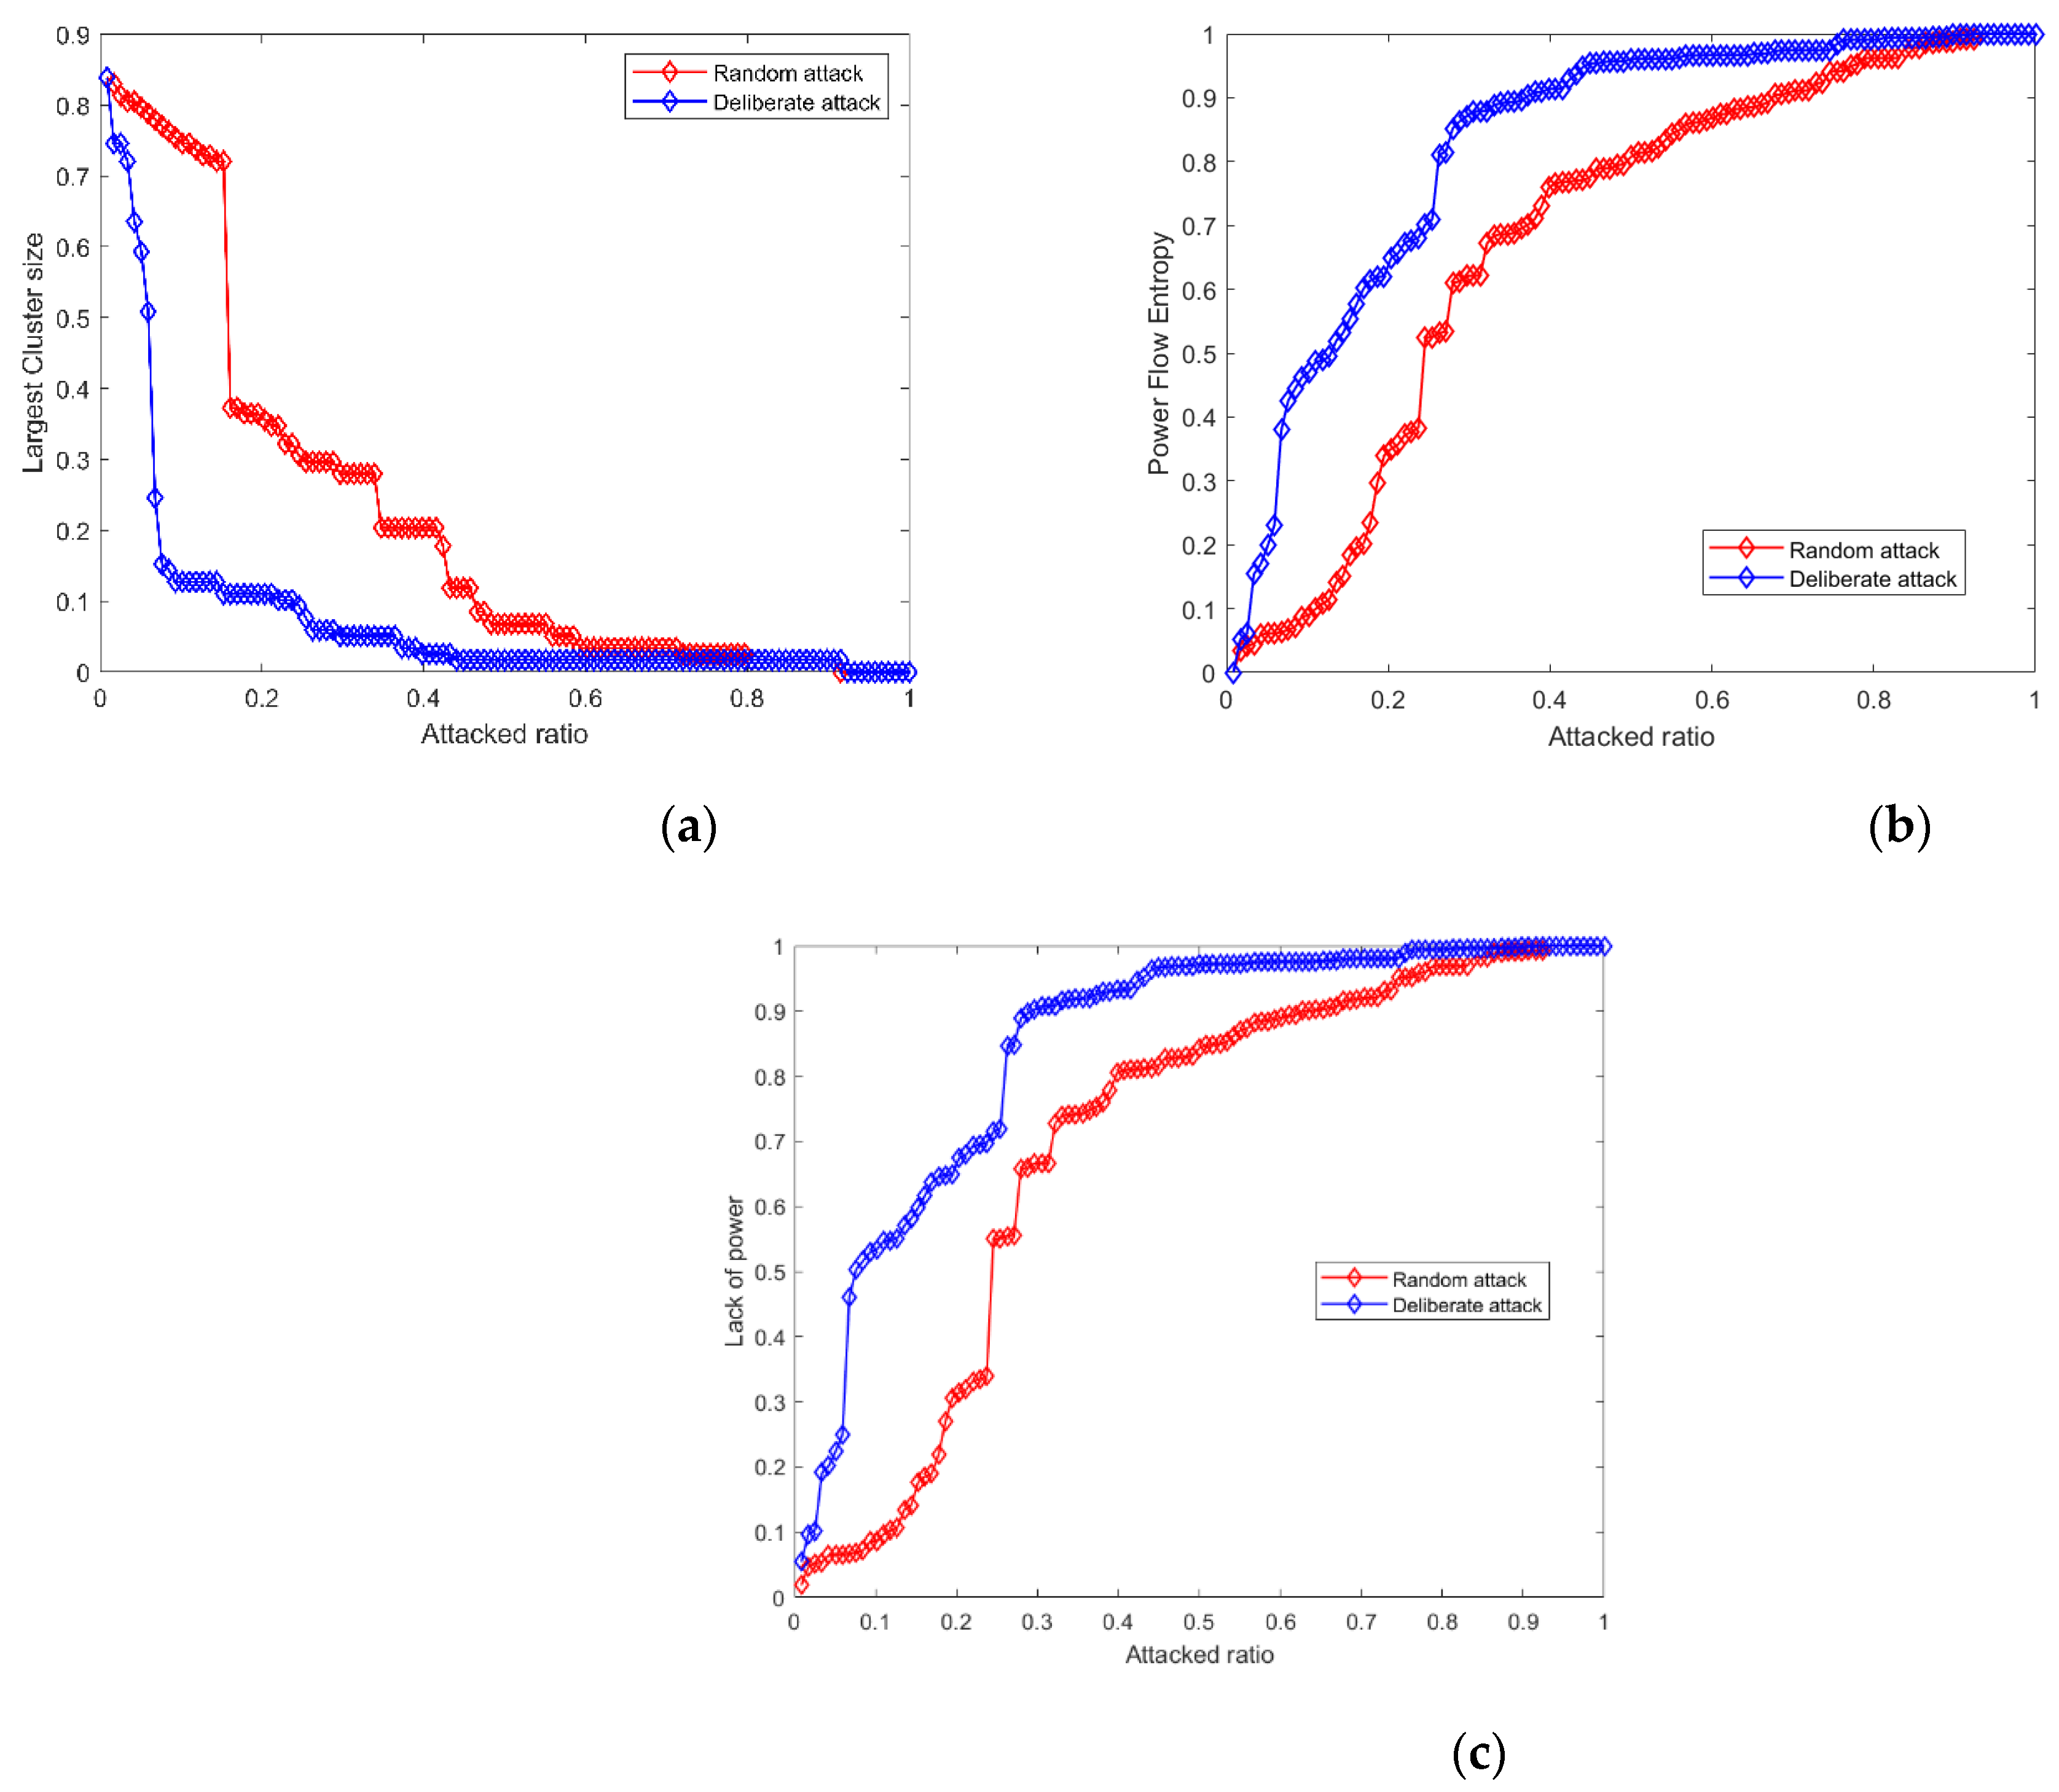
- Attack at peak load (21:00 p.m.)
- (1)
- The initial value of BLCS is 0.84, which is affected by the proportion of renewable energy. Under a random attack, a sharp drop occurs when the attack ratio is larger than 0.15, and the system will completely crash when the attack ratio is larger than 0.45. In the case of a deliberate attack, the system starts to break down over a wide range from the beginning of the attack, and the system will lose its function when the attack ratio is larger than 0.23.
- (2)
- Under a random attack, the PFE index value drops obviously when the attack ratio is larger than 0.17, and the system will collapse when the attack ratio is larger than 0.66. However, under a deliberate attack, the survivability of the system reaches the limit when the attack ratio is equal to 0.37; the attack will lead to cascading failures, which will affect the function of the entire system.
- (3)
- The LP resilience curves are shown in Figure 10c. When faced with a random attack and a deliberate attack, the system will reach its operation limit when the attack ratio is equal to 0.24 and 0.06, respectively.
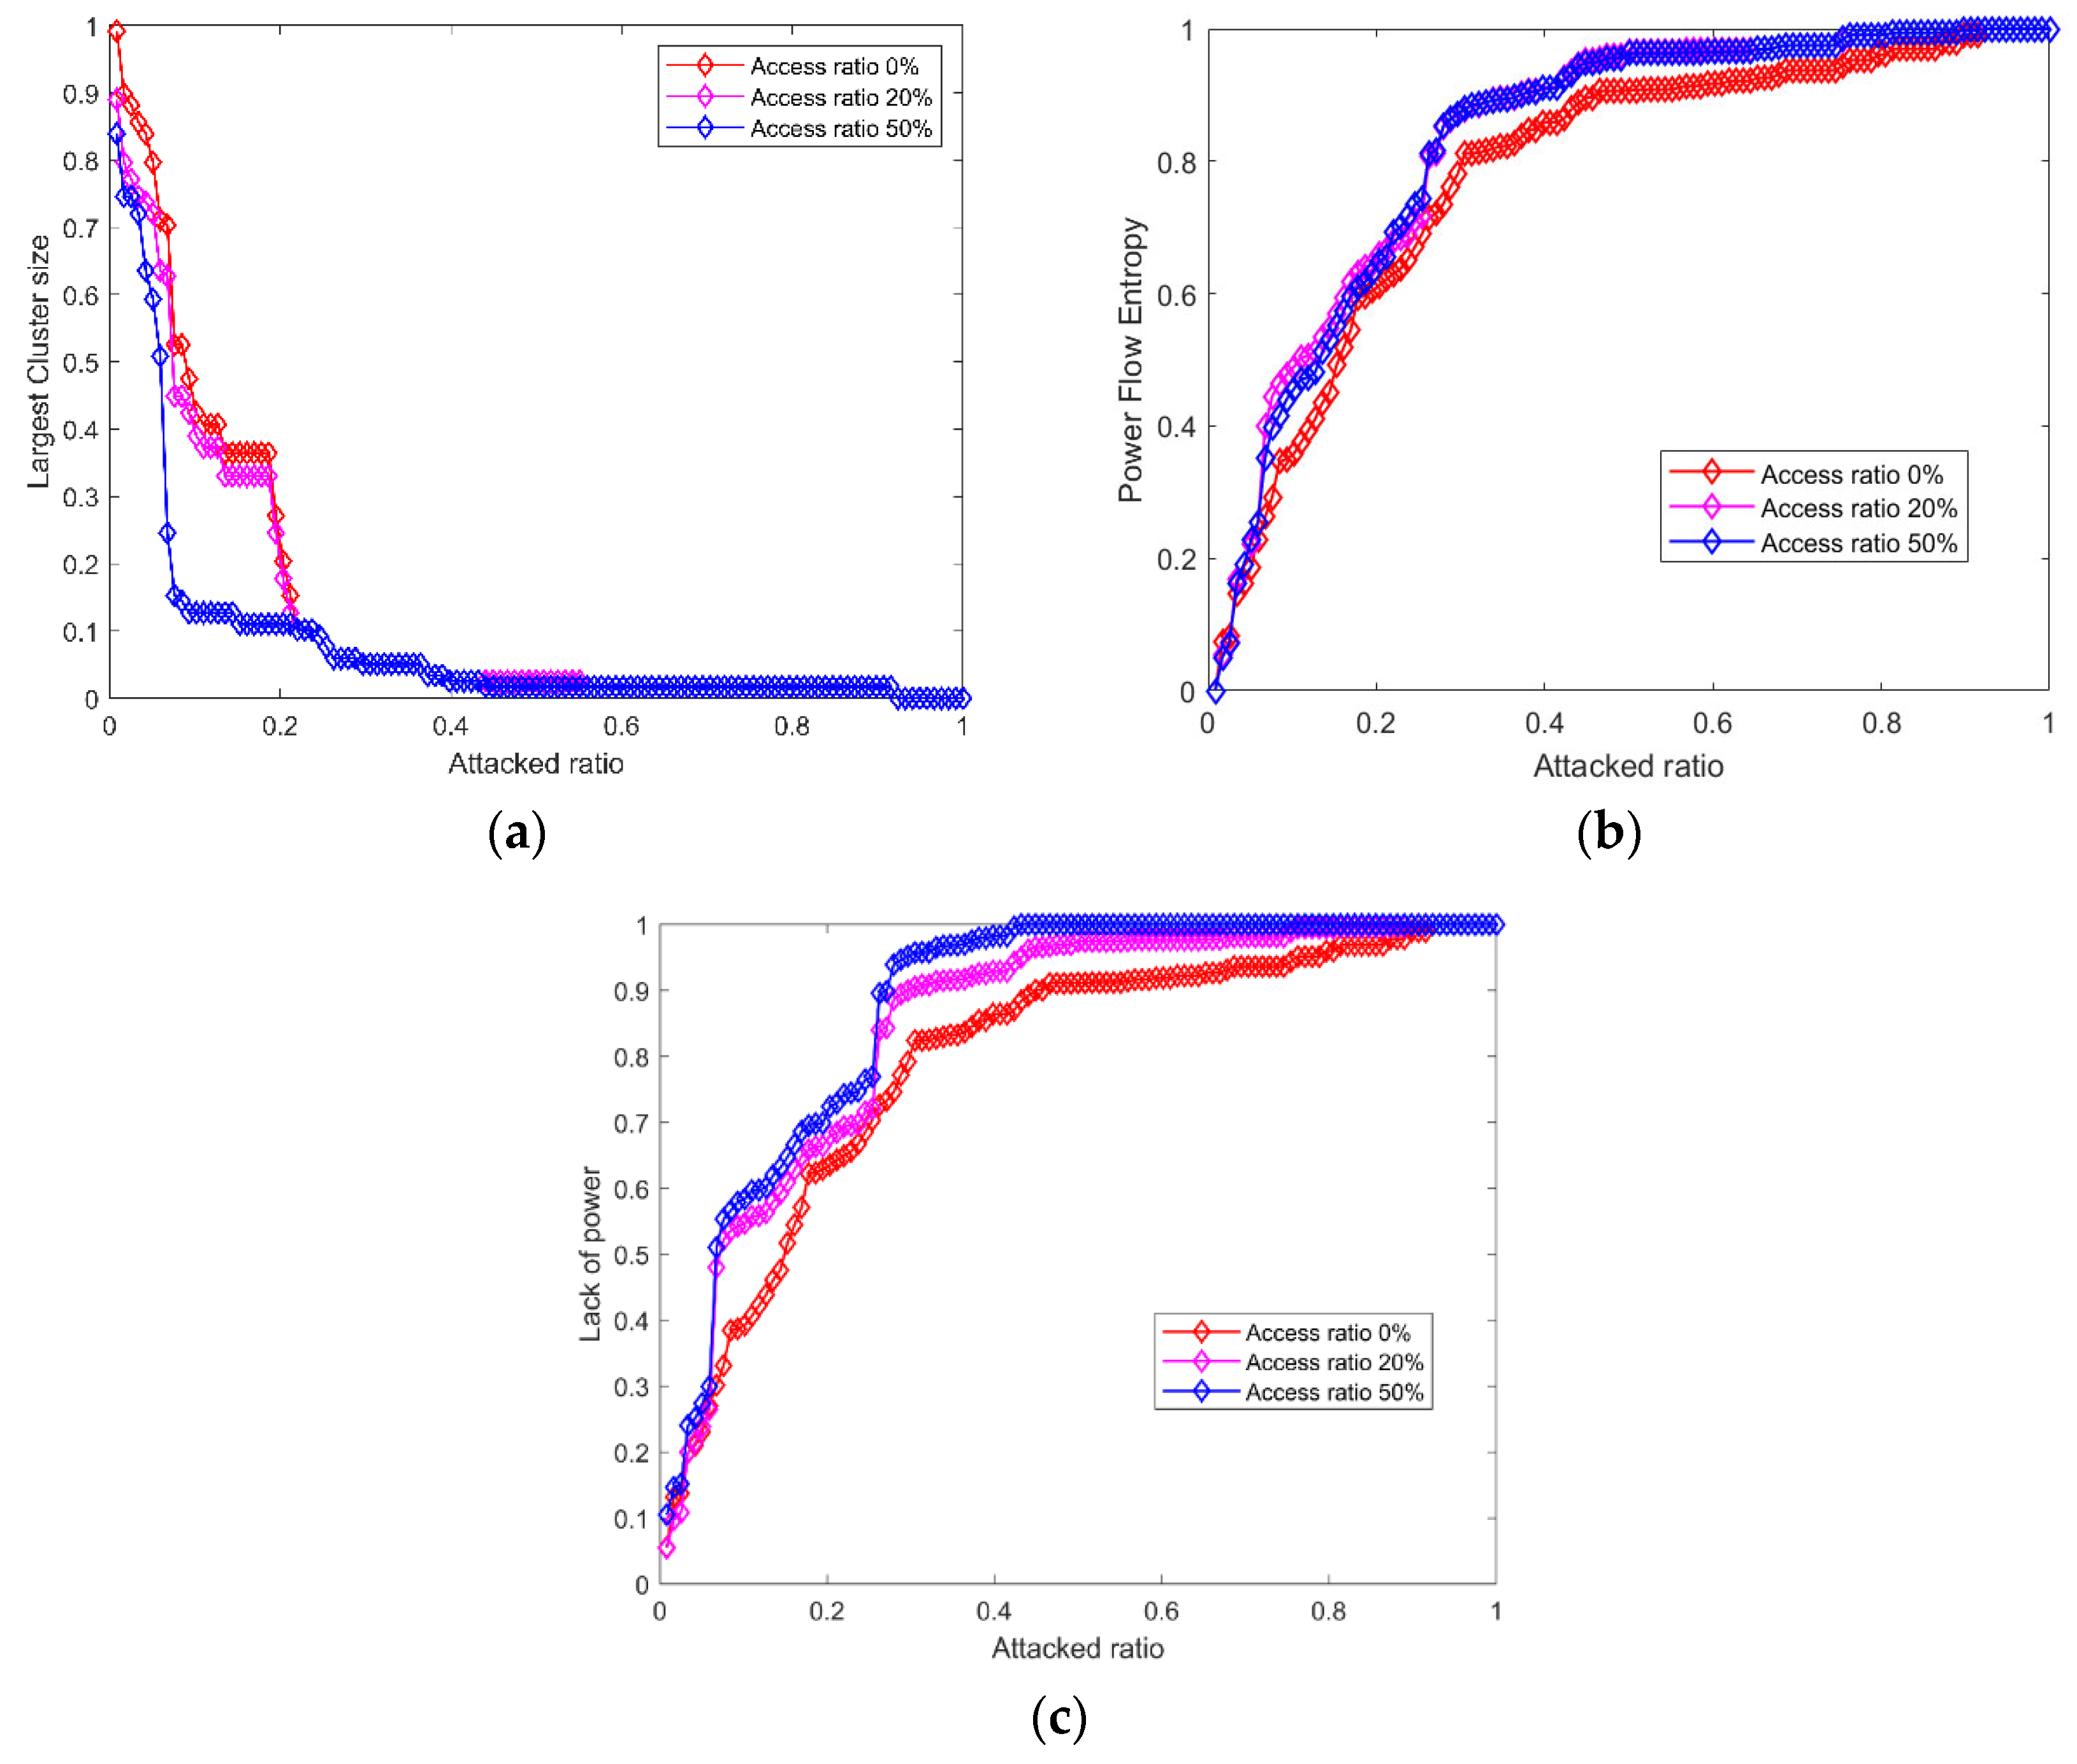
4.4. Different Penetration Levels of Renewable Energy
- (1)
- The higher the penetration level of renewable energy, the smaller the RLCS and the worse the structural resilience of the system. RLCS values under the two scenarios of 0 and 20% renewable energy penetration are close, indicating that the structural resilience of the system is unaffected by the low penetration level of renewable energy.
- (2)
- The higher the penetration level of renewable energy, the smaller the RHE, and the worse the power flow balance of the system. RHE values under the two scenarios of 20% and 50% renewable energy penetration level are close; however, there is a large difference compared to the RHE under the scenario of no renewable energy integration, indicating that the power flow balance is more sensitive to renewable energy.
- (3)
- The higher the proportion of renewable energy, the higher the RLP and the higher the loss of load after the attack.
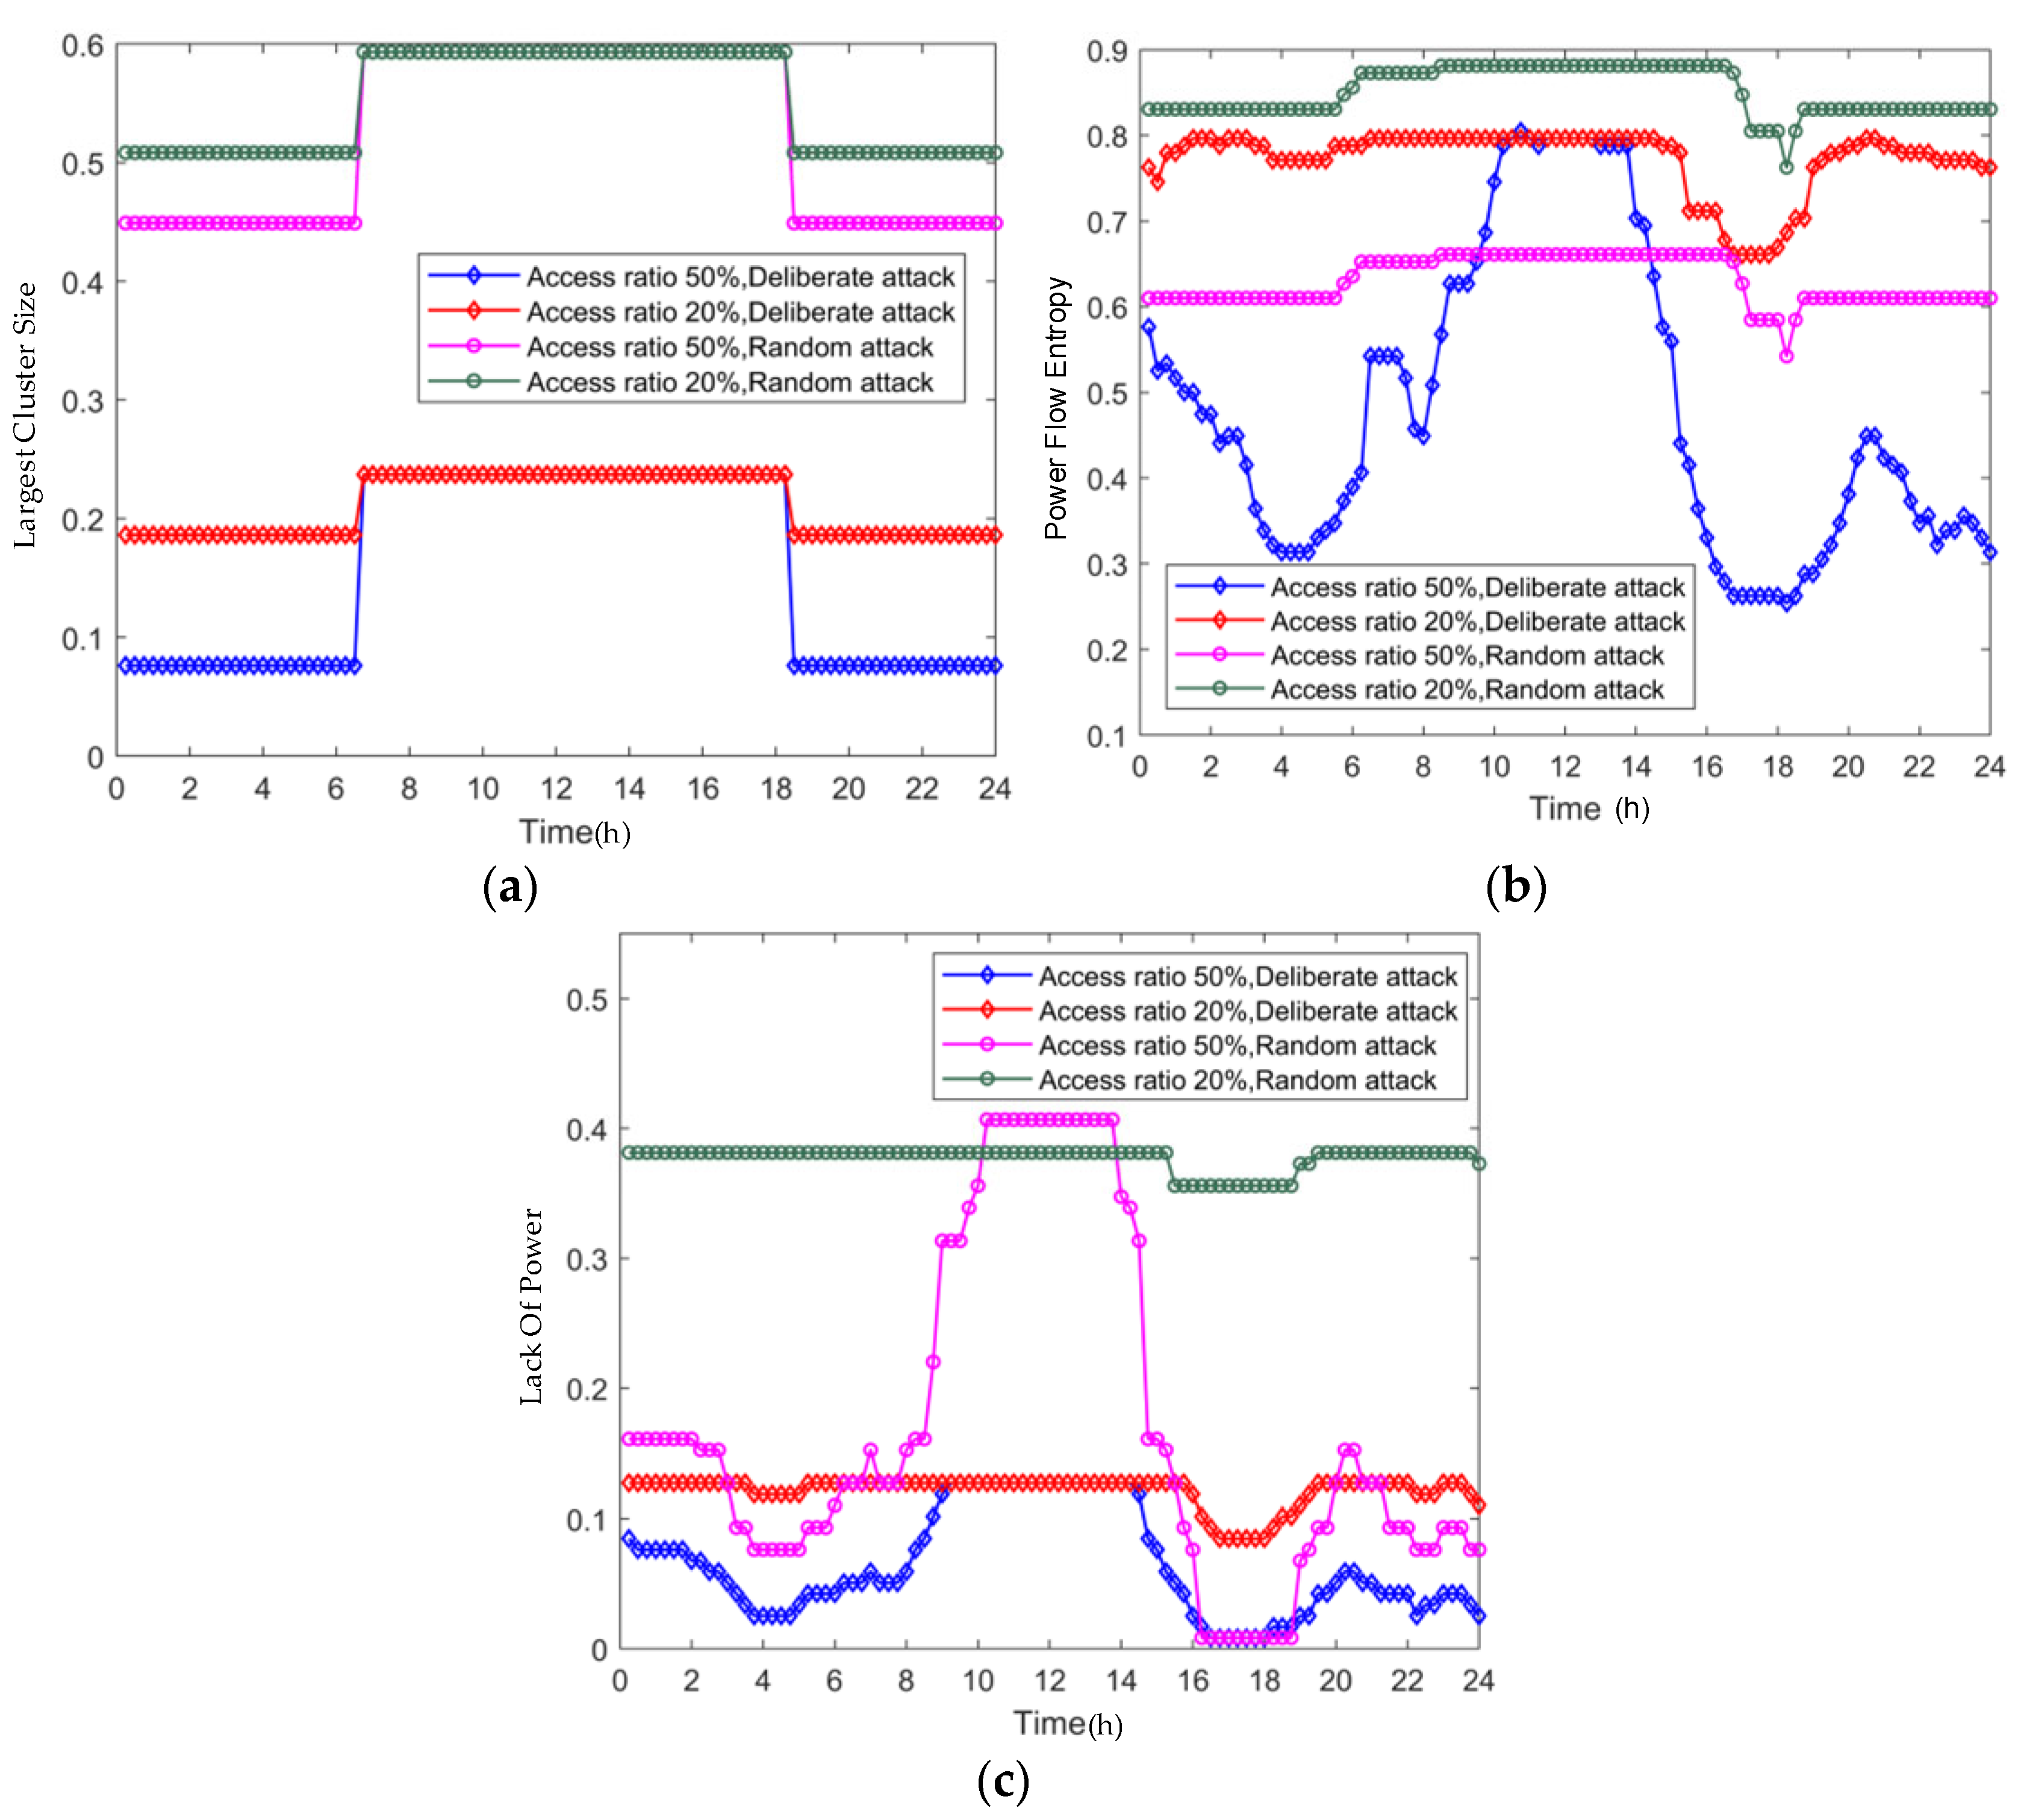
4.5. Resilience Evaluation Considering Power Fluctuation of Renewable Energy
- (1)
- In the middle of the day, the resilience of the system reaches its peak when the PV power is sufficient, and the system resilience reaches its second-highest point when the wind power generation is sufficient at night. The system is more robust under a random attack than under a deliberate attack.
- (2)
- Compared to the resilience of the system when the renewable energy penetration level is 50%, system resilience is significantly higher when the penetration level is 20%. Therefore, renewable energy integration has a significant impact on system resilience. The higher the proportion of renewable energy, the lower the resilience of the system.
- (3)
- Regarding the structural index of LCS, there is an approximately 50% probability that the system will collapse at a certain attack ratio within a day, while there is an approximately 50% probability that the system will collapse at another attack ratio within a day. However, as for the operational indexes of PFE and LP, the probability of the system collapsing during an attack will be different. These phenomena show that the structural index and operational index should both be considered in the resilience evaluation of power systems.
4.6. Impact of Renewable Energy Distribution Characteristics
- (1)
- Regarding the resilience index of PFE, the system reaches its operational limit when the attack ratio is larger than 0.31 if renewable energy is unevenly distributed, while the operational limit will be reached when the attack ratio is 0.37 if renewable energy is uniformly distributed.
- (2)
- Regarding the index of BLP, the system will reach the operational limit when the attack ratio is 0.06 and 0.07, respectively, in the scenarios of centralized distribution and uniform distribution of renewable energy.
5. Conclusions
- (1)
- The system demonstrates lower resilience when it is subjected to a deliberate attack compared to a random attack. As the penetration level of renewable energy increases, the system’s resilience will decrease, highlighting the vulnerability of renewable energy power systems to targeted attacks.
- (2)
- The system resilience is higher when the attack is at the maximum power of renewable energy, compared to the one when the attack time is at peak load. Additionally, both renewable energy penetration level and its distribution characteristics significantly influence system resilience. As the renewable energy penetration increases continuously, the system resilience will decrease gradually. At the same time, system resilience is lower under a centralized renewable energy distribution than the one under a uniform distribution.
Author Contributions
Funding
Institutional Review Board Statement
Informed Consent Statement
Data Availability Statement
Conflicts of Interest
References
- Gil, E.M.; McCalley, J.D. A U.S. energy system model for disruption analysis: Evaluating the effects of 2005 hurricanes. J. IEEE Trans. Power Syst. 2011, 26, 1040–1049. [Google Scholar] [CrossRef]
- Liang, G.; Weller, S.R.; Zhao, J.; Luo, F.; Dong, Z.Y. The 2015 Ukraine Blackout: Implications for False Data Injection Attacks. J. IEEE Trans. Power Syst. 2017, 32, 3317–3318. [Google Scholar] [CrossRef]
- Busby, J.W.; Baker, K.; Bazilian, M.D.; Gilbert, A.Q.; Grubert, E.; Rai, V.; Rhodes, J.D.; Shidore, S.; Smith, C.A.; Webber, M.E. Cascading risks: Understanding the 2021 winter blackout in Texas. J. Energy Res. Soc. Sci. 2021, 77, 102106. [Google Scholar] [CrossRef]
- Technical Report on the Events of 9 August 2019. Available online: https://www.nationalgrideso.com/document/152346/download (accessed on 6 September 2019).
- Appendices to the Technical Report on the Events of 9 August 2019. Available online: https://www.nationalgrideso.com/document/152351/download (accessed on 6 September 2019).
- Zhang, C.; Wang, Y.; Zheng, T.; Zhang, K. Complex network theory-based optimization for enhancing resilience of large-scale multi-energy System. J. Appl. Energy 2024, 370, 123593. [Google Scholar] [CrossRef]
- Tapia, T.; Lorca, A.; Olivares, D.; Negrete-Pincetic, M. A robust decision-support method based on optimization and simulation for wildfire resilience in highly renewable power systems. J. Eur. J. Oper. Res. 2021, 294, 723–733. [Google Scholar] [CrossRef]
- Yang, R.; Li, Y. Resilience assessment and improvement for electric power transmission systems against typhoon disasters: A data-model hybrid driven approach. J. Energy Rep. 2022, 8, 10923–10936. [Google Scholar] [CrossRef]
- Henry, D.; Ramirez-Marquez, J.E. Generic metrics and quantitative approaches for system resilience as a function of time. J. Reliab. Eng. Syst. Saf. 2012, 99, 114–122. [Google Scholar] [CrossRef]
- Yao, Y.; Liu, W.; Jain, R.; Chowdhury, B.; Wang, J.; Cox, R. Quantitative Metrics for Grid Resilience Evaluation and Optimization. J. IEEE Trans. Sustain. Energy 2023, 14, 1244–1258. [Google Scholar] [CrossRef]
- Panteli, M.; Mancarella, P.; Trakas, D.N.; Kyriakides, E.; Hatziargyriou, N.D. Metrics and Quantification of Operational and Infrastructure Resilience in Power Systems. J. IEEE Trans. Power Syst. 2017, 32, 4732–4742. [Google Scholar] [CrossRef]
- Espinoza, S.; Panteli, M.; Mancarella, P.; Rudnick, H. Multi-phase assessment and adaptation of power systems resilience to natural hazards. J. Electr. Power Syst. Res. 2016, 136, 352–361. [Google Scholar] [CrossRef]
- Zhang, H.; Ma, S.; Ding, T.; Lin, Y.; Shahidehpour, M. Multi-Stage Multi-Zone Defender-Attacker-Defender Model for Optimal Resilience Strategy with Distribution Line Hardening and Energy Storage System Deployment. J. IEEE Trans. Smart Grid 2020, 12, 1194–1205. [Google Scholar] [CrossRef]
- Jufri, F.H.; Widiputra, V.; Jung, J. State-of-the-art review on power grid resilience to extreme weather events: Definitions, frameworks, quantitative assessment methodologies, and enhancement strategies. J. Appl. Energy 2019, 239, 1049–1065. [Google Scholar] [CrossRef]
- Panteli, M.; Trakas, D.N.; Mancarella, P.; Hatziargyriou, N.D. Power Systems Resilience Assessment: Hardening and Smart Operational Enhancement Strategies. J. Proc. IEEE 2017, 105, 1202–1213. [Google Scholar] [CrossRef]
- Jasiūnas, J.; Lund, P.D.; Mikkola, J. Energy system resilience—A review. J. Renew. Sustain. Energy Rev. 2021, 150, 111476. [Google Scholar] [CrossRef]
- Ma, X.; Zhou, H.; Li, Z. On the resilience of modern power systems: A complex network perspective. J. Renew. Sustain. Energy Rev. 2021, 152, 111646. [Google Scholar] [CrossRef]
- Wang, S.; Zhang, J.; Duan, N. Multiple perspective vulnerability analysis of the power network. Physica A 2018, 492, 1581–1590. [Google Scholar] [CrossRef]
- Zhou, D.Y.; Hu, F.N.; Wang, S.L.; Chen, J. Power network robustness analysis based on electrical engineering and complex network theory. J. Phys. A 2021, 564, 1–11. [Google Scholar] [CrossRef]
- Guohua, Z.; Ce, W.; Jianhua, Z.; Jingyan, Y.; Yin, Z.; Manyin, D. Vulnerability assessment of bulk power grid based on complex network theory. J. IEEE Int. Conf. Electr. Util. Deregul. Restruct. Power Technol. 2008, 1554–1558. [Google Scholar] [CrossRef]
- Das, L.; Munikoti, S.; Natarajan, B.; Srinivasan, B. Measuring smart grid resilience: Methods, challenges and opportunities. J. Renew. Sustain. Energy Rev. 2020, 130, 109918. [Google Scholar] [CrossRef]
- Lin, Z.; Wen, F.; Xue, Y. A restorative self-healing algorithm for transmission systems based on complex network theory. J. IEEE Trans. Smart Grid 2017, 7, 2154–2162. [Google Scholar] [CrossRef]
- Lian, X.; Qian, T.; Li, Z.; Chen, X.; Tang, W. Resilience assessment for power system based on cascading failure graph under disturbances caused by extreme weather events. J. Int. J. Electr. Power Energy Syst. 2023, 145, 108616. [Google Scholar] [CrossRef]
- Zhou, D.; Pan, X.; Guo, J.; Sun, X.; Wang, C.; Zheng, J. Resilience quantification of offshore wind farm cluster under the joint influence of typhoon and its secondary disasters. J. Appl. Energy 2025, 383, 125323. [Google Scholar] [CrossRef]
- Koç, Y.; Warnier, M.; Kooij, R.E.; Brazier, F.M. An entropy-based metric to quantify the robustness of power grids against cascading failures. J. Saf. Sci. 2013, 59, 126–134. [Google Scholar] [CrossRef]
- Zhang, H.; Peng, M.; Palensky, P. Intentional islanding method based on community detection for distribution networks. J. IET Gener. Transm. Distrib. 2019, 13, 30–36. [Google Scholar] [CrossRef]
- Zhou, D.Y.; Hu, F.N.; Wang, S.L.; Chen, J. Robustness analysis of power system dynamic process and repair strategy. J. Electr. Power Syst. Res. 2021, 194, 107046. [Google Scholar] [CrossRef]
- Dan, Y.; Liu, W.; Zhu, Y.; Cai, W.; Wang, W.; Liang, C. Self-organized critical state identification of power grid with centralized integration of large-scale wind power. J. Electr. Power Autom. Equip. 2016, 36, 127–133. [Google Scholar]
- Liu, W.; Cai, W.; Yangqing, D.; Liang, C.; Wang, J.; Wang, N.; Ma, Y. The evolution of grid’s self-organized criticality state based on entropy theory under the circumstance of large scale wind power centralized grid. J. Power Syst. Technol. 2013, 37, 3392–3398. [Google Scholar]
- Bao, Z.J.; Cao, Y.J.; Wang, G.Z.; Ding, L.J. Analysis of cascading failure in electric grid based on power flow entropy. J. Phys. Lett. A 2009, 373, 3032–3040. [Google Scholar] [CrossRef]


| Indicators | 11:30 a.m. | 21:00 p.m. | ||
|---|---|---|---|---|
| Random Attack | Deliberate Attack | Random Attack | Deliberate Attack | |
| RLCS | 0.57 | 0.24 | 0.45 | 0.23 |
| RHE | 0.68 | 0.37 | 0.66 | 0.36 |
| RLP | 0.22 | 0.07 | 0.24 | 0.06 |
| Index | Random Attack | Deliberate Attack | ||||||
|---|---|---|---|---|---|---|---|---|
| 20% | 50% | 20% | 50% | |||||
| Attack Ratio | Probability Distribution | Attack Ratio | Probability Distribution | Attack Ratio | Probability Distribution | Attack Ratio | Probability Distribution | |
| LCS | 0.19 | 0.51 | 0.45 | 0.51 | 0.19 | 0.51 | 0.08 | 0.51 |
| 0.24 | 0.49 | 0.59 | 0.49 | 0.24 | 0.49 | 0.24 | 0.49 | |
| PFE | 0.55 | 0.86 | 0.54 | 0.73 | 0.48 | 0.57 | 0.45 | 0.52 |
| 0.59 | 0.07 | 0.55 | 0.25 | 0.47 | 0.39 | 0.47 | 0.25 | |
| 0.60 | 0.04 | 0.58 | 0.02 | 0.49 | 0.01 | 0.46 | 0.21 | |
| LP | 0.38 | 0.82 | 0.07 | 0.42 | 0.13 | 0.74 | 0.03 | 0.54 |
| 0.36 | 0.15 | 0.15 | 0.34 | 0.11 | 0.18 | 0.13 | 0.22 | |
| 0.37 | 0.03 | 0.41 | 0.16 | 0.08 | 0.06 | 0.08 | 0.11 | |
Disclaimer/Publisher’s Note: The statements, opinions and data contained in all publications are solely those of the individual author(s) and contributor(s) and not of MDPI and/or the editor(s). MDPI and/or the editor(s) disclaim responsibility for any injury to people or property resulting from any ideas, methods, instructions or products referred to in the content. |
© 2025 by the authors. Licensee MDPI, Basel, Switzerland. This article is an open access article distributed under the terms and conditions of the Creative Commons Attribution (CC BY) license (https://creativecommons.org/licenses/by/4.0/).
Share and Cite
Zhou, D.; Pan, X.; Sun, X.; Hu, F. Resilience Assessment Framework for High-Penetration Renewable Energy Power System. Sustainability 2025, 17, 2058. https://doi.org/10.3390/su17052058
Zhou D, Pan X, Sun X, Hu F. Resilience Assessment Framework for High-Penetration Renewable Energy Power System. Sustainability. 2025; 17(5):2058. https://doi.org/10.3390/su17052058
Chicago/Turabian StyleZhou, Dongyue, Xueping Pan, Xiaorong Sun, and Funian Hu. 2025. "Resilience Assessment Framework for High-Penetration Renewable Energy Power System" Sustainability 17, no. 5: 2058. https://doi.org/10.3390/su17052058
APA StyleZhou, D., Pan, X., Sun, X., & Hu, F. (2025). Resilience Assessment Framework for High-Penetration Renewable Energy Power System. Sustainability, 17(5), 2058. https://doi.org/10.3390/su17052058