1. Introduction
As a crucial part of the maritime supply chain, shipping serves as a driving force for global trade, ensuring the efficient and safe movement of raw materials, finished goods, and commodities worldwide. However, as the backbone of economic development, shipping also poses a significant environmental threat, resulting in the production of pollutants such as sulfur oxides, nitrogen oxides, and particulate matter, contributing to air pollution and acid rain [
1]. According to estimates by the International Maritime Organization (IMO), approximately 2–3% of global greenhouse gas (GHG) emissions come from shipping, representing a notable contribution to carbon emissions. Reducing this impact has become a focus for international environmental policies, although mitigating carbon emissions remains the most urgent and imperative issue in maritime shipping [
2]. On a global scale, international agencies, such as IMO, have set forth regulations that enforce carbon emission reductions. One of the most significant is to reduce greenhouse gas emissions from ships by at least 50% by 2050, compared to 2008 levels. Meeting this ambitious target requires coordinated efforts across nations and industries, involving aspects such as technological innovation, operational efficiency, and compliance with emission standards.
At the heart of the maritime supply chain system are shipping companies (i.e., carriers), which provide the essential services of shipping transportation. In addition to responsibilities for transporting cargoes, carriers also play a critical role in ensuring the smooth operation of supply chains by providing reliable, safe, and compliant transportation services. Carriers not only ensure goods are delivered across borders but also influence broader economic trends. Tasked with transporting vast quantities of goods across oceans, carriers now face growing pressure to reduce caron emissions. Transitioning carriers such that they comply with regulations and market needs by focusing on emission reduction strategies, such as structural and power system modifications and the installation of environmental protection equipment, can lead to increased operational costs [
3]. Furthermore, carriers also face the risk of not recouping their investments in low-carbon fuels due to insufficient customer demand. Additionally, the competitive environment of carriers hinders emission reduction efforts due to cost pressures, resulting in a low motivation to adopt low-carbon energies.
Shippers are also seeking greener options, aligning their supply chains with sustainability goals by partnering with carriers that demonstrate environmental responsibility. Their demand for low-carbon logistics solutions is helping to drive competition among shipping companies to offer more sustainable services. In response, various governments and international organizations are implementing low-carbon subsidy incentives aimed at encouraging carriers to adopt greener energies and practices. Providing financial incentives for the adoption of low-carbon technologies and fuels is proven to be highly efficient to address climate change issues [
4,
5,
6]. Different strategies were analyzed to mitigate emission of a transport chain with carrier competition [
7], but the impact of government incentives on carbon reduction was overlooked. The impact of subsidies and carbon tax policy on the development of competition among different ocean carriers was studied in [
8], but the authors did not consider whether providing subsidies to carriers in a competitive environment can effectively reduce carbon emissions. Our previous work also considered subsidies and competitive carriers, but was only focused on how to relieve lock congestion upstream of the Three Gorges Dam (TGD) [
9]. Price competition between carriers was also considered in [
10], but government subsidies and carbon emission reduction were outside the scope. Therefore, regarding ocean carrier competition, it remains unclear how subsidies from the government can impact carbon emission alleviation, or whether subsidies are effective in abating carbon emissions with environmentally conscious shippers. To fill this gap, we seek to answer the following questions in this paper:
- (1)
Should the government subsidize price-competitive carriers and encourage them to make the transition to decarbonize?
- (2)
What is the optimal subsidy strategy under different scenarios? And how effective is such a subsidy in reducing carbon emission?
- (3)
What impact do price competition and shippers’ green preferences have on service prices, demands, profits, carbon emissions, and social welfare?
To address these issues, we employ Stackelberg game-theoretic approaches in our methodology to model the interactive relationships between the port, the government, two competitive carriers, and green-preference shippers under three different scenarios: OS, CS, and BS. First, we discuss whether governmental subsidies can reduce carbon emissions in price-competitive environments with green shippers. Second, we analyze the impact of price competition and green preference on the optimal decisions of each partner. Finally, we conduct a detailed numerical analysis and provide insights into the sensitivity of key variables to changes in subsidy levels, price competition, and green preference coefficients. There are several contributions from this study. Firstly, game models are constructed to explore the interactions among different players of the maritime supply chain. Through the derived optimal results, we explore the impact of subsidy strategies with price-competitive carriers on carbon emissions reduction in green shippers. To our best knowledge, this is seldom studied in the extant literature. Secondly, we demonstrate the effectiveness of subsidies in mitigating carbon emissions in a price-competitive environment. Carriers are encouraged to invest in the adoption of low-carbon technologies, contributing to a more sustainable environment. Last, we reveal how shippers’ low-carbon preference and price competition between carriers’ impact prices, demands, profits, carbon emissions, and social welfare. Our findings can provide decision-makers with managerial insights to establish a sustainable environment.
The reminder of this paper is organized as follows.
Section 2 is a brief review of the related literature.
Section 3 describes the problem, and the model formulation is provided in
Section 4.
Section 5 and
Section 6 are the modal analysis and numerical analysis. Conclusions are presented in
Section 7, and proofs are provided in
Appendix A.
2. Literature Review
This work integrates three streams of research: (1) the carbon emission control strategy of a maritime supply chain; (2) government subsidies; and (3) price competition between carriers.
2.1. Carbon Emission Control Strategy of a Maritime Supply Chain
Efforts to reduce carbon emissions in maritime supply chains have gained significant attention from researchers, whereas ports, shipping companies, and forwarders are the main implementing subjects [
11,
12,
13]. Different strategies are adopted to abate carbon emission, such as involving blockchain technologies [
13,
14], port construction or infrastructure [
15,
16,
17], low-carbon fuel adoption [
12,
18], and carbon taxes and cap-and-trade [
8,
19,
20]. Shipping carriers made decisions about sustainability investment to comply with emission control regulations in a two-level maritime supply chain [
11]. In addition, the role of ports taking part in shipping decarbonization was analyzed, and ports can adopt various measures to facilitate ships’ emissions reduction [
21]. Balcombe et al. (2021) utilized new emissions measurements to assess the cost of Liquefied Natural Gas (LNG) as shipping fuel, finding that it was possible to meet a 50% decarbonization target, with methane emissions reduced to 0.5% of throughput [
18].
Considering investment in carbon abatement of a maritime supply chain, Huang et al. (2023) also investigated the influences of government policies and social preferences [
4]. After a comparison analysis, Chen et al. (2023) found that emissions were significantly reduced after COVID-19 for passenger shipping in Danish waters [
22]. Taking CMA-CGM as an example, emissions inventories worldwide were quantified using a bottom-up framework [
23]. Distinctly from the abovementioned literature, our paper contributes by integrating carrier price competition and the role of green shippers, offering a more comprehensive understanding of carbon emission abatement in competitive maritime supply chains—a perspective that remains underexplored in current research.
2.2. Government Subsidies
Recent studies have examined the role of government subsidies in promoting low-carbon practices in the maritime supply chain [
16], and incentive policies can be helpful for increasing the revenue of carriers [
24]. Governments encourage NEV carriers to adopt green innovation through subsidies [
25]. Two incentive policies for the deployment of ship-borne power receiving systems to reduce carbon emissions near ports were considered in [
17]. Price subsidies can help in improving shipping supply chain profits [
23]. Huang et al. (2023) considered investments in carbon abatement and low-carbon services resulting from government subsidies. Their findings indicated that government subsidies can significantly enhance the greenness of the maritime supply chain [
4].
Wang et al. (2023) studied how government subsidies influence shipping companies in choosing shore power or lower sulfur fuel oil. They found that government subsidies can play different roles under certain power structures [
1]. Zhen et al. (2022) investigated subsidy strategies to install and utilize shore power for ports, and they optimized the subsidies to reduce costs for government and maximize profits for ports [
17]. Li et al. (2024) analyzed the government adoption of two subsidy schemes for port operations to meet low-carbon requirements [
14]. Wang et al. (2024) designed two different subsidy schemes for shipping companies using Hotelling models [
26]. Luo et al. (2024) considered government incentivizing of shipping operators to retrofit ships, where SP of a shipping supply chain was initially used in the short term [
24]. These studies collectively highlight the critical role of government subsidies in the adoption of low-carbon technologies and practices in maritime supply chains. However, how government subsidies impact carbon emissions reduction specifically in a price-competitive environment has seldom been explored in the existing literature.
2.3. Price Competition Between Carriers
Recent research has increasingly focused on carbon emission reduction strategies in competitive maritime supply chains. Huang et al. (2023) analyzed investing in blockchain technologies in a competitive environment, finding that competition between shipping companies would affect service prices [
4]. Xie and Wang (2024) investigated which of two competing carriers of two transportation chains should be the privileged carrier [
27]. Considering shipping supply chain competition, game models are formulated to investigate the equilibrium strategies of shipping operators on SP usage under different policies [
24]. Despite advancements, comprehensive analyses of government subsidies in price-competitive environments involving green-conscious shippers were lacking in these examples. Addressing this research gap is crucial for developing more effective policy interventions and fostering sustainable practices in the maritime industry.
As depicted above, the existing studies mostly address carbon emission reduction, government subsidies, carriers’ price competition, and shippers’ green consciousness individually, with a lack of research on integrating these four aspects. To fill this gap, we develop game models to investigate carbon emission abatement strategies, integrating government intervention and shippers’ green preferences, aiming to identify optimal strategies under three different scenarios. This study distinguishes itself from previous research by simultaneously considering ocean carrier price competition, government subsidies, and the influence of environmentally conscious shippers. Our findings can contribute to a more comprehensive understanding of carbon abatement in competitive maritime supply chains.
3. Problem Description
We consider a maritime supply chain consisting of a port, two price-competitive carriers, shippers, and the government. The port, located upstream, provides services such as cargo handling and storage as well as berthing to carriers, denoted as and , respectively. For simplicity, the port’s marginal cost is assumed to be zero. As the buyer of services, shippers have preferences for low-carbon transportation options. Carriers set their own service prices and , and compete in terms of price, aiming to offer the best transportation services.
In the maritime supply chain, the government acts as the Stackelberg leader, strategically offering subsidies to carriers to maximize social welfare. These subsidies incentivize carriers to invest in emission reduction technologies and contribute to a greener maritime supply chain. The port and carriers prioritize maximizing their profits.
According to [
28,
29,
30], we suppose demand functions are defined as
In the demand model, means the demand of different carriers, represents the competition intensity between ocean carriers, is the service price of carriers provided to shippers, and is the environmental awareness from shippers. The higher the , the higher the degree of greenness during transportation. is carbon emission, and we assume here that all carriers possess the same level of carbon emission under the same scenario.
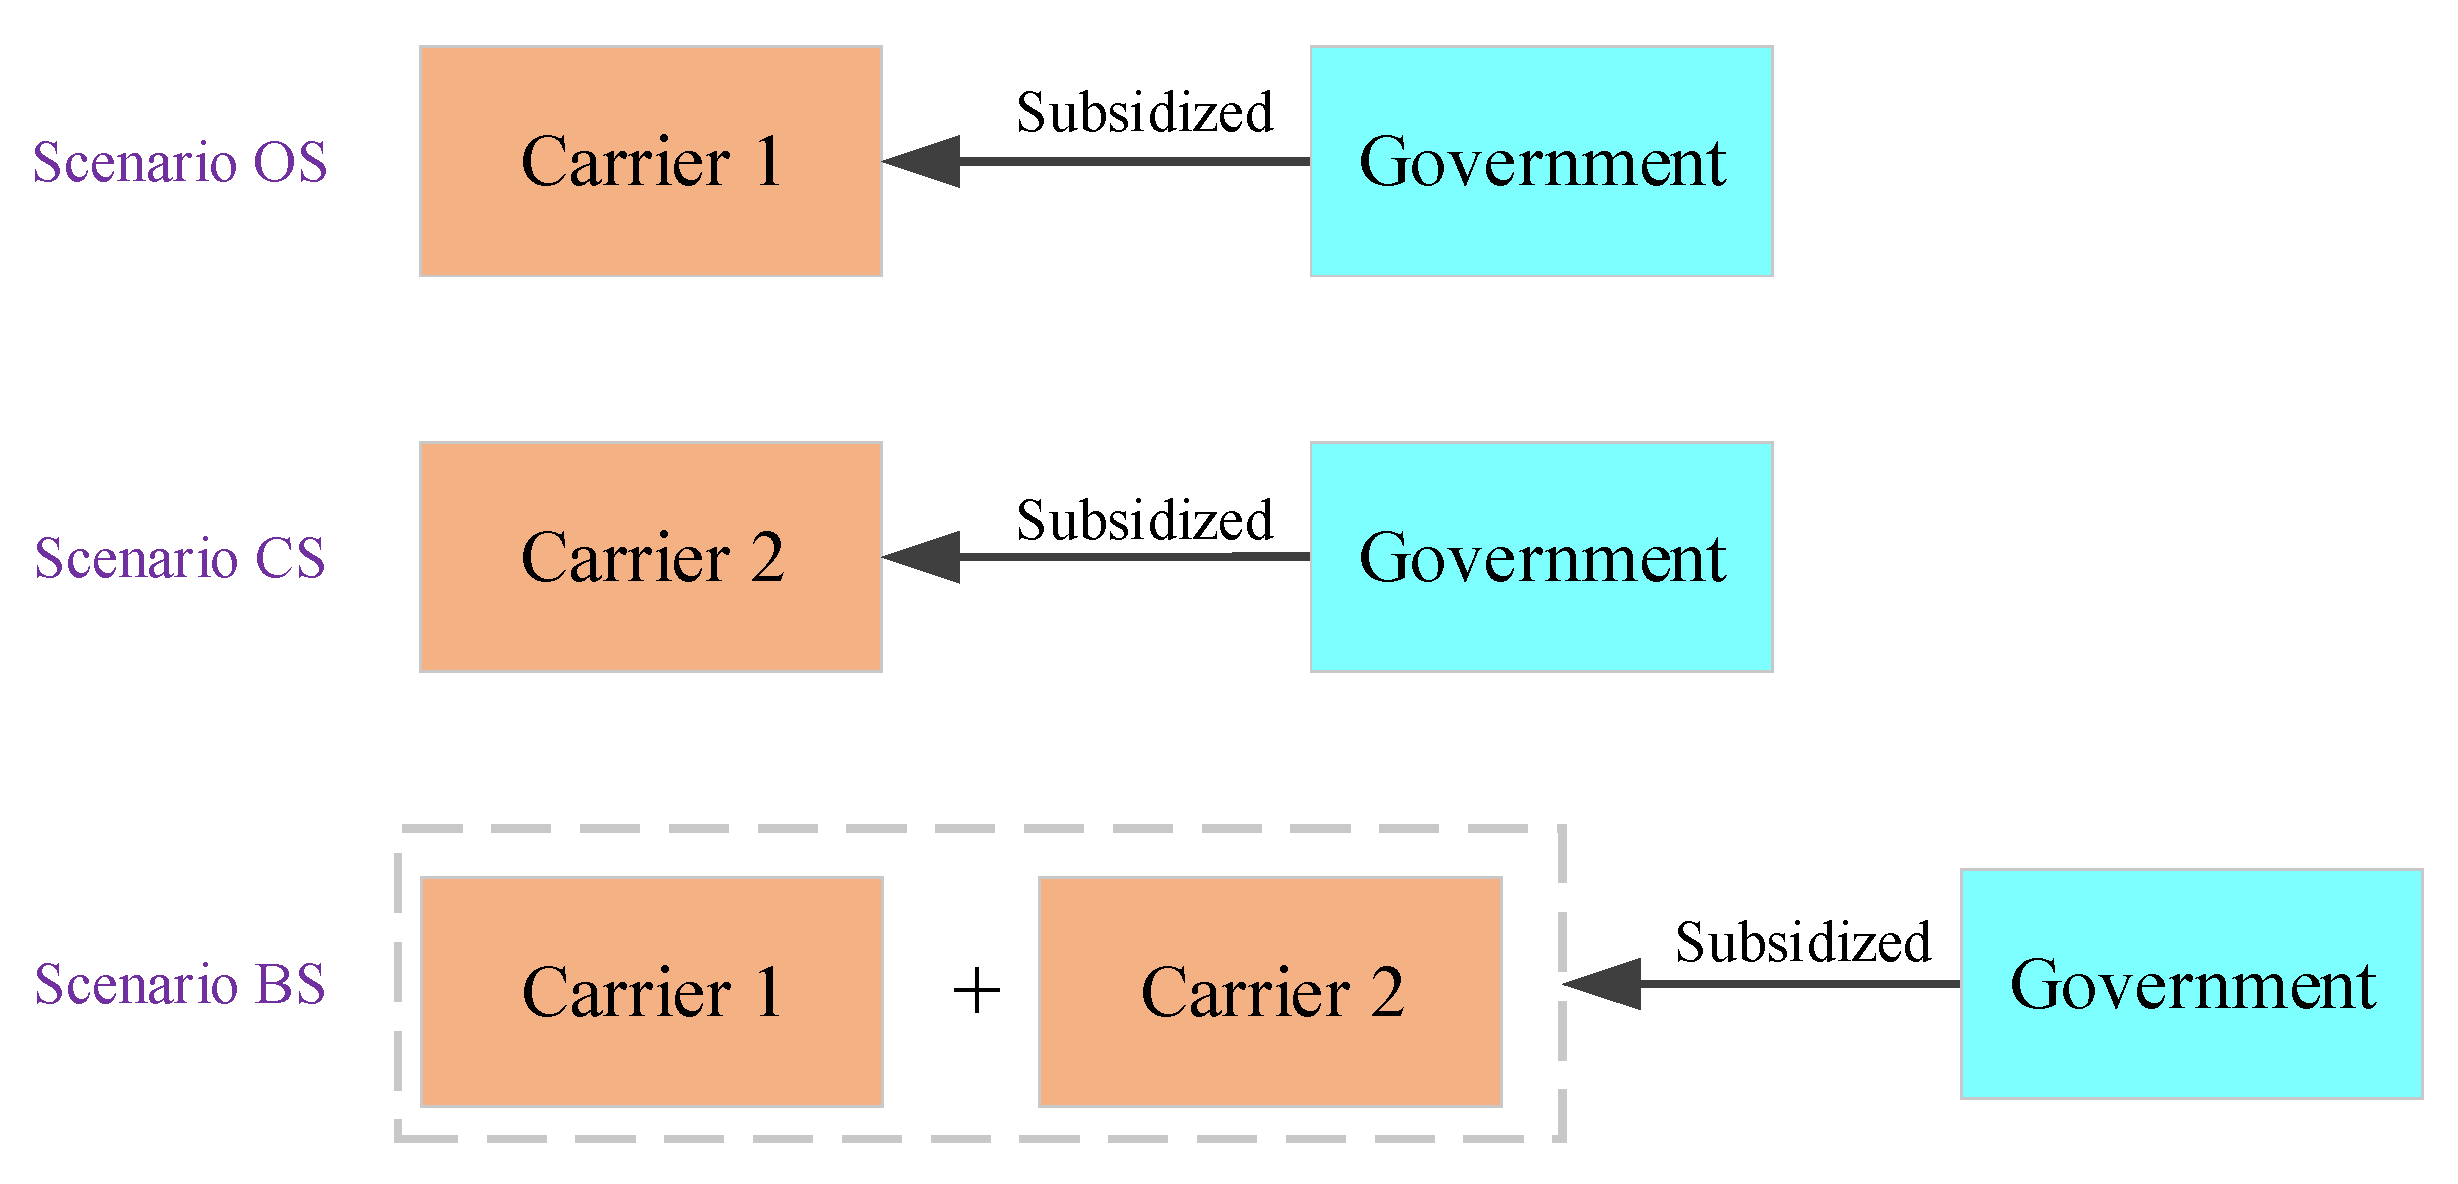
To clarify the interactive relationships between different players in the maritime supply chain, game models are developed for three scenarios: Scenario OS, Scenario CS, and Scenario BS. In Scenario OS and CS, only one carrier, either Carrier 1 or Carrier 2, adopts carbon emission reduction measures in response to government subsidies. In Scenario BS, both carriers are subsidized for taking actions to alleviate carbon emission (see
Figure 1).
According to the extant studies [
13,
14,
28,
31,
32], the additional sustainability investment cost for ocean carriers to abate carbon emission is denoted by
, with
representing the subsidy level. The government shares
of the total investment. Correspondingly, profit functions for different players and social welfare functions will change in different scenarios. For convenience, the symbols and notations are shown in
Table 1.
4. Model Formulation
The three different scenarios are described below:
4.1. Scenario 1 (Scenario OS)
In this scenario, only Carrier 1 will invest a total amount of
in carbon emission abatement, where
denotes the subsidy proportion provided by the government. This investment is partially offset by government subsidies aimed at incentivizing the adoption of low-carbon practices. Profit functions of both carriers and the port, and the social welfare function are expressed as Equations (3)–(8):
Equations (3) and (4) represent the profit of Carrier 1 and 2, respectively. Both are determined by service prices (, ), wholesale costs ( and ), and demands ( and ). Additionally, Carrier 1’s profit in Equation (3) includes the investment component influenced by the emission level factor (), subsidy level (), and investment factor (). The port revenue is in Equation (5), determined by the wholesale prices ( and ) and the corresponding demands ( and ) from both supply chains. The port and carriers are profit maximizers. The subsidy provided by the government is given in Equation (6). Equation (7) represents the consumer surplus, and social welfare is defined in Equation (8) as the aggregate of the profits of carriers and the port, and consumer surplus, minus the subsidy provided by the government. In addition, the government aims to maximize social welfare.
Lemma 1. In Scenario OS, the social welfare function is jointly concave related to , , and when .
Taking first-order partial derivatives of
with respect to (
,
,
), through solving the system of equations, we can obtain
,
, and
. By substituting the optimal solution into Equations (1)–(6) and (8), optimal results for Scenario OS can be obtained, as shown in
Table 2. It is easy to understand that when the subsidy level exceeds
, there exists a well-defined set of (
,
,
) that maximizes social welfare. This also indicates that incentives provided by the government are achievable and will result in higher social welfare.
4.2. Scenario 2. (Scenario CS)
In this condition, only Carrier 2 receives subsidies from the government, and government subsidies covers
of the total investment cost
. Hence, profit functions and social welfare are formulated as Equations (9)–(14). By solving these equations, other optimal results can be derived.
Similarly, Equations (9)–(11) are the profits of Carrier 1, Carrier 2 and the port, respectively. The port and carriers aim to achieve maximum profitability. Equation (12) is the subsidy provided by the government. Equations (13) and (14) provide consumer surplus and social welfare in Scenario CS, and the government also seeks to maximize social welfare.
Lemma 2. When , social welfare function is jointly concave related to , , and .
Similarly, based on Lemma 2, we take the first-order partial derivative of
with respect to
,
and
, respectively, to obtain the optimal solution (
,
,
). By substituting
,
, and
into Equations (1), (2), (9)–(12), and (14), other optimal solutions can be correspondingly obtained, as shown in
Table 3.
4.3. Scenario 3. (Scenario BS)
In this scenario, both carriers are subsidized to make the investment, and the total investment cost for carriers to reduce carbon emissions is 0.5
. The government shares
and
of the total investment cost, separately. Profit functions for all partners and social welfare are formulated as Equations (15)–(20).
Equations (15)–(17) are the individual profits of both carriers and the port, all of which are determined by the service prices of the carriers (, ) and the port ( and ) as well as the demands ( and ). Both carriers and the port aim to maximize profits. Equation (19) is the total subsidy from the government. Equations (18) and (20) represent the consumer surplus and social welfare, respectively, and the government is committed to achieving optimal social welfare.
Lemma 3. When , social welfare function is jointly concave related to , , and .
Table 4 outlines the optimal results derived by solving first-order derivatives of
on (
,
,
), through which we can obtain
,
, and
. By substituting the set (
,
,
) into equations, other optimal results can be correspondingly obtained.
5. Model Analysis
Based on equilibrium solutions presented in
Table 2,
Table 3 and
Table 4, this section delves into a comprehensive analysis for prices, demands, profits, carbon emissions, and social welfare for Carrier 1 and Carrier 2. The effects of competition intensity and subsidy level on optimal results are compared to explore strategic decisions for carriers under different scenarios.
Proposition 1. The optimal prices and demands under different scenarios satisfy the following: (1) , , and increase in and decrease in , and , , when and increase; (2) differs in , and satisfy , , and ; (3) differs in and satisfies , , and .
Proposition 1 indicates that as competition intensifies, the service prices charged by different carriers tend to increase. Although subsidies can help offset operational costs to alleviate carbon emissions, allowing carriers the flexibility to increase prices to capture a larger market share can ultimately strengthen their long-term competitiveness. Moreover, increased subsidies may lead to overcapacity, resulting in a decline in shipping volume.
Proposition 2. The optimal profits satisfy (1), and differs in and ; (2) , , and .
Proposition 3. (1) increases in , when , ; when , ; when , ; (2) decreases in , when , ; when , .
For the proof of Propositions 2 and 3, see
Appendix A.
Proposition 2 indicates that with the increase in intensified competition and subsidies, carriers must increase service quality, shorten transit times, and invest in greener technologies, which will result in various changes in profits. However, competition intensity drives carriers to implement greener shipping practices, which benefits both shippers and the whole society, as demonstrated in Proposition 3. However, excessive subsidies may result in fiscal deficits for the government, which negatively impacts the economy and social welfare.
Proposition 4. Optimal carbon emission satisfies the following: (1) decreases in and increases in ; (2) .
Proposition 4 explores the notion that in a price-competitive market, an increase in subsidies can lead to reduced carbon emission in different scenarios, which means that adopting low-emission technologies can be beneficial for abating carbon emission. Intense price competition may lead carriers to expand capacity, in turn leading to overcapacity in the market. Excessive capacity not only results in wasted resources but also reduced load factors, further increasing carbon emission.
6. Numerical Analysis
Based on the above theoretical analysis, we next conduct numerical simulation analysis in this section to verify the above lemmas and propositions. We also try to explore the impact of different parameters under different scenarios, aiming to provide optimal strategies for carriers and the government. According to the extant literature [
33,
34], we set the following parameter assumptions:
,
, and
.
6.1. Optimal Price and Demand Analysis
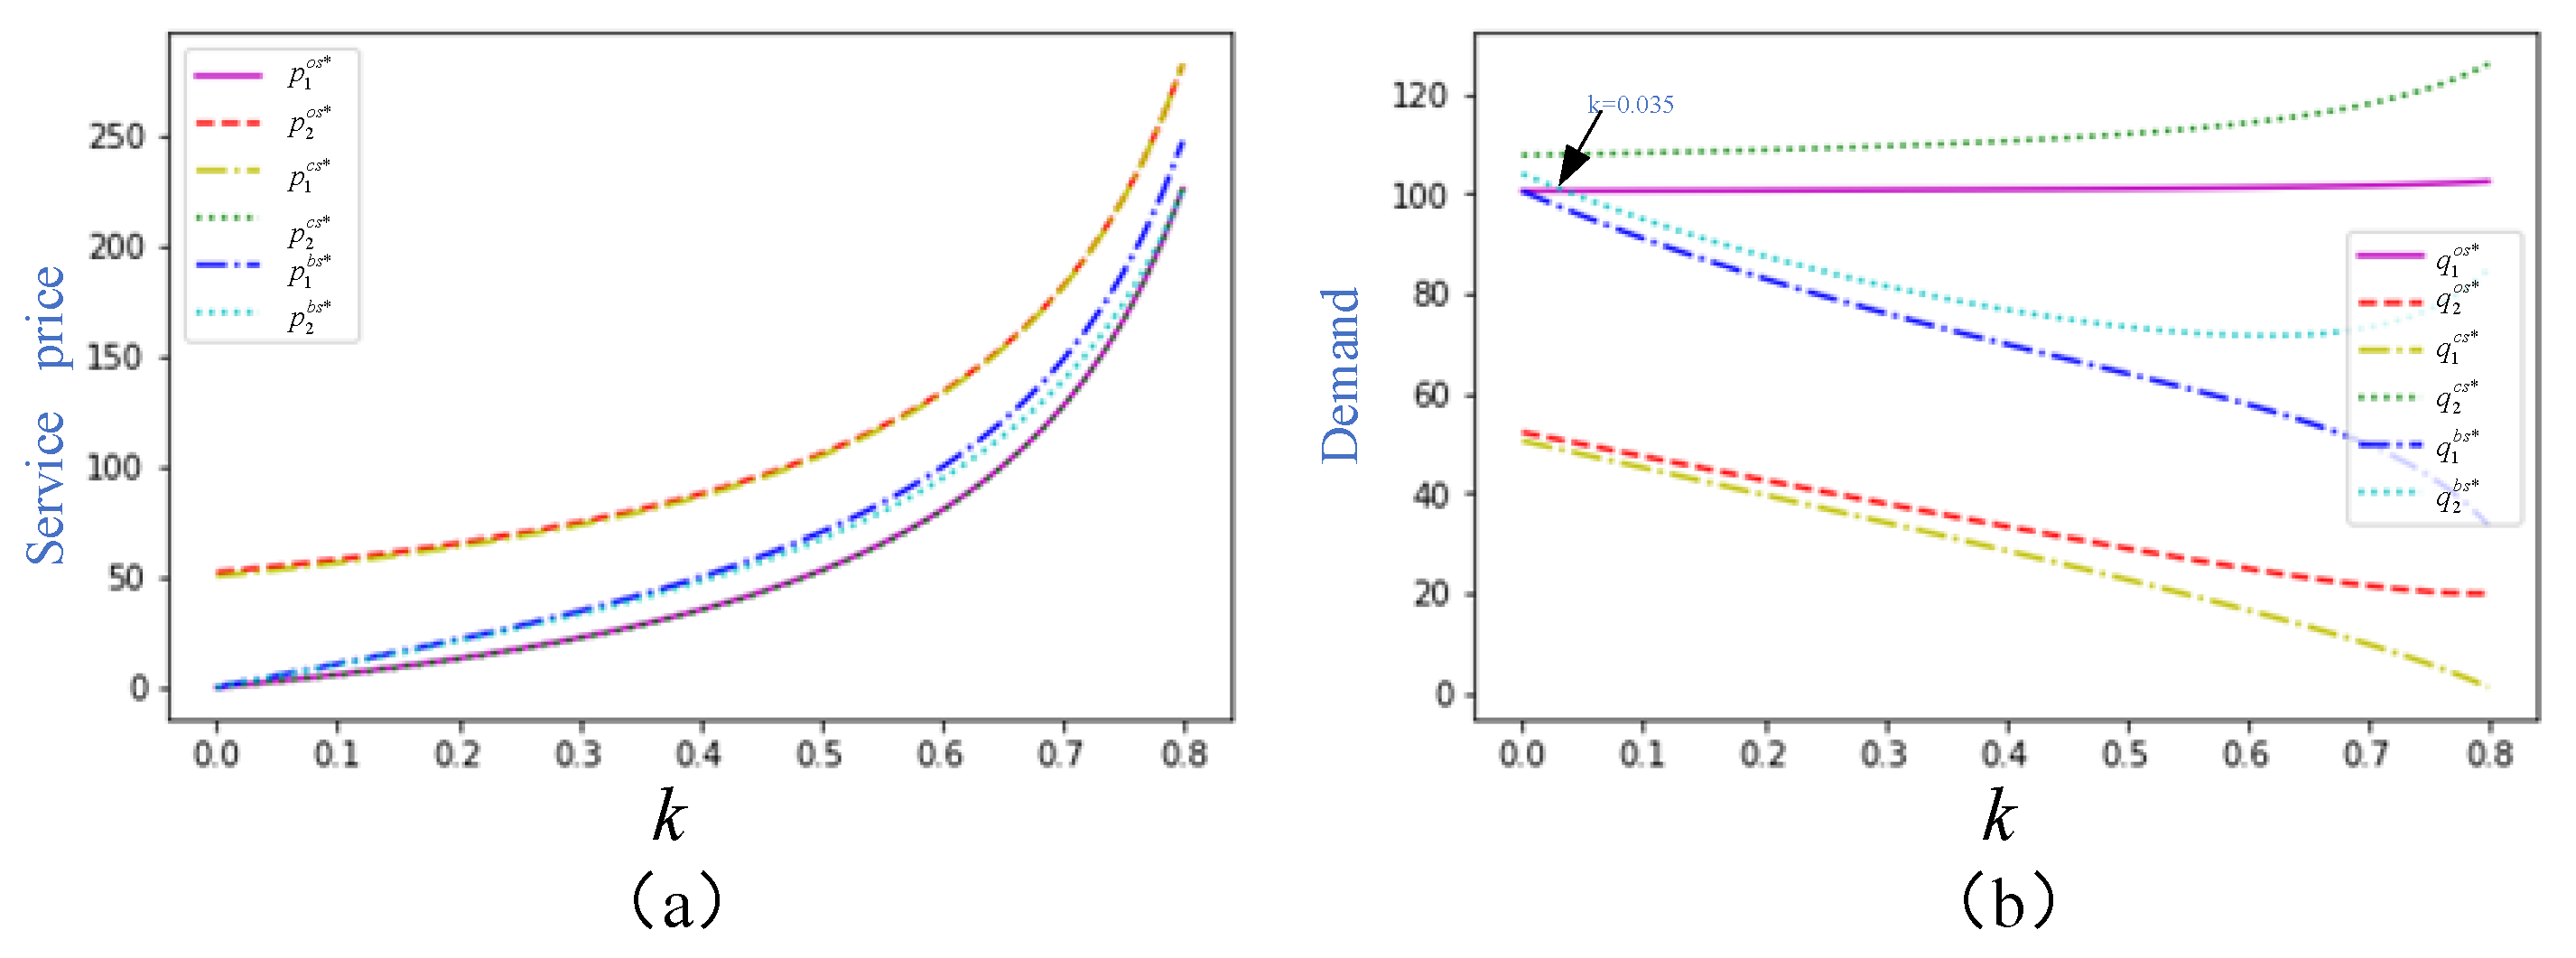
As the intensity of competition
increases, service prices across the different scenarios also rise. However, when
exceeds 0.5, the prices exhibit a sharp upward trend, as shown in
Figure 2a. The prices in Scenario CS for Carrier 1 and Carrier 2 in Scenario OS remain the highest, which is consistent with Proposition 1. This can be explained by the fact that, under the influence of subsidies, carriers are incentivized to invest in low-carbon technologies and enhance their services in order to attract shippers, which consequently leads to higher prices.
Additionally, as price competition intensifies, the demands for Carrier 1 in Scenario OS and Carrier 2 in Scenario CS gradually increases. In contrast, in Scenario BS, the demands for both carriers decline significantly. Similarly, in Scenario OS, the demand for Carrier 2 decreases sharply, while in Scenario CS, the demand for Carrier 1 declines sharply. Government subsidies may distort normal market competition, leading to some carriers relying on subsidies rather than focusing on improving service efficiency. This reliance diminishes their competitiveness in the market, which may ultimately result in a reduction in shipping volume.
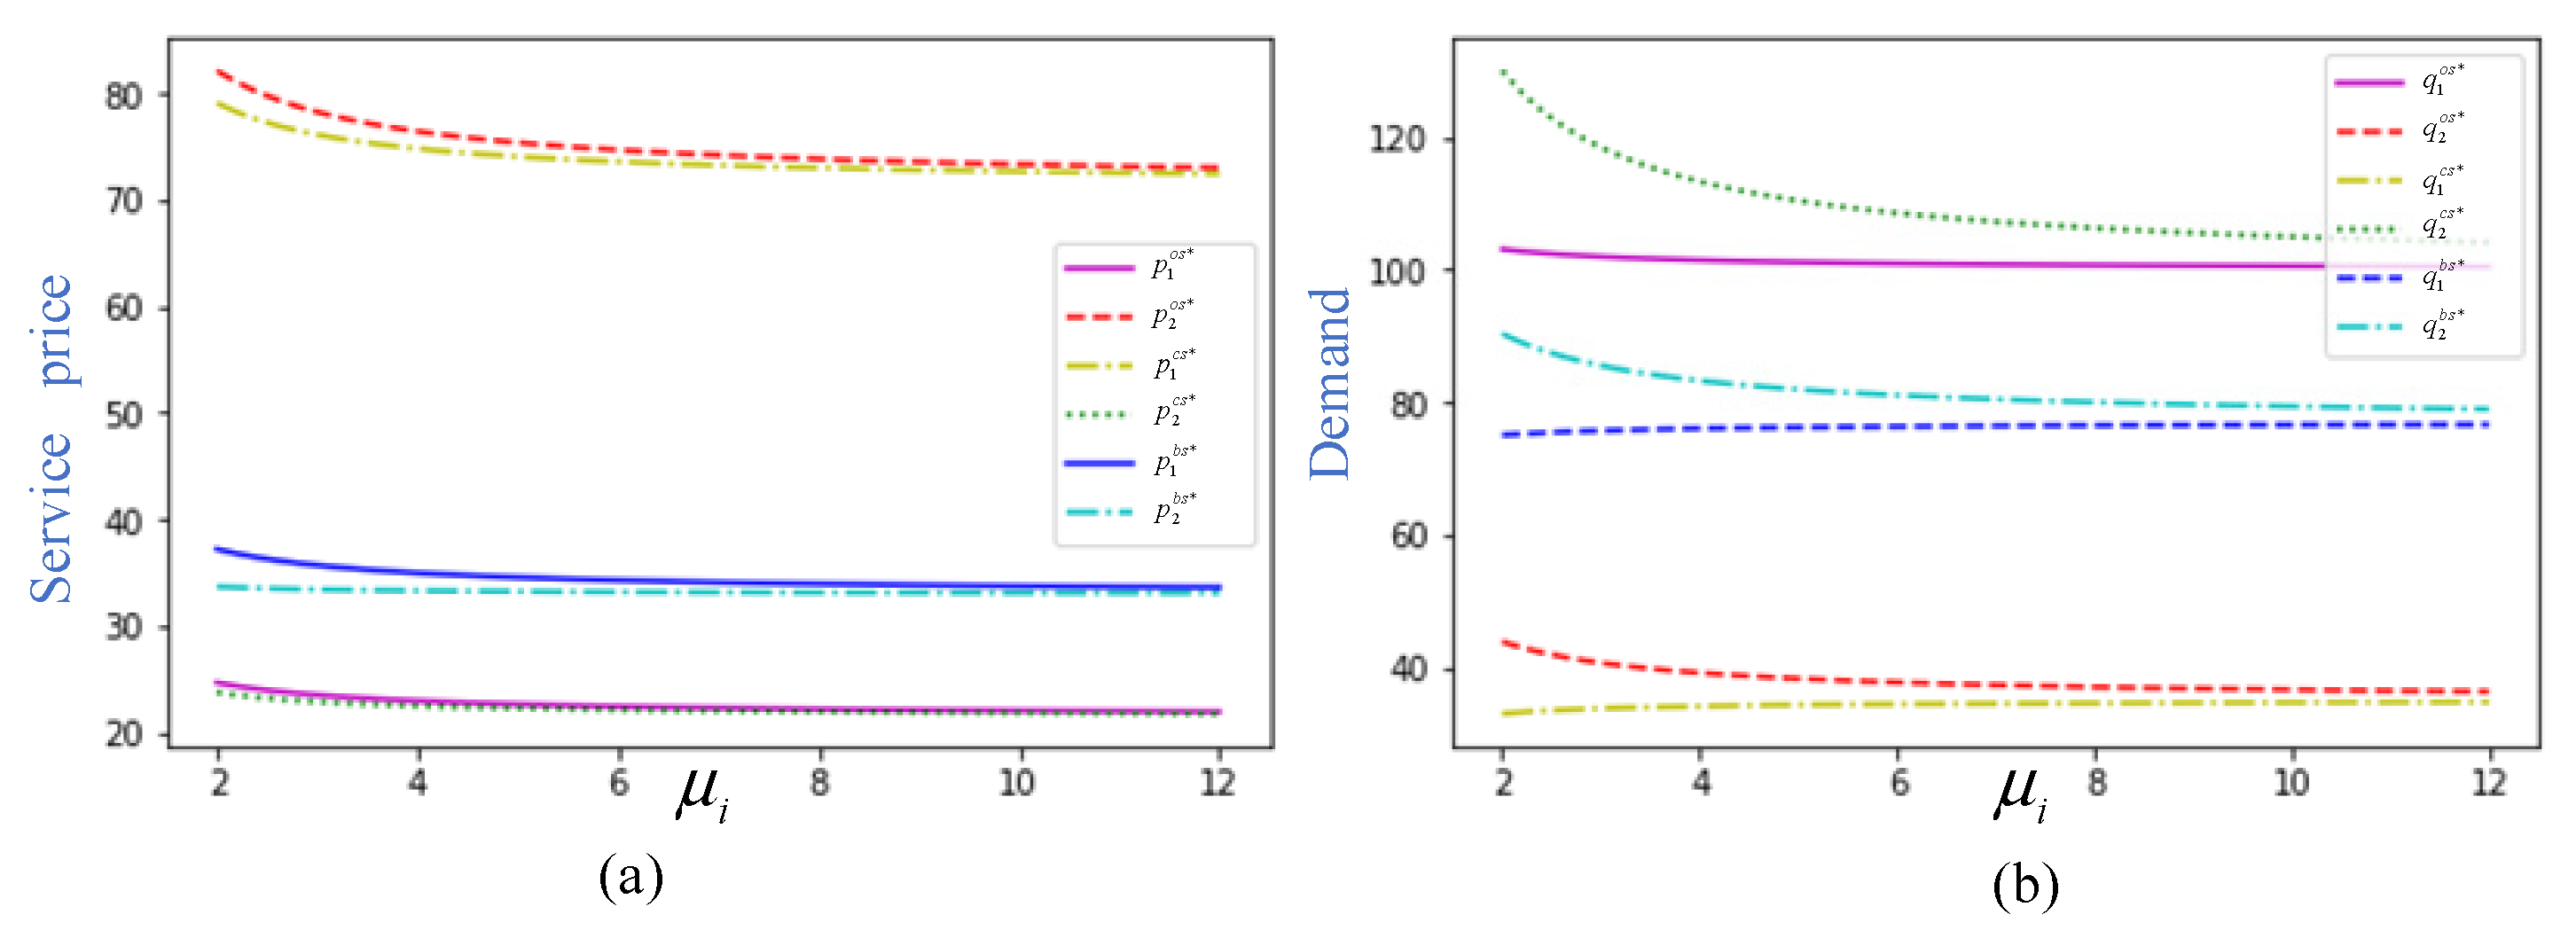
As illustrated in
Figure 3a, with
, an increase in the subsidy level
leads to a reduction in service prices, consistent with Proposition 1. All curves exhibit a gradual downward trend as the subsidy level
increases. However, service prices for Carrier 2 in Scenario OS and Carrier 1 in Scenario CS remain the highest, as both carriers are not subsidized. This pattern can be attributed to the fact that subsidies generally lower carriers’ operating costs, enabling them to invest in decarbonization efforts, which in turn results in reduced service prices.
Only the demand for Carrier 2 in Scenario CS declines rapidly, as the subsidy level is below 4. Moreover, as increases and approaches 12, all curves decrease more gradually. Government subsidies help reduce carriers’ operational costs, enabling them to improve transportation services, which intensifies price competition. To maintain profitability, however, carriers may reduce their transport volumes by cutting prices. In such cases, subsidies could lead to a reduction in overall market volume, as carriers may cut back on the services they offer in an effort to preserve profitability.
6.2. Optimal Profit and Social Welfare Analysis
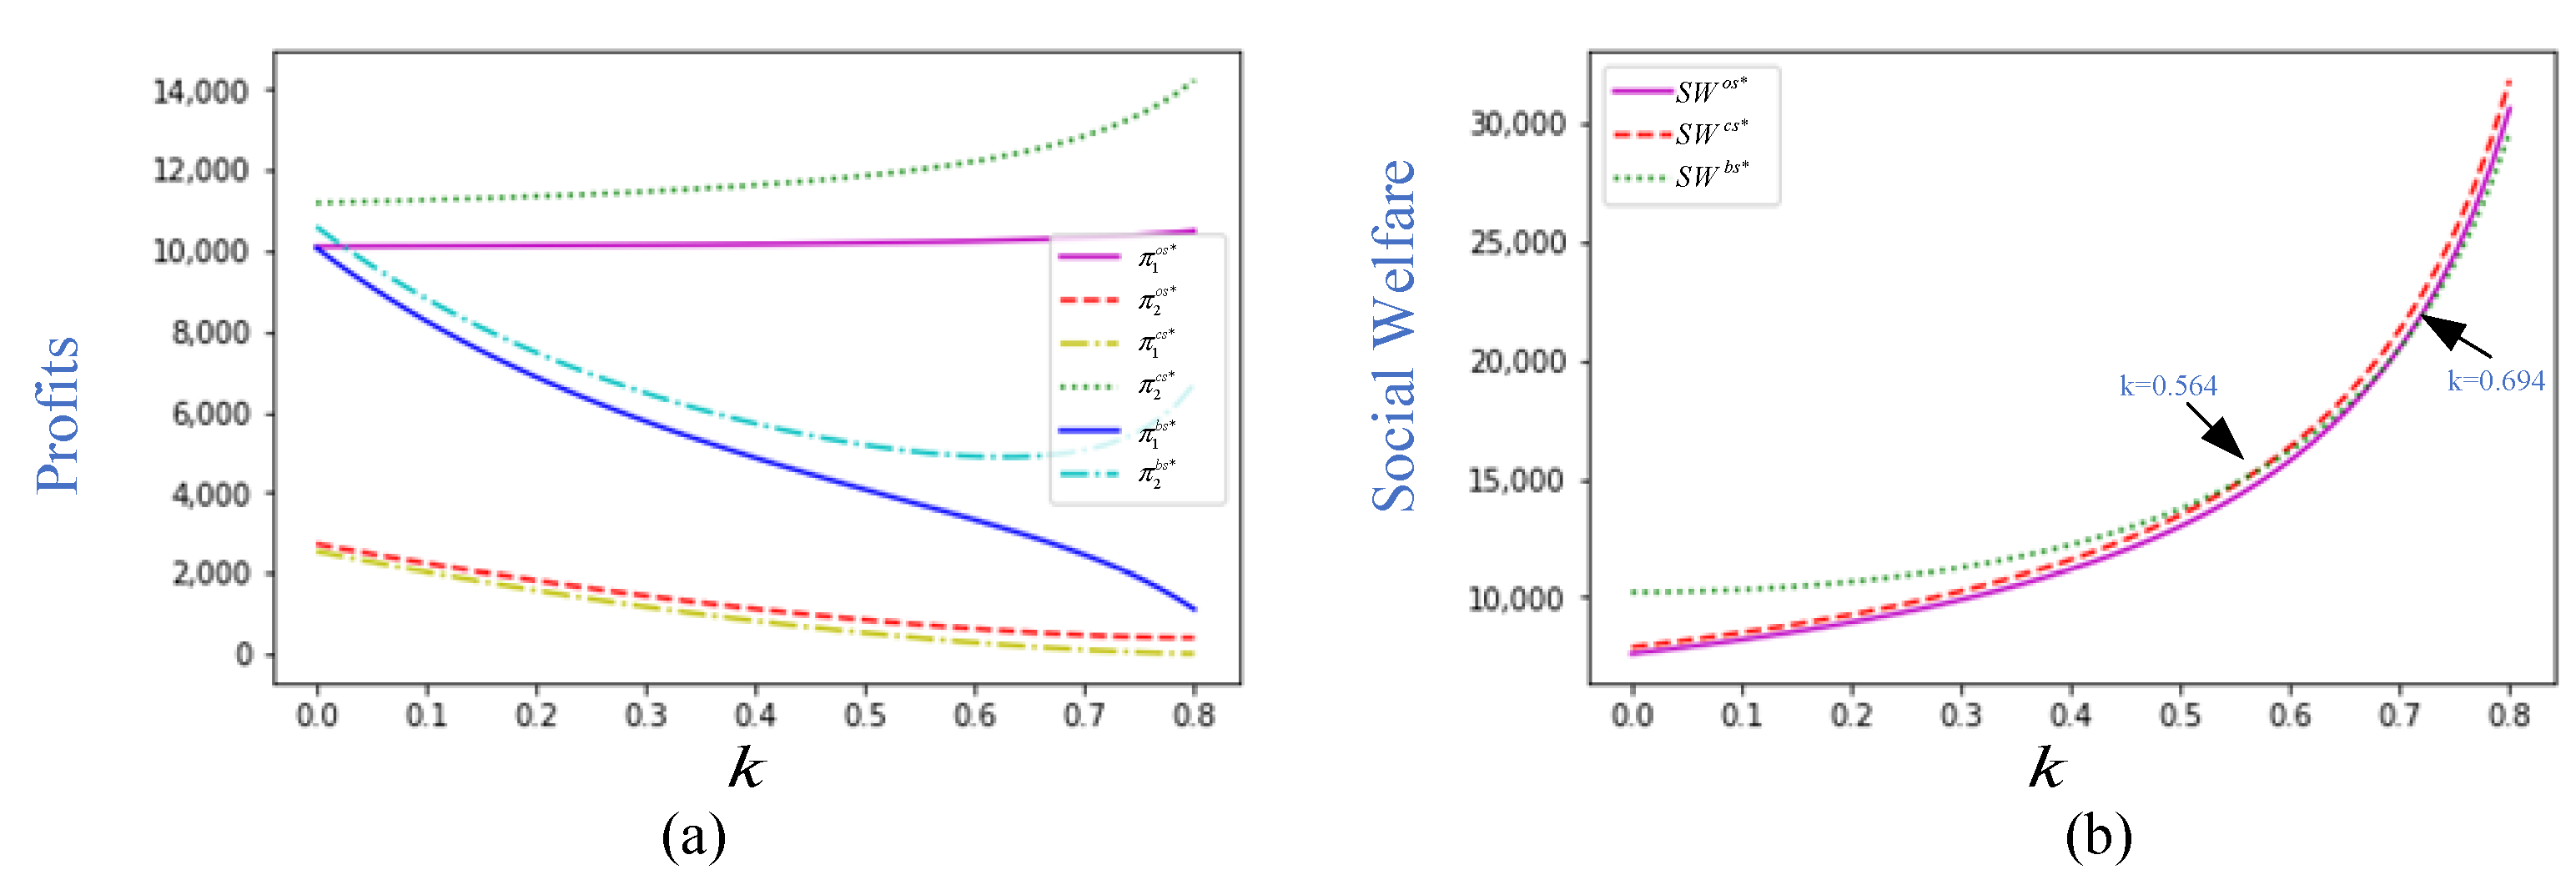
Figure 4a illustrates the profit dynamics for carriers under different scenarios with intensified competition. The profit curves for Carrier 1 in Scenario OS and Carrier 2 in Scenario CS show an upward trend as competition increases. In contrast, in Scenario BS, both carriers experience a sharp decline, while the curves for Carrier 2 in Scenario OS and Carrier 1 in Scenario CS exhibit a more gradual downward trend, consistent with Proposition 2. This pattern can be attributed to the fact that intensified competition may prompt carriers to adopt measures to reduce carbon emissions and improve service quality, which, in turn, leads to a decline in profits.
As competition intensity increases, the social welfare curves under different scenarios also rise, as depicted in
Figure 4b. When
is below 0.694, social welfare in Scenario OS is the lowest. While
is greater than 0.564, social welfare in Scenario CS remains the highest. When
is between 0.564 and 0.694, social welfare in Scenario BS is significantly higher than in Scenario OS. This is in line with Proposition 3. The variation can be attributed to the fact that carriers adopting greener technologies contribute to higher social welfare by reducing environmental harm, thereby influencing overall social welfare outcomes.
In
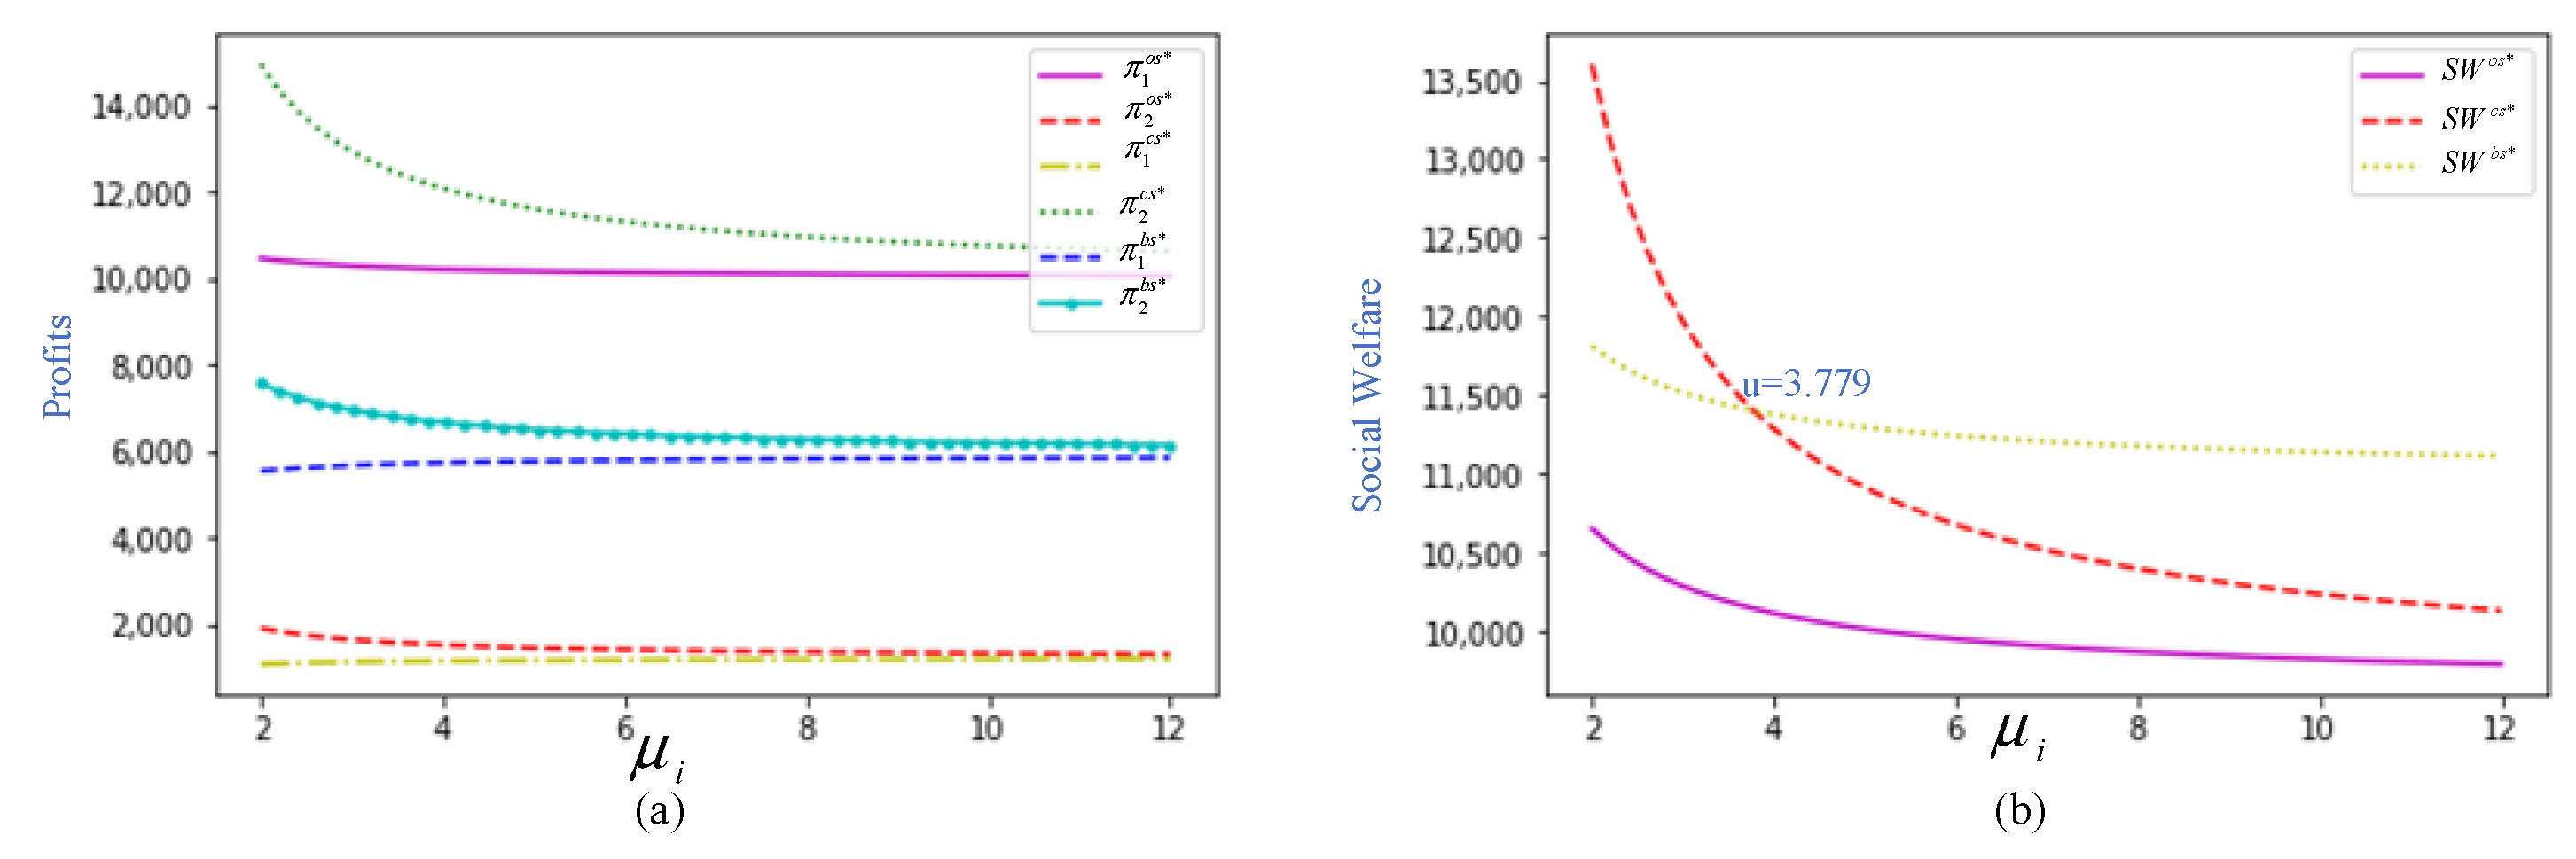
Figure 5a, we observe that with the increase in subsidies, profit exhibits varying trends. As subsidy level
increases, there are much higher profits for Carrier 2 in Scenario CS as well as Carrier 1 in Scenario OS, due to the receipt of subsidies. In contrast, other profits remain relatively stable with the increase in subsidies, which can offset the costs of environmental investments. Subsidies primarily offset operational costs, which could lead to a loss of customers or reduced demand, ultimately affecting profit levels.
As illustrated in
Figure 5b, social welfare decreases across all three scenarios as
increases. For Scenario CS, social welfare declines sharply as the subsidy increases. In both Scenarios BS and OS, the decline in social welfare is relatively modest. When the subsidy level is below 3.779, social welfare in Scenario CS remains the highest; after this threshold, social welfare in Scenario BS becomes the highest, as both carriers receive subsidies. Long-term subsidies may impose a significant burden on the government, potentially leading to technological stagnation and a subsequent reduction in overall social welfare.
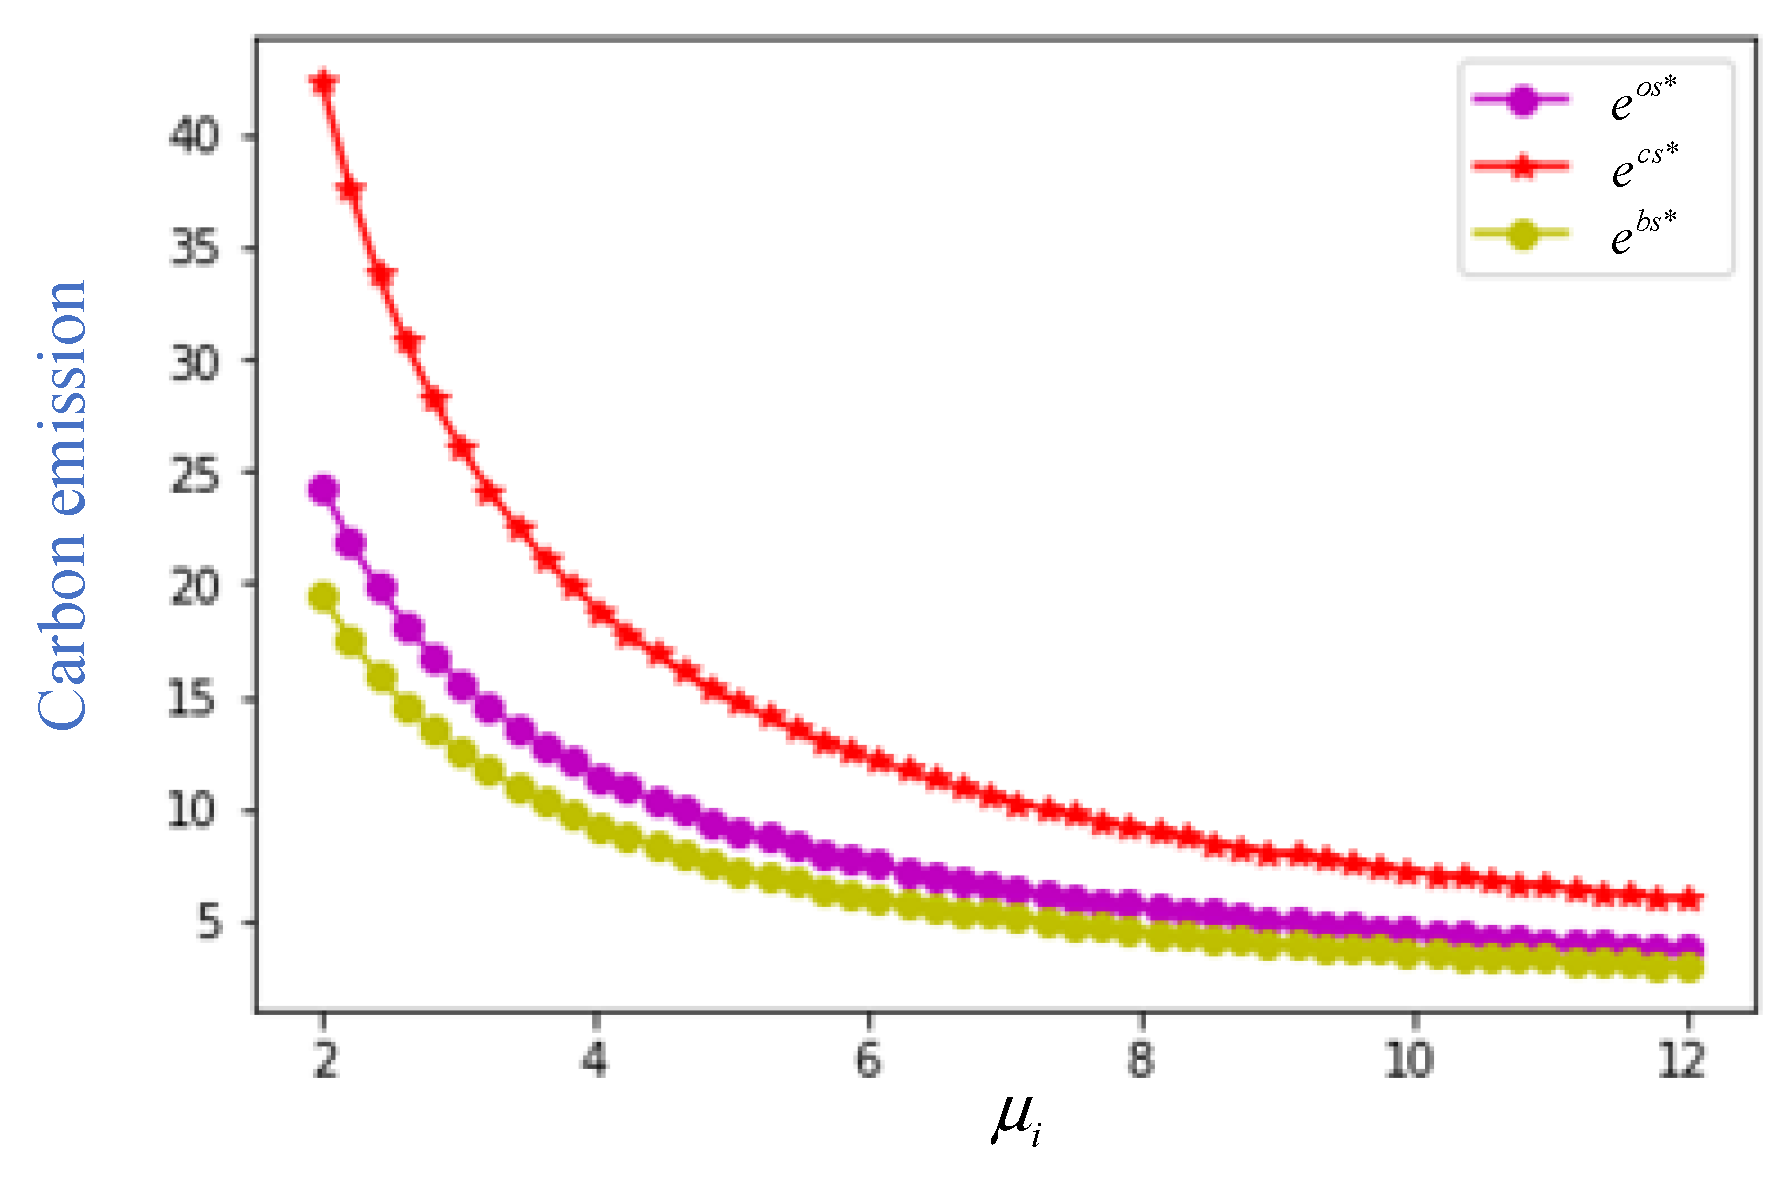
6.3. Optimal Carbon-Emission Analysis
Figure 6 clearly demonstrates the negative correlation between government subsidies and carbon emissions. As the subsidy level increases, carbon emissions gradually decrease. When the subsidy level is below 6, all curves exhibit a significant decline in emissions. Beyond this threshold, the downward trend becomes more moderate. This pattern can be attributed to the fact that government subsidies incentivize carriers to adopt environmentally friendly technologies and practices. These technological advancements lead to a reduction in harmful gas emissions, thereby mitigating environmental pollution and contributing to sustainable development within the maritime supply chain sector.
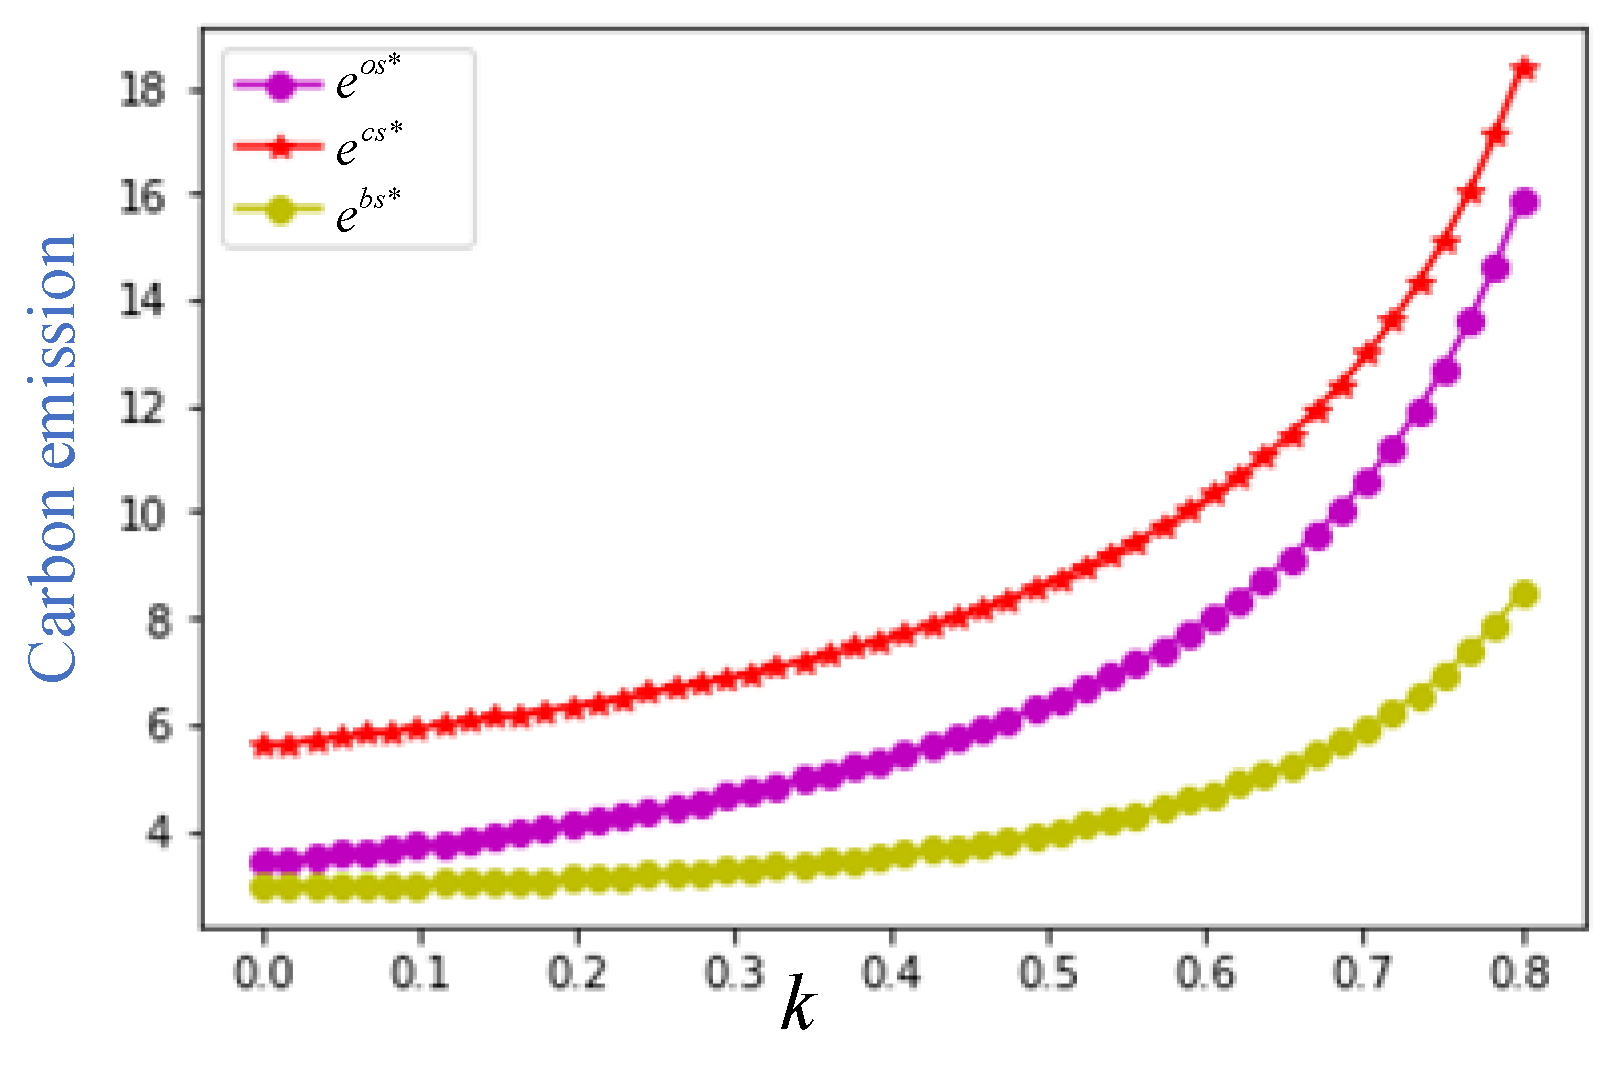
Figure 7 illustrates that under the three different scenarios, competition among carriers can result in increased carbon emissions. In the initial stage, all curves show a gradual upward trend. However, once the value surpasses 0.7, a sharp rise in emissions becomes evident across all scenarios. Notably, carbon emissions remain the highest in Scenario CS and thus relatively lower in the other scenarios, in alignment with Proposition 4. This phenomenon can be attributed to fierce price competition, which compels carriers to prioritize short-term market share over long-term sustainability. As a consequence, carriers may adopt operational models and technological choices that are misaligned with decarbonization objectives, ultimately exacerbating carbon emission. These findings underscore the need for regulatory interventions and incentive mechanisms to promote greener competition in the maritime supply chain sector.
6.4. Analysis of the Impact of Shippers’ Green Preferences
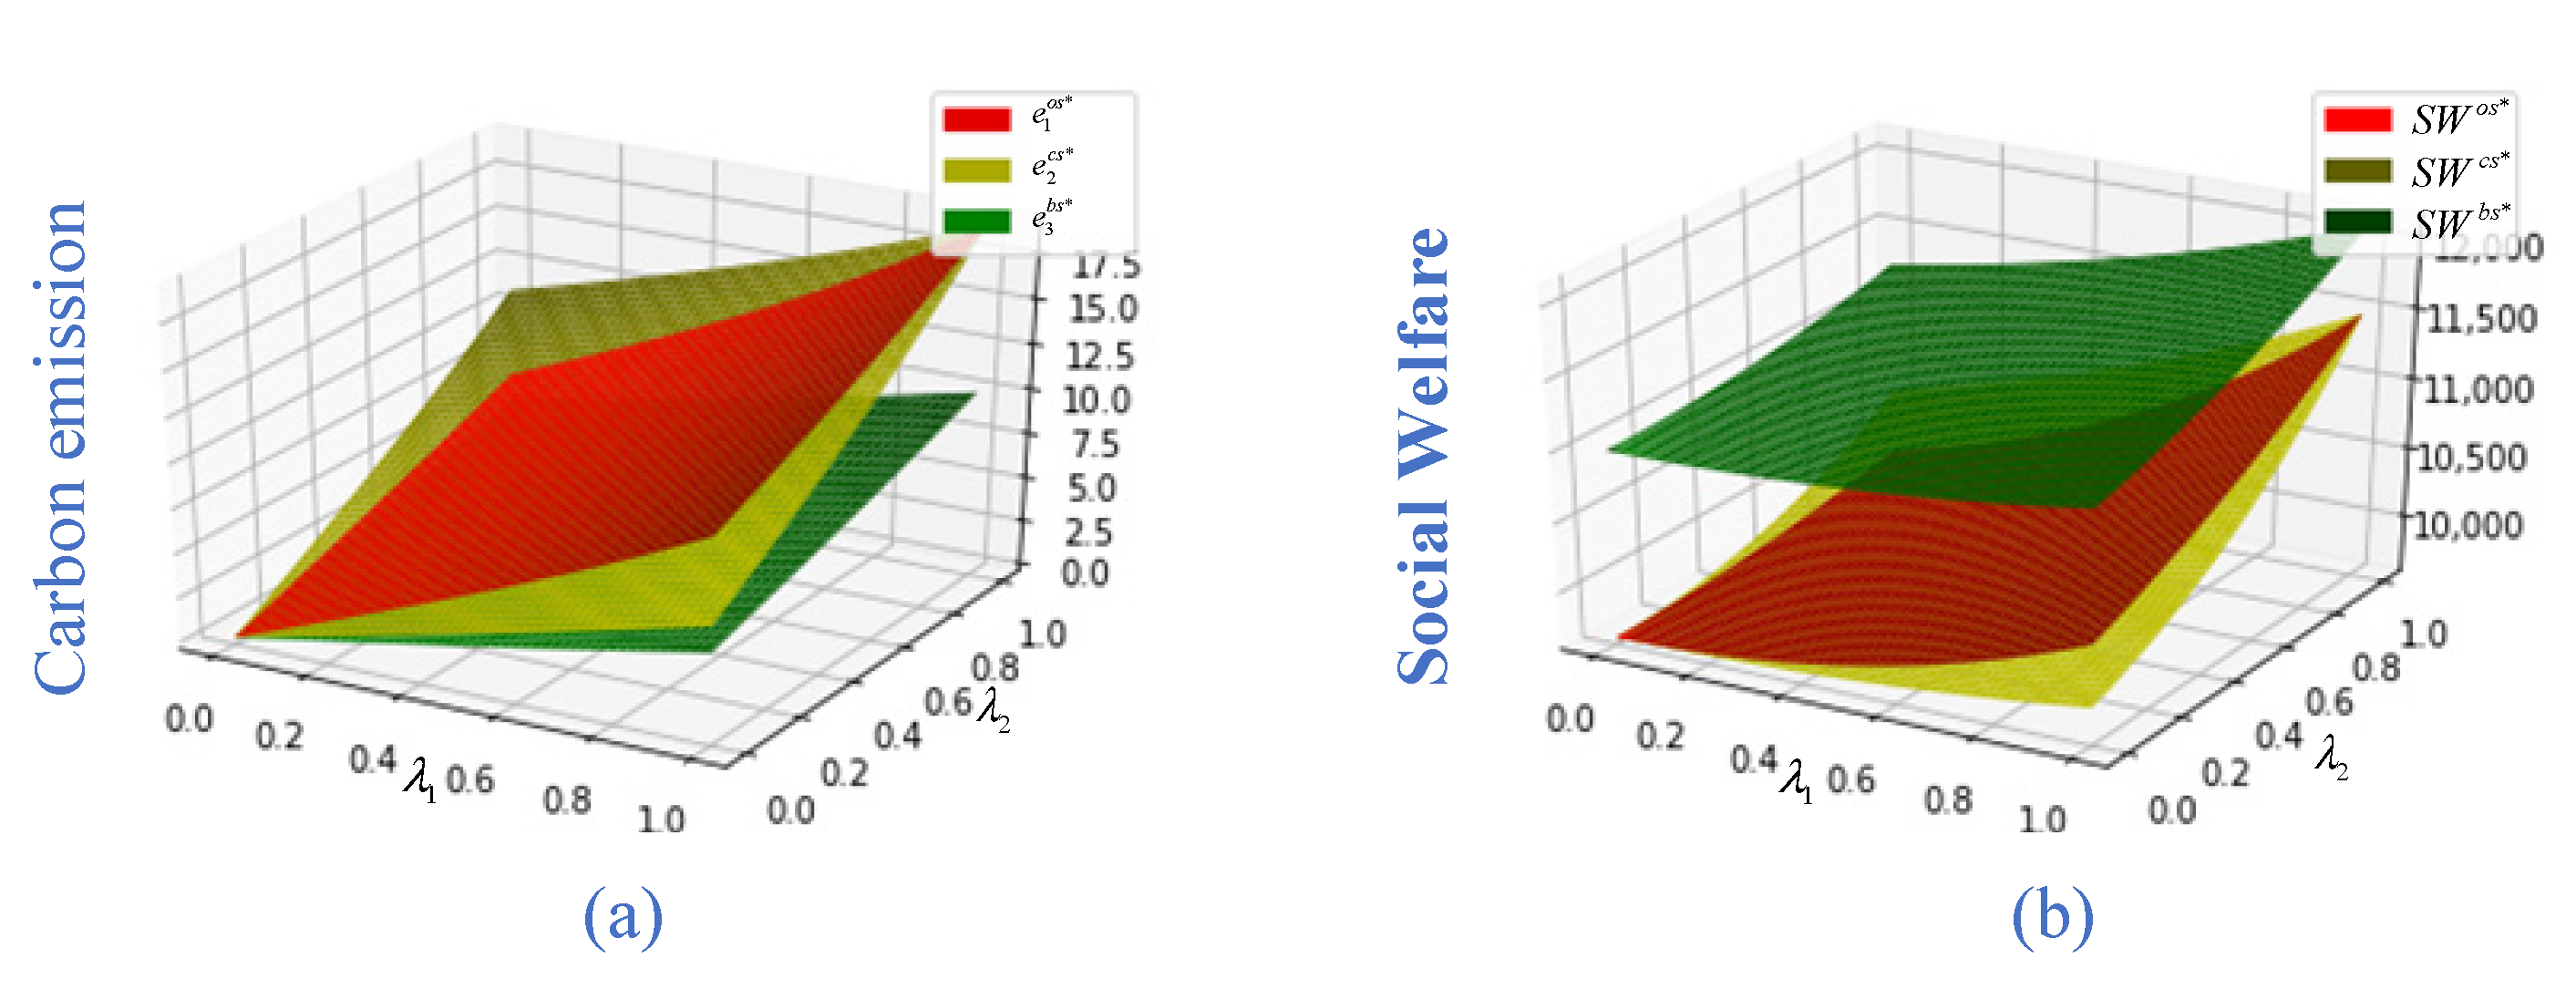
Shippers are increasingly prioritizing environmental protection and demonstrating a preference for carriers that offer more sustainable services combined with faster delivery times. This shift in demand places pressure on carriers to increase sailing speeds, which, while meeting service expectations, also leads to higher fuel consumption and, consequently, increased carbon emissions, as depicted in
Figure 8a.
Figure 8b further illustrates that, as environmental awareness among shippers rises, all curves exhibit an upward trend. This can be attributed to carriers adopting environmentally conscious operational measures. These actions contribute to reducing environmental impact while enhancing social welfare. The findings underscore the complex trade-off between operational efficiency and environmental sustainability, highlighting the critical role of innovation and policy incentives in achieving a balance between the two.
As illustrated in
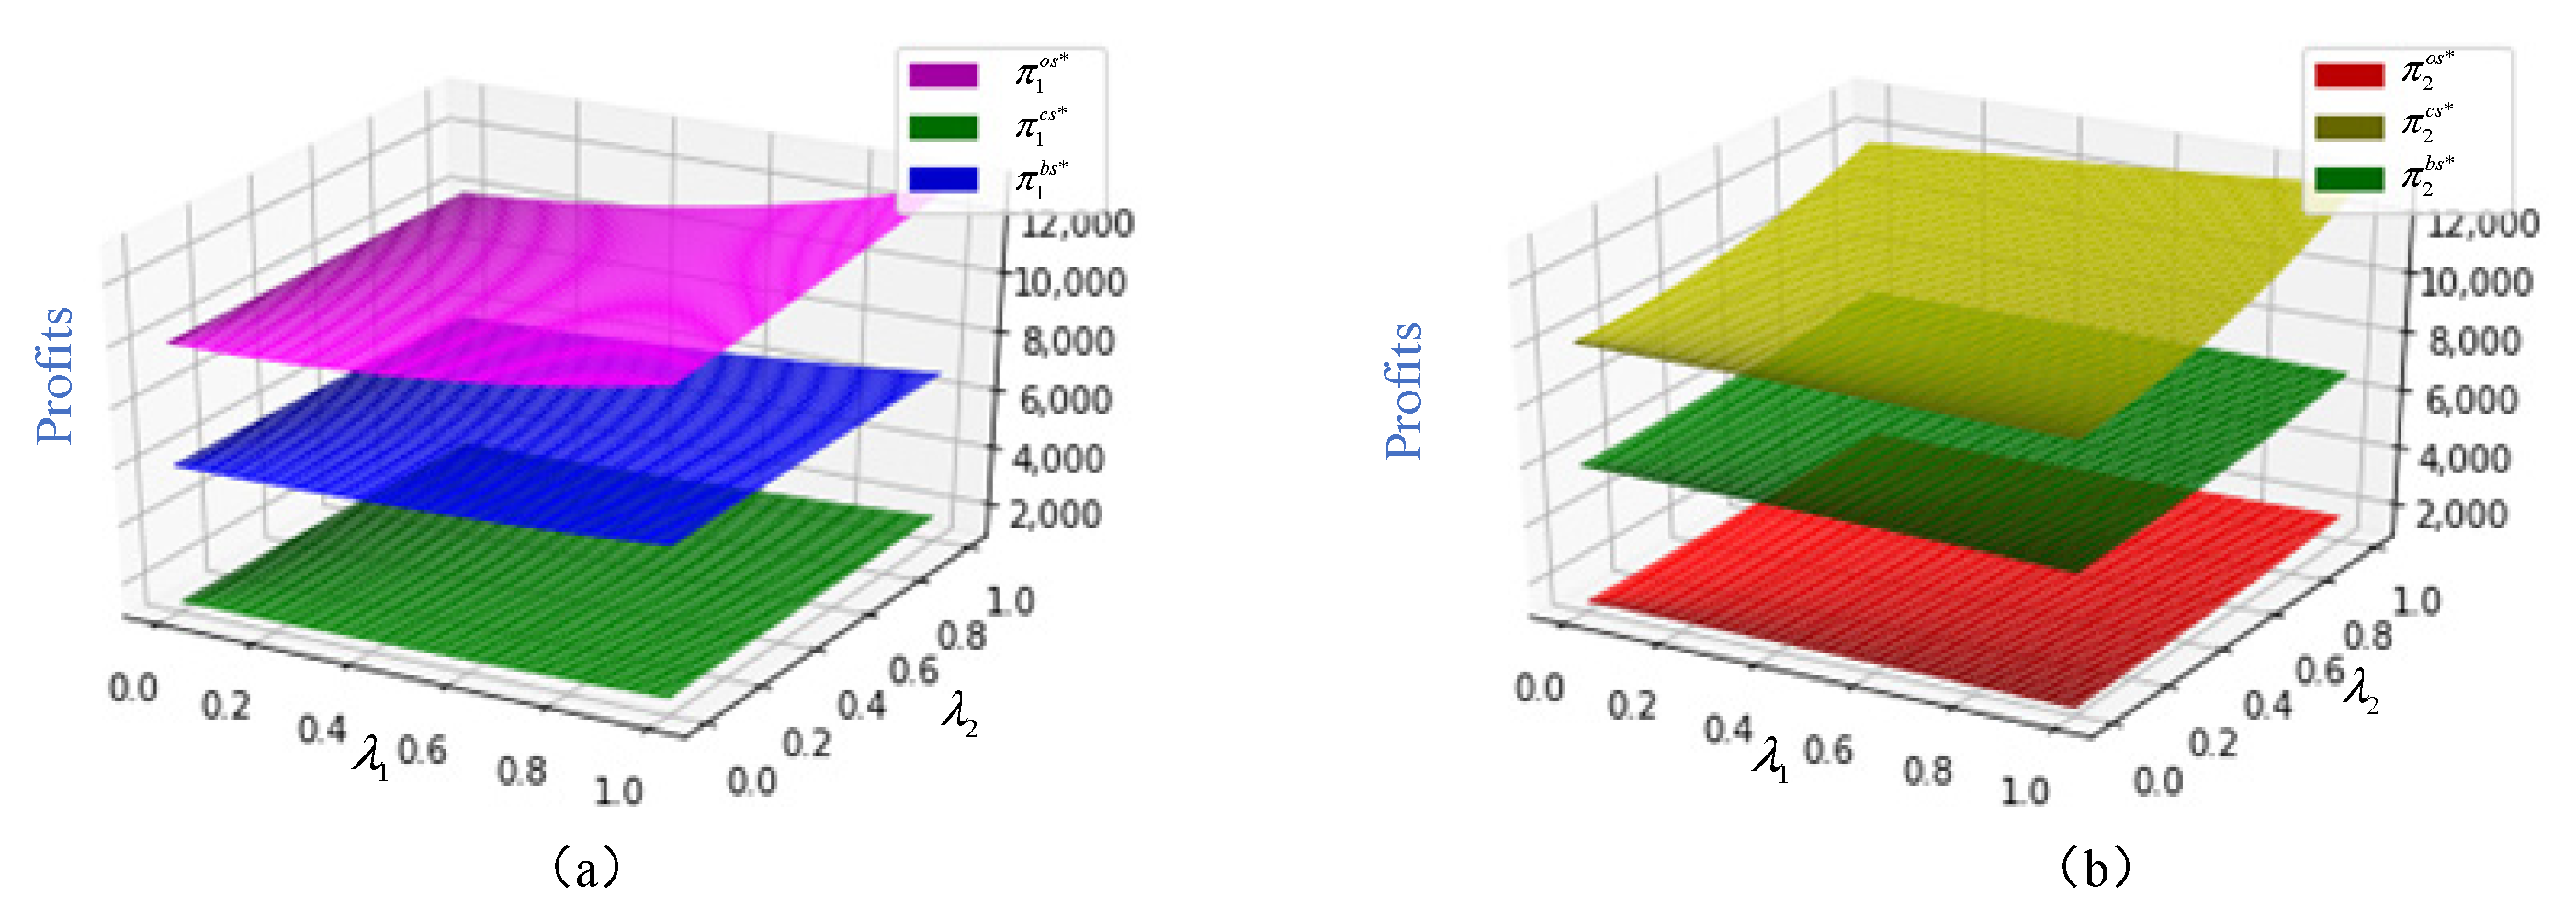
Figure 9, an increase in shippers’ green preferences positively impacts carriers’ profits across different scenarios. In competitive markets, carriers offering green transport options are more likely to secure contracts, thereby increasing their market share and revenue. Furthermore, government subsidies for green transportation provide additional financial incentives, indirectly benefiting carriers. The shift toward eco-friendly practices driven by shippers’ preferences is aligned with policy incentives, further enhancing carriers’ profitability. Additionally, shippers with strong environmental preferences may be willing to pay premium prices for green services, further contributing to growth of carriers’ revenue.
7. Discussion and Conclusions
7.1. Main Findings and Managerial Implications
Carriers play a crucial role in addressing global climate change and protecting marine ecosystems. However, transitioning to low-carbon technologies needs a huge investment for carriers, but they are reluctant to make the shift. Government incentives are a very efficient tool that can be used to help carriers invest in carbon emission reduction through low-carbon technologies. Additionally, while carriers also compete in price to attract more and more shippers, they also want to make profits through transportation services, which is the main focus of shippers. In this paper, we considered a maritime supply chain consisting of shippers, two price-competitive carriers, a port, and the government. Different models were constructed under three scenarios, in which profits of different partners and social welfare were evaluated. The impact of the competition, subsidy strategy, and green preferences on service prices, demand, profits, and social welfare were also discussed. Additionally, we conducted numerical analysis to verify the effectiveness of the model.
Firstly, the results demonstrate that increased competitive intensity between carriers can lead to higher carbon emissions in maritime supply chains, with the highest emissions observed in Scenario CS. The findings highlight that under fierce competition, carriers may prioritize cost efficiency and service speed at the expense of environmental considerations, thereby increasing the use of carbon-intensive practices. The result underscores the importance of regulatory interventions and collaborative strategies to encourage green technology adoption and sustainable operations. Mechanisms for balancing competition and environmental sustainability should be carefully designed to encourage collaboration among carriers, in addition to considering the role of policy incentives in mitigating carbon emissions.
Secondly, we found that intensified competition increases prices and social welfare in all examined scenarios but may lead to a decline in demand and profits under certain conditions. The rise in prices, driven by competitive pressure and strategic decision-making, can negatively affect demand elasticity, ultimately reducing market size and operational revenues. In addition, carriers may face shrinking profit margins, which limits their capacity to invest in operational improvements or adopt sustainable technologies. This dynamic highlights the complexity of trade-offs between fostering competitive markets and maintaining stable demand and profitability within maritime supply chains.
Thirdly, we examined the effectiveness of governmental subsidies in reducing carbon emissions across all scenarios. The results indicate that government subsidies play a crucial role in incentivizing carriers to adopt environmentally friendly technologies and operational practices. By reducing the financial burden associated with green investments, subsidies can encourage carriers to transition toward low-carbon alternatives and improve overall environmental performance. Moreover, targeted financial support can help mitigate the adverse effects of intense market competition on green innovation. Therefore, policymakers should design well-structured subsidy schemes that not only promote carbon emission abatement but also enhance the competitiveness and sustainability of maritime supply chains.
Finally, our numerical analysis demonstrates that different green preferences from shippers have a positive impact on carbon emission, social welfare, and profits in Scenarios OS, CS, and BS. Specifically, when shippers exhibit a stronger preference for environmentally friendly transportation, carriers are incentivized to adopt green technologies and implement sustainable practices to meet market demand. This shift not only contributes to carbon emission reductions but also enhances social welfare by promoting environmental awareness and sustainable consumption patterns. Furthermore, carriers that adapt to these preferences can achieve a competitive advantage, which leads to increased profitability. These findings highlight the critical role of shippers’ green preferences in driving sustainability in maritime supply chains.
The findings of our study provide valuable insights for carriers and shipping companies in selecting appropriate carbon emissions strategies when competing on price. The results highlight the importance of balancing competitive pricing with sustainable practices to achieve both economic and environmental objectives. Additionally, the results of our study offer guidance for governments in designing optimal subsidy policies to encourage greener practices in the shipping industry. These findings have managerial implications for policymakers, highlighting the importance of targeted financial incentives and regulatory frameworks that balance economic performance with environmental goals.
7.2. Limitations and Future Research
Our study also has some limitations, namely that it primarily focuses on the impact of government subsidies on carriers under price competition and environmentally conscious shippers. However, when carriers compete in both service and price, the effectiveness of government subsidies in reducing carbon emissions needs to be further investigated and thus remains an area for future research. In addition, the role of subsidies directed toward ports and forwarders in the context of carriers’ price-and-service competition can be discussed. Such subsidies can influence the operational decisions of all maritime supply chain partners, potentially creating synergies or conflicts in achieving both competitive and environmental objectives. Additionally, examining the potential synergies or conflicts between competitive and environmental goals could provide deeper insights into how subsidies can be structured to maximize both economic and environmental benefits. Finally, exploring the long-term effects of subsidy policies on the sustainability of the maritime industry, including the adoption of green technologies and practices, would further enhance the understanding of the policy implications.
Author Contributions
Conceptualization, L.Y.; methodology, L.Y.; software, F.L.; validation, Y.H.; formal analysis, L.Y.; writing—original draft preparation, L.Y.; writing—review and editing, L.Y.; supervision, Y.H. All authors have read and agreed to the published version of the manuscript.
Funding
This research was funded by GUAT Special Research Project on the Strategic Development of Distinctive Interdisciplinary Fields (TS2024211) and Guangxi Philosophy and Social Sciences Research Project (21FGL025,23FYJ52).
Institutional Review Board Statement
Not applicable.
Informed Consent Statement
Not applicable.
Data Availability Statement
Data are available from the authors upon reasonable request.
Conflicts of Interest
The authors declare no conflicts of interest.
Appendix A
Proof of Lemma 1. Using the back induction method, we firstly substitute
and
into the social welfare function (8). Taking the second-order partial derivatives of
, the Hessian matrix
on (
) can be written as follows:
With
, we have
Which means that is negative and jointly concave on ,, and , so the optimal results, , , , and can be derived. Additionally, let , , and ; then, we can obtain and . Accordingly, ,,, , and can be obtained. □
Proof of Lemma 2. Taking the second-order partial derivatives of
on (
) yields
When
, we have
Which means that is negative and jointly concave on ().
Let , , and ; then, we can derive the following optimal results , and .
Let , , and ; then, and can be obtained. Hence, we can obtain and . □
Proof of Lemma 3. By solving the second-order partial derivatives, the Hessian matrix of
on
,
, and
can be written as follows:
When
, we have
Which means that is negative and jointly concave on ().
Let , , , and ; then, we can obtain , , , , , , , , , and . □
Proof of Proposition 1. With
,
, and
, we can obtain
Thus, Proposition 1 is proven. □
Proof of Proposition 2. With
,
, and
, we can derive
Thus, Proposition 2 is proven. □
Proof of Proposition 3. Therefore, Proposition 3 is proven. □
Proof of Proposition 4. With
,
, and
, we can derive
Thus, Proposition 4 is proven. □
References
- Wang, C.; Jiao, Y.; Peng, J. Shipping company’s choice of shore power or low sulfur fuel oil under different power structures of maritime supply chain. Marit. Policy Manag. 2024, 51, 1423–1442. [Google Scholar] [CrossRef]
- Liu, P.; Xu, Y.; Xie, X.; Turkmen, S.; Fan, S.; Ghassemi, H.; He, G. Achieving the global net-zero maritime shipping goal: The urgencies, challenges, regulatory measures and strategic solutions. Ocean Coast. Manag. 2024, 256, 107301. [Google Scholar] [CrossRef]
- Planakis, N.; Papalambrou, G.; Kyrtatos, N. Predictive power-split system of hybrid ship propulsion for energy management and emissions reduction. Control Eng. Pract. 2021, 111, 104795. [Google Scholar] [CrossRef]
- Huang, X.; Liu, G.; Zheng, P. Dynamic analysis of a low-carbon maritime supply chain considering government policies and social preferences. Ocean Coast. Manag. 2023, 239, 106564. [Google Scholar] [CrossRef]
- Xue, Y.; Lai, K.H. Role of carbon emission linked financial leasing in shipping decarbonization. Marit. Policy Manag. 2023, 17, 1–21. [Google Scholar] [CrossRef]
- Wang, W.; Wang, S.; Zhen, L. Optimal subsidy design for energy generation in ship berthing. Marit. Policy Manag. 2024, 51, 1824–1837. [Google Scholar] [CrossRef]
- Jiao, Y.; Wang, C. Shore power vs low sulfur fuel oil: Pricing strategies of carriers and port in a transport chain. Int. J. Low-Carbon Technol. 2021, 16, 715–724. [Google Scholar] [CrossRef]
- Wang, J.; Zhu, W. Analyzing the development of competition and cooperation among ocean carriers considering the impact of carbon tax policy. Transp. Res. Part E Logist. Transp. Rev. 2023, 175, 103157. [Google Scholar] [CrossRef]
- Yang, L.; Lin, X.; Li, E.Y.; Tavasszy, L. Lock congestion relief in a multimodal network with public subsidies and competitive carriers: A two-stage game model. IEEE Access 2023, 11, 43707–43719. [Google Scholar] [CrossRef]
- Liu, J.; Wang, J. Carrier alliance incentive analysis and coordination in a maritime transport chain based on service competition. Transp. Res. Part E Logist. Transp. Rev. 2019, 128, 333–355. [Google Scholar] [CrossRef]
- Lai, X.; Tao, Y.; Wang, F.; Zou, Z. Sustainability investment in maritime supply chain with risk behavior and information sharing. Int. J. Prod. Econ. 2019, 218, 16–29. [Google Scholar] [CrossRef]
- Fan, L.; Yu, Y.; Yin, J. Impact of Sulphur Emission Control Areas on port state control’s inspection outcome. Marit. Policy Manag. 2023, 50, 908–923. [Google Scholar] [CrossRef]
- Wang, H.; Wang, C.; Li, M.; Xie, Y. Blockchain technology investment strategy for shipping companies under competition. Ocean Coast. Manag. 2023, 243, 106696. [Google Scholar] [CrossRef]
- Li, Z.; Wang, L.; Wang, G.; Xin, X.; Chen, K.; Zhang, T. Investment and subsidy strategy for low-carbon port operation with blockchain adoption. Ocean Coast. Manag. 2024, 248, 106966. [Google Scholar] [CrossRef]
- Alamoush, A.S.; Ölçer, A.I.; Ballini, F. Port greenhouse gas emission reduction: Port and public authorities’ implementation schemes. Res. Transp. Bus. Manag. 2022, 43, 100708. [Google Scholar] [CrossRef]
- Song, Z.; Tang, W.; Zhao, R.; Zhang, G. Implications of government subsidies on shipping companies’ shore power usage strategies in port. Transp. Res. Part E Logist. Transp. Rev. 2022, 165, 102840. [Google Scholar] [CrossRef]
- Zhen, L.; Wang, W.; Lin, S. Analytical comparison on two incentive policies for shore power equipped ships in berthing activities. Transp. Res. Part E Logist. Transp. Rev. 2022, 161, 102686. [Google Scholar] [CrossRef]
- Balcombe, P.; Staffell, I.; Kerdan, I.G.; Speirs, J.F.; Brandon, N.P.; Hawkes, A.D. How can LNG-fuelled ships meet decarbonisation targets? An environmental and economic analysis. Energy 2021, 227, 120462. [Google Scholar] [CrossRef]
- Wang, X.; Zhang, S. The interplay between subsidy and regulation under competition. IEEE Trans. Syst. Man Cybern. Syst. 2022, 53, 1038–1050. [Google Scholar] [CrossRef]
- Liu, J.; Xu, H.; Lyu, Y. Emission reduction technologies for shipping supply chains under carbon tax with knowledge sharing. Ocean Coast. Manag. 2023, 246, 106869. [Google Scholar] [CrossRef]
- Alamoush, A.S.; Ölçer, A.I.; Ballini, F. Ports’ role in shipping decarbonisation: A common port incentive scheme for shipping greenhouse gas emissions reduction. Clean. Logist. Supply Chain 2022, 3, 100021. [Google Scholar] [CrossRef]
- Chen, S.; Zheng, S.; Sys, C. Policies focusing on market-based measures towards shipping decarbonization: Designs, impacts and avenues for future research. Transp. Policy 2023, 137, 109–124. [Google Scholar] [CrossRef]
- Tran, N.K.; Lam, J.S.L. CO2 emissions in a global container shipping network and policy implications. Marit. Econ. Logist. 2024, 26, 151–167. [Google Scholar] [CrossRef]
- Luo, C.; Zhou, Y.; Mu, M.; Zhang, Q.; Cao, Z. Subsidy, tax or green awareness: Government policy selection for promoting initial shore power usage and sustaining long-run use. J. Clean. Prod. 2024, 442, 140946. [Google Scholar] [CrossRef]
- Huang, X.; Zheng, P.; Liu, G. Non-cooperative and Nash-bargaining game of a two-parallel maritime supply chain considering government subsidy and forwarder’s CSR strategy: A dynamic perspective. Chaos Solitons Fractals 2024, 178, 114300. [Google Scholar] [CrossRef]
- Wang, M.; Tan, Z.; Du, Y. Coordinating inland river ports through optimal subsidies from the container shipping carrier. Transp. Res. Part E Logist. Transp. Rev. 2024, 189, 103671. [Google Scholar] [CrossRef]
- Xie, F.; Wang, C. Privileged or ordinary carrier: Strategic choice in a competitive environment. Marit. Policy Manag. 2024, 51, 240–258. [Google Scholar] [CrossRef]
- Gao, J.; Xiao, Z.; Wei, H.; Zhou, G. Dual-channel green supply chain management with eco-label policy: A perspective of two types of green products. Comput. Ind. Eng. 2020, 146, 106613. [Google Scholar] [CrossRef]
- Zhang, C.; Liu, Y.; Han, G. Two-stage pricing strategies of a dual-channel supply chain considering public green preference. Comput. Ind. Eng. 2021, 151, 106988. [Google Scholar] [CrossRef]
- Li, J.; Wang, H.; Shi, V.; Sun, Q. Manufacturer’s choice of online selling format in a dual-channel supply chain with green products. Eur. J. Oper. Res. 2024, 318, 131–142. [Google Scholar] [CrossRef]
- Wang, J.; Liu, J.; Zhang, X. Service purchasing and market-entry problems in a shipping supply chain. Transp. Res. Part E Logist. Transp. Rev. 2020, 136, 101895. [Google Scholar] [CrossRef]
- Ren, D.; Guo, R.; Lan, Y.; Shang, C. Shareholding strategies for selling green products on online platforms in a two-echelon supply chain. Transp. Res. Part E Logist. Transp. Rev. 2021, 149, 102261. [Google Scholar] [CrossRef]
- Ali, S.M.; Rahman, M.H.; Tumpa, T.J.; Rifat, A.A.; Paul, S.K. Examining price and service competition among retailers in a supply chain under potential demand disruption. J. Retail. Consum. Serv. 2018, 40, 40–47. [Google Scholar] [CrossRef]
- Zhou, H.; Zhang, W. Choice of Emission Control Technology in Port Areas with Customers’ Low-Carbon Preference. Sustainability 2022, 14, 13816. [Google Scholar] [CrossRef]
| Disclaimer/Publisher’s Note: The statements, opinions and data contained in all publications are solely those of the individual author(s) and contributor(s) and not of MDPI and/or the editor(s). MDPI and/or the editor(s) disclaim responsibility for any injury to people or property resulting from any ideas, methods, instructions or products referred to in the content. |
© 2025 by the authors. Licensee MDPI, Basel, Switzerland. This article is an open access article distributed under the terms and conditions of the Creative Commons Attribution (CC BY) license (https://creativecommons.org/licenses/by/4.0/).


