1. Introduction
Polychlorinated biphenyls (PCBs) were used in a range of industrial products beginning in the 1920s and were used as plasticisers in soft and flexible construction products from the 1950s to the late 1970s when they were banned from building materials [
1]. PCBs were banned for use in all products through the Stockholm Convention in 2004 [
2].
PCBs are characterised by low vapour pressure, high toxicity, high chemical stability, and low water solubility, leading to long-term contamination issues in buildings, environmental persistence, and biomagnification. As a result, PCB-contaminated buildings pose a serious threat to health and environmental sustainability [
3].
Studies have provided evidence of the adverse effects of PCBs on the immune, reproductive, nervous, and endocrine systems [
4]. Overall PCBs do not appear to cause acute health effects, but given that they accumulate in fat tissue, have a very slow excretion, and a low rate of excretion from human tissue, the concentrations can reach toxic levels in the body after long-term exposure [
4]. Finally, research has shown that some compounds and congeners are classified as carcinogenic with the highest possible rating [
5,
6].
PCBs exhibit slow evaporation from contaminated building materials to surroundings and have a strong affinity for other interior surface materials such as building materials, furniture, wallpaper and other types of paper, e.g., books, and clothes [
7,
8,
9,
10]. PCBs can migrate from contaminated primary building materials to surrounding building materials that become secondary pools of PCBs. From these pools, PCBs can evaporate into the indoor air as SVOC/particles or gas [
11]. Due to the high affinity of PCBs for other materials, this contaminates other interior materials, which become tertiary pools of PCBs in the indoor environment. These pools are generally in equilibrium with the concentration of PCBs in indoor air. This makes it extremely difficult to remove PCBs from the indoor environment [
10,
12,
13].
However, studies have shown that changes in temperature and ventilation can, to some extent, affect the equilibrium between SVOC-gas phasis and indoor pool emissions in the direction of increased evaporation in the indoor climate [
11].
Air pollution studies have shown that many SVOCs such as PCB and other indoor air pollutants are emitted from building materials and that, to some extent, these emissions depend on resident behaviours in the indoor climate [
14]. Resident density was reported to be positively associated with indoor air pollution concentrations [
15] and the latter were negatively correlated with ventilation rates and temperature [
16,
17]. In this context, a high ventilation rate has been shown to reduce indoor air concentrations of PCB [
18]. In 2011, the Danish authorities recommended frequent ventilation to reduce PCB concentrations in indoor air in contaminated buildings with indoor air concentrations between 300 and 3000 ng/m
3 and immediate action (i.e., relocation of the residents) if the indoor air concentration exceeds 3000 ng/m
3 [
19,
20]. In addition, frequent cleaning behaviour was also recommended but appears to have minor effects in reducing PCB concentrations in indoor air [
13].
Investigations have indicated that 75-90% of buildings in Denmark constructed between 1950 and 1977 contain PCB-contaminated building materials [
21]. However, only 1% of the buildings’ indoor air exceeded the recommended limit value for indoor PCB concentration at 3000 ng/m
3 in the indoor air [
19,
21]. Furthermore, a 2011 study of dwelling complexes showed higher levels of PCB in the indoor air in small apartments compared to large ones and indicated a decrease in PCB levels in apartments with an increasing number of residents [
8]. However, studies examining the effects of resident density on indoor air PCB content have not been published.
Previous results from the Broendby Strand Complex (Copenhagen) have shown that building characteristics (including apartment type, floor level, and the buildings themselves) showed no significant influence on the indoor air concentration of PCBs [
13]. Furthermore, the analysis revealed that higher concentrations of PCBs in indoor air were associated with higher indoor temperatures. The effect of cleaning behaviour (in this context, the frequency of vacuuming, floor washing, and dusting) and their influence on the indoor air concentration of PCBs were also examined. The results indicated that the frequencies of all single cleaning behaviours had a minor influence on lowering the indoor concentrations of PCBs [
13]. However, the potential effects of an overall cleaning model that includes all three cleaning behaviours on PCB concentrations in the indoor air were not investigated.
In this study, we explore whether resident factors and behaviours influence indoor air PCB concentrations in contaminated apartments.
Notable features of the Broendby Strand apartment complex (Near Copenhagen) are that the apartments in the various blocks are uniform in construction and the same PCB product was used in all the contaminated buildings (see [
13]). The settlement is, therefore, optimal for analysing modifying factors determined by residential factors and behaviours. These analyses are expected to help better understand the dynamics of PCBs in the indoor climate and will hopefully help develop new effective recommendations to reduce PCB in indoor climate in dwellings.
In this publication, the mean air content of PCBs in apartments is analysed to investigate whether the sizes of the apartments in combination with residential characteristics have an influence on the indoor air concentration. Furthermore, an overall cleaning model is constructed and analysed for the effect on PCB indoor air concentration in connection with other behaviours like ventilation and temperature.
3. Results
The mean indoor air concentration of PCBs in the 51 apartments investigated in Broendby Strand was 2184 ng/m3, with a standard deviation of 892 ng/m3.
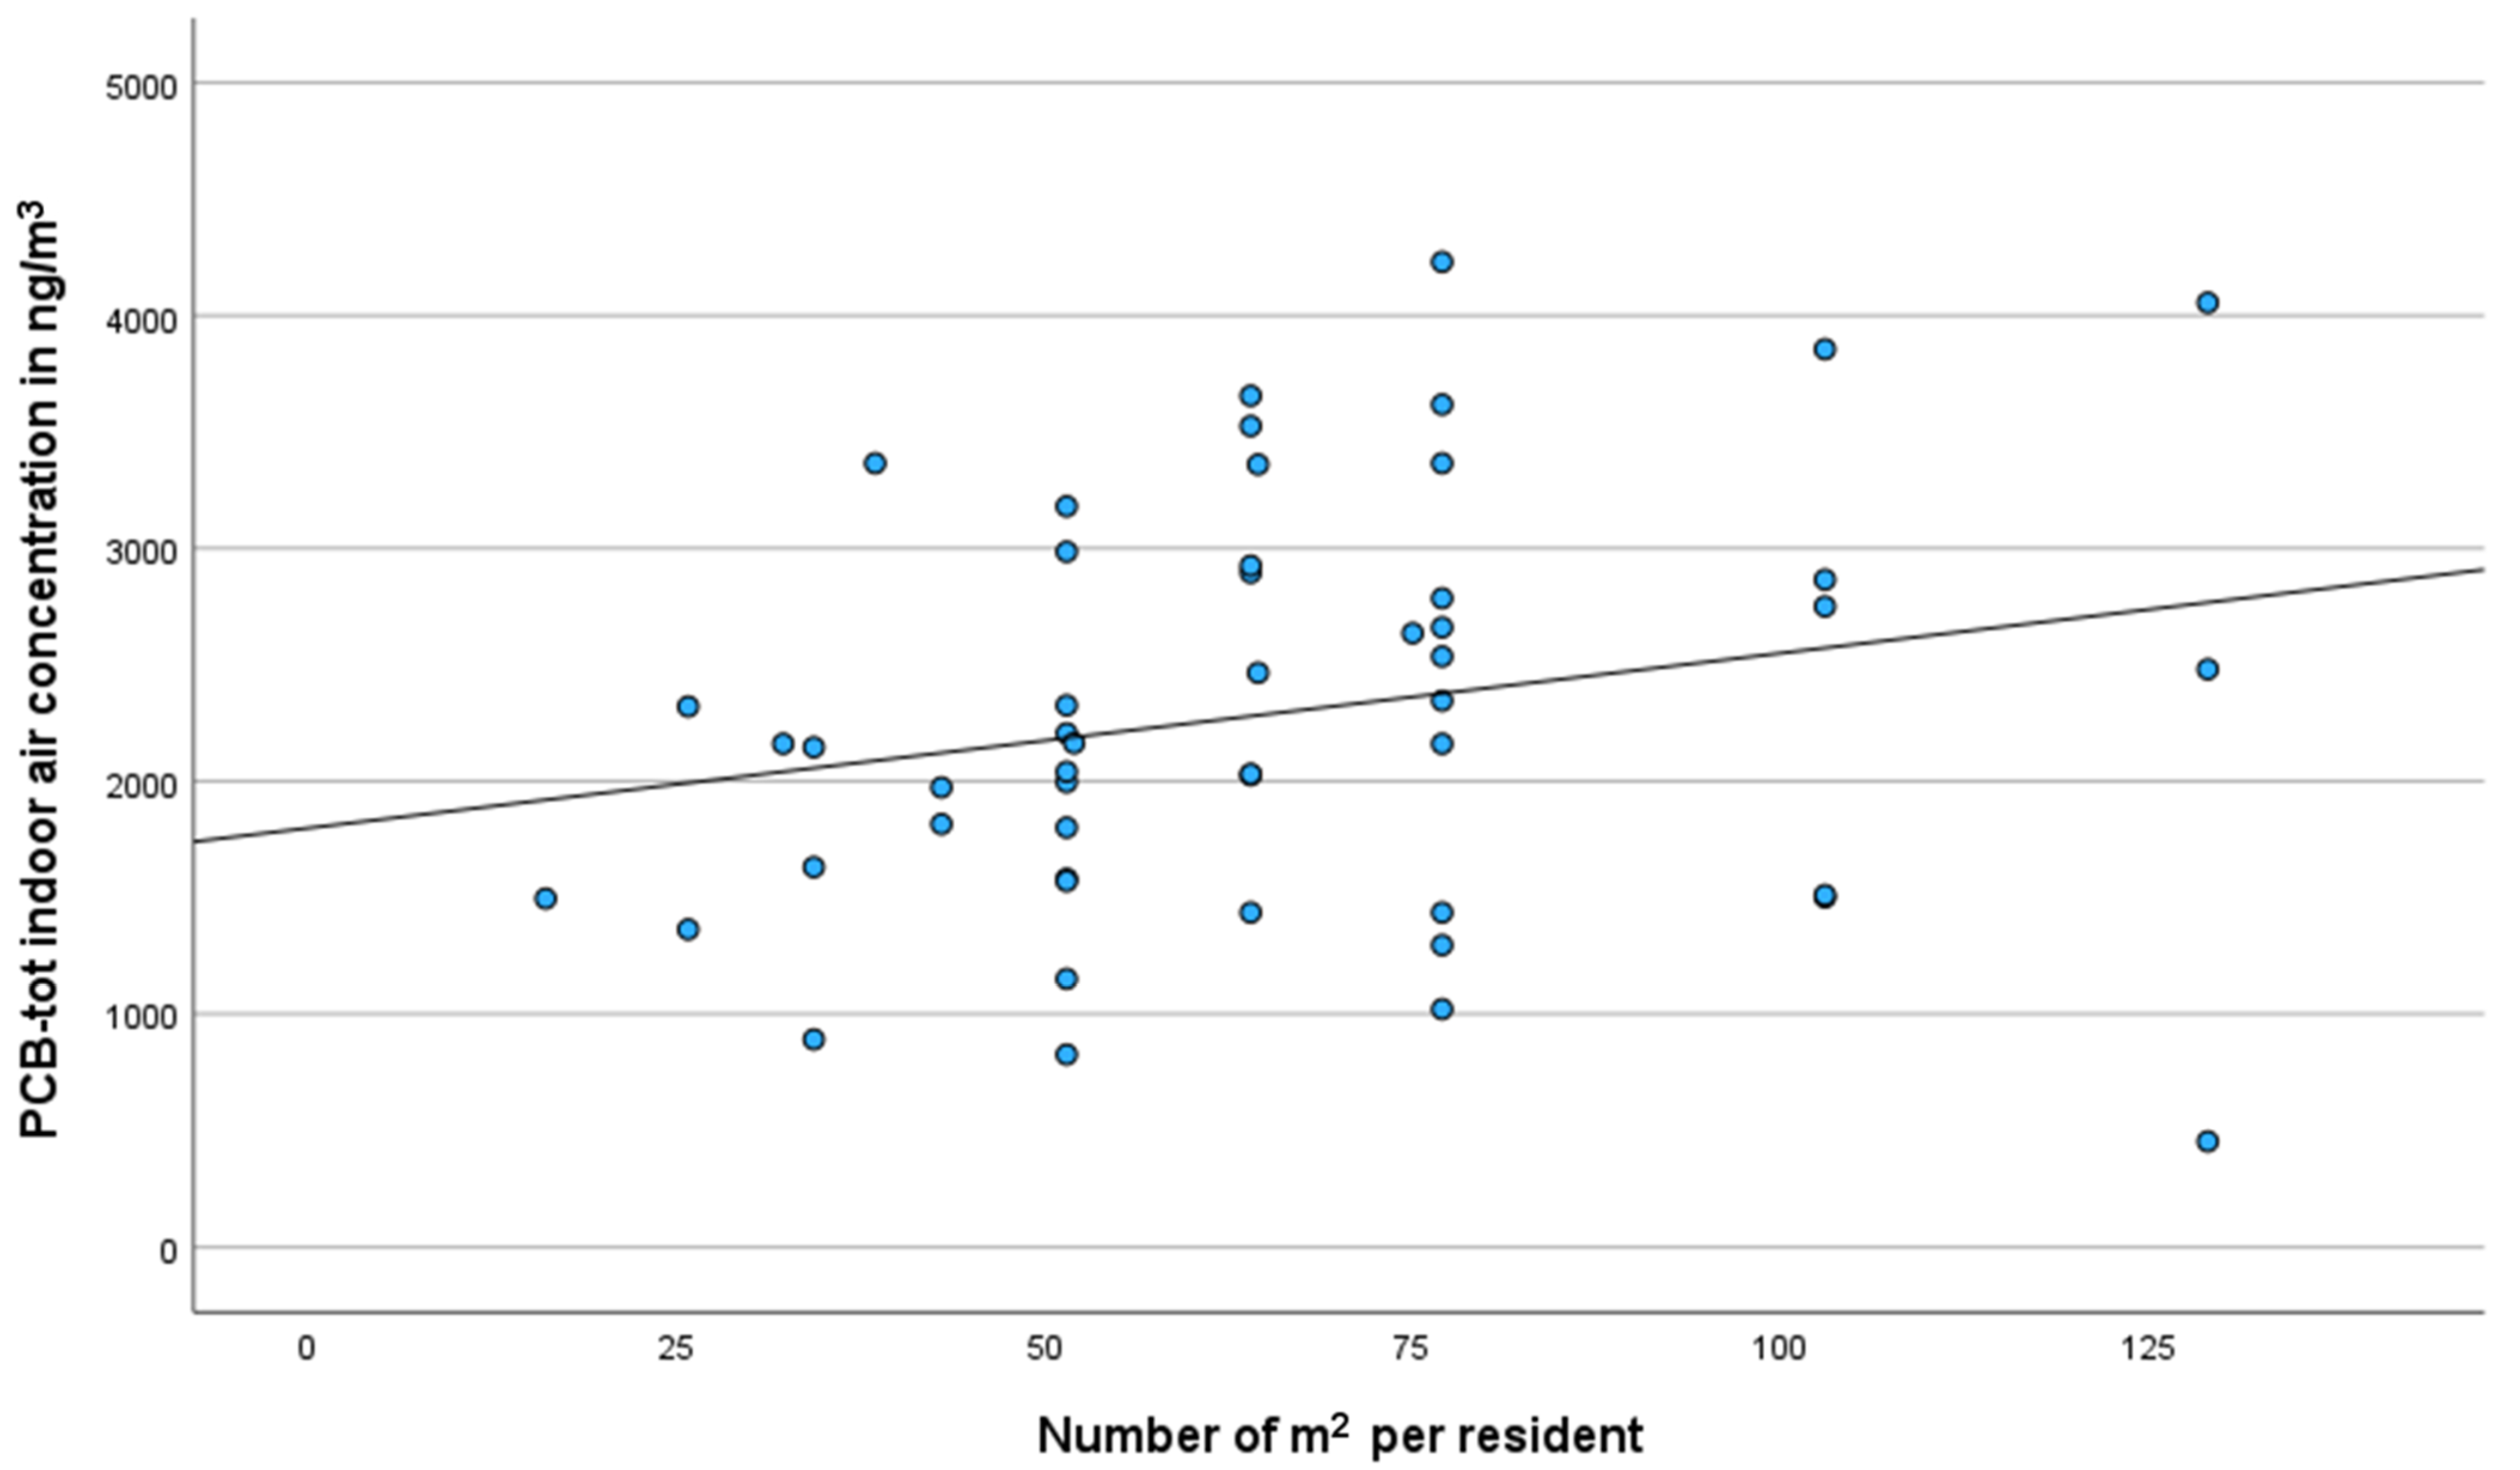
As shown in
Figure 1, the average concentration in the indoor air of the apartments with a resident density of 25 m
2 per resident was 2000 ng/m
3. The slope of the line is 7.43x, meaning that the concentration is 7.43 ng/m
3 higher for each additional m
2 per resident (equivalent to an increase of 0.37%/m
2, see
Figure 1). The R
2 quotient for the regression line is 0.048. The R
2 overall quotient for the regression that includes all significant covariates in this model is 0.328 (ANOVA), and the slope of this regression line (7.31x) is almost the same as for the line between PCB indoor air concentration and resident density (see
Figure 1).
Figure 1.
The linear relationship between resident density (m2/resident) and indoor air concentration of PCBtot in Broendby Strand Complex, Denmark, 2017. R2 is 0.048 for the linear model (ANOVA Test for Linearity: p = 0.110). Formula of the regression line is y = 7.43x + 1810. R2 is 0.328 (ANOVA Test for Linearity: p = 0.020) and the formula of the regression line is y = 7.31x + 1709 if significant covariates are included.
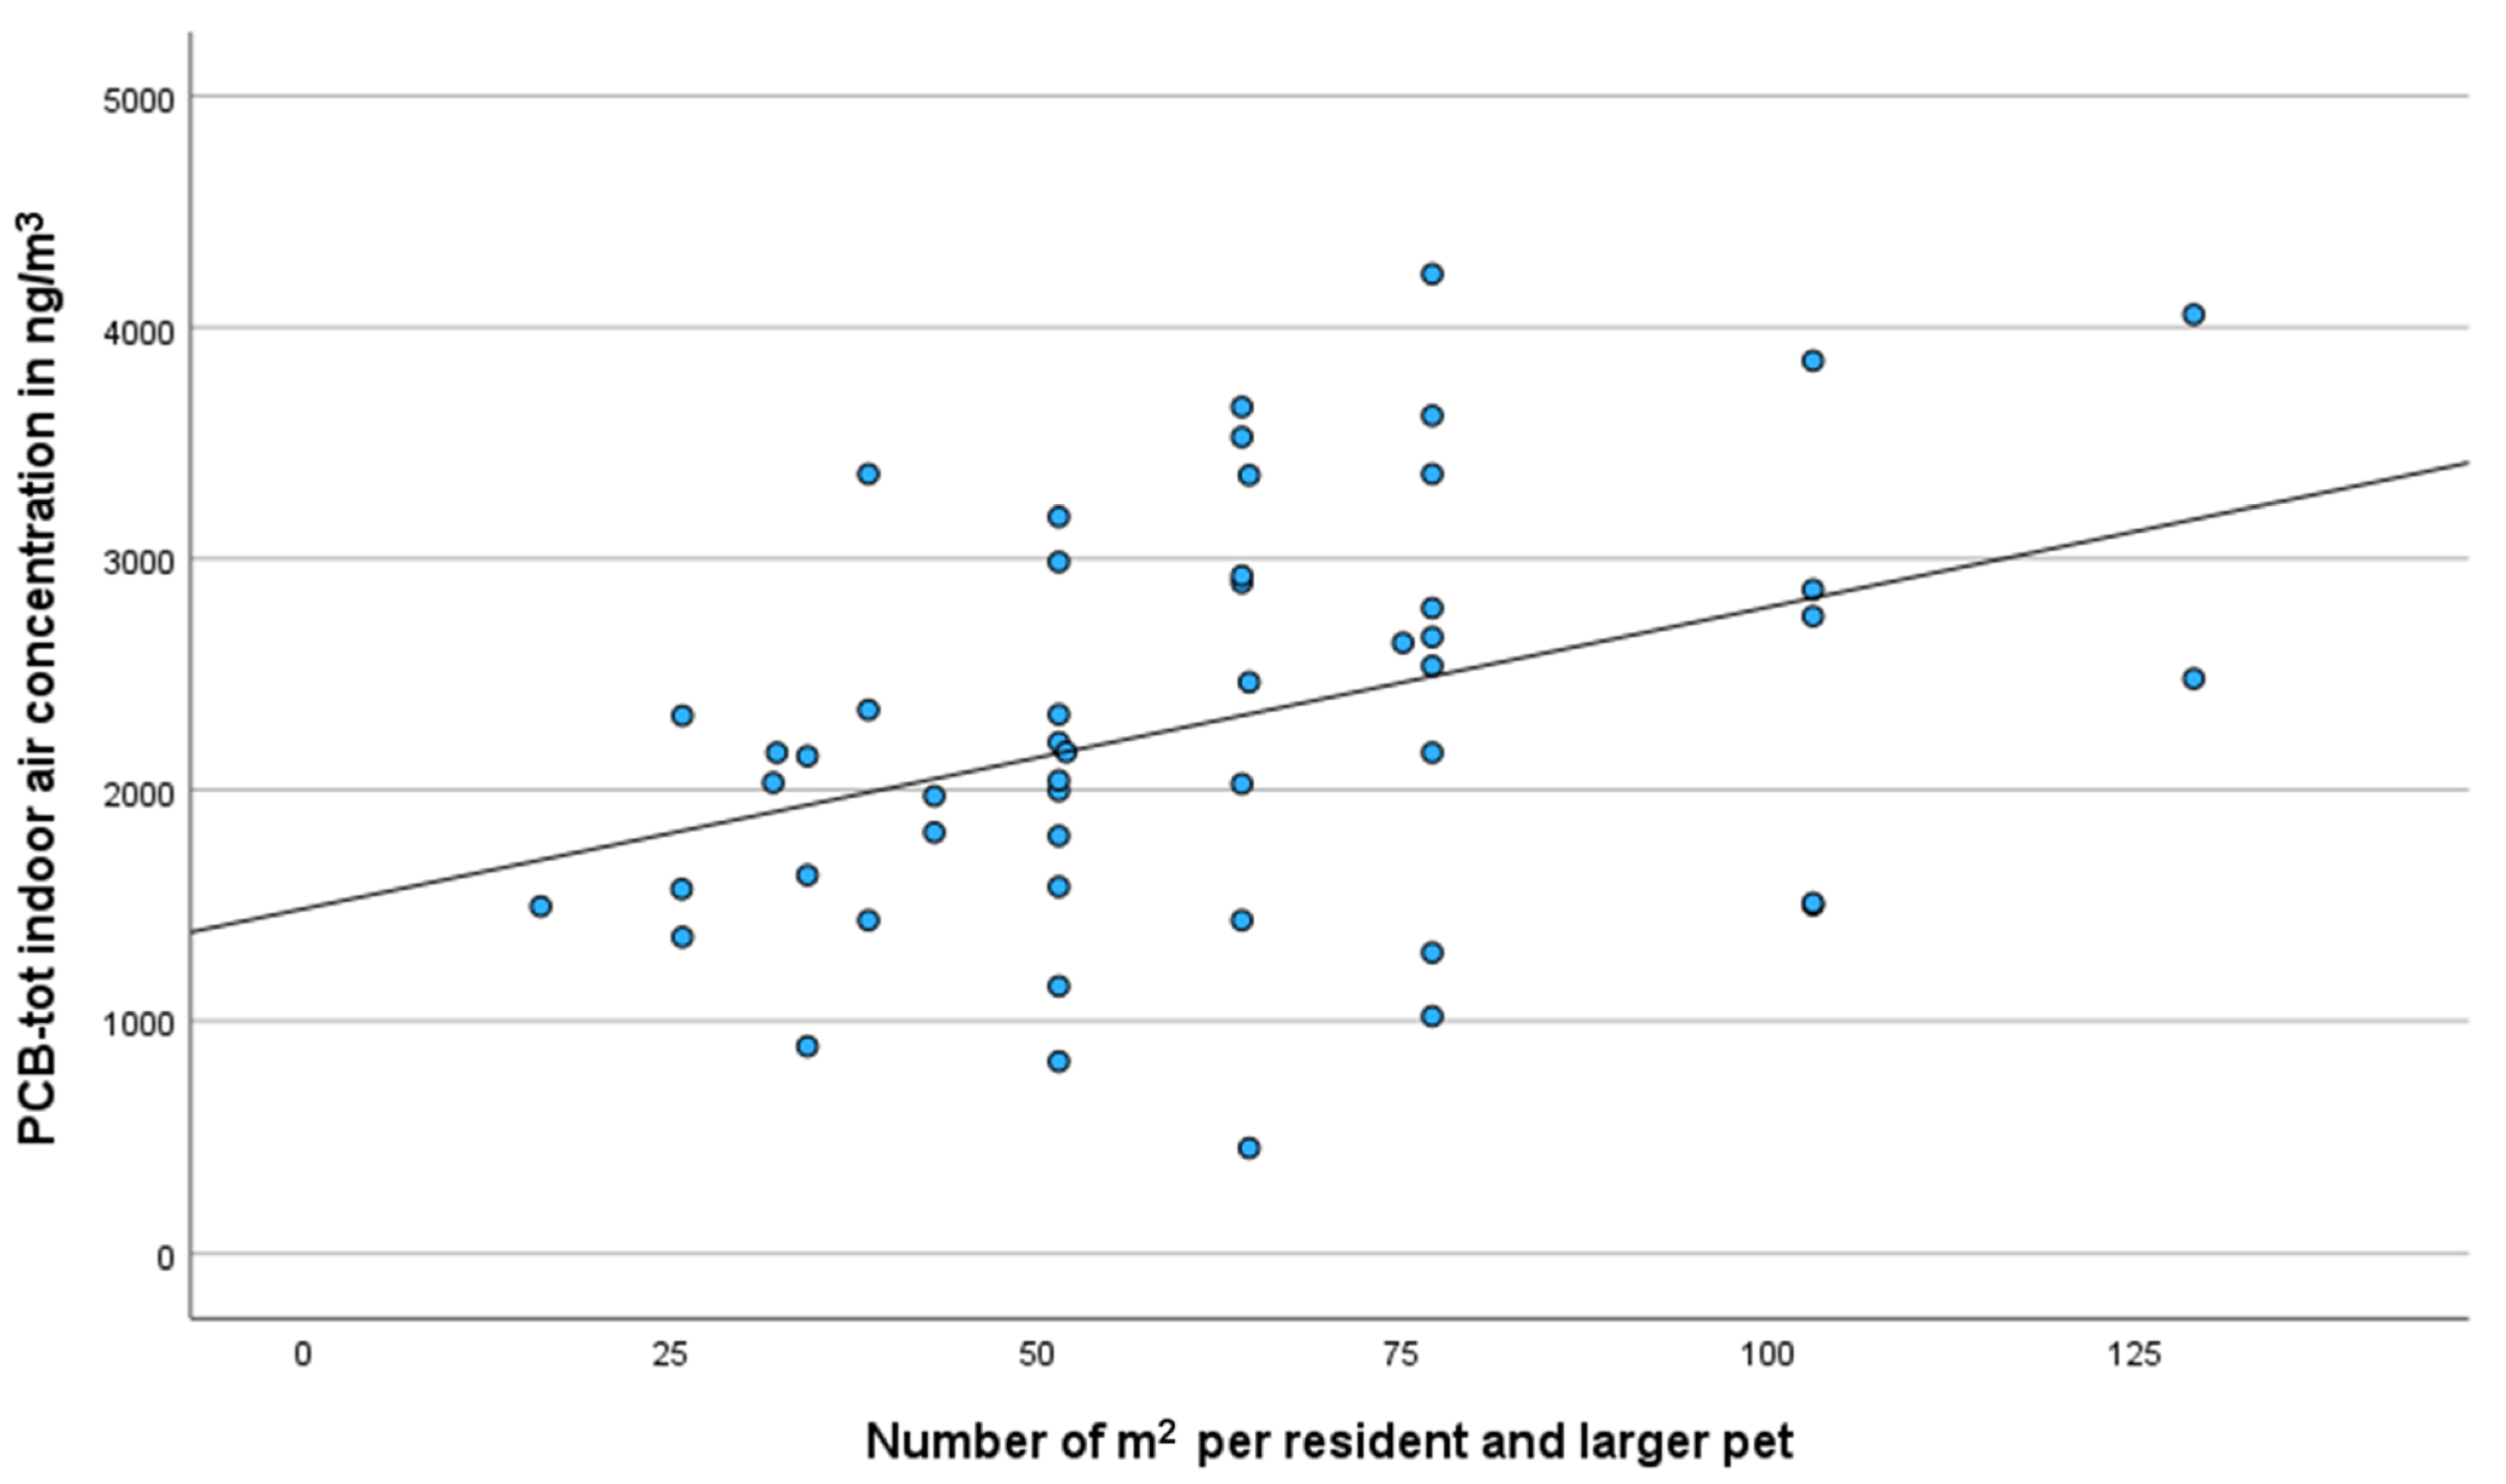
Based on a resident/pet density of 25 m
2 per resident/pet, the average PCB concentration in indoor air is 1844 ng/m
3 (as shown in
Figure 2). This content is 13 ng/m
3 lower for each additional m
2 per resident/pet (equivalent to a decrease of 0.70%/m
2). The R
2 quotient for the regression line is 0.144. The overall R
2 quotient for the regression that includes all significant covariates in this model is 0.382 (ANOVA). The slope of the regression line (14x) is marginally higher compared to the line (13.05x) in the simple model between the indoor air concentration of PCB and the density of residents and pets (see
Figure 2). The quadratic and cubic curve models are also significant in this analysis.
Figure 2.
The linear relationship between resident/pet density (m2/resident or pet) and the indoor air concentration of PCBtot in Broendby Strand Complex, Denmark, 2017. R2 is 0.144 for the shown linear model (ANOVA Test for Linearity: p = 0.006). Formula of the regression line is Y = 13.05x + 1490. R2 is 0.382 (ANOVA Test for Linearity p < 0.001). Formula of the regression line is Y = 14x + 1333 if significant covariates are included.
3.1. The Overall Cleaning Variable
The Guttman scale tests on the three basic cleaning variables showed that vacuuming is the most frequently used cleaning method (0.78) and that floor washing and dusting are carried out at an almost equal frequency (0.68 and 0.66, respectively). None of the cleaning methods meet the scoring criteria for being a significant dominant cleaning method in the investigated apartments [
25].
The best overall discriminating cleaning model (FVD) includes scores from the three cleaning variables with the following cleaning frequencies: score 3 = daily cleaning; score 2 = cleaning once or twice a week; and score 1 = cleaning less than once a week or never (see
Table S3 in the Supplementary Materials for more details). The overall FVD scale shows a satisfactory CA quotient of 0.813 and a satisfactory distribution of apartments with scores between 3 and 8 (
Table 1). Other cleaning frequencies either show lower overall CA quotients or lower discrimination capacities with respect to PCB concentrations in the indoor air or the distributions gave less than five answers for one or more of the categories in the alternative models. The results of the most suitable model show that a score of 5 is equivalent to the largest reduction (of approximately 20%) in PCB indoor air concentration of PCBs compared to lower scores (
Table 1).
Table 1.
The distribution of apartments and mean PCB
tot concentrations in indoor air related to the score in the overall cleaning scale (FVD, Q3–5 in
Supplementary Table S1).
Table 1.
The distribution of apartments and mean PCB
tot concentrations in indoor air related to the score in the overall cleaning scale (FVD, Q3–5 in
Supplementary Table S1).
| Overall Cleaning Score | Frequency of Apartments | Percentage of Apartments | PCB Air Mean Concentration (pg/L) |
|---|
| 3 | 13 | 25.5 | 2510 |
| 4 | 7 | 13.7 | 2742 |
| 5 | 10 | 19.6 | 2195 |
| 6 | 15 | 29.4 | 2081 |
| 8 | 6 | 11.7 | 1975 |
| Total | 51 | 100 | 2291 |
3.2. Correlation of Covariates
Significant bivariate correlations exist between the PCB concentration in indoor air and most of the included covariates (
Table 2). Significant negative correlations exist between the indoor air concentration of PCBs and the following variables: the number of residents (Correlation Coefficient (cc) = −0.284) and number of residents/pets (cc = −0.355), high resident densities (cc = −0.223) and high resident/pet densities (cc = −0.381), and a high FVD cleaning scale score (cc = −0.250). Furthermore, there are significant positive correlations between the PCB concentration and the following factors: increased temperature (cc = 0.450) and blocked vent valves in the kitchen or bathroom (cc = 0.352) (see
Table 2, columns 2 and 3).
Table 2.
Bivariate (Pearson’s) correlations between and multivariate significance (linear regression) of apartment/resident and behaviour factors and the indoor air PCBtot concentrations in the Broendby Strand Complex, Denmark, 2017.
Table 2.
Bivariate (Pearson’s) correlations between and multivariate significance (linear regression) of apartment/resident and behaviour factors and the indoor air PCBtot concentrations in the Broendby Strand Complex, Denmark, 2017.
| Resident and Building Related Factors | Pearson’s Correlation Coefficient | Bivariate p-Value (1-Tailed) | Linear Regression t-Value | Multivariate p-Value | Linear Regression—t-Value (Without Temperature) | Multivariate p-Value (Without Temperature) |
|---|
| Area of apartment (in m2) | −0.214 | 0.066 ns | −0.831 | 0.410 ns | −1.514 | 0.137 ns |
| Number of residents in the dwelling | −0.284 | 0.022 * | −0.375 | 0.710 ns | −0.303 | 0.762 ns |
| Number of residents and larger pets in the dwelling | −0.355 | 0.005 ** | −0.821 | 0.416 ns | −0.184 | 0.855 ns |
| Resident density (in m2/resident) | −0.223 | 0.045 * | −1.093 | 0.280 ns | −2.484 | 0.017 * |
| Resident and pet density (in m2/resident and pet) | −0.381 | 0.003 ** | −2.506 | 0.016 * | −3.098 | 0.003 ** |
| Vent valves in kitchen or bathroom blocked | 0.352 | 0.006 ** | 2.051 | 0.046 * | 2585 | 0.013 * |
| Temperature | 0.450 | 0.000 *** | 3.429 | 0.001 *** | - | - |
| Cleaning frequency (FVC score) | −0.250 | 0.038 * | −0.988 | 0.328 ns | −2.142 | 0.038 * |
3.3. Linear Regression and Multicollinearity
Linear regressions of the multivariate impact of the covariates show that a low density of residents/pets (
p = 0.016), high temperatures (
p = 0.001), and blocked valves in the kitchen or bathroom (
p = 0.046) are significant factors for an increase in PCB concentration in indoor air (
Table 2, columns 4 and 5). From the multicollinearity analysis of these covariates (see text below
Table 2), temperature shows a high collinearity score (CI: 33.165), while resident density (CI: 15.083) and, to some extent, blocked valves (CI: 11.884), also have high scores.
If temperature is excluded as a covariate in the linear regression analysis (
Table 2, columns 6 and 7), resident density (
p = 0.017) and cleaning frequency (
p = 0.038) become significant as covariates along with resident/pet density (
p = 0.003) and blocked or unblocked valves (
p = 0.001).
3.4. Autocorrelations Between the Covariates
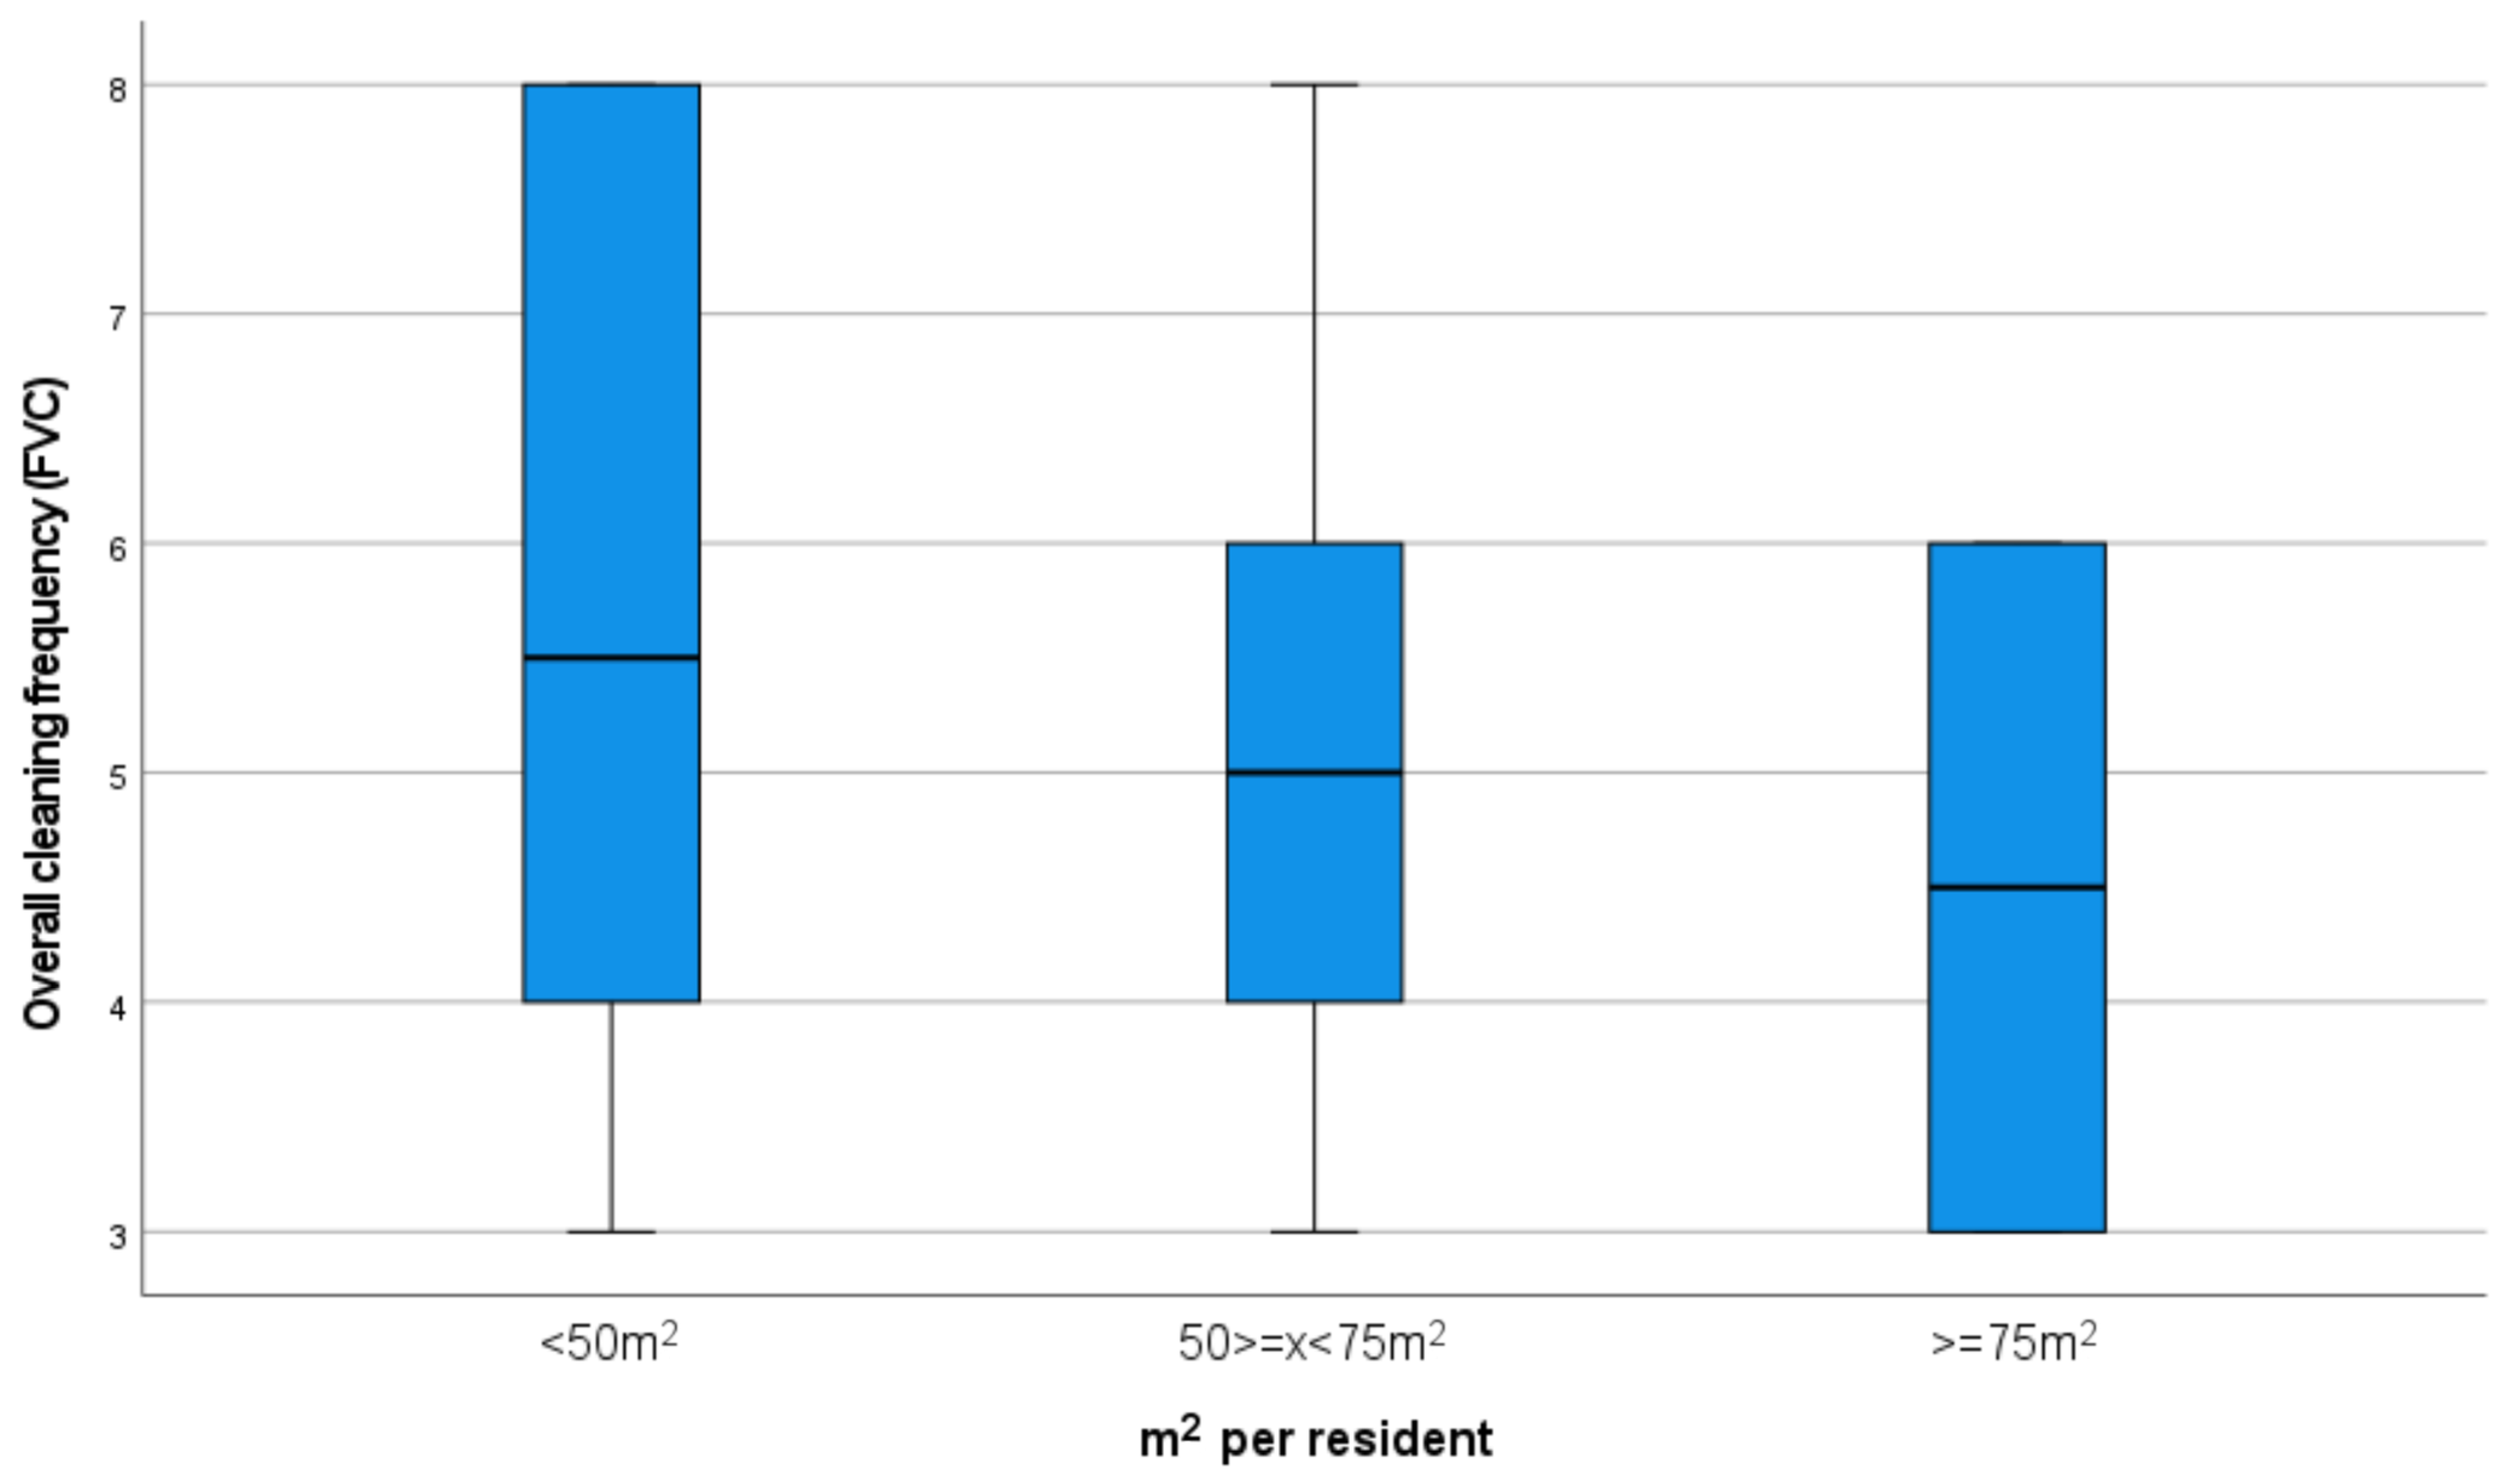
A correlation analysis between covariates with high multicollinearity scores (
Table 3) shows that a high cleaning frequency (FVC) is autocorrelated with a high density of residents (cc = 0.435) and a high density of residents/pets (cc = 0311). The correlation between high resident density and high cleaning frequency is further illustrated in
Figure 3. No significant correlations are observed between the other variables.
Table 3.
Correlations (Pearson’s cc) between resident density, resident/pet density, and behavioural factors in dwellings in Broendby Strand Complex, Denmark, 2017.
Table 3.
Correlations (Pearson’s cc) between resident density, resident/pet density, and behavioural factors in dwellings in Broendby Strand Complex, Denmark, 2017.
| | High Resident Density (m2 per Resident) | High Resident/Pet Density (m2 per Resident/Pet) | High Cleaning Frequency | Blocked Valves |
|---|
| High temperature | | | | |
| Corr. Coeff. | 0.027 | −0.080 | −0.099 | 0.112 |
| p-value (2-tailed) | 0.849 ns | 0.575 ns | 0.244 ns | 0.432 ns |
| High resident density | | | | |
| Corr. Coeff. | 0.881 | 0.435 | −0.160 |
| p-value (2-tailed) | 0.000 *** | 0.001 ** | 0.263 ns |
| High resident/pet density | | | | |
| Corr. Coeff. | 0.311 | −0.217 |
| p-value (2-tailed) | 0.001 ** | 0.126 ns |
| High cleaning frequency | | | | |
| Corr. Coeff. | −0.020 |
| p-value (2-tailed) | 0.887 ns |
Figure 3.
A boxplot showing overall cleaning score/frequency (FVC) in relation to resident density (m2/resident) in apartments in Broendby Strand Complex, Denmark, 2017.
Figure 3.
A boxplot showing overall cleaning score/frequency (FVC) in relation to resident density (m2/resident) in apartments in Broendby Strand Complex, Denmark, 2017.
4. Discussion
The mean concentration of PCBs in the indoor air in the 51 apartments investigated was 2184 ng/m3, and the PCB concentration in the indoor air increased by 0.37% for each additional m2 per person and by 0.70% for each additional m2 per resident or larger pet living in the apartments.
Linear regression models show that a high resident/pet density is significantly related to low PCB indoor air concentrations. In addition, low indoor air temperatures and unblocked valves (high ventilation) in the kitchen or bathroom are significant factors for lower indoor air PCB concentrations. High resident density and frequent cleaning behaviour are also significant as reducing factors if temperature is excluded from the regression model.
The multicollinearity scores indicate that there is high collinearity between resident density and temperature and between blocked or unblocked valves and temperature. Furthermore, there is also collinearity between cleaning frequency and blocked valves. Finally, a high cleaning frequency is correlated with a high resident density and a high resident/pet density.
Previously published results related to the present study showed that the same PCB product was used in all contaminated apartments in the Broendby Strand complex [
13]. Furthermore, since the buildings are uniformly arranged with respect to apartment composition, the present case seems very relevant for analysing the influence of residents and behavioural factors in the building complex on PCB indoor air content.
Other studies have shown that there are complicated interactions between PCBs in indoor air and different pools in indoor climates, as well as the influence of resident behaviour on the equilibrium between SVOC, gas phase, and indoor pool emissions [
11,
26].
As such, it is important to note that the concentration of PCBs in the primary pools in all the apartments is likely to have had almost the same composition at the time of construction. Second, the concentrations of PCBs in the indoor air basically depend on the composition of the PCB congeners in the building materials and the size of the apartments influenced by the residents and their behaviours, such as temperature, cleaning frequency, and ventilation (blocked values).
In that context, one can assume that the PCB concentration in indoor air is causally dependent primarily on PCB content in the apartment or building and secondarily on resident factors (such as the density of residents (and pets). In addition, one can assume that behaviours constitute intermediate variables between the resident (and pet) density and the PCB concentration. Based on this model, one can argue that significant behavioural factors act as modifiers but not as confounders between the resident (and pet) density and the indoor air concentration of PCBs. However, behaviours must be considered to be more prone to fluctuations, and consequently, they may vary more frequently compared to building and residential factors. This causality between the included factors is also a prerequisite for using linear regression analyses without endogeneity [
27].
The relatively small difference in PCB concentration per m
2 seems of minor importance, but when the resident composition is changed (for example, from three to two residents per 100 m
2), the density in m
2 per resident will theoretically increase by more than 30%. Based on the regression lines in
Figure 1 and
Figure 2, the indoor air PCB concentration will theoretically increase by 12 or 27%, depending on whether the resident or resident/pet density model is used to calculate the potential increase in the PCB concentration from such a reduction in resident composition. The precise mechanism and whether or how quickly the PCB concentration will change according to the above calculation is unknown.
However, it is reasonable to presume that significant behaviours might be a logical consequence affected by increasing or decreasing resident density and resident/pet density. Therefore, a higher density could affect indoor temperature, cleaning frequency, and ventilation rates, all of which influence the dynamics between the different PCB pools in the apartments and the concentration of PCBs in the indoor air. The autocorrelation and collinearity between several of the density variables and the behavioural variables support the presence of such causal relationships. It is likely that the presence of tertiary pools, such as paper, furniture, and cloth in apartments, also depends on the density variables, which may have an influence on the indoor air concentration of PCBs [
7,
8,
9,
10].
4.1. Interpretation of the Results
The uptake of PCBs in the biomass of pets and residents may contribute to a reduction in the PCBs in the indoor air to some extent [
19]. Residents may touch indoor PCB pools and uptake or generate PCB-containing SVOCs in the indoor climate [
28]. The PCB content in indoor air could decrease if each person and a large pet consumed PCBs from indoor air due to breathing combined with long stays in the apartment. This is in agreement with other studies that reveal that indoor cats show higher serum PCB levels compared to outdoor cats [
29,
30] and that people living in apartments with PCBs have a serum PCB concentration that is up to 30 times higher than others [
31,
32]. However, it seems unlikely that this consumption is the only reason for the differences attributed to resident (and pet) density [
33]. The typical daily inhalation rate for adults is estimated to be 16 m
3/day [
34], while the normal ventilation rate in apartments is equivalent to an air change of 0.5 (half of the indoor air content) per hour. This rate is equivalent to an air exchange rate of 3000 m
3/day in a 100 m
2 apartment or almost 200 times more than the inhalation rate of a resident staying at home for an entire day. Although blocked valves can reduce ventilation to some extent, the difference between daily ventilation and daily respiration seems exceedingly large, and too large to consider respiration as the most important factor in lowering PCB concentration in indoor air.
As shown, living in high-density apartments seems to be associated with higher cleaning frequencies and, to some extent, unblocked valves (possibly leading to higher ventilation). A combination of more residents and pets in apartments (high density) and a subsequent need for more frequent cleaning and a higher ventilation rate (unblocked valves) could partly explain the relationship between high resident/pet density and lower PCB concentrations in indoor air.
Several additional potential causes exist for the observed lower PCB concentrations in high- compared to low-density apartments. Residents in high-density apartments may more frequently touch indoor PCB pools and uptake PCBs through the skin or generate PCB-containing SVOCs in the indoor climate. Combined with a higher ventilation rate, this could reduce the concentration of PCBs in the indoor air [
28]. Furthermore, a high resident density may involve more tertiary sources or materials that absorb PCBs from the indoor climate. For example, the presence of more furniture and the use of more clothing and bed linen might absorb more PCBs from the indoor air [
9]. This, combined with more frequent washing, might explain the higher absorption and removal of PCBs from the indoor climate [
35,
36]. In addition, a possible increase in clothing turnover and other potential PCB-containing sources from apartments with high compared to low resident density could lead to a greater overall removal of PCBs [
37]. In this context, the increase in flow and turnover of other materials, such as paper, books, and refuse, may be related to the number of residents and higher resident (resident/pet) densities in a household. These, in turn, could possibly contribute to a higher absorption and removal of PCBs from the indoor air.
4.2. Collinearity
Multicollinearity between covariates is often present when using linear regressions on a smaller number of samples, such as 51 apartments in this case [
27]. Multicollinearity is described as interrelations between several covariates in connection with regression analysis. This differs from autocorrelations, where a mutual relationship is seen between two variables. Thus, both types of relationships can lead to bias in the calculated coefficients and can lead to more uncertainty regarding the linear relationships, as shown in
Figure 1 and
Figure 2 [
27,
38].
The collinearity between resident density and temperatures is expected (as shown in
Table 2). A high resident density could lead to an increase in the radiation of heat from residents to the indoor climate during their living and working in the apartment. Since a high resident density and high temperatures affect indoor air concentrations of PCBs in different directions, this is likely the reason why the resident density variable is only significant if temperature is excluded from the analysis.
Collinearity between resident density and cleaning frequency is supported by the bivariate correlation analysis in
Table 3, showing that there is a significant correlation between high resident density and high cleaning frequency. This seems reasonable as many people living in an apartment (with a few m
2 per person) might increase the need for frequent cleaning. By extension, the collinearity between the high cleaning frequency and the unblocked valves (synonymous with increased ventilation) seems reasonable for the same reason. All these factors are related to a reduced PCB indoor air content (
Table 2).
Collinearity between high temperature and blocked valves is also expected. Other studies have shown higher air concentrations of PCBs at high temperatures [
18]. Furthermore, given that blocked valves likely decrease the ventilation of air and PCBs to the surroundings and contribute to maintaining high temperatures in the indoor climate, the collinearity between these covariates is not surprising.
However, why the analysis shows only minor collinearity between the behavioural covariates in the resident/pet density model is more elusive. This could be because pets may not contribute to the same degree as residents in keeping the temperature high in the indoor climate. Pets may, on the other hand, contribute to increased dust, increased cleaning behaviour, and/or higher ventilation. However, they may also contribute to a reduction in the PCB content of the indoor air through their respiration and uptake of airborne PCBs from their almost continuous presence in an apartment.
4.3. Bias and Limitations
The results of this study are based on PCB measurements for 24 h during the winter in 2017. It is important to consider the potential bias introduced by the season of the PCB measurements, as well as potential bias produced during 24 h measurements compared to long-term measurements [
13,
39]. Unmeasured factors might also be potential sources of bias and confounding, i.e., the presence of carpets in some apartments might be associated with a lack of floor washing, which may be a source of bias and confounding in the estimation of the effect of floor washing.
It is also important to be aware of possible bias introduced in the survey results. Recall bias might be a problem in the answers, and the low internal validity of some of the questions may have resulted in misclassification, for example. This could impose certain limitations on the quality of this study.
An example of misclassification bias can be drawn from the ventilation questions used in the survey. High ventilation rates are recommended as an intervention strategy against the accumulation of PCB content in indoor climate [
19], and studies have shown that indoor SVOC concentrations are negatively correlated with ventilation rates [
16,
17,
26]. Furthermore, high ventilation rates are related to lower PCB concentrations in the indoor air [
20]. In this study, blocked vent valves represent the only significant ventilation variable associated with a higher PCB content in indoor air. Other ventilation variables from the questionnaire were analysed, but none of them were significantly correlated with the PCB concentration. Residents were also asked if they had opened windows or cleaned during the 24 h when air samples were collected. A few residents had done so, but the results from these apartments were of no significance to the overall results. The missing associations between ventilation variables (except for blocked valves) and indoor air PCB concentrations to some extent reject the importance of ventilation for the indoor PCB content in this study. It may alternatively indicate recall bias among the residents or a possible low internal validity of the questions used herein with respect to ventilation measurements. Another explanation might be that the questions about ventilation frequency are not exhaustive enough to provide a comprehensive result on daily ventilation behaviour in apartments. Therefore, a validation strategy for ventilation questions may be necessary in future studies to reduce this potential bias m
3.
The low R
2 quotients in the density/PCB models (
Figure 1 and
Figure 2) indicate a low goodness of fit of these models. The relatively high variation in PCB concentration, especially between apartments at the ‘ends’ of the density/PCB models, entails high leverage for such individual apartments that contribute to potential bias and the low R
2 quotients for the regression lines. The inclusion of significant covariates improves the R
2 quotients significantly, which, in connection with the multicollinearity between the models and some of the covariates, indicates that some of the behaviours are connected to the resident or resident/pet density in the apartments.
Another explanation for the relatively low R
2 quotient might be that the relationships are not necessarily linear. The ANOVA results (see
Supplementary Materials) also show satisfactory agreement with a cubic and quadratic relationship between PCB concentrations and the resident/pet density variable. However, this relationship is likely based on the smaller number of samples, especially at the ends of the models. Furthermore, the ANOVA results, including significant covariates, support linearity between PCB content and the density variables. Future studies with more apartments might provide more conclusive answers to this question.
The use of two overlapping covariates in the same regression analysis (resident density and resident/pet density) compared to the use of only one of the covariates also challenges the interpretation of the regression coefficients [
38]. Overall, this results in lower
p-values and higher parameter variance for the covariates and, therefore, in wider confidence intervals and lower R
2 values [
38]. However, both covariates are included in the overall regression analysis because both variables are significant. This means that both variables separately capture unexplained variation and that both variables are relevant and significant as explanatory covariates for the indoor air concentration of PCBs.
Previous studies have shown negative correlations between apartment size and PCB concentration in the indoor air and between PCB concentration in the indoor air and the number of residents [
10]. However, the influence of the size of the apartment and the number of residents as single factors is not significant in the multivariate analysis of this study. In contrast, resident/pet density and (to some extent) resident density are significant covariates in this study. Only minor collinearity exists between the two density models, even though one might suspect them to be highly collinear given that both variables include the number of m
2 per resident.
4.4. External Validity
The overall mean indoor air concentration of PCBs in the investigated apartments is significantly higher than in other national studies [
40] and compared to similar international studies on indoor air concentrations of PCB (namely, those conducted in Switzerland [
41] and Germany [
7]). In addition, the PCB concentrations in all apartments investigated in the contaminated complex (Broendby Strand Parkerne [
22]) exceeded the lower recommended action limit of 300 ng/m
3 issued by the Danish Health Authorities [
19].
It is unclear whether the gradients between PCB concentration in the indoor air and density of residents/pets (and the density of residents) from this study also are usable in other PCB-contaminated building complexes with other PCB concentrations in the indoor climate based on different PCB compositions in the building materials. Determining PCB concentrations based on the PCB
tot calculation as used in the present study based on measurements of a few PCB congeners might be advantageous in this context, as this method might compensate for the use of different PCB mixtures between apartments and building complexes to some degree [
39,
40]. More studies are needed to address these uncertainties. More studies are also needed to clarify the specific effects of extended ventilation, cleaning frequency, and lowering temperatures in PCB-contaminated buildings.
5. Conclusions
Resident/pet density and, to some extent, resident density, are significant modifiers of the indoor air content of PCBs in the investigated complex (Broendby Strand). Temperature, cleaning frequency, and blocking or unblocking of vent valves (ventilation) are significant behavioural factors that, to some extent, depend on residential factors and are significant modifying factors of the indoor air concentration of PCBs. Although PCB primarily is harmful to health among children, vulnerable groups, and women in the childbearing age and primarily poses a health risk after many years of accumulation in the body, it is important to be aware of the risk of continuing to spend many hours for a long time in PCB-contaminated indoor environments. Residents living in homes and apartments built between 1950 and 1977 should be aware of the risk of having PCB in the indoor environment. If PCB is present in concentrations that exceed the authorities’ recommendations for indoor air, it is important to be aware of and use the effective behavioural parameters shown in this article, i.e., frequent ventilation, cleaning, and reductions in the indoor temperature, to reduce the harmful effects of PCB in the indoor climate.


