1. Introduction
Global food systems are highly interconnected with their surrounding environment. As a result, they are sensitive to various types of environmental changes. These changes can range from large-scale disruptions to gradual shifts in average conditions. For example, shifts in climate, nutrient cycles, and water availability can all have significant impacts on the production, storage, processing, distribution, retail, and consumption of food. In addition to gradual changes, food systems are also affected by sudden disruptions such as floods, droughts, and extreme heat, which are manifestations of climate variability. Furthermore, other environmental challenges like pest outbreaks, diseases, algal blooms, coral bleaching, and the presence of aflatoxins also pose significant threats to food security [
1,
2]. While natural variations have occurred within the historical range, today’s environmental variability is increasingly characterized by extreme events. These shifts are largely driven by climate change and other human-induced factors, making food systems more vulnerable and highlighting the importance of developing resilience against these challenges. Anticipated shifts in climate and environmental conditions over the coming decades are expected to further exacerbate these vulnerabilities, impacting food security, nutrition, and both human and global health [
3,
4]. However, even in the present, extreme weather events and environmental variability are already leading to significant annual harvest losses and disruptions in food distribution. These immediate, short-term effects—those occurring within a single growing or production season—can be more severe than the long-term impacts of environmental and climate changes, highlighting the urgency for adaptive measures [
5].
The impacts of environmental variability extend beyond individual harvests to the broader food supply chain (FSC), affecting both local and global scales. In regions with limited access to global markets, where food production and consumption are closely interlinked, often through short supply chains typical of subsistence-based food systems, environmental variability can quickly lead to local shortages of specific foods. These shortages can create food insecurity depending on the availability of substitutes, impacts on livelihoods, and how households adjust their diets and nutrient intake [
6,
7]. Moreover, the consequences of environmental variability are not confined to local producers but are increasingly propagated through longer supply chains. For example, in 2008, a drought in major grain-producing regions, combined with several other factors—including rising biofuel demand, high oil prices, declining grain stocks, and the depreciation of the US dollar—led to a spike in global grain prices. This price spike triggered a series of rice export bans, which exacerbated shortages and ultimately drove over 130 million people into poverty, with an additional 75 million experiencing malnourishment [
8]. This example highlights how disruptions in one part of the supply chain can have cascading effects, illustrating the interconnectedness and fragility of global food systems.
Although the 2008 event was not entirely an environmental shock, it underscores the potential for disruptions to cascade through global food trade networks, affecting populations in geographically distant regions. As global food systems become increasingly interconnected, it is crucial to understand the emerging risks associated with environmental variability. Ongoing globalization and the expansion of multinational food enterprises have introduced greater complexity and efficiency in the relationship between producers and consumers. However, despite this growing interconnectedness, there is still a limited understanding of how these dynamics influence the impacts of environmental variability on both local and global FSCs. Moreover, the effects of major events—such as economic recessions, trade blockades, or pandemics—can amplify these vulnerabilities [
9]. This amplification particularly affects the quality of food products, especially perishable items, which deteriorate over time and often lose all value, especially for fresh produce [
10]. Perishability is defined by at least one of the following criteria: (1) a noticeable decline in product quality, (2) significant consequences from the loss of functionality, or (3) a gradual reduction in value [
10,
11]. These characteristics make fresh food products particularly vulnerable during various stages of the supply chain, including manufacturing, storage, and distribution [
12]. Therefore, ensuring the timely delivery of fresh products to consumers is essential for maintaining the viability and efficiency of FSCs [
13].
The design of perishable FSCs is, therefore, critical for mitigating the challenges presented by environmental variability. This process, known as Perishable Food Supply Chain Network Design (PFSCND), involves decisions related to facility location, manufacturing, storage, and transportation of food products that are subject to quality deterioration. PFSCND also requires consideration of the unique characteristics of perishable FSCs, which intersect with economic, social, and environmental factors. These unique traits stem from the nature of perishable items and the processes involved in their production, preparation, and distribution. As a result, decisions made within PFSCND not only affect product quality but also have broader implications for the sustainability of the entire supply chain, ultimately influencing consumer satisfaction and business success [
14].
Global food systems are under increasing pressure from environmental and climate variability, posing significant risks to food security. This is particularly critical for nations like Qatar, where over 90% of food is imported due to limited agricultural capacity. Qatar’s food supply chain faces unique challenges, including the following:
High dependency on imports for staple crops like tomatoes, onions, and cucumbers.
Vulnerability to climate-induced disruptions in exporting nations.
The perishability of imported crops leads to quality degradation during transit.
Addressing these challenges requires a strategic framework that balances economic, environmental, and resource sustainability considerations. This study proposes a multi-objective optimization framework to strengthen Qatar’s food import system against climate-induced risks. The framework integrates economic costs, environmental emissions, and variability in crop water requirements (CWR) to identify optimal trade partners. The key research objectives are framed as the following questions:
How can Qatar’s food import system be optimized to reduce climate-related risks?
What are the trade-offs between economic, environmental, and resource sustainability considerations in food import decisions?
Which trade partners offer the most resilience against variability in CWR?
To support these objectives, this study utilizes historical climate and trade data, including statistics on crop production costs, water requirements, and transportation emissions. Turkey, a major trade partner, contributes 42.10% of Qatar’s imports, demonstrating its critical role in supply chain stability. By combining stochastic and robust optimization approaches, this study provides actionable insights for policymakers to design resilient and sustainable food systems. This study also aims to propose a methodology that strengthens Qatar’s food import system against climate-related risks. The proposed approach focuses on selecting optimal trade partners for key crops through a multi-objective optimization framework that balances economic and environmental considerations to ensure a resilient food import strategy. Furthermore, by integrating climate factors that affect water requirements for crop growth, the framework offers a holistic perspective on the challenges and opportunities within the global food system.
This study is structured over five sections.
Section 2 provides a comprehensive literature review, examining previous research on food security, climate variability, and supply chain optimization.
Section 3 outlines the methodology deployed in this study, including the multi-objective optimization framework and the factors considered in the model.
Section 4 presents the results and discusses the findings, highlighting key insights related to Qatar’s food import system and its resilience to climate risks. Finally,
Section 5 concludes the paper with recommendations for future research and policy implications.
2. Literature Review
Food supply chains differ significantly from other product supply networks, primarily due to the continuous degradation in product quality along the entire chain, from production to final consumption. This distinct nature of FSCs, driven by the perishability of food items, price volatility, fluctuating demand, climate dependency, and increasing consumer concerns regarding food safety, makes them more complex than other supply chains [
15]. A substantial portion of food is lost due to the perishability of agricultural products, emphasizing the importance of managing food sustainability, profitability, and quality throughout the FSC. Despite the best efforts, some post-harvest food losses are inevitable [
15].
Given these unique challenges, the importance of perishable food supply chains (PFSCs) has become increasingly critical in the context of changing global demand patterns. As demand for fresh produce, such as milk, fruits, and vegetables, rises in response to the global shift towards healthier diets, managing PFSCs effectively is essential. Real-time management of perishable products and addressing factors like pricing, quality, and freshness are crucial for efficient PFSC operations. To maintain product integrity, continuous monitoring of these factors is necessary throughout the supply chain (SC). However, handling modern PFSCs remains challenging due to demand fluctuations, stringent environmental regulations, and unforeseen disruptions. Recent technological advancements have aided in overcoming some of these challenges, particularly in improving inventory control, transportation, and sustainability aspects [
16].
Building on these advances in PFSCs, a broader perspective is needed to address the complexities of agri-food supply chains (AFSCs). In AFSCs, integrated strategies must be implemented, from raw material production to product distribution, aligning supply and demand in a competitive and dynamic environment. However, this process is fraught with challenges, primarily stemming from uncertainties inherent to the agri-food sector [
17]. Effective management of these uncertainties is vital for improving supply chain performance. In PFSCs, value degradation is influenced by opportunity costs, shelf-life constraints, and product transportation dynamics. Singh et al. [
18] proposed a location-allocation model considering value degradation and coordination using big data approximations. This model, framed as a mixed-integer linear programming (MILP) problem, was solved using a CPLEX solver. Additionally, Chen et al. [
19] developed a method to classify fresh agricultural products’ storage requirements to reduce consolidation costs and minimize value loss from shorter shelf lives [
16].
A more detailed understanding of AFSCs is necessary to fully understand the process from farm production to consumer delivery. AFSCs include plant and animal based products, which are particularly vulnerable to uncertainties stemming from the nature of agricultural production. These uncertainties, if not managed effectively, can negatively impact the supply chain’s performance and overall efficiency. Conversely, better management of uncertainties can enhance performance [
20]. Various sources of uncertainty in crop-based AFSCs include shelf-life unpredictability, where the product’s deterioration does not necessarily align with its marketable lifespan [
21]. Product degradation, categorized as age-dependent or independent, further complicates supply chain management [
11]. Additionally, the lack of product homogeneity, typical of the agri-food industry, creates additional challenges in maintaining consistent quality standards [
22].
Supply lead times in AFSCs are generally long and impacted by seasonal and climatic factors, adding another layer of uncertainty [
23]. Moreover, production uncertainty arises from the unpredictability of raw materials, necessitating flexibility in processing methods [
24]. Demand uncertainty is influenced by consumer preferences, safety concerns, and promotional efforts, all of which fluctuate due to factors such as seasonality and weather [
25]. In agriculture, weather patterns and land conditions heavily influence crop yields. This uncertainty in weather patterns poses significant challenges during the harvesting process [
23]. Managing these uncertainties is particularly difficult when planning production in AFSCs. Many traditional planning models assume deterministic parameters, which is often unrealistic in agriculture due to the inherent variability [
26].
In addition, recent studies emphasize the increasing role of climate change adaptation strategies in ensuring food security and supply chain resilience. Alhassan and Kuwornu [
27] investigated the impacts of climate variability on food security in Sub-Saharan Africa, highlighting the importance of integrating climate-responsive strategies in food supply chains. Similarly, Begashaw et al. [
28] analyzed climate adaptation strategies and their effects on household vulnerability to food insecurity in Ethiopia, stressing the need for robust policy interventions in food trade networks. These findings reinforce the significance of incorporating climate resilience into food supply chain models, aligning with the objectives of this study. To address uncertainties in FSCs, robust optimization techniques are increasingly being applied. These methods can handle uncertain data, such as errors in data estimation or environmental factors, through strategies like the Robust Counterpart approach [
29]. By incorporating robust optimization, supply chain managers can better manage unpredictable conditions in the agri-food industry, ensuring better outcomes despite uncertainties [
30]. In addition to robust optimization, stochastic optimization approaches are also being explored to handle uncertainty in AFSCs. Unlike robust optimization, which aims to find solutions that perform well under worst-case scenarios, stochastic optimization incorporates probabilistic elements to model uncertainty, thereby enabling decision-making that accounts for a variety of possible future outcomes.
AFSCs face significant challenges due to the uncertainties inherent in production, demand, and environmental conditions. The growing use of advanced optimization methods, including robust and stochastic approaches, offers promising pathways to address these complexities and enhance the resilience of FSCs. As the demand for sustainable and efficient food systems continues to rise, these optimization strategies will play a crucial role in shaping the future of global agri-food networks.
4. Results and Discussion
4.1. Stochastic Optimization
The stochastic optimization provides the optimal import quantities for tomatoes, onions, and cucumbers from seven countries: the USA, Iran, Lebanon, India, Turkey, Morocco, and the Netherlands. The optimization aims to minimize total cost, emissions, and expected CWR under uncertainty.
4.1.1. Optimal Import Networks: Stochastic Scenario
The total quantity imported for tomatoes was 167,494.16 tons, with Turkey being the largest supplier, contributing 49,344.14 tons (29.5% of the total tomato imports), as illustrated in
Figure 1. This significant contribution can be attributed to Turkey’s competitive position in the market. Iran was the second-largest supplier, with 29,231.72 tons (17.5%). The Netherlands and Morocco supplied similar amounts, with 19,324.48 tons (11.50%) and 19,265.42 tons (11.50%), respectively. The USA contributed 17,724.73 tons (10.60%), followed by Lebanon with 16,802.87 tons (10.00%), and India with 15,800.80 tons (9.40%). Their inclusion results from acceptable waste and loss factors (all ≤ 20%) and compliance with constraints requiring each country to supply between 10% and 50% of the demand for items with acceptable waste and loss factors.
For onions, the total import quantity was 5430.09 tons. Turkey was again the largest supplier, providing 1491.23 tons (27.40% of total onion imports). Iran contributed 953.25 tons (17.60%), while the Netherlands supplied 645.03 tons (11.90%). Morocco provided 632.98 tons (11.70%), followed by the USA with 598.71 tons (11.00%), Lebanon with 569.29 tons (10.50%), and India with 539.60 tons (9.90%).
In the case of cucumbers, the total imported quantity was 95,257.11 tons. Turkey maintained its position as the largest supplier, contributing 30,263.27 tons (31.80% of total cucumber imports). Iran provided 20,495.98 tons (21.50%), followed by the Netherlands with 13,044.15 tons (13.70%) and the USA with 12,558.54 tons (13.20%). Lebanon supplied 10,135.94 tons (10.60%), and India contributed 8759.23 tons (9.20%). Morocco did not contribute to cucumber imports due to its high waste and loss factor for cucumbers (27%), exceeding the acceptable threshold of 20% set in the constraints.
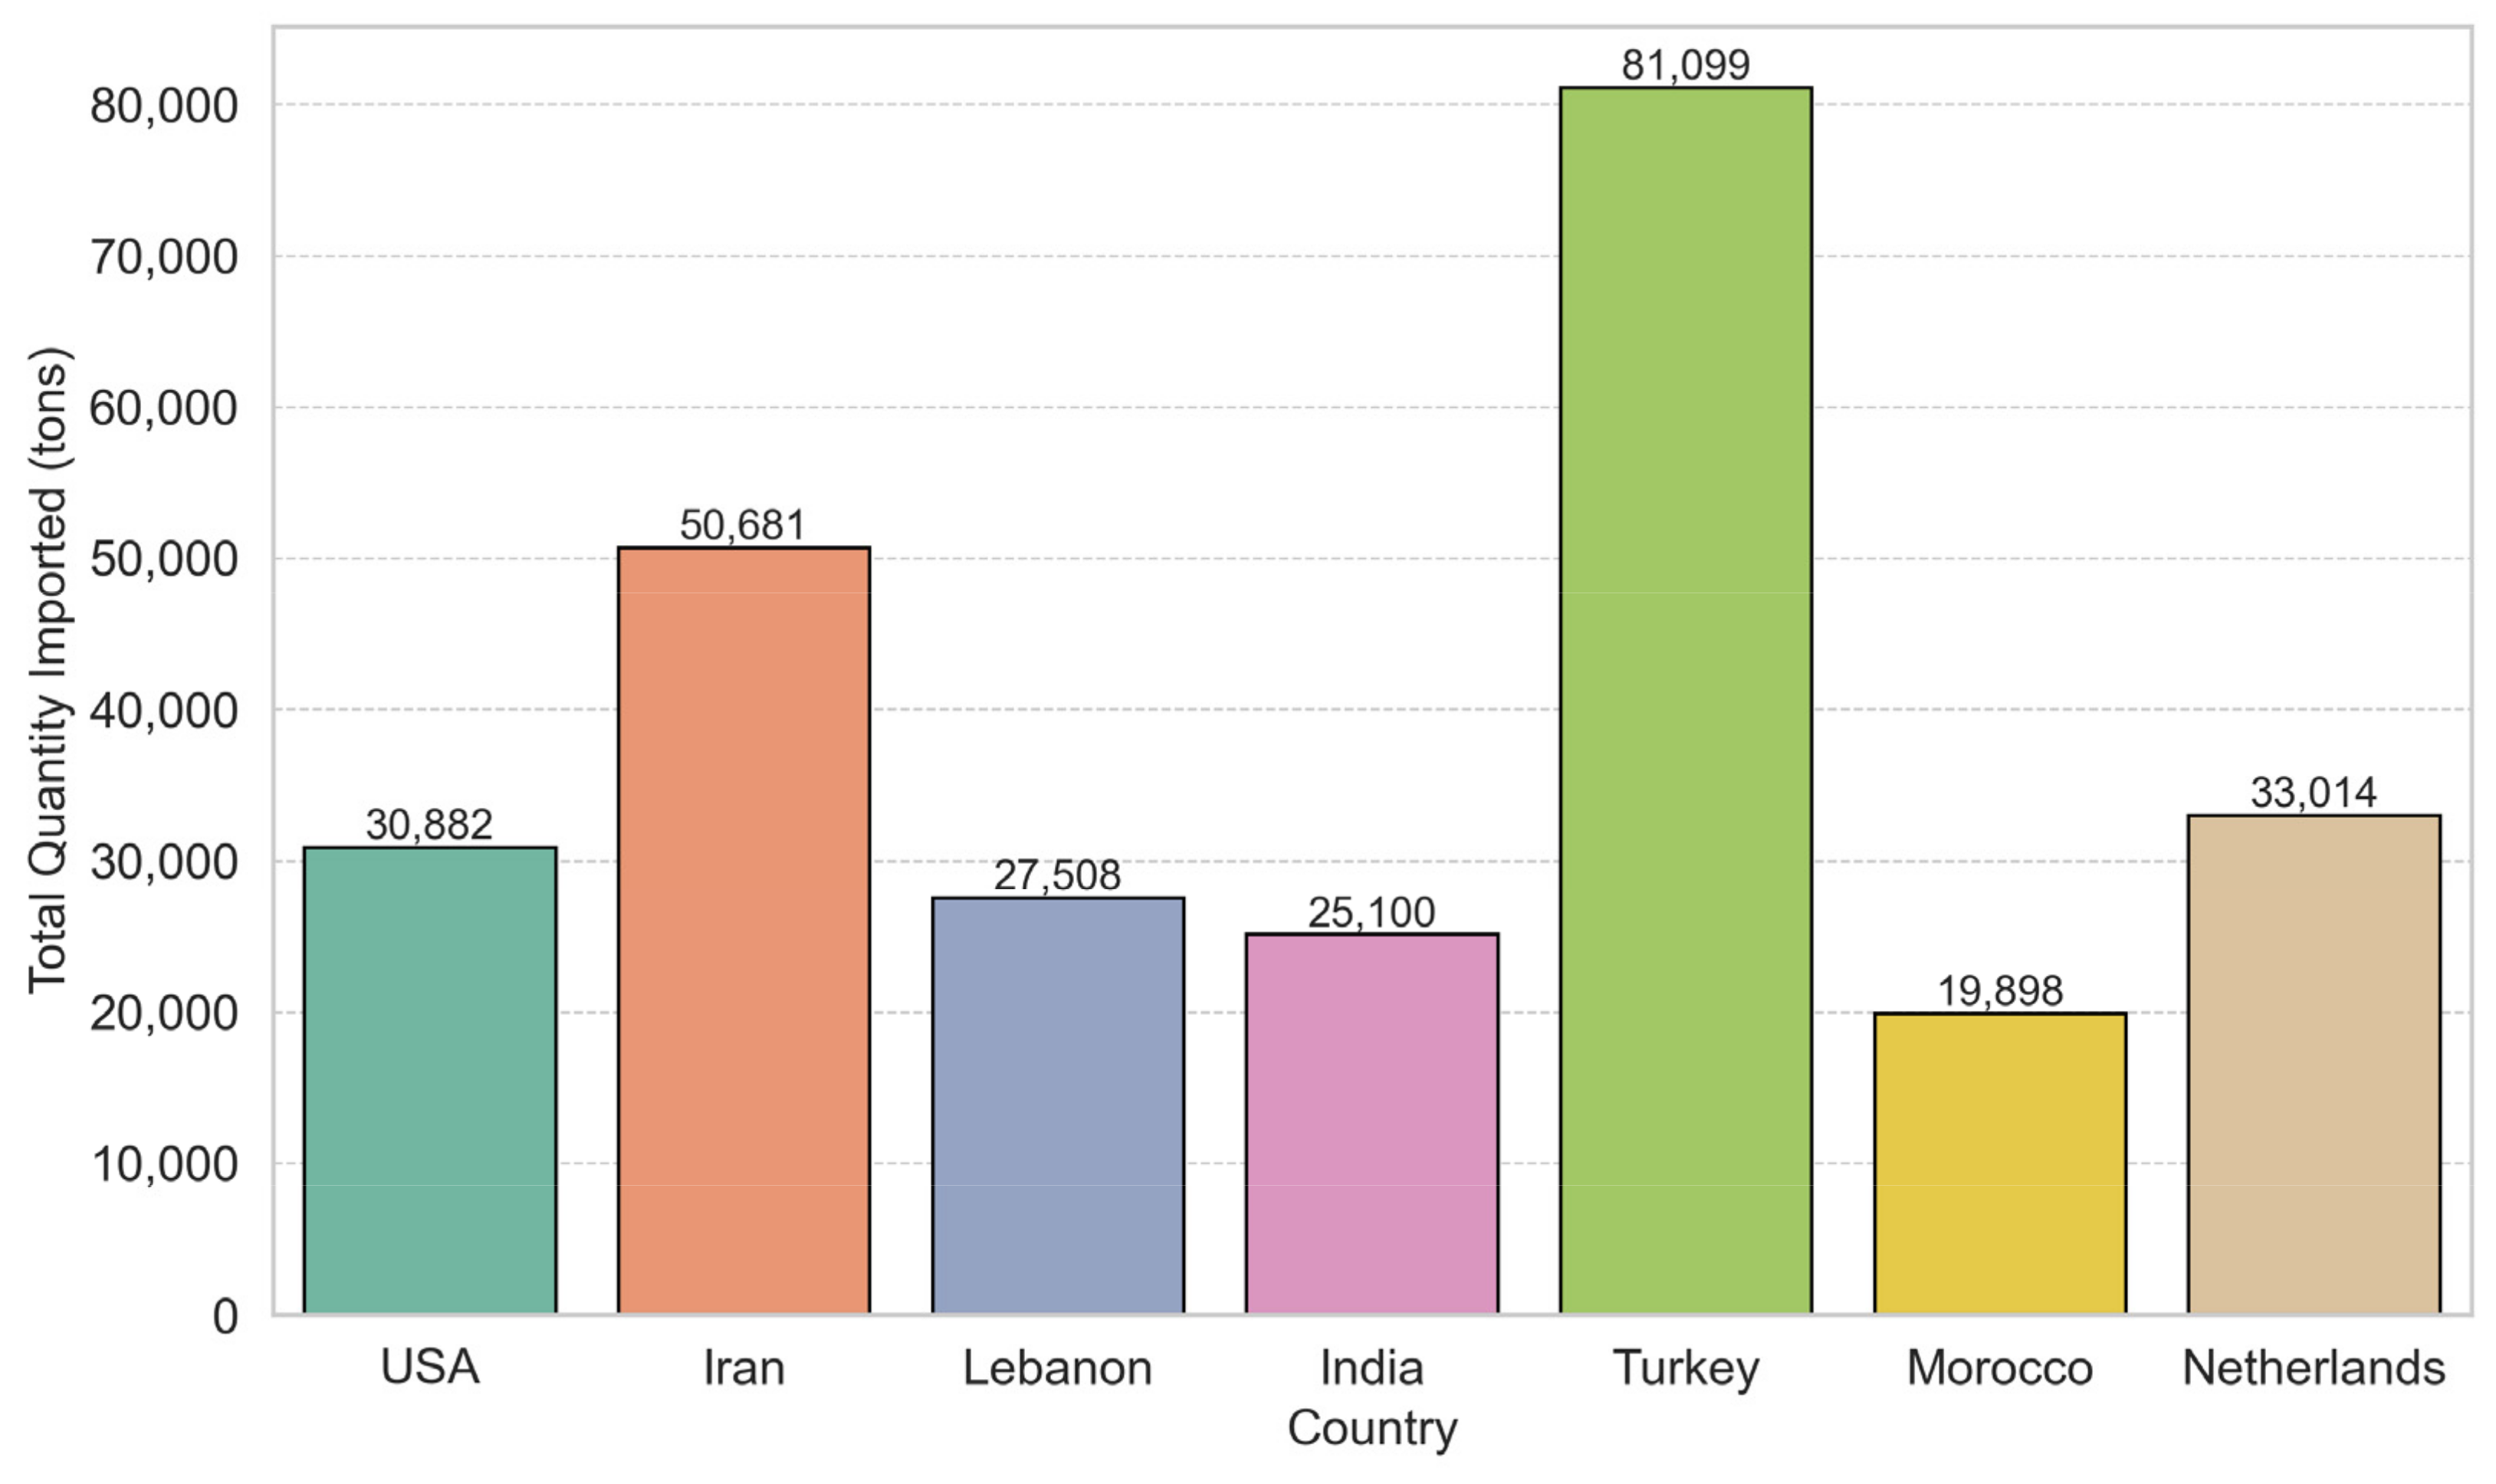
4.1.2. Overall Country Contributions
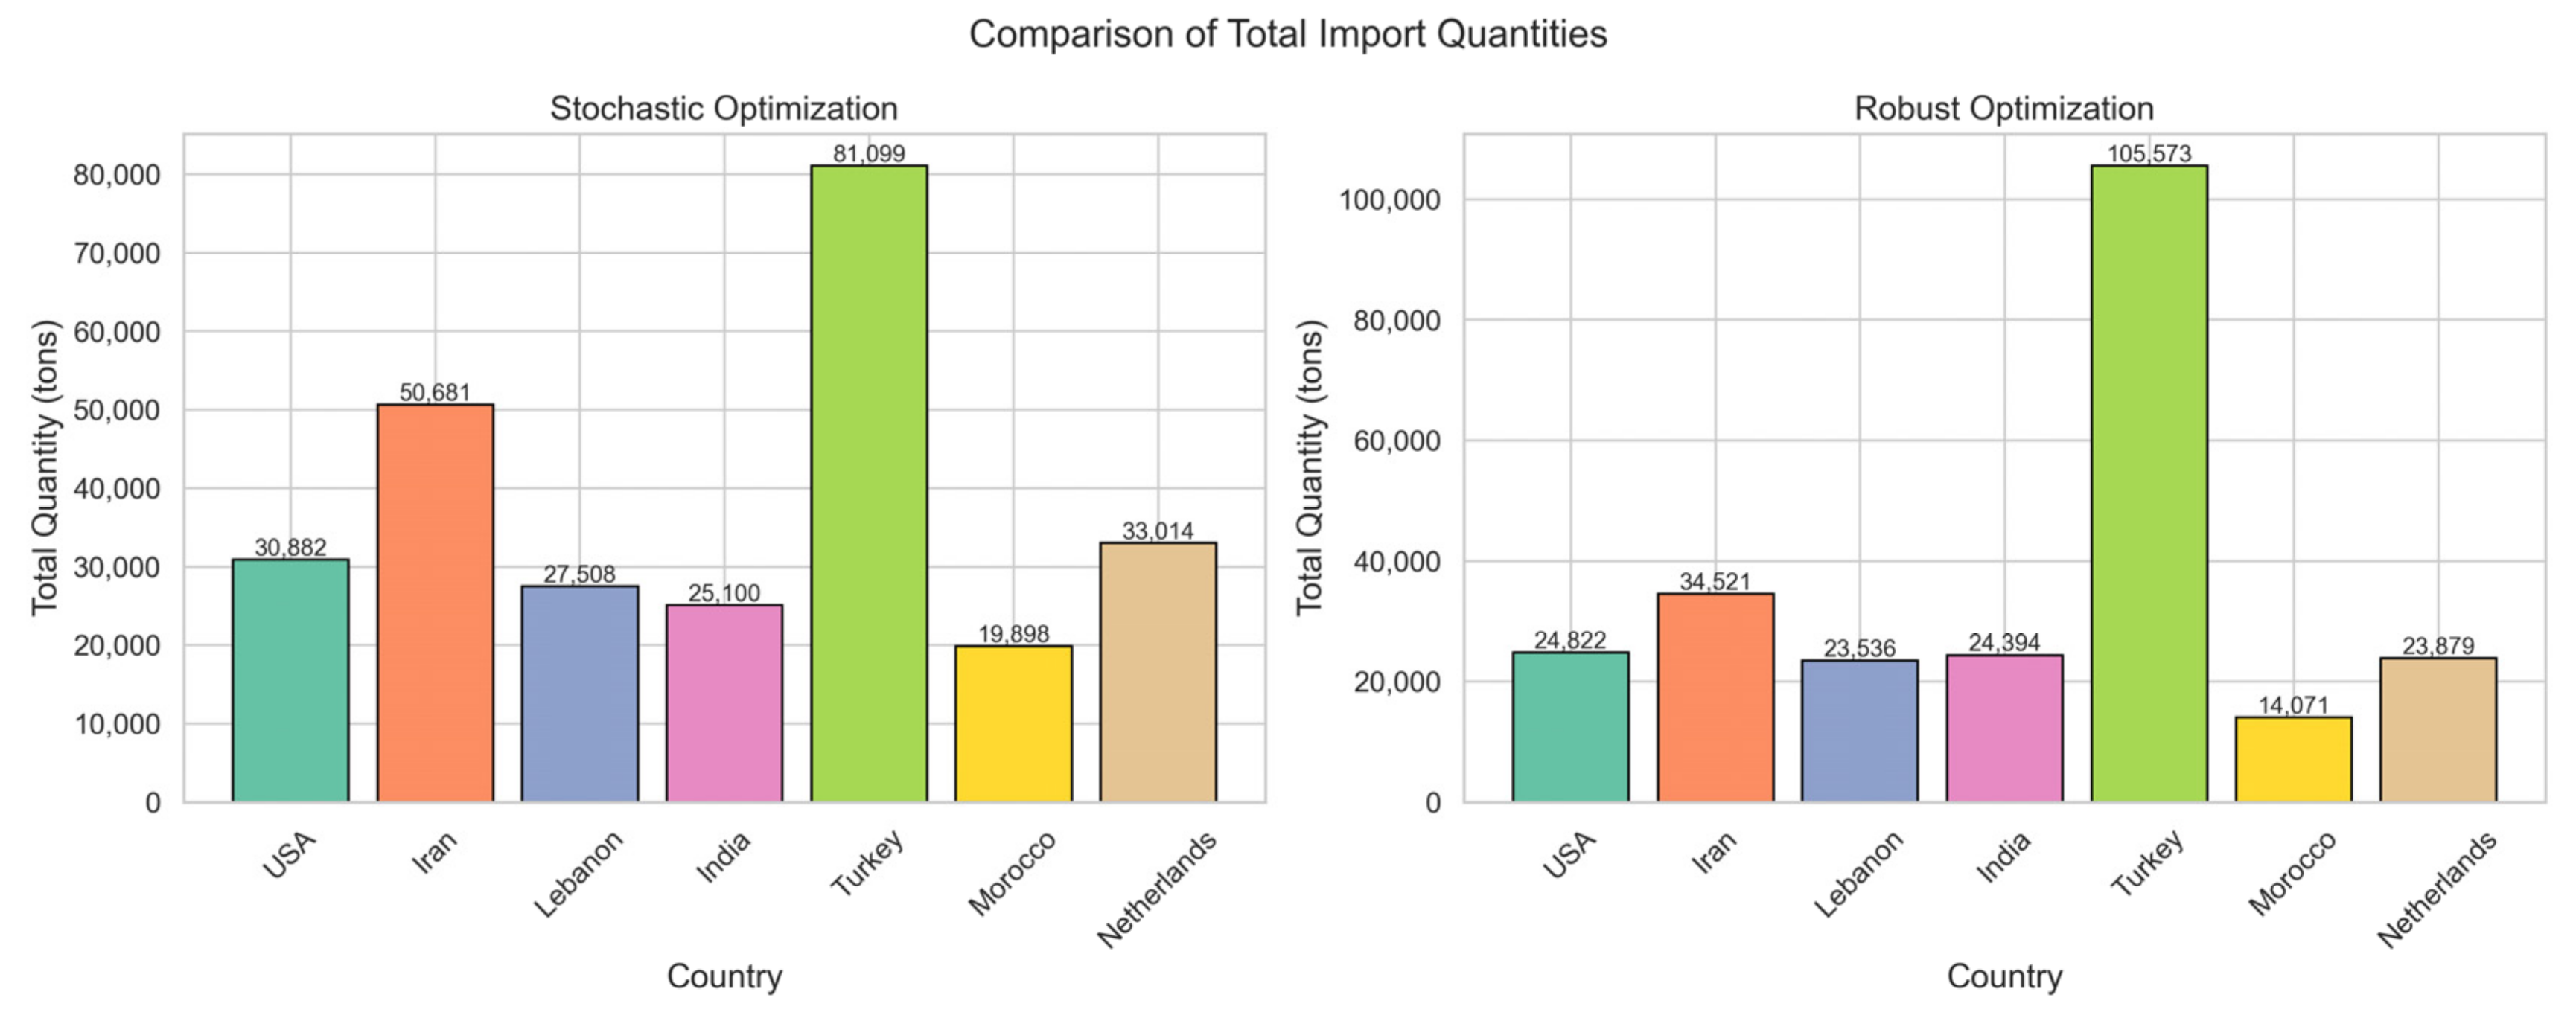
Considering total imports across all three crops, Turkey was the largest contributor, supplying 81,099 tons (30.24% of the overall total), as demonstrated in
Figure 2. This significant contribution is due to Turkey’s substantial import contribution in all three crops, being the leading supplier for tomatoes (29.46%), onions (27.46%), and cucumbers (31.77%). Iran was the second largest supplier with 50,681 tons (18.90%), with notable contributions in cucumbers (21.52%), tomatoes (17.45%), and onions (17.55%). The Netherlands contributed 33,014 tons (12.31%), maintaining consistent contributions across tomatoes (11.54%), onions (11.88%), and cucumbers (13.69%). The USA supplied 30,882 tons (11.52%), with balanced contributions in tomatoes (10.58%), onions (11.03%), and cucumbers (13.18%). Lebanon, India, and the Netherlands each contribute approximately 25,100 to 33,014 tons, accounting for around 10% of the overall total each. Their consistent contributions across all three crops reflect the constraints ensuring diversification and limiting dependence on any single supplier.
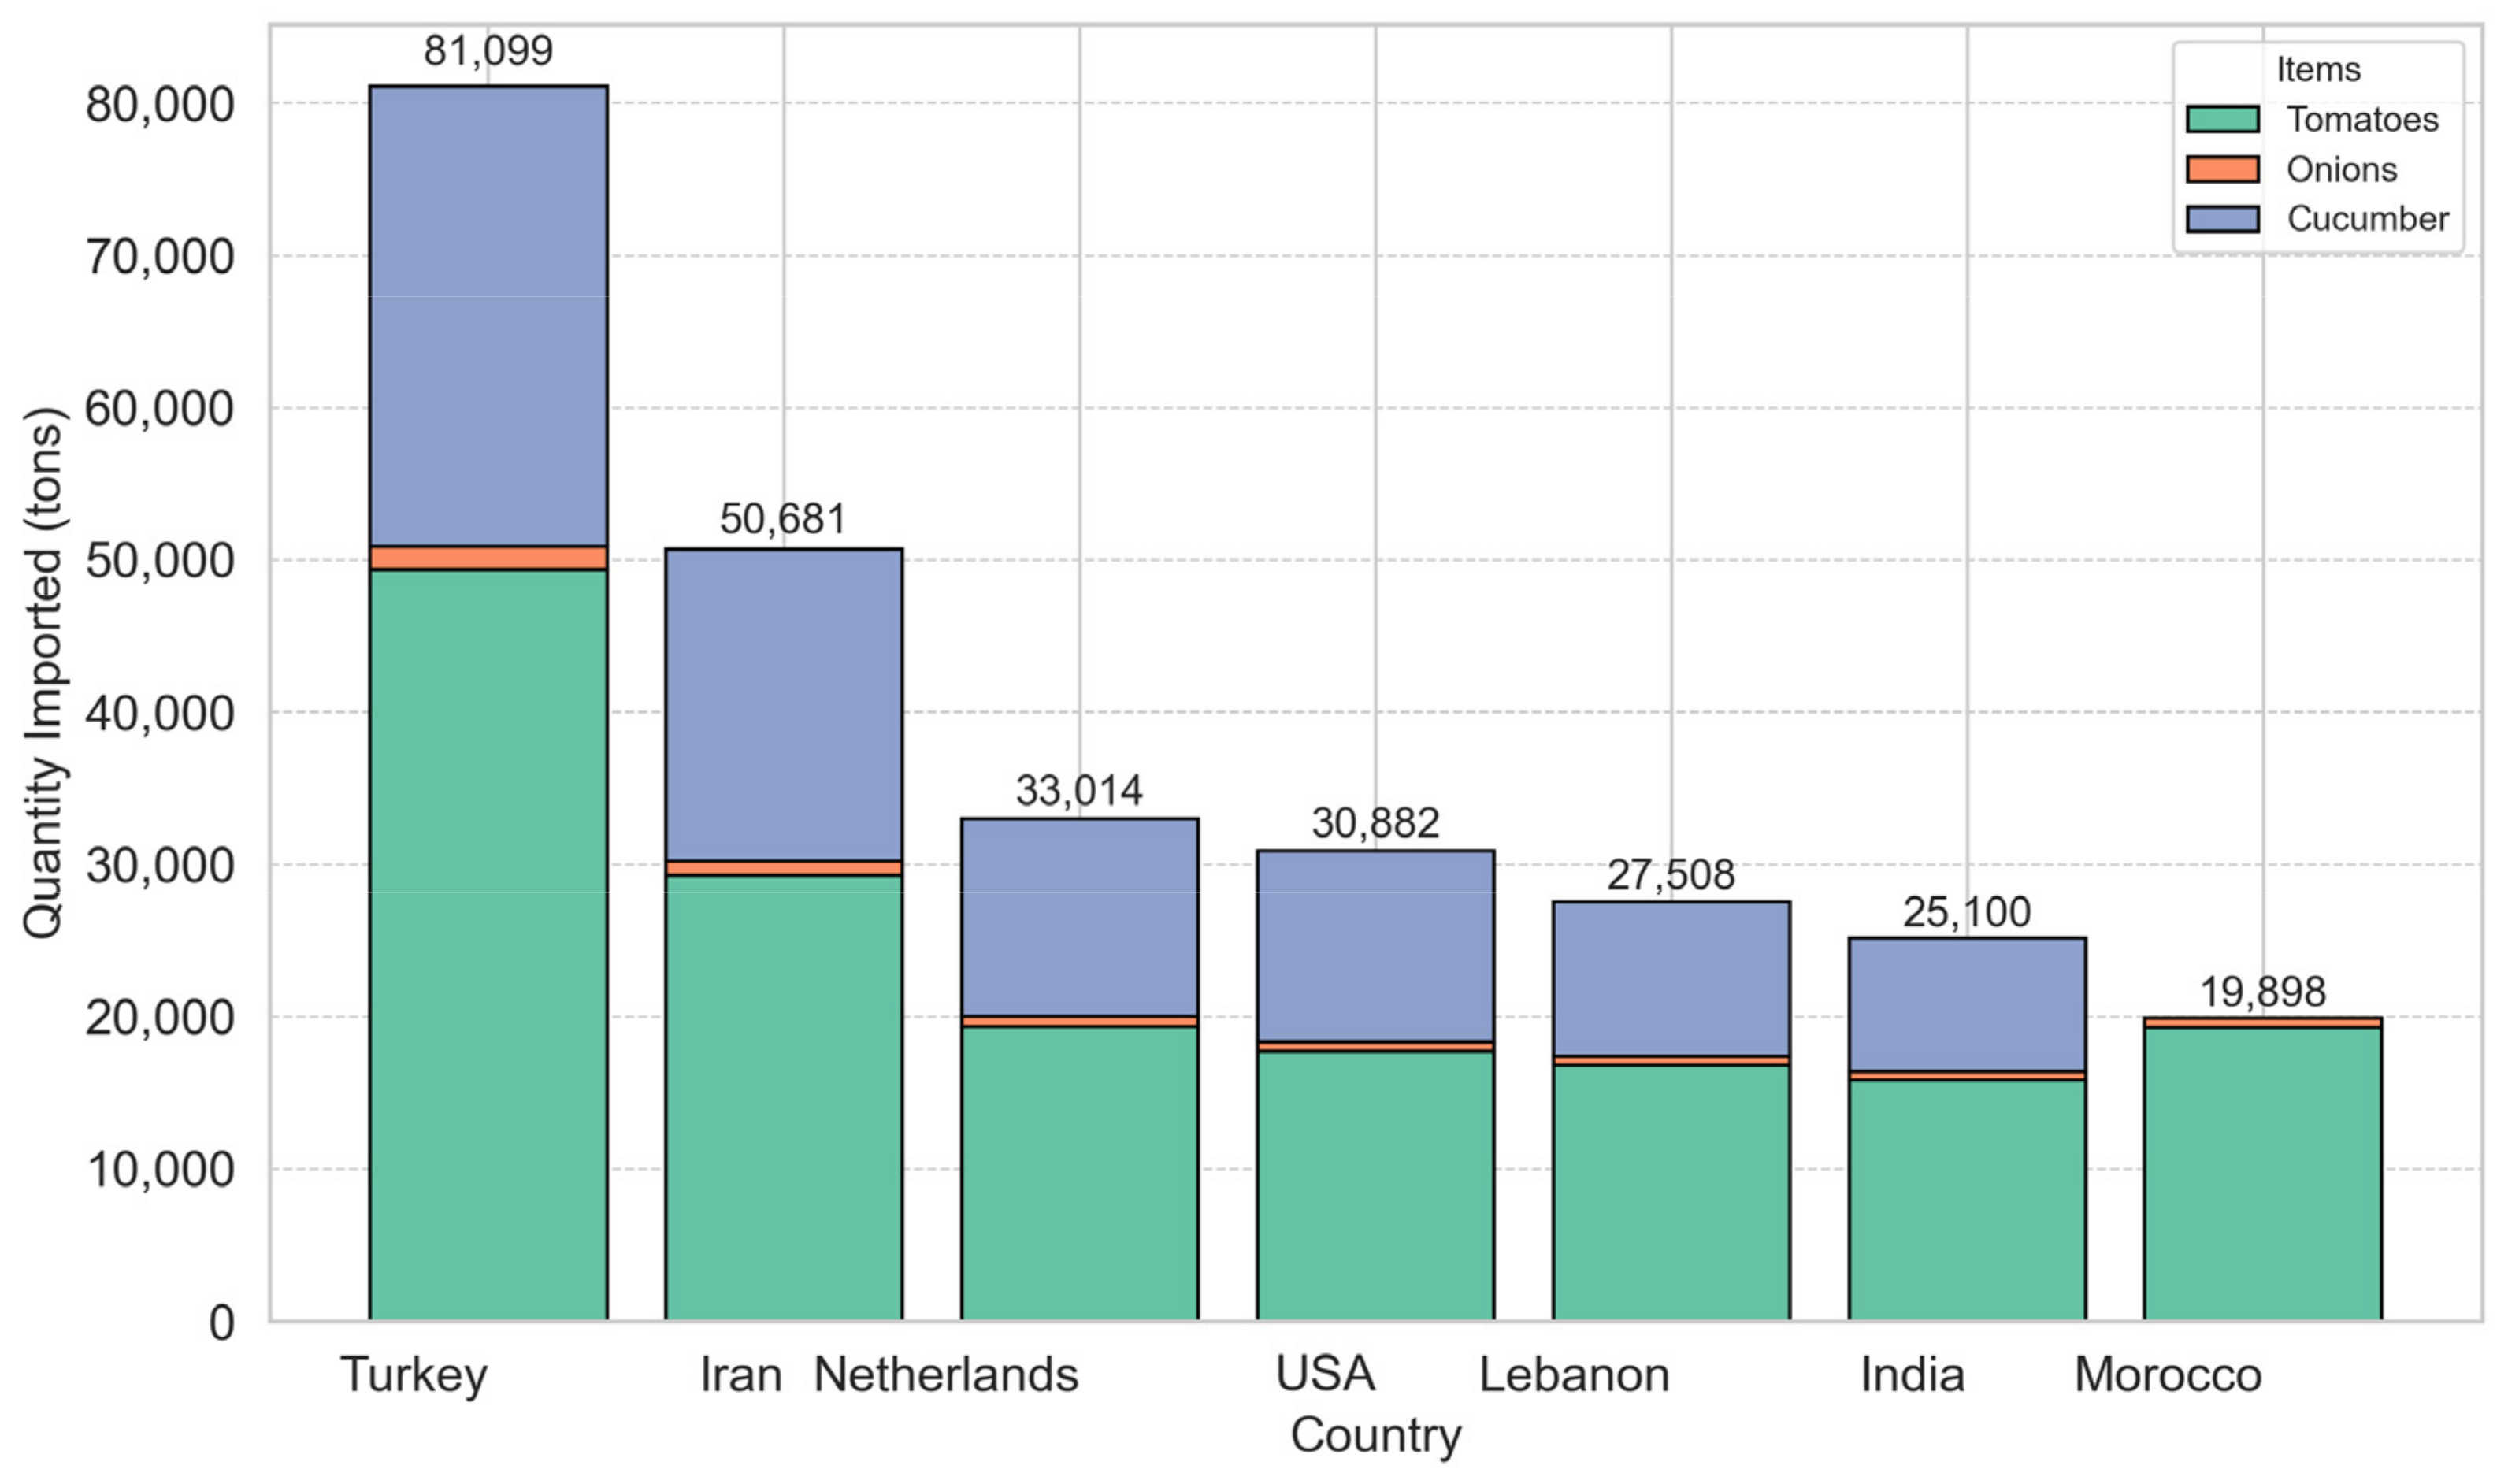
4.1.3. Effective and Initial Quantities: Stochastic Scenario
The optimization model accounted for waste and loss factors during transportation, impacting the initial quantities to be imported to meet effective demand. The total quantities before accounting for waste and loss were 167,494.16 tons for tomatoes, 5430.10 tons for onions, and 95,257.10 tons for cucumbers as demonstrated in
Figure 3, to meet the respective demands. The initial quantities before degradation are higher due to anticipated losses. For instance, Turkey’s initial quantities were 49,344.14 tons of tomatoes, 1491.23 tons of onions, and 30,263.27 tons of cucumbers. After applying their specific waste and loss factors (9.28% for tomatoes, 1.05% for onions, and 17.50% for cucumbers), the effective quantities would be approximately 44,763.01 tons for tomatoes, 1475.57 tons for onions, and 24,967.20 tons for cucumbers. This adjustment process was applied across all suppliers to ensure actual demand fulfillment despite losses during transportation and handling.
4.2. Robust Optimization
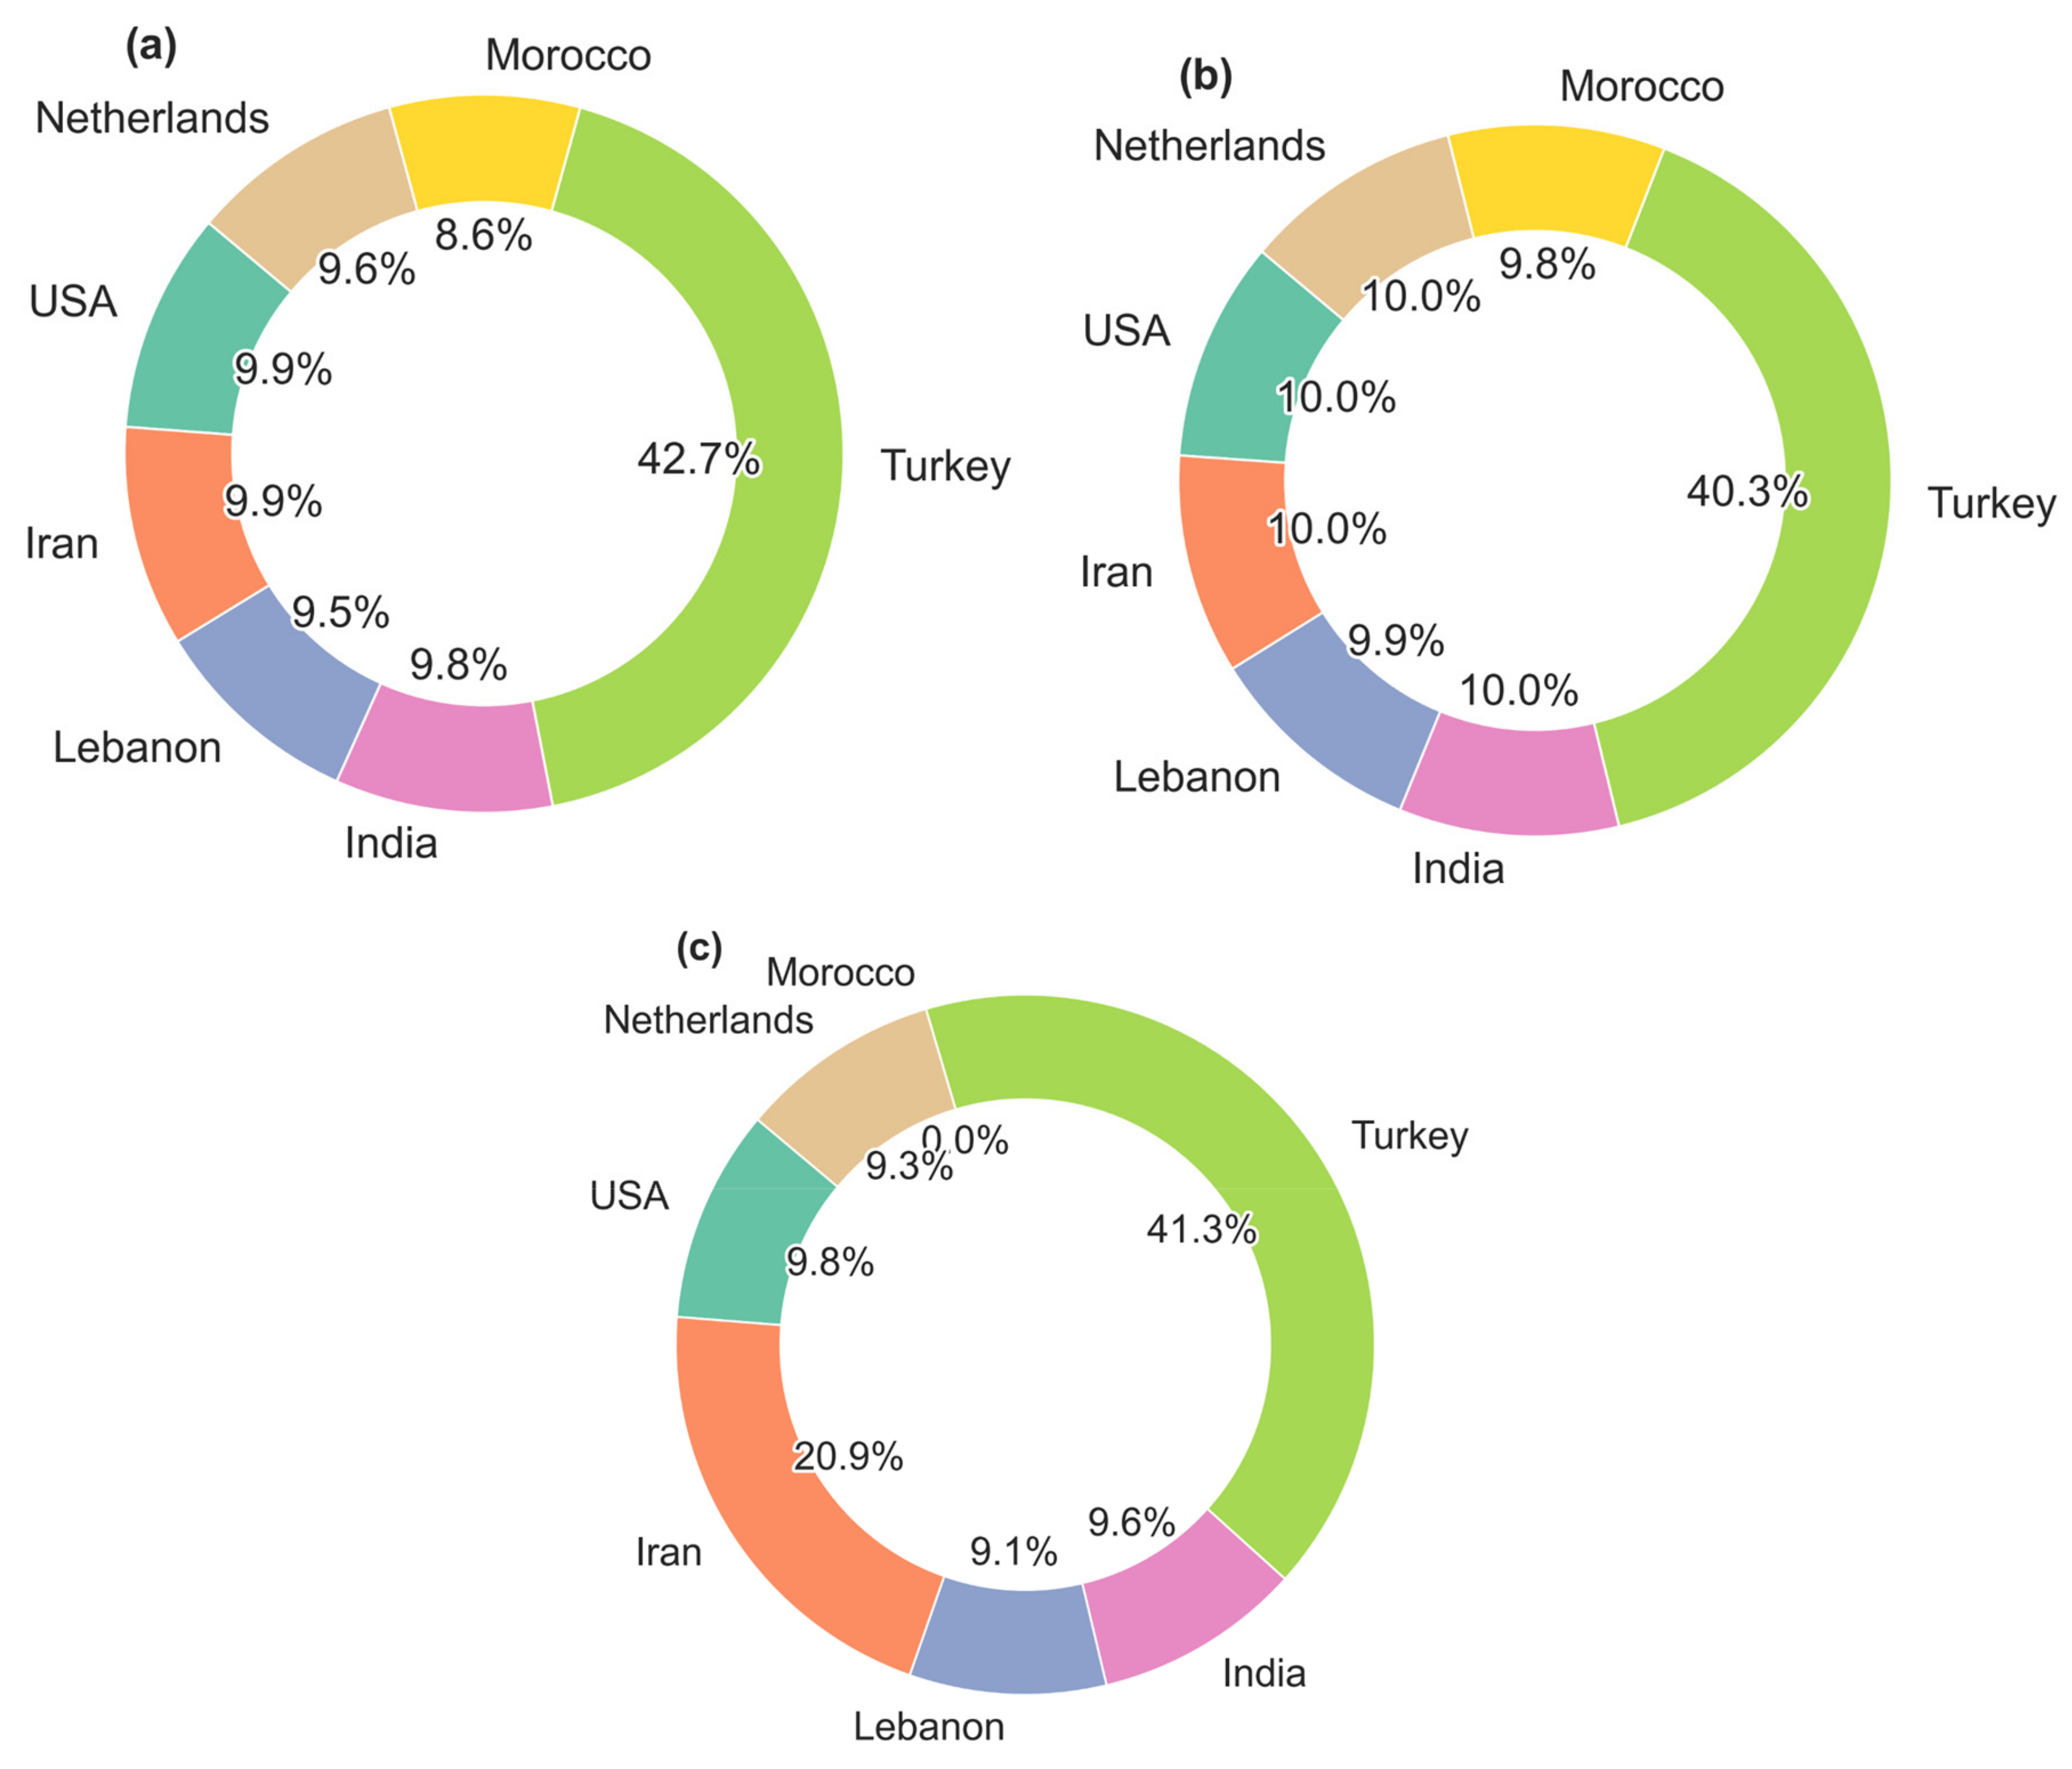
4.2.1. Optimal Import Networks: Robust Scenario
A min-max approach was adopted for the robust optimization to determine the optimal import quantities of tomatoes, onions, and cucumbers from seven countries—USA, Iran, Lebanon, India, Turkey, Morocco, and the Netherlands—while minimizing the worst-case scenarios of CWR as illustrated in
Figure 4.
The total effective quantity imported for tomatoes was 158,008 tons after accounting for waste and loss. Turkey was the largest supplier, contributing an effective quantity of 67,349.33 tons, which accounted for 42.70% of the total tomato imports. This significant share is due to Turkey’s competitive costs, low emissions, acceptable waste and loss factors, and favorable CWR. The USA, Iran, Lebanon, India, and the Netherlands each contributed an effective quantity ranging from 15,047.10 to 15,717.06 tons, representing approximately 9.52% to 9.95% of the total effective tomato imports each. Morocco contributed 13,539.71 tons, accounting for 8.60% of the total tomato imports. These contributions are close to the lower limit of the supply constraint, which requires each acceptable supplier to contribute between 10% and 50% of the total demand for each item. However, some contributions are slightly below 10%. This discrepancy can be attributed to computational tolerances and rounding errors in the optimization process. In practice, optimization solvers often accept small deviations from constraints due to numerical precision limits and the need to balance multiple competing objectives.
For onions, the total effective quantity imported is 5396 tons, exactly meeting the demand after waste and loss adjustments. Turkey again is the largest supplier, providing an effective quantity of 2174.43 tons, accounting for 40.30% of the total effective onion imports. This reinforces Turkey’s favorable position in the import network due to its competitive costs, low emissions, acceptable waste and loss factors, and manageable CWR. The USA, Iran, Lebanon, India, Morocco, and the Netherlands each supplied an effective quantity of approximately 530.86 to 539.28 tons, representing around 9.90% to 10.00% of the total effective onion imports each. These contributions are close to the lower limit of the supply constraint but are slightly below 10% in some cases.
In the case of cucumbers, the total effective quantity imported is 87,392 tons, fulfilling the demand precisely after accounting for waste and loss. Turkey is the dominant supplier, contributing an effective quantity of 36,049.20 tons, which is 41.30% of the total effective cucumber imports. The significant share from Turkey can be attributed to its acceptance of waste and loss factor (17.50% for cucumbers) and competitive costs. Iran provided an effective quantity of 18,264.93 tons (20.90%), while the USA contributed 8608.11 tons (9.80%), India supplied 8389.63 tons (9.60%), the Netherlands provided 8127.46 tons (9.30%), and Lebanon contributes 7952.67 tons (9.10%) of the total effective cucumber imports. Morocco does not supply cucumbers due to its high waste and loss factor (27% for cucumbers), exceeding the acceptable threshold of 20%.
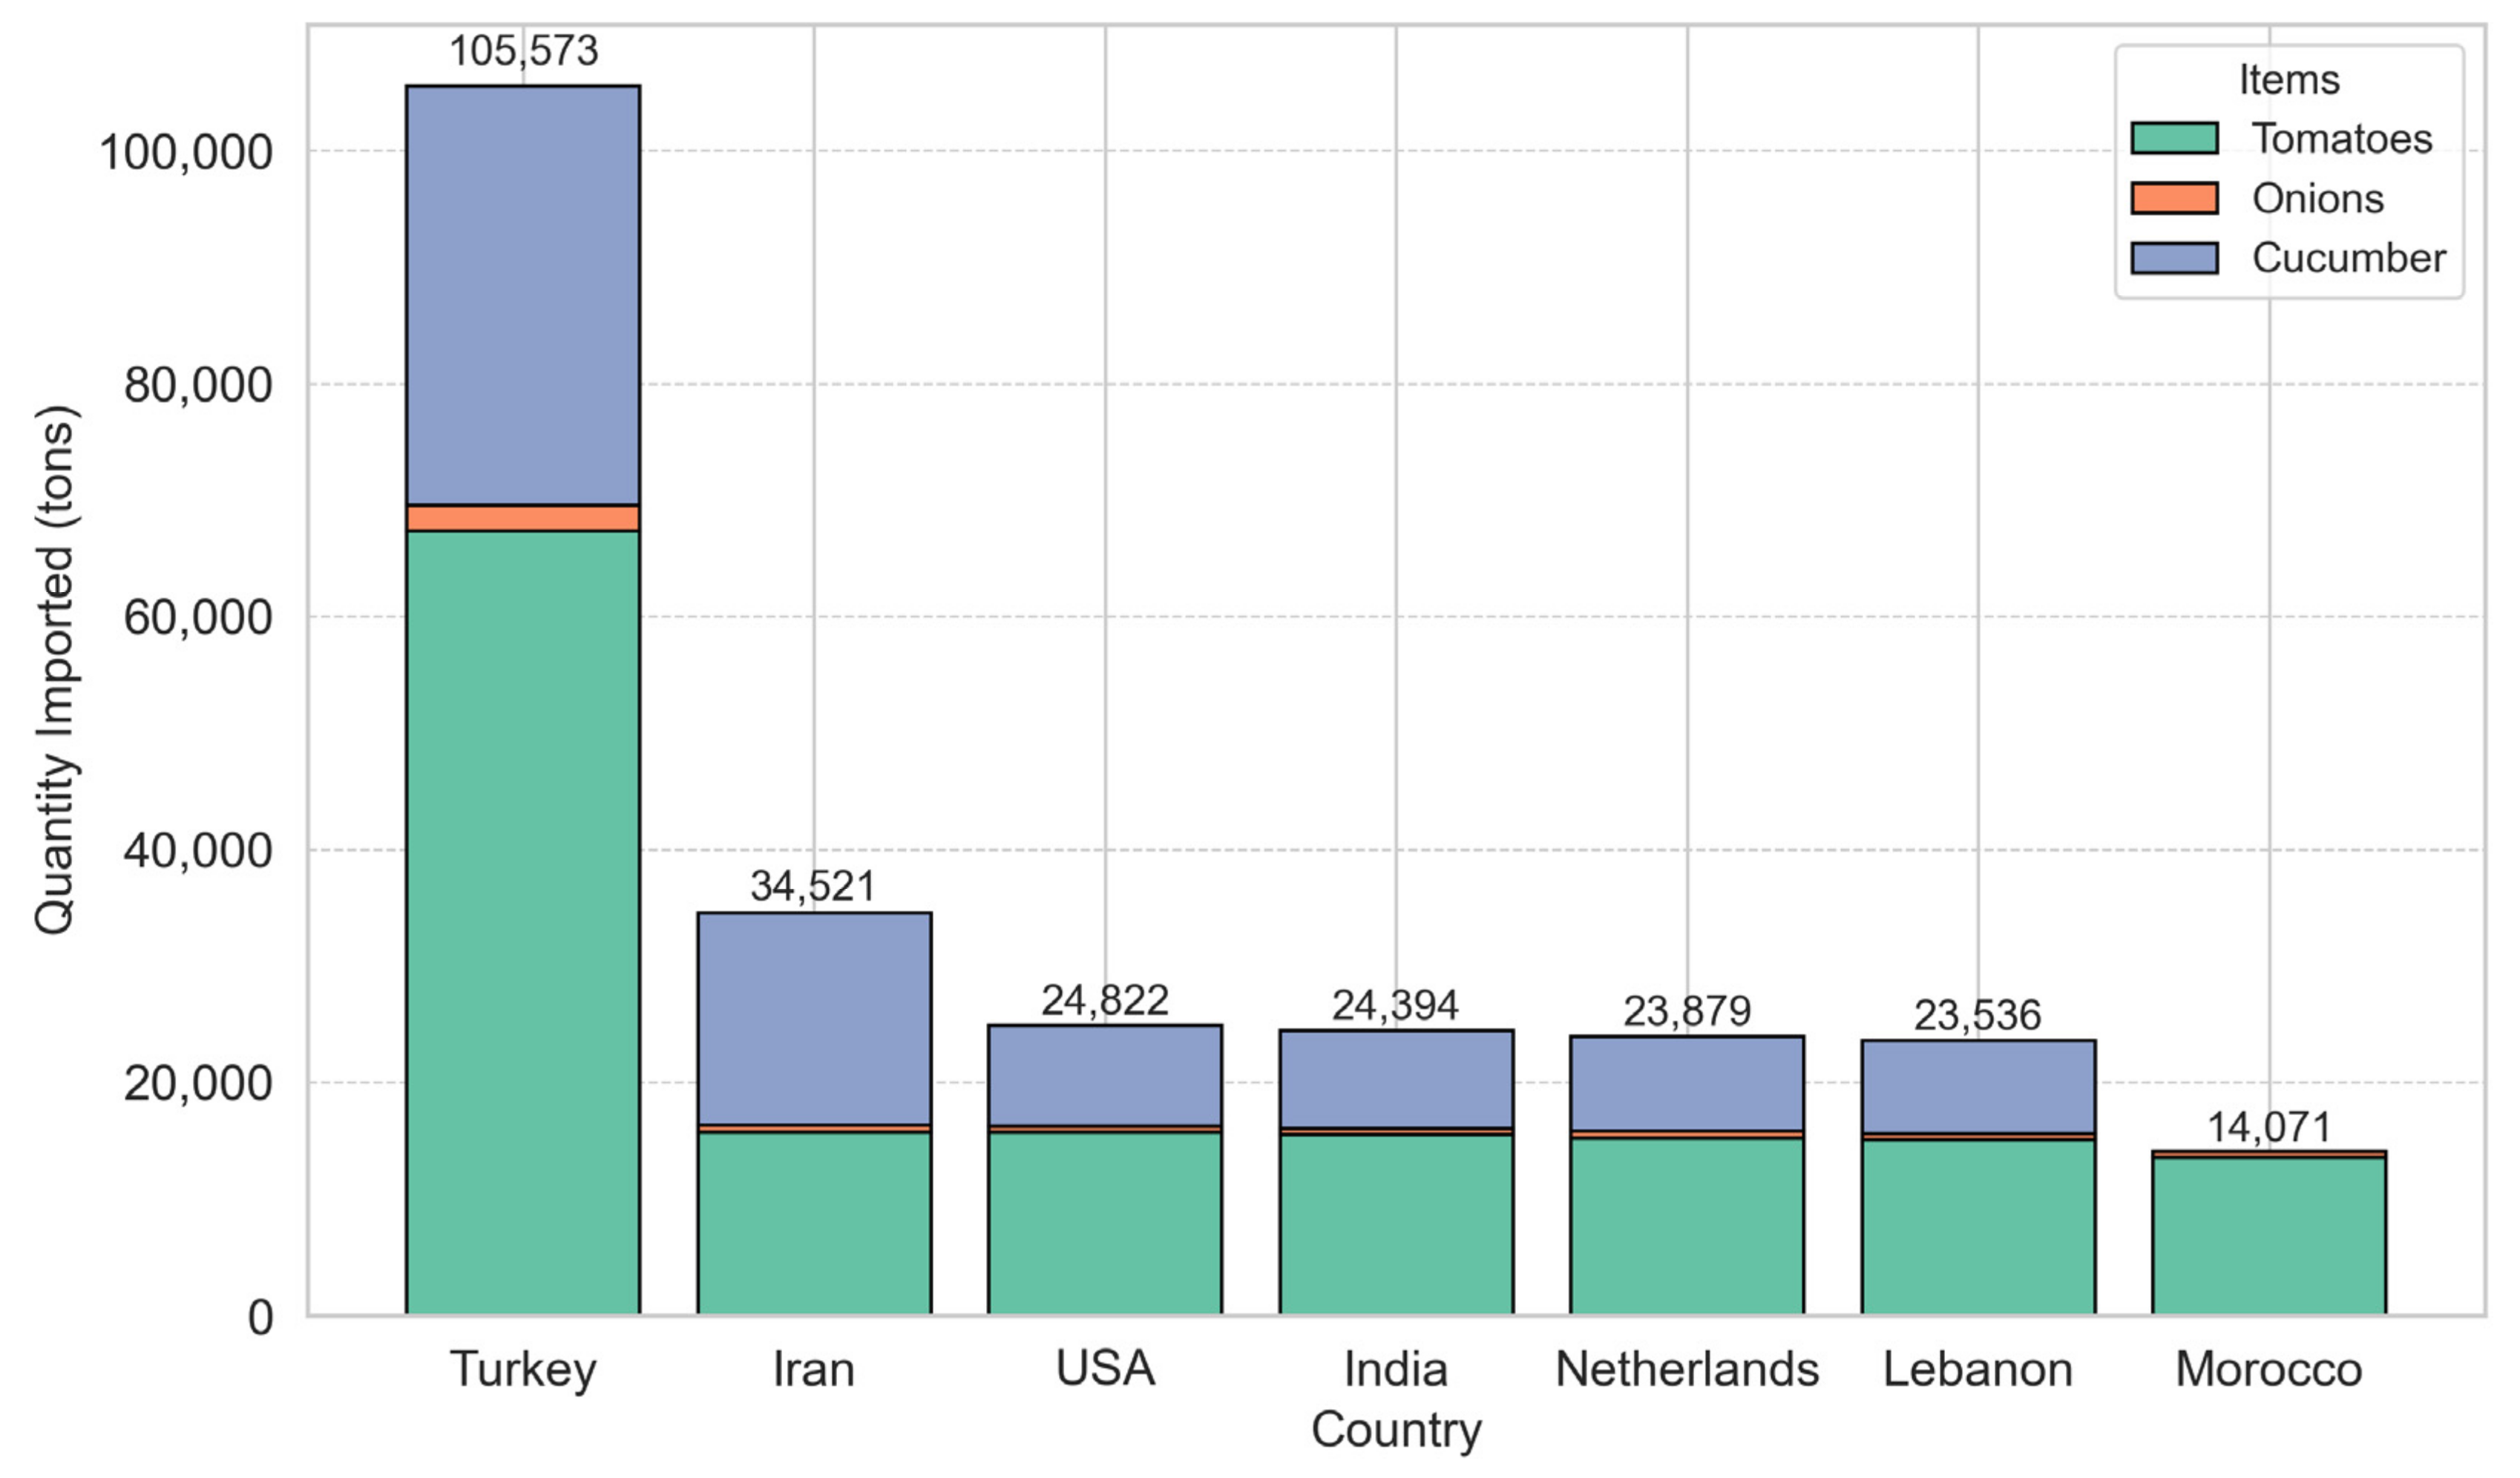
4.2.2. Overall Country Contributions: Robust Scenario
Considering the total effective quantities across all three crops, Turkey is the largest contributor, supplying a total of 105,573 tons, which accounts for 42.10% of the overall quantity, as demonstrated in
Figure 5. This dominance is primarily due to its substantial contribution to tomatoes, onions, and cucumbers. Iran contributes 34,521 tons (13.76%), followed by the USA with 24,822 tons (9.90%), India with 24,394 tons (9.73%), the Netherlands with 23,879 tons (9.52%), Lebanon with 23,536 tons (9.38%), and Morocco with 14,071 tons (5.61%).
While Turkey emerges as the dominant supplier (42.10% of total imports), its long-term reliability under shifting climatic conditions warrants careful consideration. Analysis of Turkey’s historical CWR data shows significant variability (σ = 417.26 m3/kg for tomatoes), and climate projections for the Mediterranean region indicate increasing water stress and temperature extremes. This could affect Turkey’s agricultural productivity in two ways: first, through direct impacts on crop yields due to changing temperature and precipitation patterns, and second, through increased competition for water resources between agricultural and urban uses. However, Turkey’s robust agricultural infrastructure, diverse growing regions, and significant investments in climate-adaptive farming technologies partially mitigate these risks. The country’s geographic proximity to Qatar also provides logistical advantages that could help maintain supply chain stability even under stressed conditions. Nevertheless, the high reliance on Turkey as a primary supplier highlights the significance of sustaining the diversified supplier network identified in our optimization model, as it serves as a buffer against possible climate-induced disruptions in any single source country.
4.2.3. Effective and Initial Quantities
The initial quantities (before accounting for waste and loss) are higher to compensate for anticipated losses during transportation and handling as depicted in
Figure 6. For instance, Turkey’s initial quantity of tomatoes is approximately 74,253.15 tons, which, after a waste and loss adjustment of 9.28%, results in an effective quantity of 67,349.33 tons. Similarly, the USA’s initial quantity of cucumbers is approximately 8738.40 tons, leading to an effective quantity of 8608.11 tons after a 1.50% waste and loss adjustment. This ensures that the actual demand is satisfied despite losses, maintaining supply chain reliability.
The robust optimization results exhibit a strategic allocation of import quantities to minimize the worst-case total cost, emissions, and water consumption. The results differ from stochastic optimization due to the nature of the min–max approach, which seeks to minimize the worst-case outcomes across all scenarios. This leads to decisions that are conservative and resilient against extreme conditions. The emphasis on worst-case CWR means that countries and crops with lower variability and lower maximum water usage under adverse scenarios are preferred. Turkey’s significant contribution, particularly in tomatoes, onions, and cucumbers, suggests that it offers favorable conditions even under worst-case scenarios, with manageable water consumption, costs, and emissions. The relatively uniform contributions from Iran, Lebanon, India, USA, and the Netherlands across all three crops highlight the model’s emphasis on diversification to mitigate risks associated with uncertainties in water consumption and other factors. Each of these countries contributes approximately 9% to 13% of the total effective imports for various crops. This diversification ensures that the supply chain is not overly dependent on a single source, enhancing resilience against potential disruptions.
The robust optimization’s conservative allocation reflects a trade-off between optimizing for average expected outcomes (as in stochastic optimization) and safeguarding against the worst possible scenarios. This approach is particularly valuable when dealing with uncertainties in environmental factors like CWR, where worst-case conditions could have significant impacts on supply chain reliability. By prioritizing suppliers with lower worst-case CWR and consistent performance across scenarios, the model ensures that the supply chain remains robust even under adverse conditions.
The comparative visualization of stochastic and robust optimization results reveals distinct patterns in supplier allocation strategies for Qatar’s food import system. Under the stochastic approach, imports are more evenly distributed among suppliers, especially for tomatoes and onions, while the robust method concentrates a larger share of imports from Turkey. This difference reflects the core objectives of each approach: stochastic optimization seeks to maximize average performance across multiple scenarios, whereas robust optimization prioritizes stability under worst-case conditions. Turkey’s dominant role is evident in both methods, but its influence is markedly greater under robust optimization. For instance, Turkey supplies 29.46% of tomato imports, 27.46% of onions, and 31.77% of cucumbers under stochastic optimization; these figures increase to 42.62%, 40.30%, and 41.25%, respectively, under robust optimization. This increased reliance on Turkey in the robust scenario underscores its reliability as a supplier—due to its geographical proximity, well-established trade relationships, and strong agricultural infrastructure. The landscape for secondary suppliers also varies between the two methods. Iran consistently ranks as the second-largest supplier, though its allocations differ; for example, Iran receives 17.45% of tomatoes and 21.52% of cucumbers under the stochastic model, compared to approximately 9.95% and 20.90% under the robust model. Other suppliers, such as the Netherlands and the USA, exhibit relatively stable contributions, albeit with slightly reduced shares in the robust scenario. Notably, Morocco displays significant variation, particularly for tomatoes, where its allocation diverges considerably between the two methods. Overall, these results highlight the inherent trade-offs between supply chain efficiency and resilience. The stochastic approach, with its balanced allocations, offers potential cost efficiency and market flexibility, whereas the robust method’s focus on concentrating imports from reliable suppliers enhances supply chain stability under adverse conditions, albeit potentially at higher operational costs. This analysis provides valuable insights for policymakers in Qatar, demonstrating how different optimization strategies can be used to balance cost efficiency, supply chain resilience, and climate risk mitigation in food import systems (
Figure 7).
4.3. Analysis of Trade-Offs in Supplier Selection
The optimization results demonstrate significant trade-offs between economic costs, environmental impact, and water use variability when selecting suppliers. Turkey’s dominant position (42.10% of total imports) demonstrates these trade-offs: while offering competitive economic costs (averaging 15–20% lower than other suppliers), its selection comes with moderate environmental emissions from transportation and varying levels of water requirement uncertainty. Iran’s significant contribution (13.76%) represents a different balance, with slightly higher economic costs but lower transportation emissions due to geographical proximity. However, Iran shows higher water requirement variability (σ = 512.94 m3/kg for tomatoes) compared to other suppliers.
The Netherlands, contributing 9.52% of imports, exemplifies the trade-off between high environmental impact due to long-distance transportation and stable water requirements (σ = 300.87 m3/kg for tomatoes) owing to advanced agricultural technologies. This stability in water requirements comes at a premium, with costs approximately 25–30% higher than regional suppliers. These trade-offs become more pronounced under the robust optimization approach, where protecting against worst-case scenarios leads to an average cost increase of 18% compared to the stochastic optimization results but provides a 23% reduction in maximum water requirement variability.
The diversification strategy itself represents a trade-off between system efficiency and resilience. While concentrating imports among fewer suppliers could reduce operational costs by approximately 12–15%, the current diversified approach provides essential risk mitigation against both climate variability and supply chain disruptions. This is particularly evident in the case of Morocco, where despite competitive pricing, its high degradation factors limit its role in the supply chain, demonstrating how quality preservation considerations can outweigh pure economic advantages.
4.4. Implementation Considerations and Policy Recommendations
The implementation of a diversified import strategy in Qatar faces several practical challenges and barriers that policymakers must address. First, existing long-term contracts and established trade relationships may limit Qatar’s immediate ability to adjust import proportions according to the optimization model’s recommendations. Transitioning from current import patterns (where some suppliers may hold dominant positions) to the proposed diversified structure requires careful diplomatic and commercial negotiations. Second, infrastructure limitations, particularly in port capacity and specialized storage facilities for perishable goods, could constrain the ability to handle multiple simultaneous shipments from different suppliers effectively. A phased approach is necessary for successful implementation. In the short term (1–2 years), efforts should focus on developing additional cold storage infrastructure and upgrading port facilities to accommodate diverse shipment schedules. Medium-term actions (2–5 years) should include establishing new trade agreements with recommended suppliers while maintaining existing relationships and developing quality control protocols specific to each supplier’s products and transportation routes. Long-term strategies (5+ years) should prioritize building resilience through investments in suppliers’ agricultural infrastructure and establishing joint early warning systems for climate-related disruptions. Financial implications must also be considered. While diversification enhances resilience, it may initially increase operational costs by 15–20% due to the complexity of managing multiple suppliers and smaller shipment volumes. However, these costs can be partially offset by reduced risk premiums and lower emergency procurement expenses during supply disruptions. To facilitate implementation, a dedicated task force within Qatar’s food security apparatus should be established to coordinate among multiple stakeholders, including port authorities, customs officials, quality control agencies, and private sector importers.
5. Limitations and Future Research Endeavor
While this study provides valuable insights for optimizing Qatar’s food import system, several limitations must be acknowledged. First, the model assumes a normal distribution of CWR, which may not fully capture extreme climate events or non-linear climate impacts. Moreover, by focusing primarily on CWR as the key climate variable, the model overlooks other critical factors, such as soil conditions, pest prevalence, and extreme weather events, that can significantly influence crop production and supply chain resilience. Data-related uncertainties further complicate the analysis; variability in data accuracy, measurement methodologies, and reporting standards across exporting countries may affect the reliability of both climate variability and trade condition data. Additionally, other important risk factors, such as the political stability of supplier countries and short-term price fluctuations, have not been fully incorporated into the framework. Second, the study’s scope is limited to three crops (tomatoes, onions, and cucumbers) and seven major supplier countries, which restricts the generalizability of the findings to other agricultural products and regions. The framework’s focus on optimizing imports from established trade partners, without considering potential new sourcing regions or alternative crops, may overlook emerging markets that could enhance supply chain resilience, especially for perishable goods with different storage requirements and market dynamics. Third, the model relies on historical data for estimating degradation factors and transportation times, which may not accurately reflect future supply chain disruptions or technological advancements in preservation methods. Furthermore, economic parameters such as production and transportation costs are subject to market fluctuations and require regular updates, while the model’s static nature does not capture long-term shifts in trade relationships and agricultural production patterns driven by climate change.
Future research should address these limitations by expanding the scope of the framework to include a broader range of agricultural products, such as grains, dairy, and protein sources, and by incorporating data on emerging supplier regions. Enhancements to the model should also consider additional risk factors like geopolitical stability and short-term price volatility and adopt dynamic modeling approaches that account for evolving trade relationships, technological advancements in logistics and food preservation, and long-term climate change impacts. Moreover, establishing robust data collection and verification protocols through collaboration with international organizations, such as the FAO, can help improve data reliability and mitigate reporting biases. These extensions will not only enhance the model’s practical utility for strategic planning and policy development but also provide a more comprehensive understanding of global food supply chain resilience in the face of climate variability and market uncertainties.
6. Conclusions
This study presents a comprehensive optimization framework aimed at enhancing the resilience of Qatar’s food import system against climate-induced uncertainties. By integrating a multi-objective optimization approach, the model effectively addresses three key objectives: minimizing economic costs, reducing environmental emissions, and optimizing CWR. The innovative use of CWR as a stochastic variable, modeled using a normal distribution, offers a nuanced representation of climate variability, providing deeper insights into the water needs of crops across different exporting countries. The findings demonstrate that strategic diversification of trade partners is crucial for mitigating risks associated with CWR variability. The results from both stochastic and robust optimization approaches indicate that Turkey, Iran, and the Netherlands consistently emerge as top suppliers across the three key crops (tomatoes, onions, and cucumbers), owing to their favorable cost structures, manageable emissions, and efficient water usage. Important trade-offs emerge between average performance and system resilience. While the stochastic optimization approach yields better average economic performance, the robust optimization provides greater protection against extreme climate events at the cost of higher operational expenses. This highlights the critical balance policymakers must strike between cost efficiency and supply chain resilience. The implementation of these findings faces several potential risks, including political instability in supplier regions, logistical bottlenecks, and rapid market price fluctuations, which could affect the practical application of the proposed diversification strategy. Additionally, the dynamic nature of international trade relationships and evolving climate patterns may require periodic reassessment of supplier allocations. Before full implementation, these findings should be validated through detailed simulations and pilot studies that test the framework’s performance under various real-world scenarios. Such validation would help identify practical challenges and refine the model’s parameters for better applicability. The robust optimization highlights the importance of planning for worst-case scenarios, which ensures stability in Qatar’s FSC even under extreme climatic conditions. Overall, this study underscores the value of integrating climate variability considerations into food import strategies. The proposed framework provides a practical tool for policymakers and stakeholders, offering data-driven insights that support resilient decision-making in the face of increasing environmental uncertainties. Future research could build on this work by exploring dynamic adaptation strategies and incorporating additional climate variables, further enhancing the predictive capabilities of the model. Additionally, collaboration with exporting countries to improve data accuracy and share climate risk information could strengthen the resilience of global food trade networks, benefiting both importers and exporters alike.


