
Optimal Economic Dispatch of Hydrogen Storage-Based Integrated Energy System with Electricity and Heat

Abstract
1. Introduction
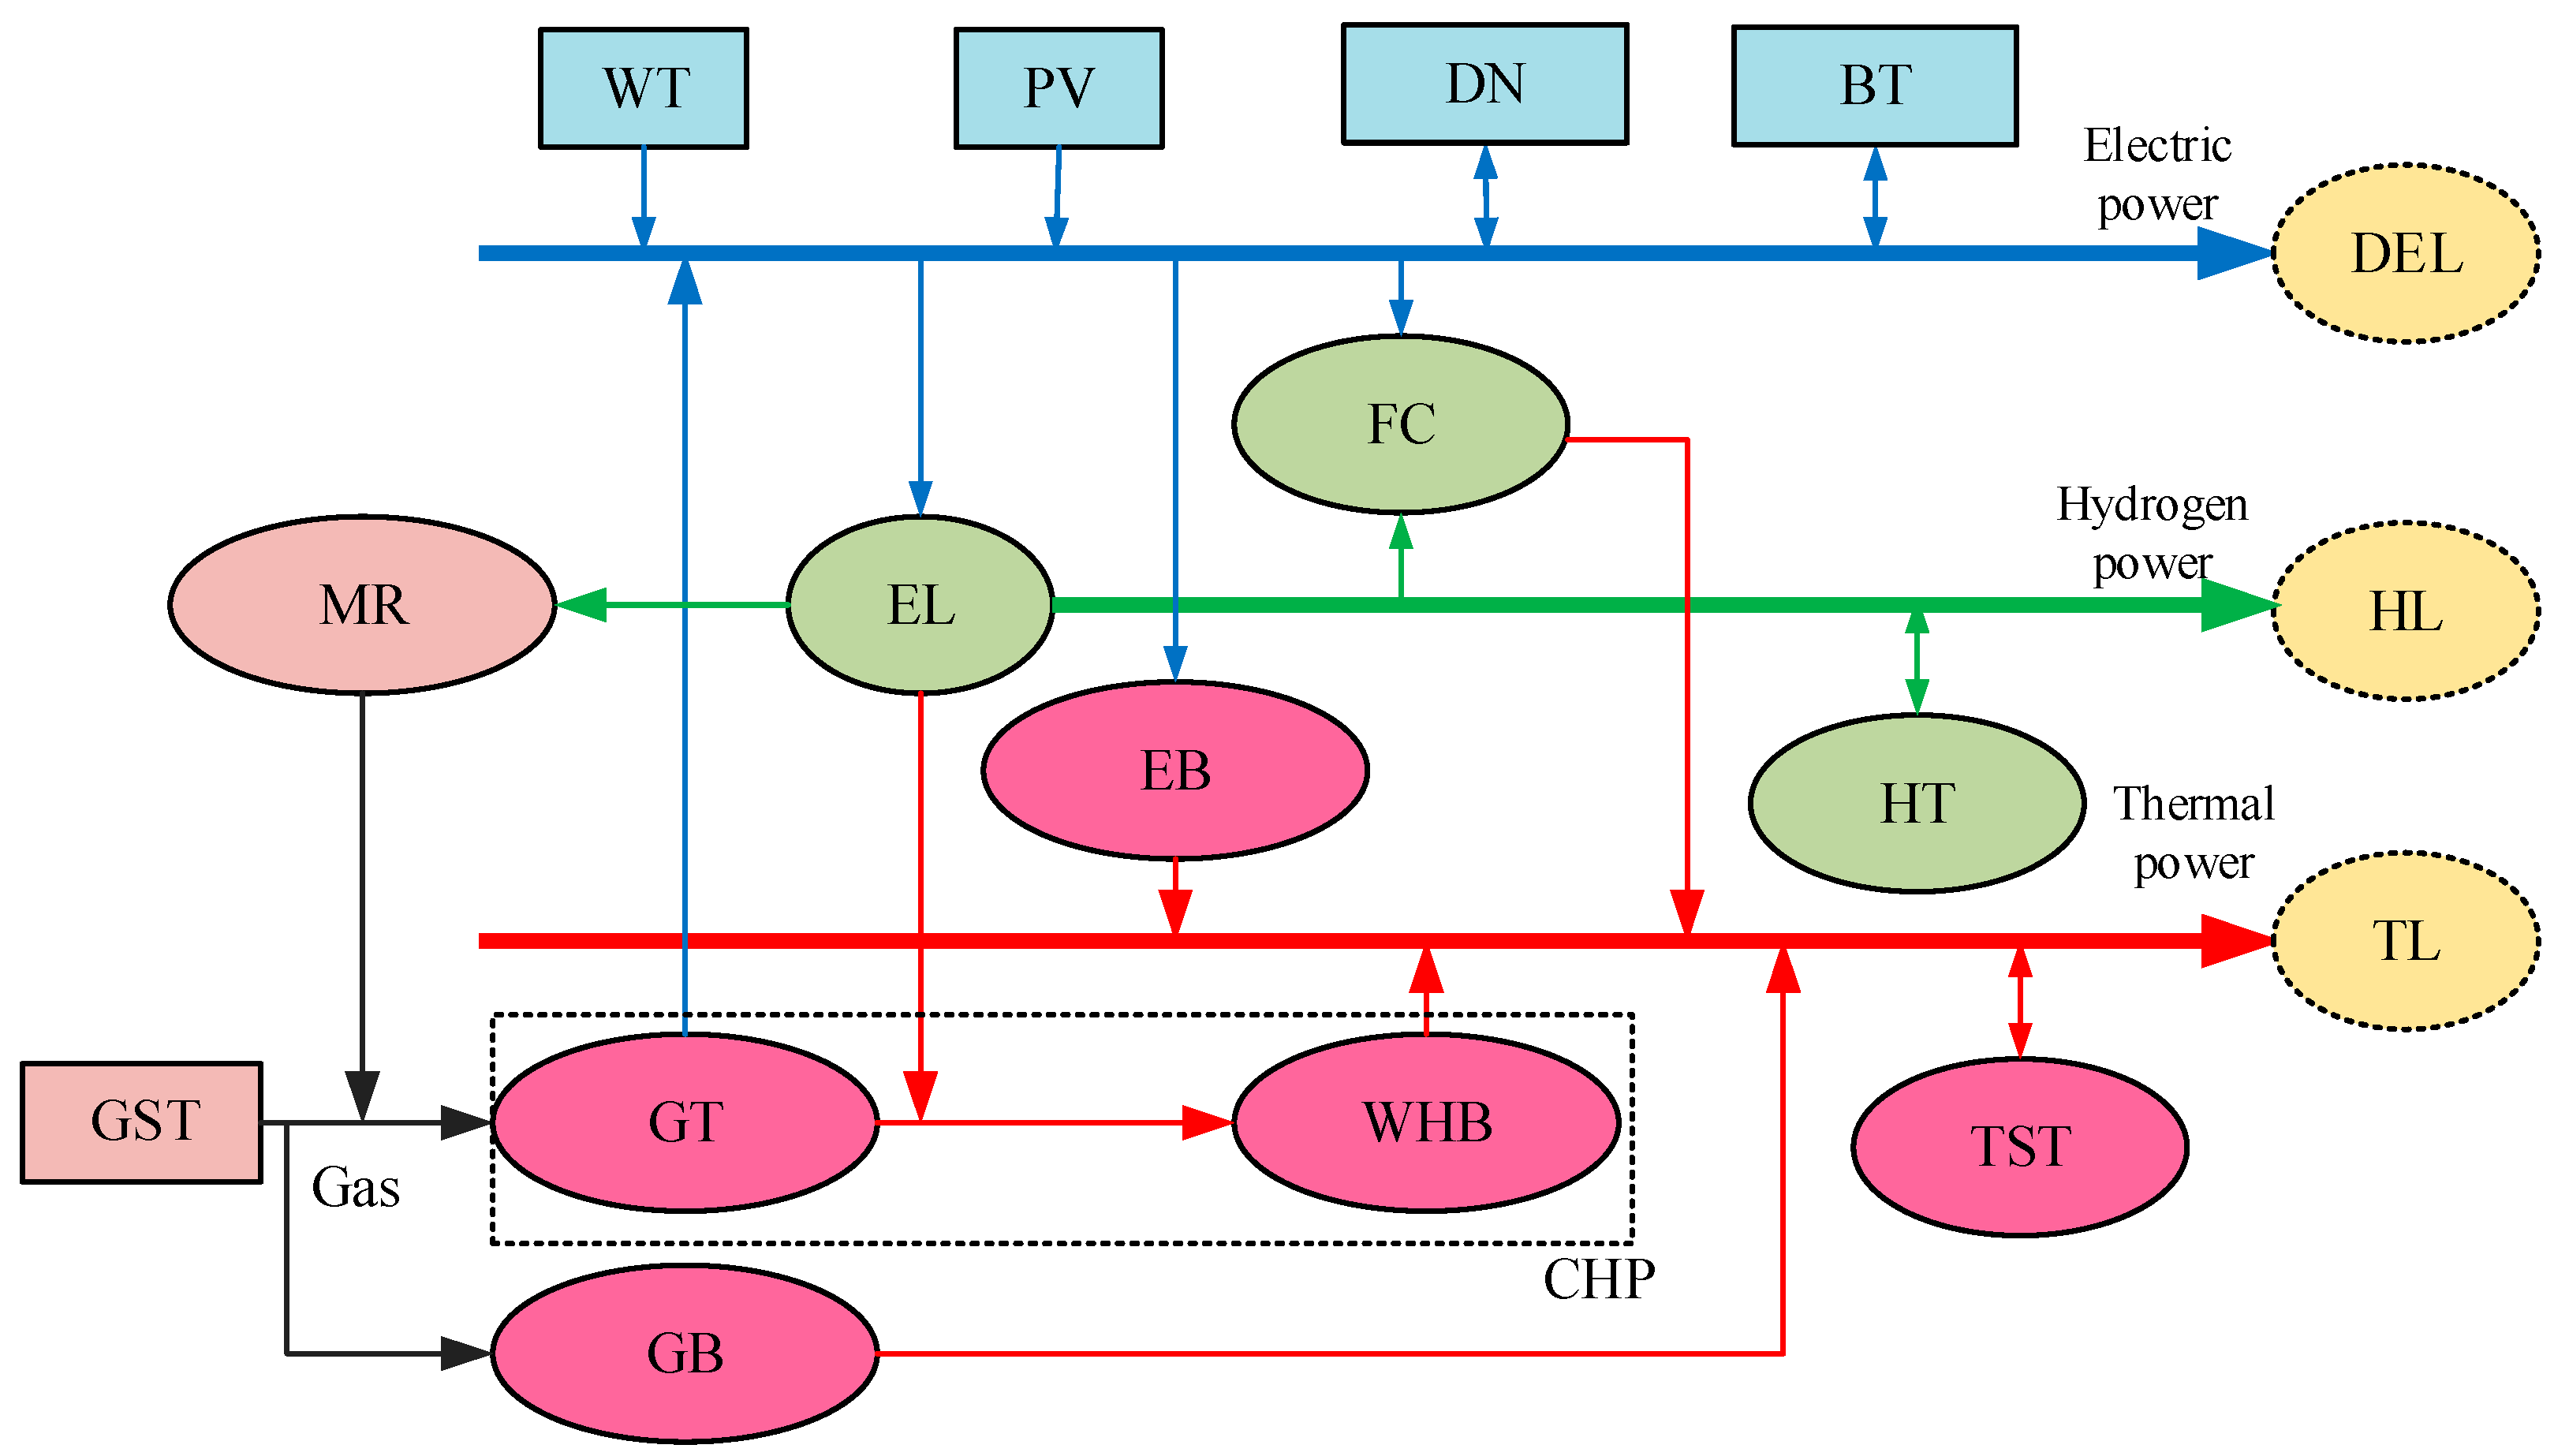
2. Modeling of an Integrated Electro-Thermal Hydrogen Energy System Considering Hydrogen Energy Storage
2.1. Modeling of Electrical Heat Coupling Systems
- (1)
- Gas turbine
- (2)
- Waste heat boiler
- (3)
- Gas boiler
- (4)
- Methane reactor
- (5)
- Thermal storage tank
- (6)
- Battery
- (7)
- Gas storage tank
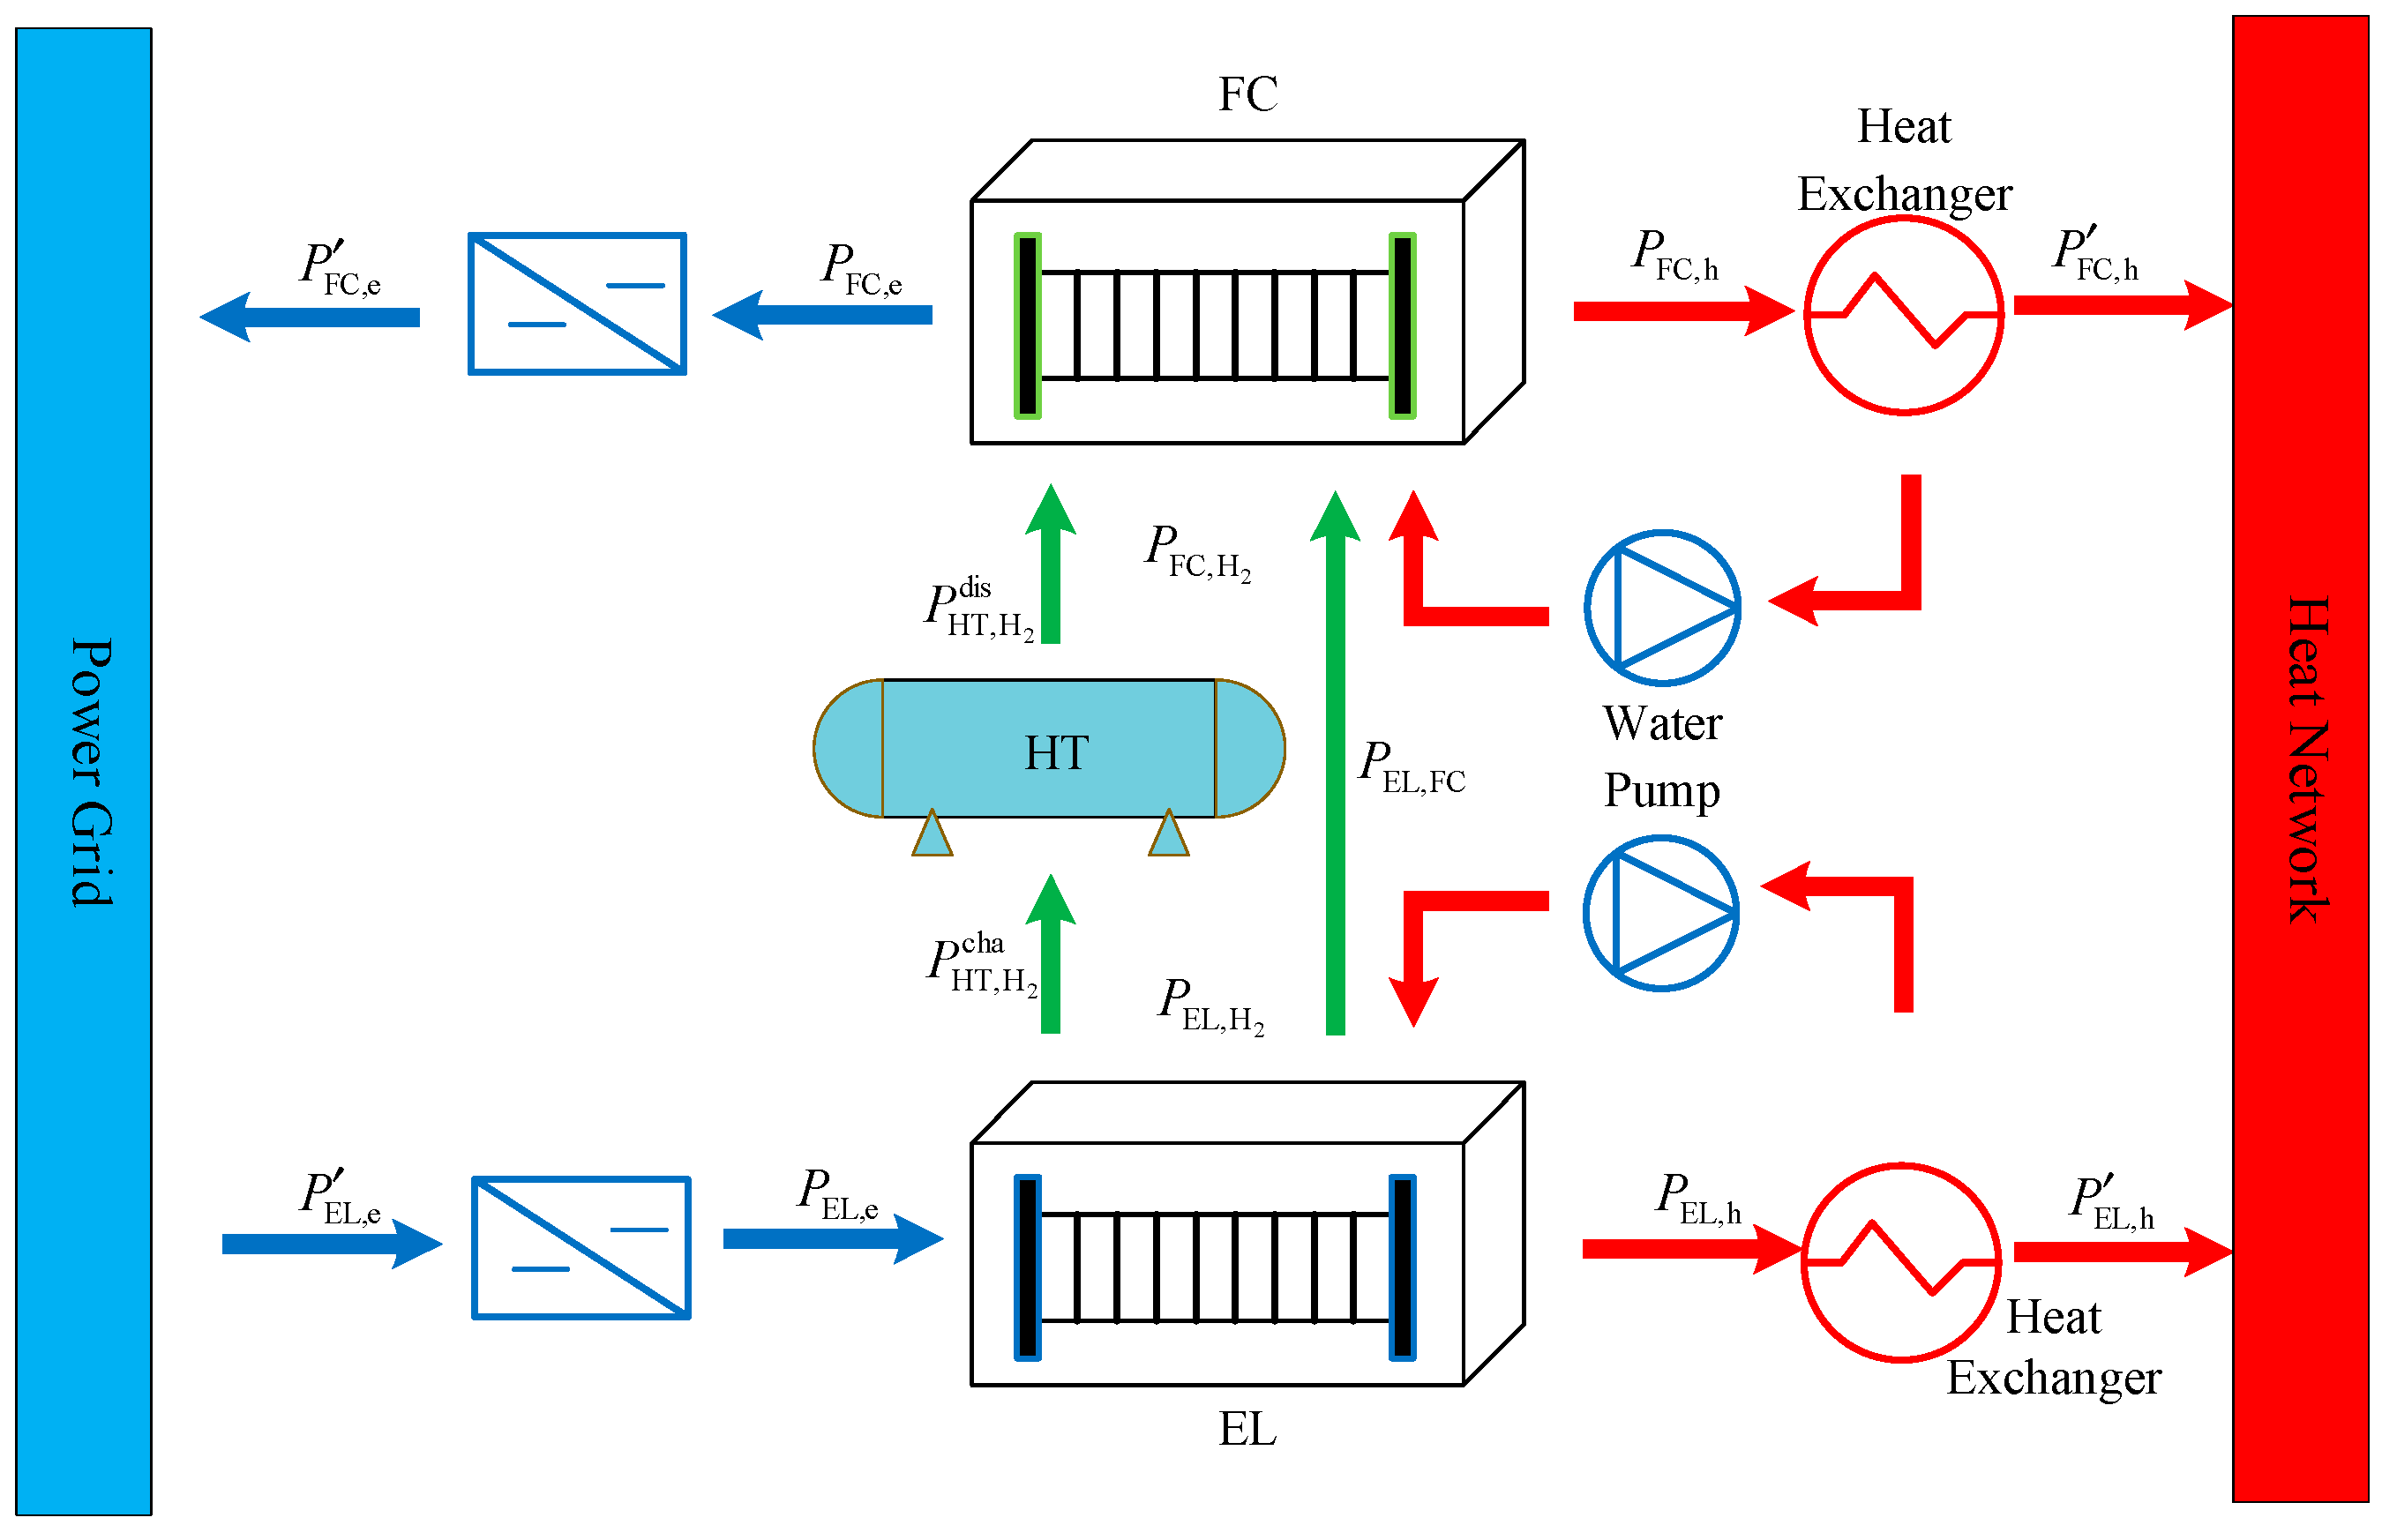
2.2. Modeling of Hydrogen Energy Systems
- (1)
- Modeling of electric hydrogen production
- (2)
- Modeling hydrogen energy storage
- (3)
- Modeling of hydrogen fuel cells
3. Economic Dispatching Model of Electrothermal Hydrogen Integrated Energy System Under Carbon Trading Mechanism
3.1. Tiered Carbon Trading Scheme
3.2. Objective Function
- (1)
- The operation and maintenance cost of each device in the system f1
- (2)
- The purchase cost of the system f2
- (3)
- System of wind, light penalty cost f3
- (4)
- The carbon trading costs of the system are shown in Equation (19) above.
3.3. Constraint Condition
- (1)
- Wind–power constraint
- (2)
- Electric hydrogen production constraints
- (3)
- Hydrogen fuel cell confinement
- (4)
- Methane reactor confinement
- (5)
- Energy storage constraint Energy storage constraint
- (6)
- CHP constraint
- (7)
- Gas boiler confinement
- (8)
- Power balance constraint of the power grid
- (9)
- Power balance constraint of heat supply network
- (10)
- Hydrogen power balance constraints
- (11)
- Power balance constraint of the gas network
3.4. Model Linearization Processing and Solving
- (1)
- Gas turbine linearization process
- (2)
- The actual carbon emission model linearization process
4. Case Study
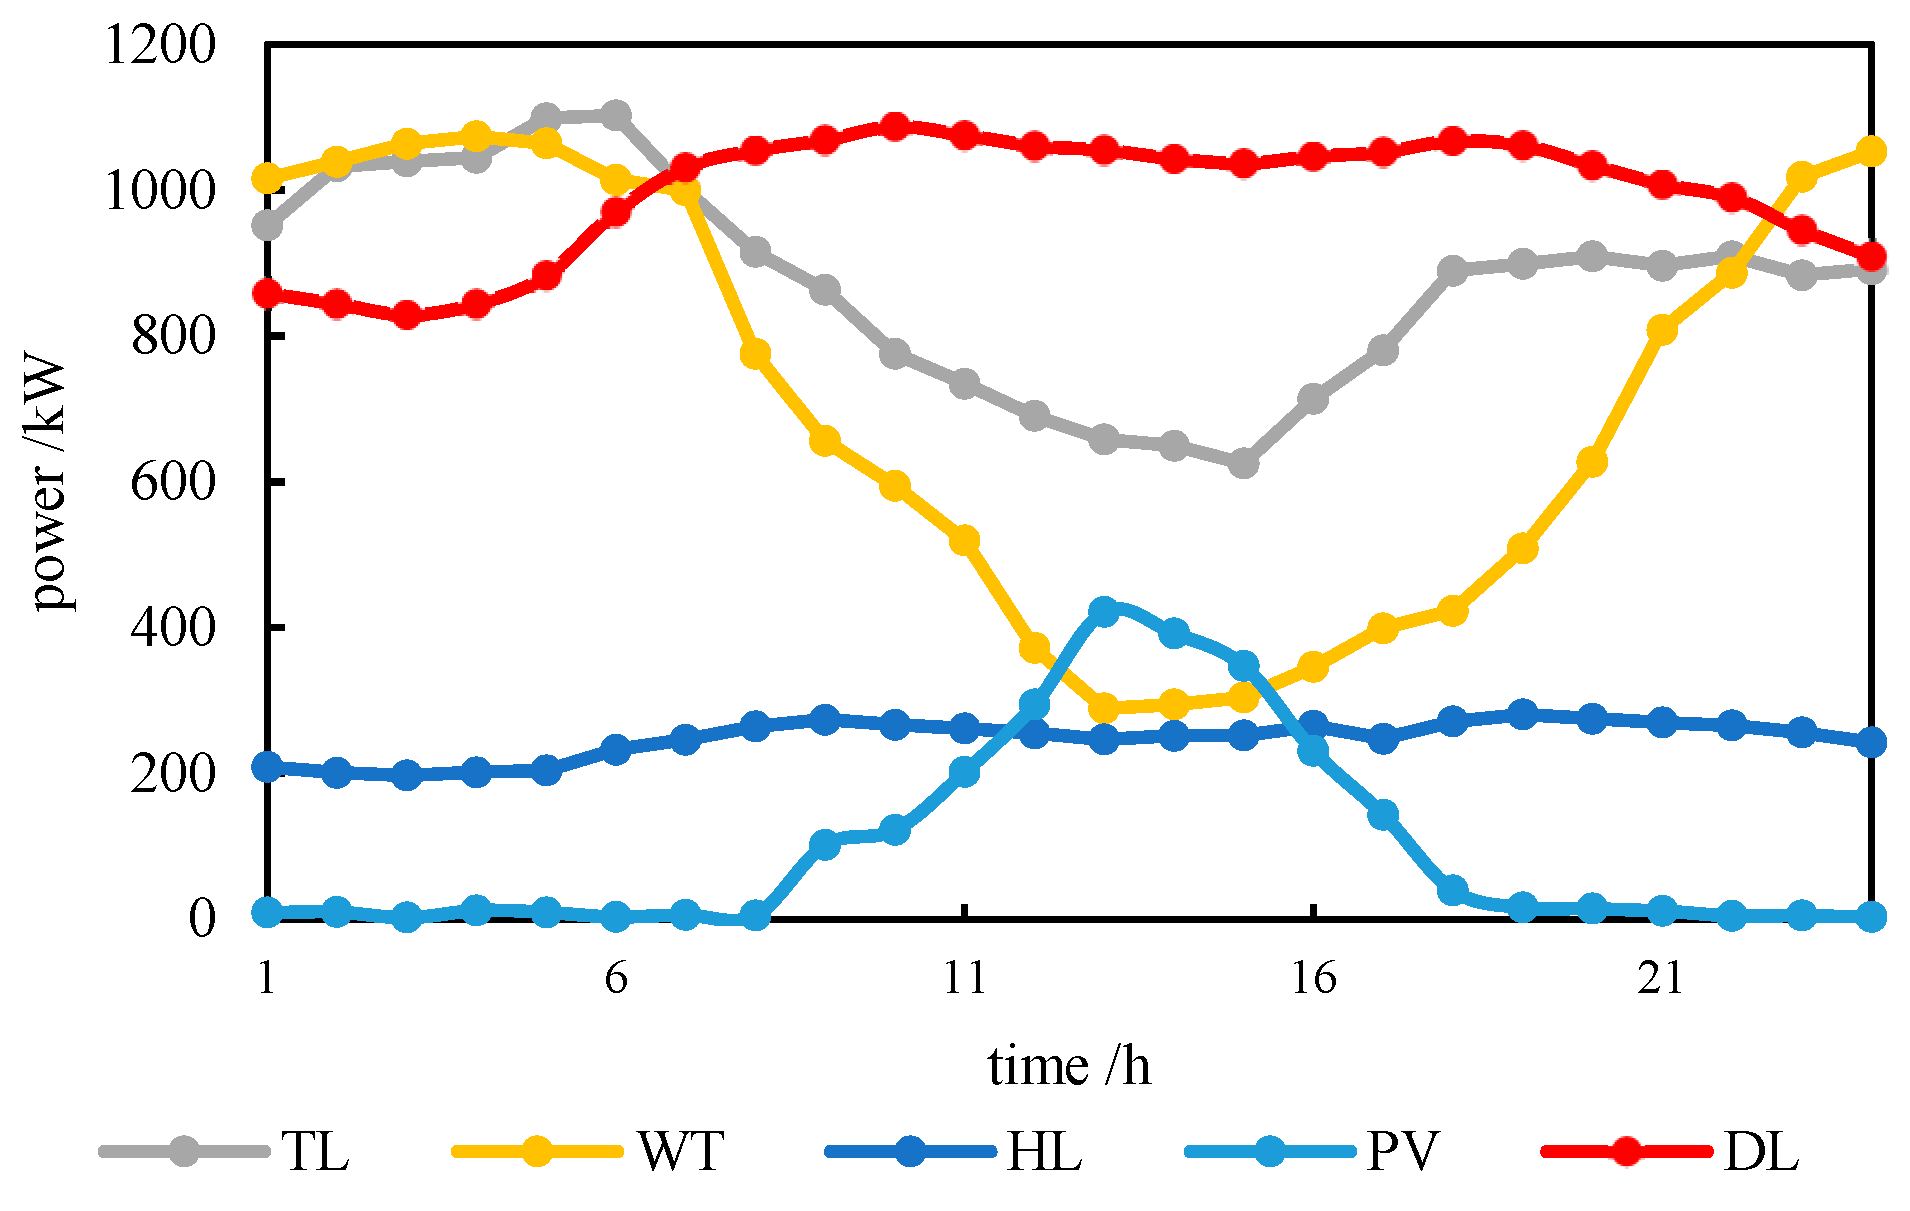
4.1. System Data
4.2. Case 1: Benefit Analysis of Carbon Trading Mechanism
4.2.1. Scenario Configuration and Analysis of Case 1
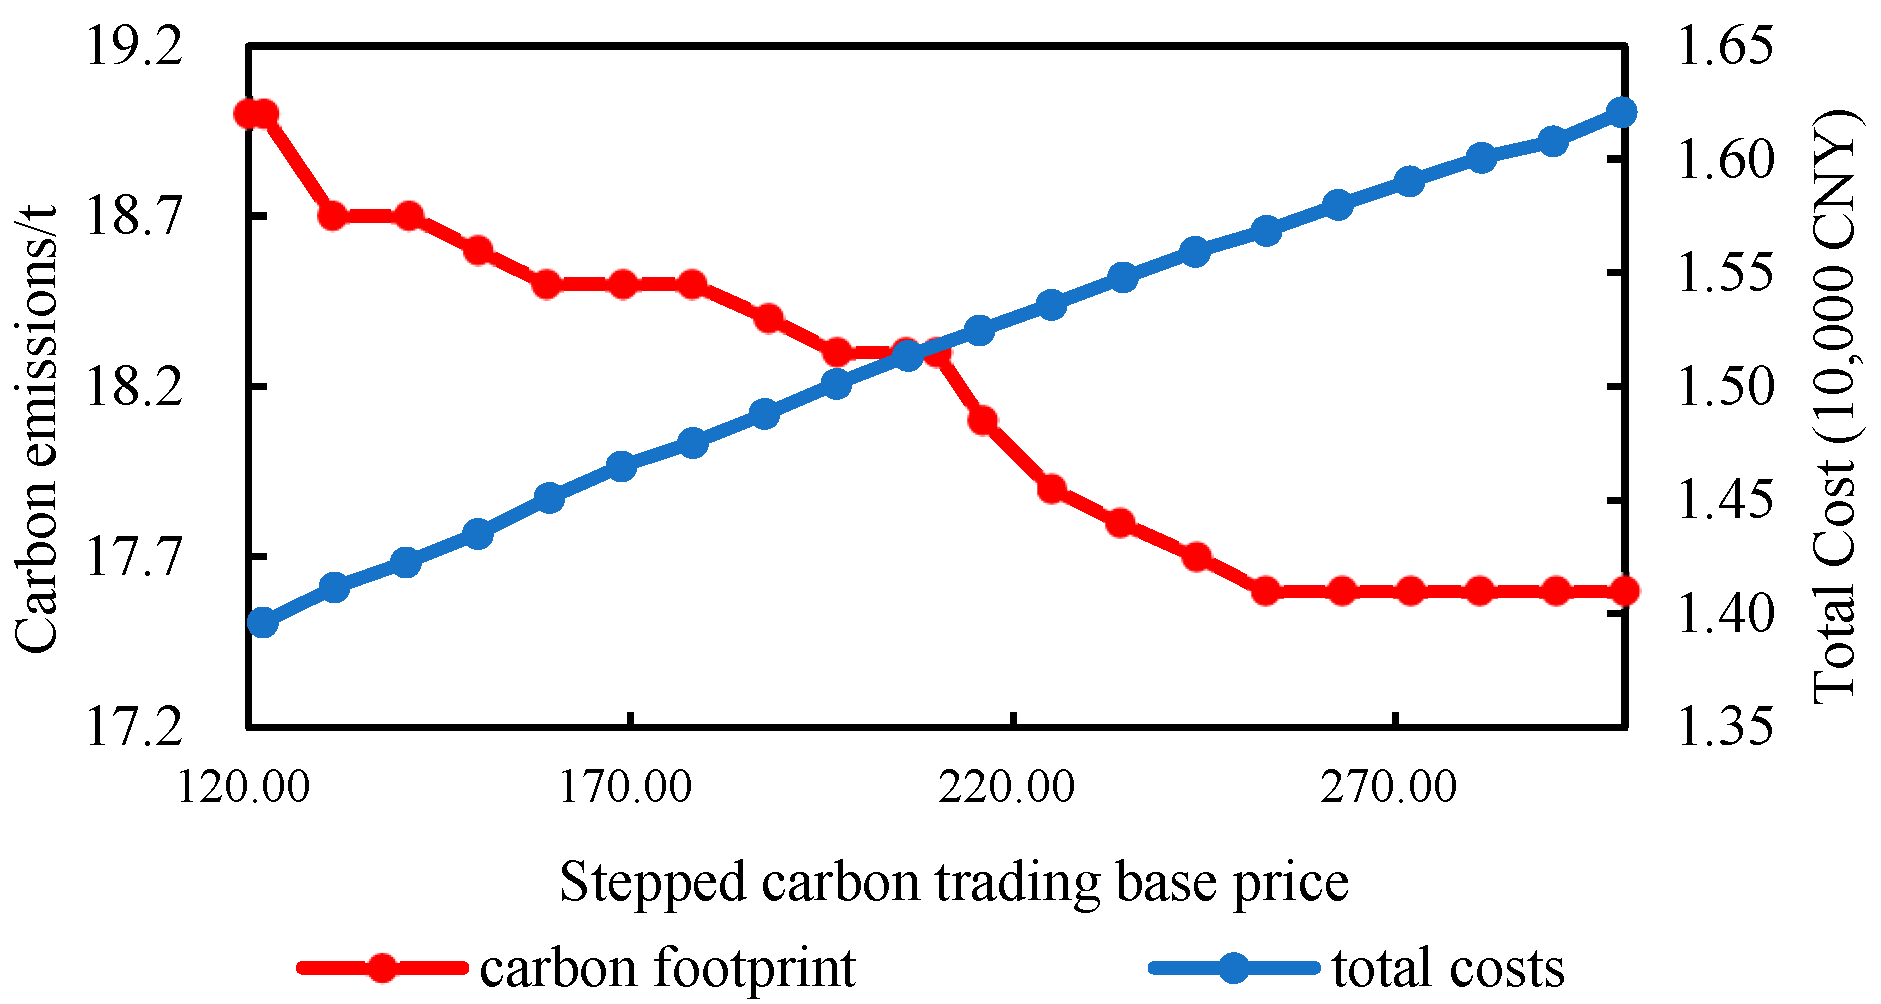
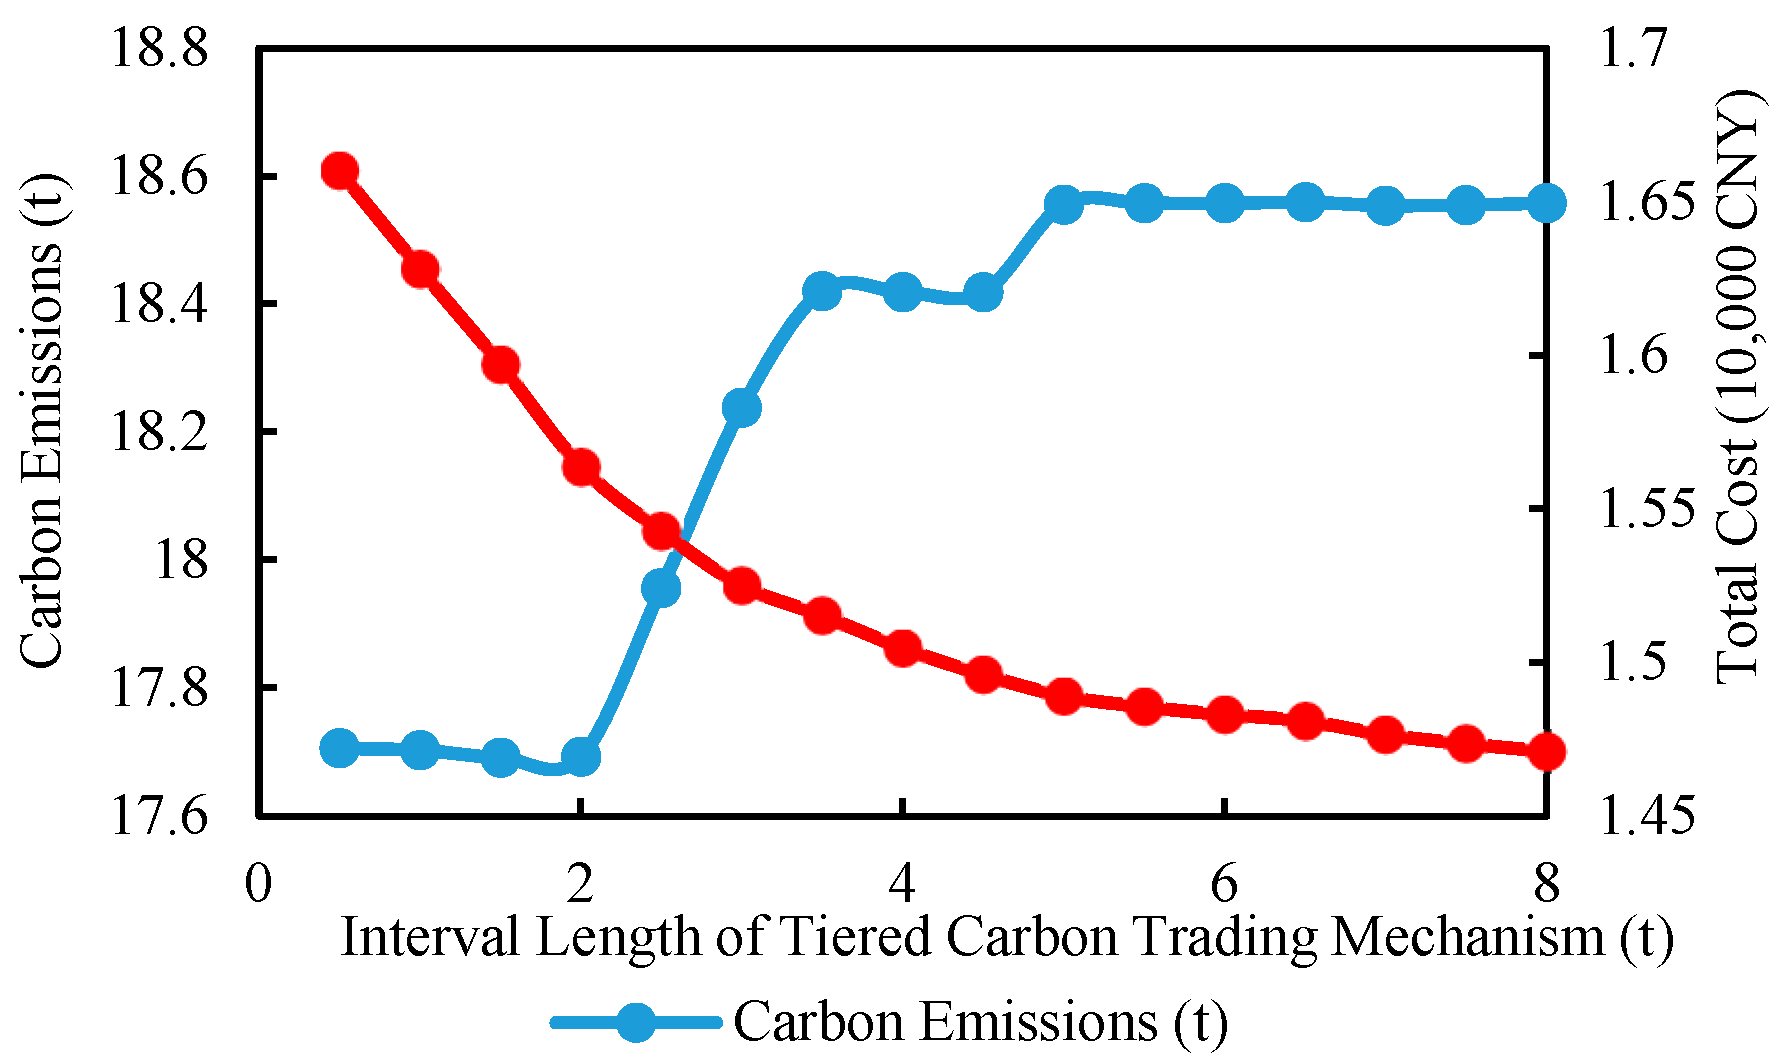
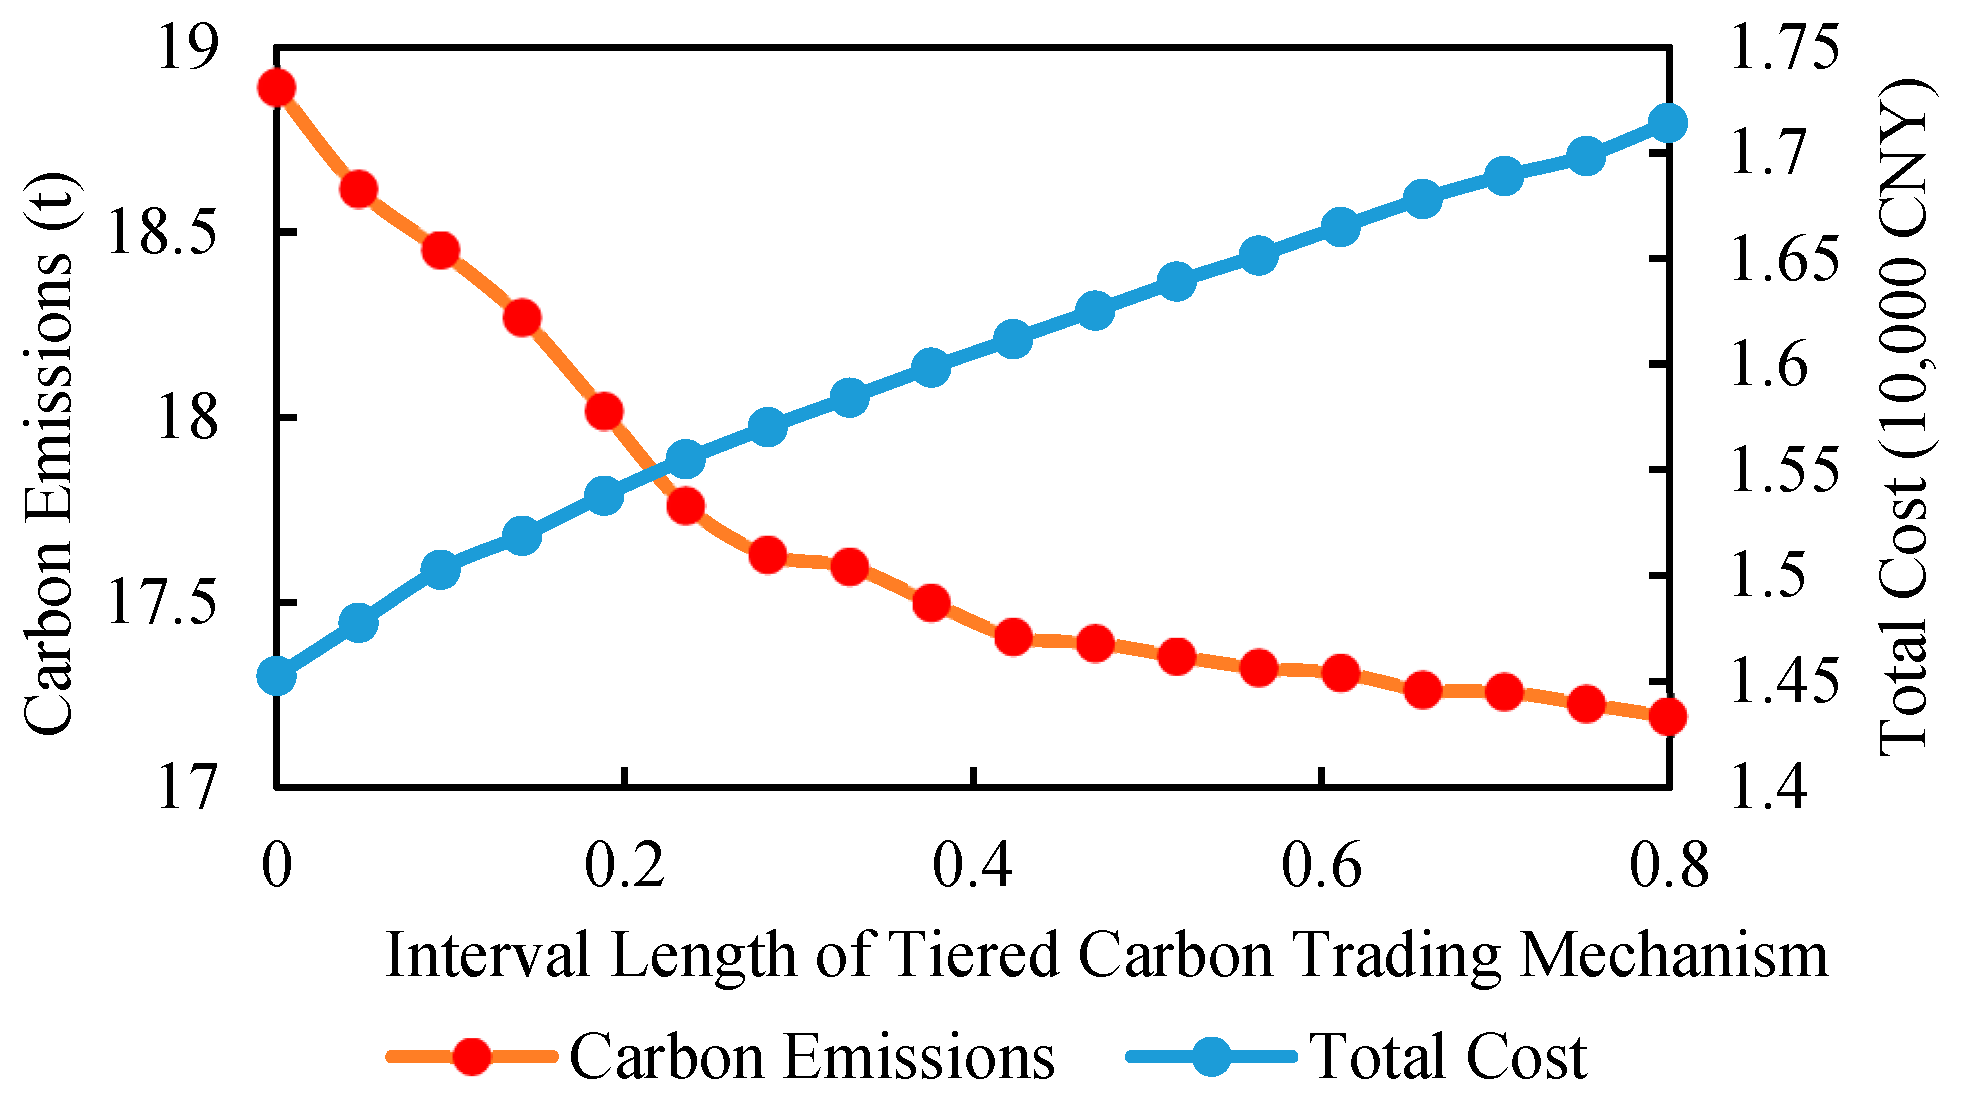
4.2.2. Parameter Sensitivity Analysis of Cascade Carbon Trading Mechanism
4.3. Case 2: Benefit Analysis of Hydrogen Technology and Cogeneration System
4.3.1. Scenario Configuration and Analysis of Case 2
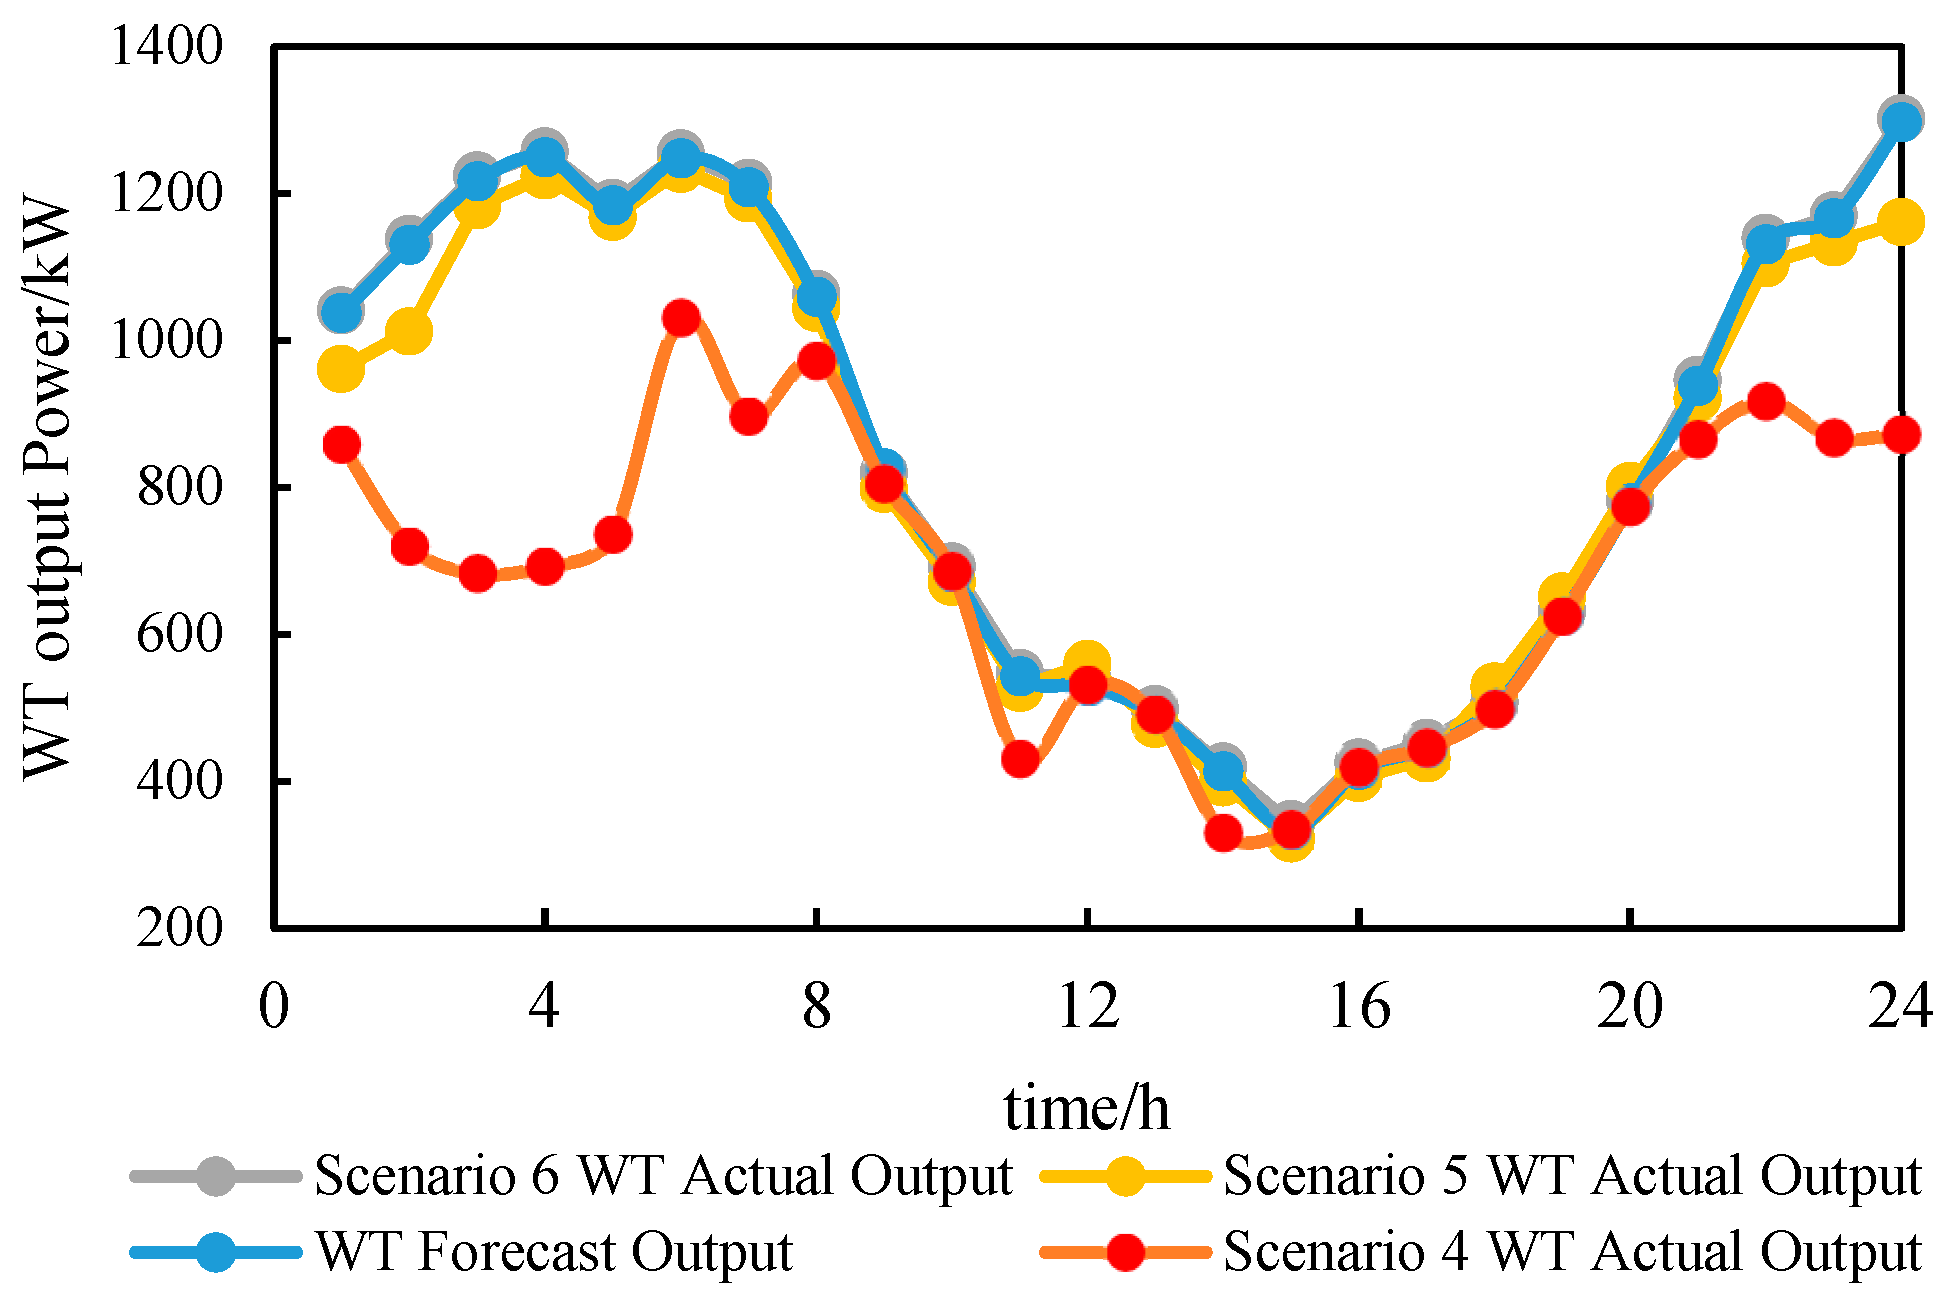
4.3.2. Analysis of Scenery Absorption Ability
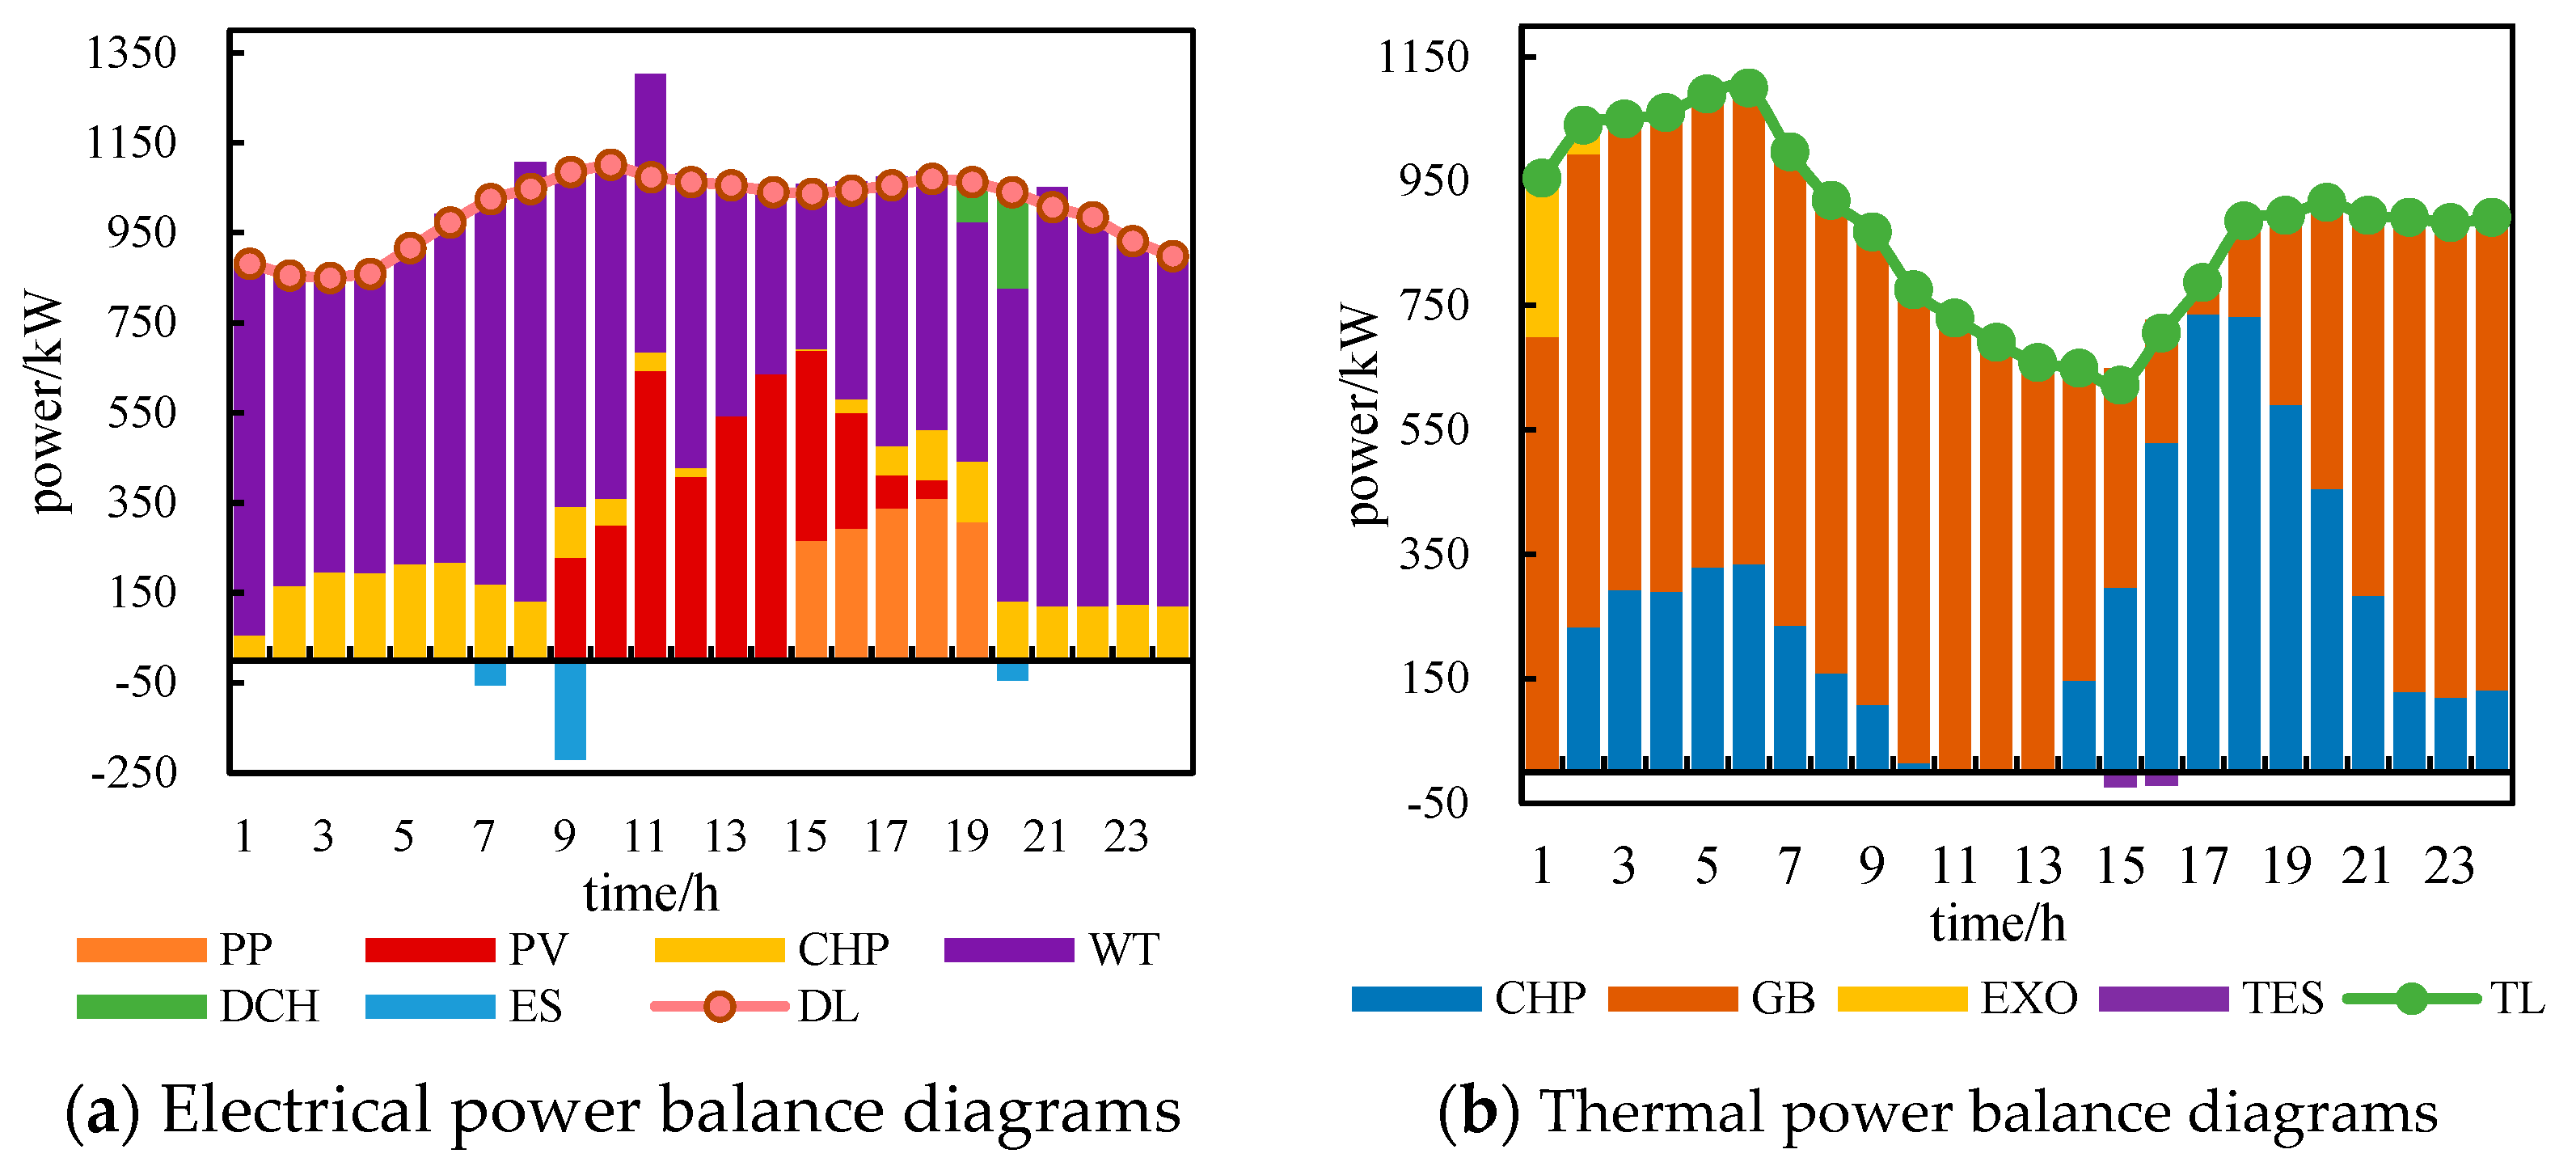
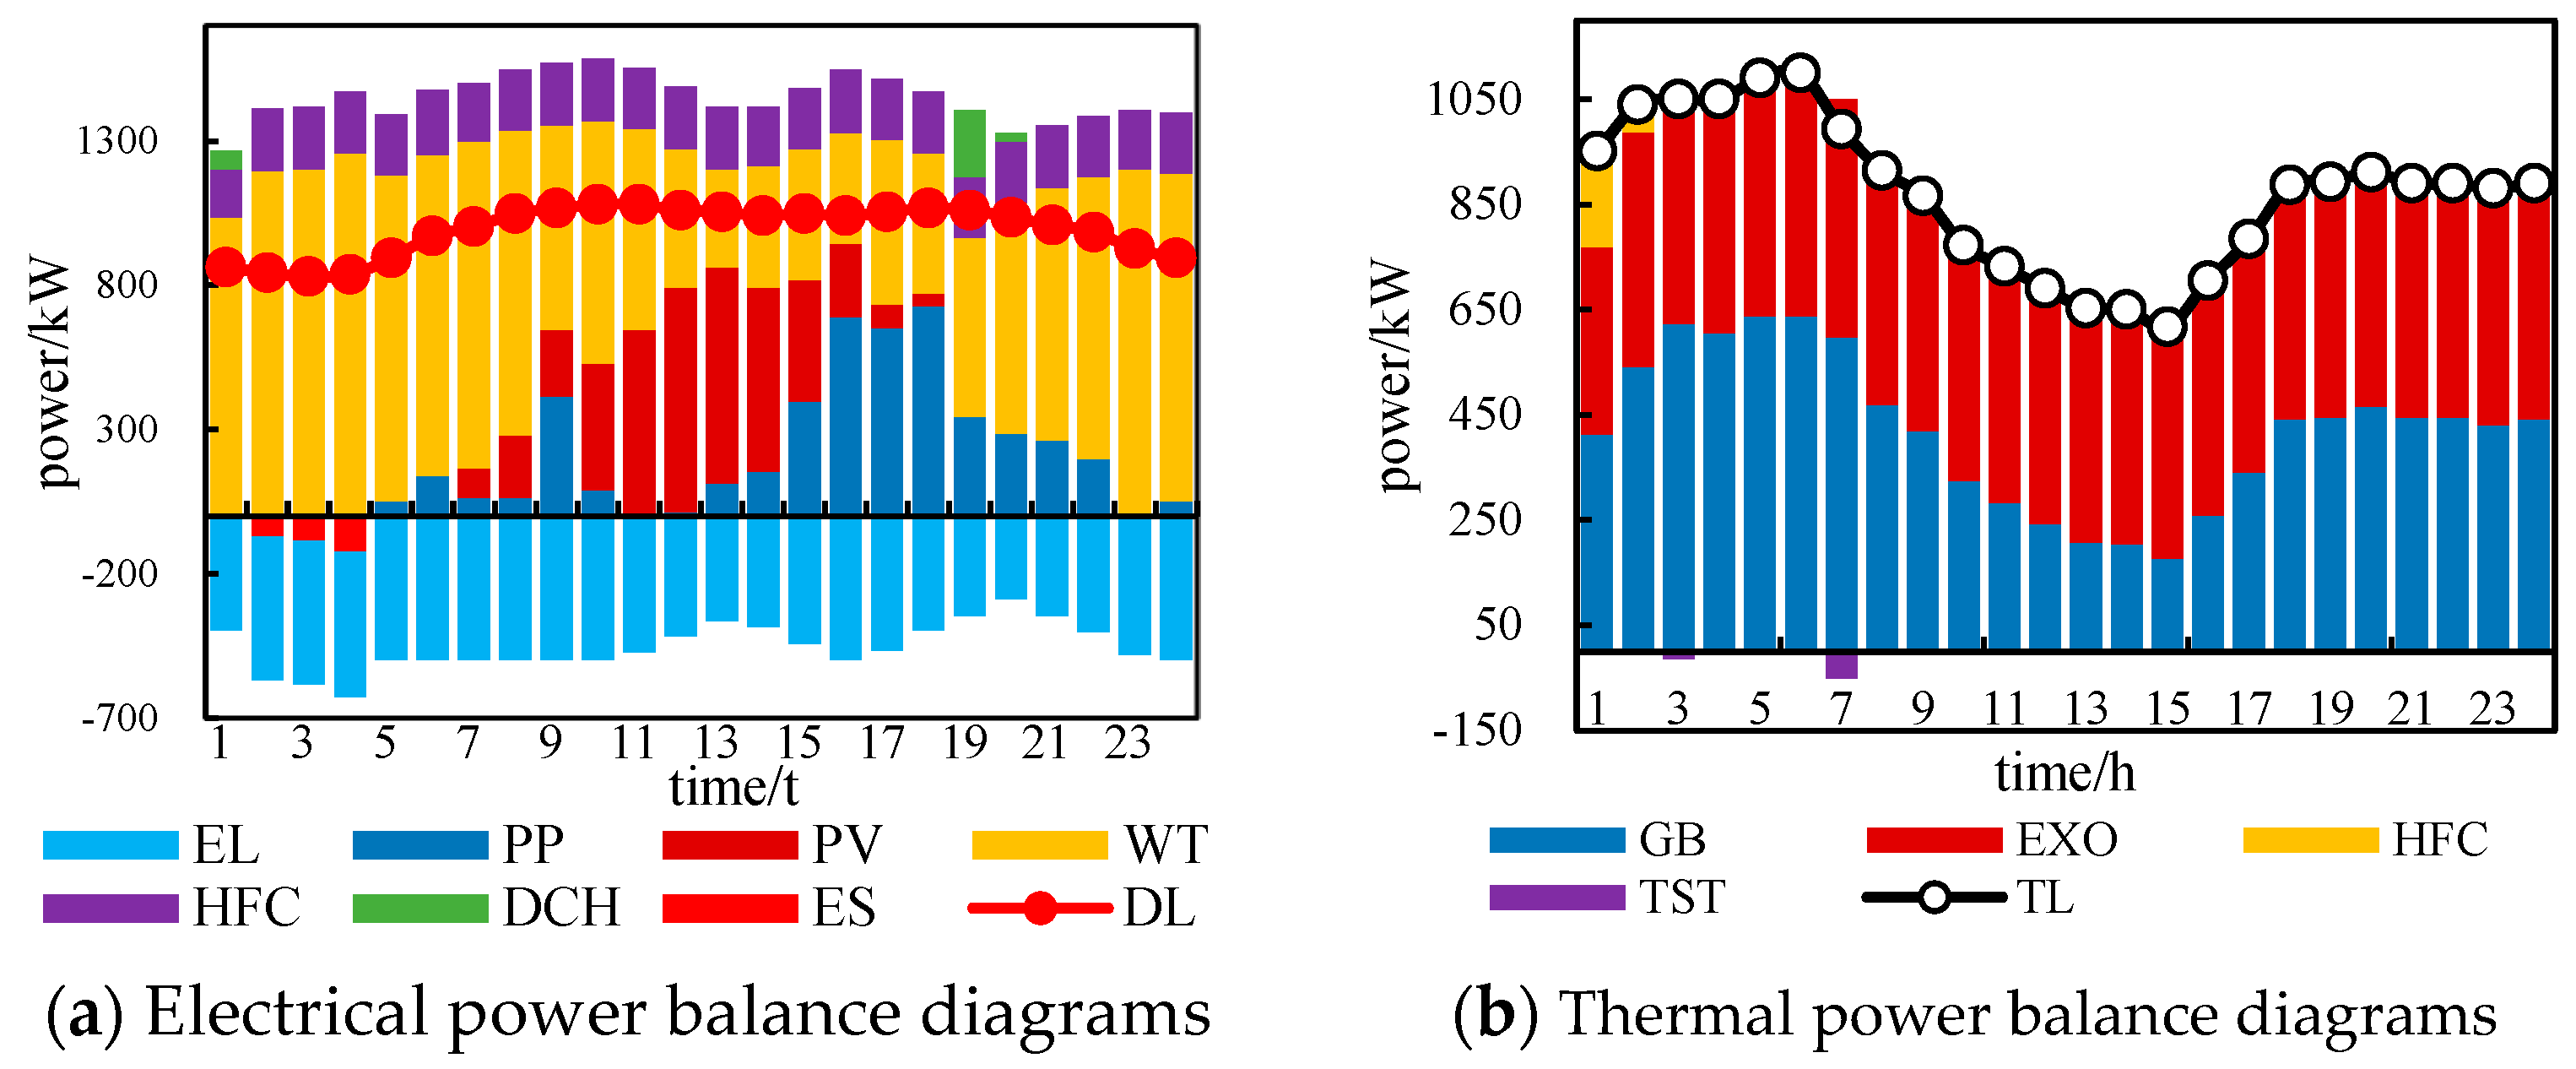
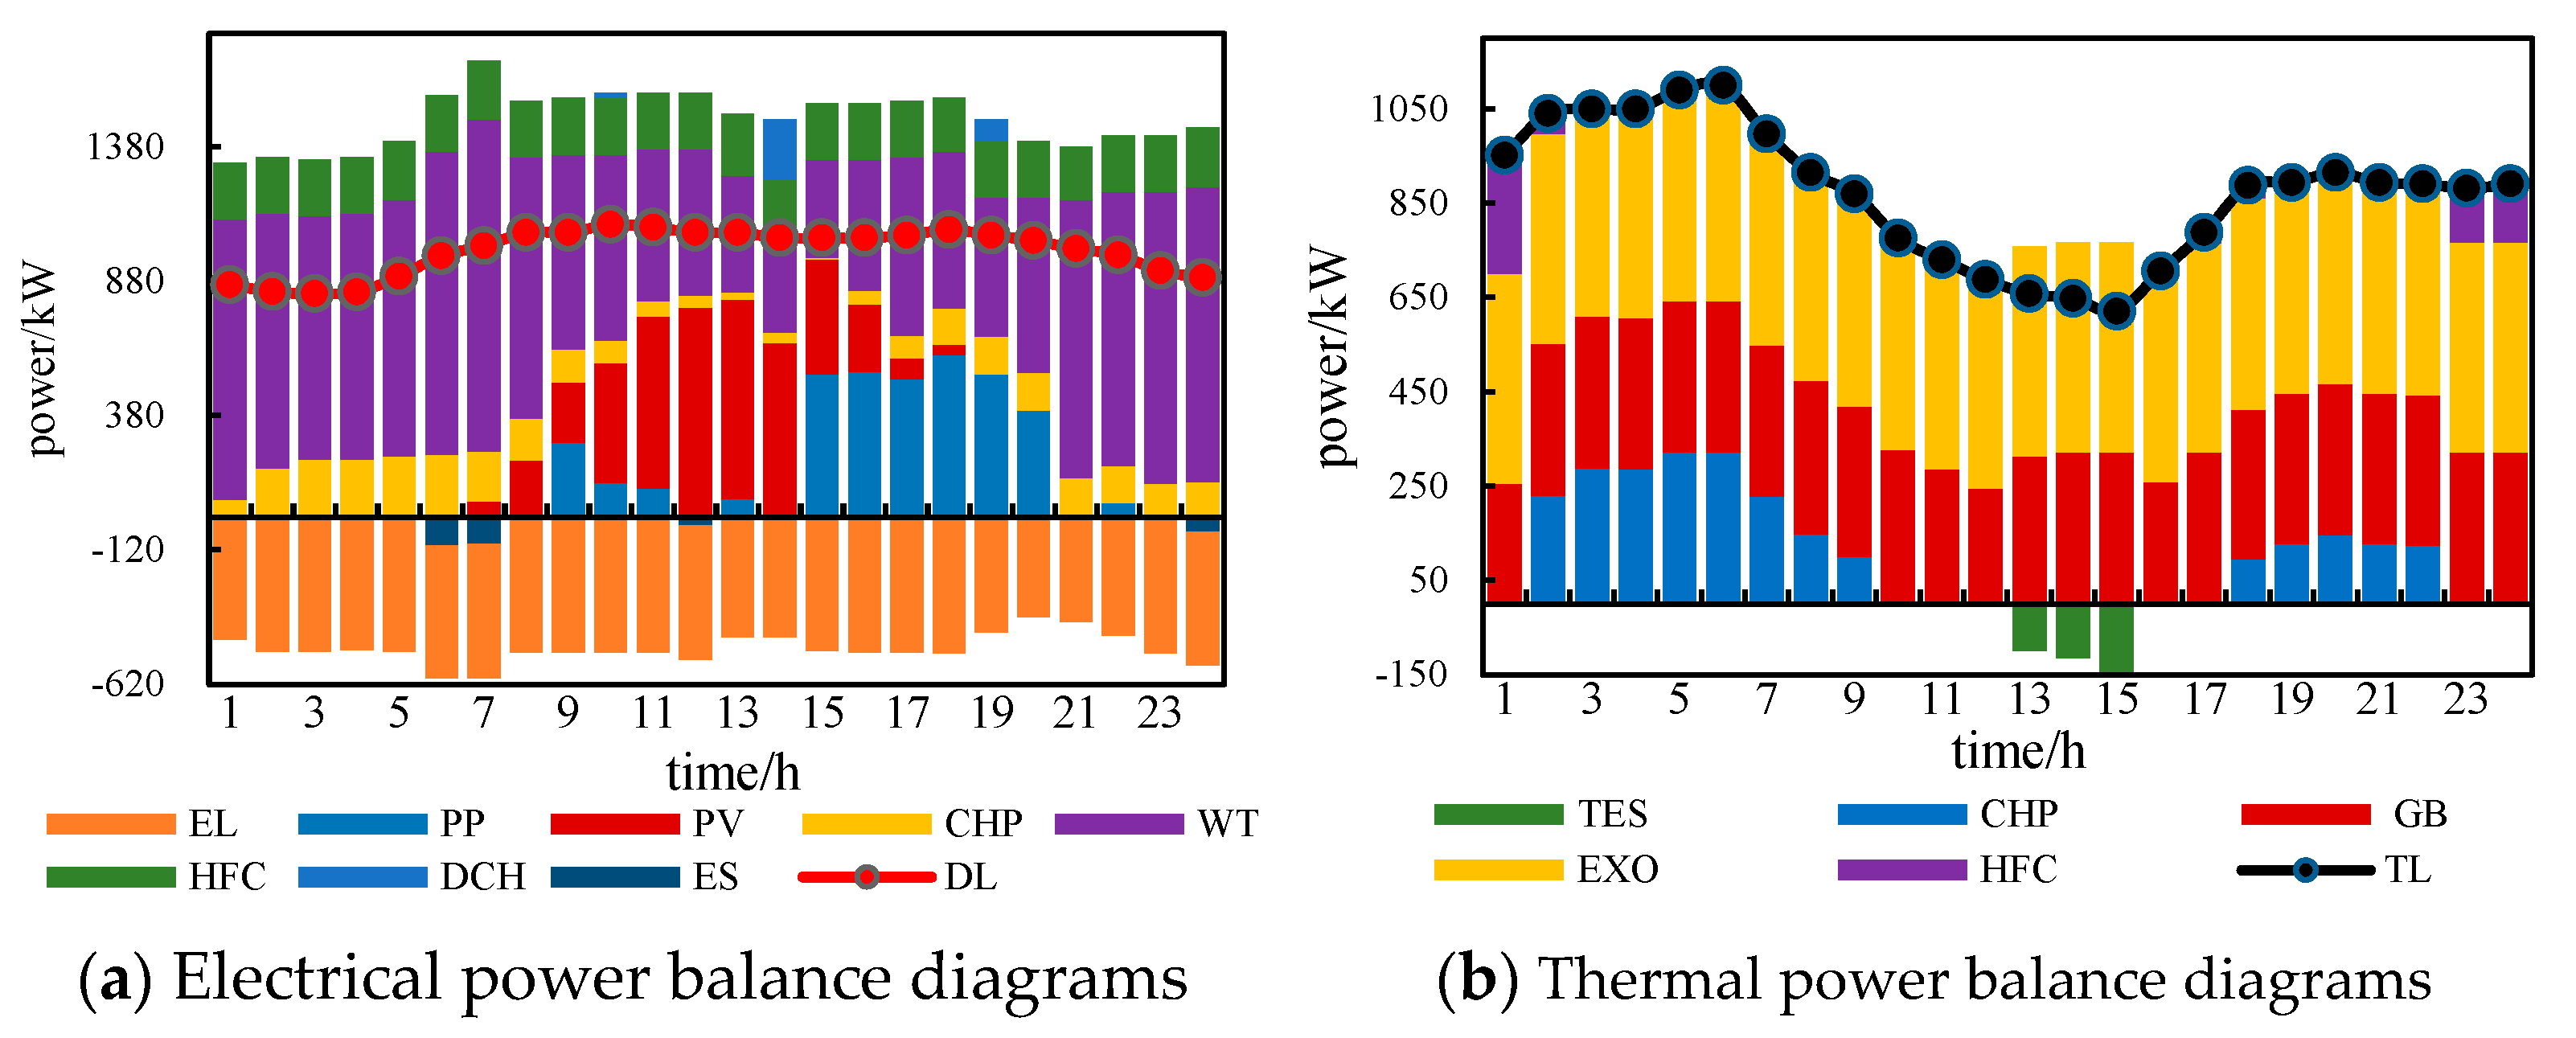
4.3.3. Analysis of System Power Scheduling Results in Different Scenarios
4.4. Case 3: Benefit Analysis of P2G Coupling Elements
4.4.1. Scheduling Results of Each Scenario of Case 3
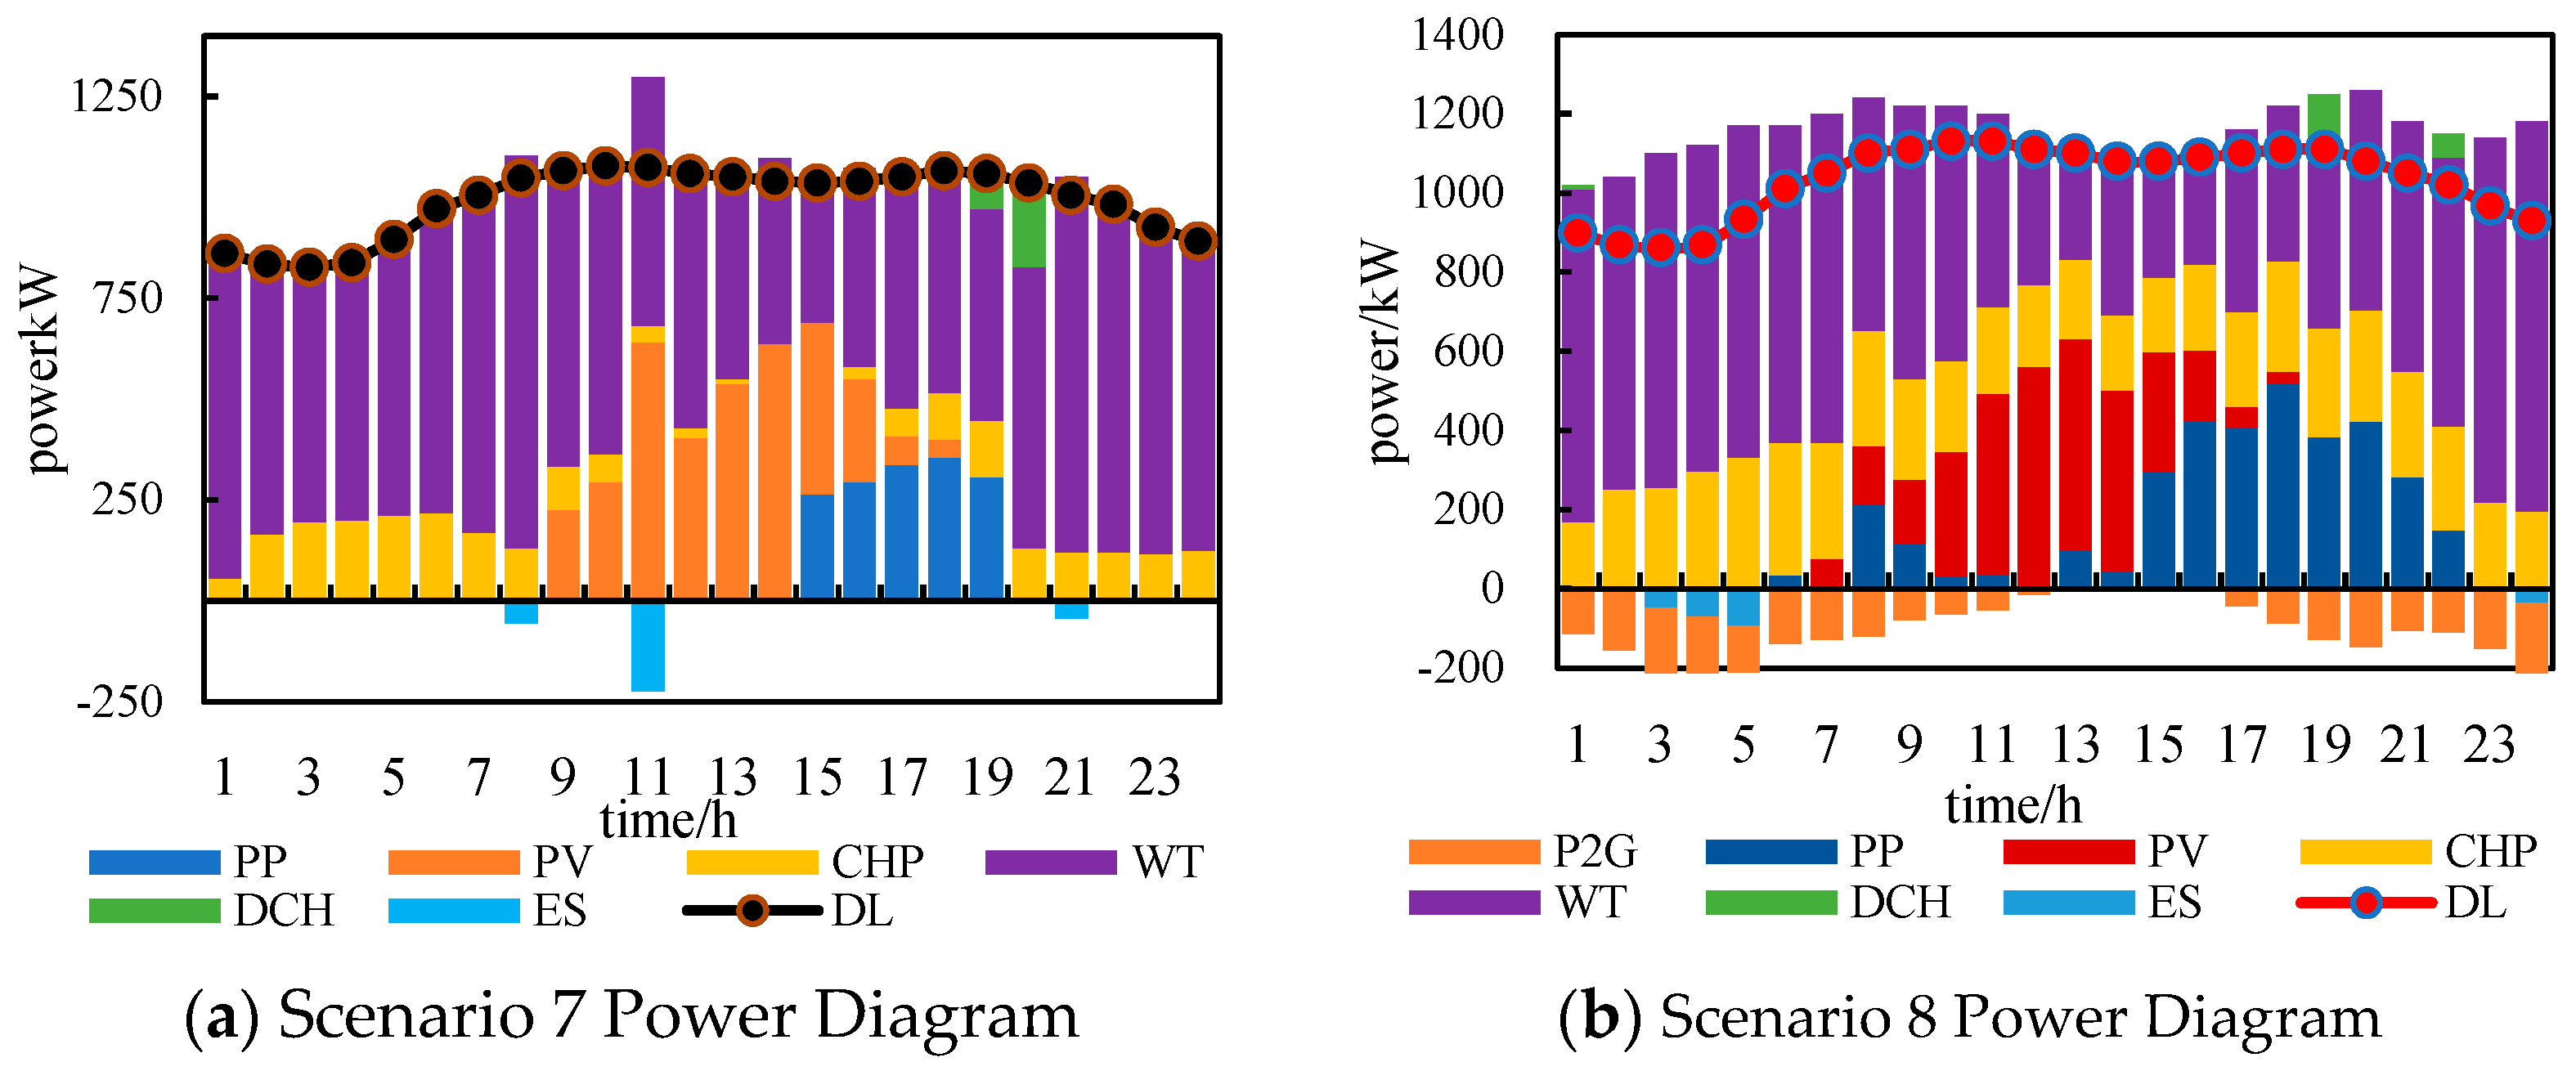
4.4.2. Analysis of System Power Scheduling Results in Each Scenario
5. Conclusions
Author Contributions
Funding
Institutional Review Board Statement
Informed Consent Statement
Data Availability Statement
Conflicts of Interest
Abbreviations
| AST | Air storage tank | HEES | hydrogen energy storage system |
| EL | Electrolyzer | IES | Integrated energy system |
| HST | hydrogen storage tank | DN | Distribution Network |
| HFC | hydrogen fuel cell | TL | Thermal load |
| FC | Fuel cells | HL | Hydrogen load |
| WT | Wind turbine | DEL | Demand electric load |
| PV | Photovoltaic | WP | Water Pump |
| HE | Heat exchangers | P2G | Power-to-Gas |
| MR | Methane reactor | PP | Power Purchase |
| GT | Gas turbine | ES | Energy Storage |
| WHB | Waste heat boiler | DCH | Discharge |
| GB | Gas boiler | TES | Thermal Energy Storage |
| TST | Thermal storage tank | EXO | Exothermic |
| BT | Battery tank | EB | Electric boiler |
| CHP | Combined heat and power | HESS | Hydrogen energy storage system |
| MES | Multi-energy system | GST | Gas storage tank |
| Variables | |||
| Hydrogen energy input to FC at time t | The upper and lower limits of GB ramping | ||
| Total power obtained by FC from HST and EL | The input and output limits for FC hydrogen | ||
| Hydrogen energy input to MR at time t | Upper and lower FC climbing limits | ||
| Input storage power at time t | Upper and lower limits of the FC electrothermal ratio | ||
| Input gas storage power at time t | Upper and lower limits of hydrogen energy input to MR | ||
| The heat of P2G reaction at time t | GB Upper and lower limits of the climb | ||
| Input power of heat storage during the t period | , | Power generation and waste heat power of GT at time t | |
| Input power of hydrogen storage at time t | , | GT power generation and heating efficiency | |
| Electric power generated by FC | Heat input and heat output | ||
| Thermal power generated by FC | , | Natural gas power, thermal power output at time t | |
| Power input from FC bus | Upper and lower limits of natural gas power input to GB | ||
| Thermal power output from the thermal bus | , | Hydrogen-to-methane conversion efficiency at MR | |
| Total power obtained from electric hydrogen production | , | BT charging and discharging efficiency. | |
| Electrical power supplied to the EL from the DC bus | , | BT charging power and discharging power at time t | |
| Electrical power received by EL from the DC busbar | , | Charging and discharging efficiency of TST | |
| Thermal power output from the thermal bus | , | TST total heat storage and release power at time t | |
| The total output power of GT at time t | The upper and lower limits of the electrical energy input to EL | ||
| EL during time t | EL Upper and lower limits of the climb | ||
| EL power used for heat production | , | Charging and discharging efficiency of AST | |
| CO2 consumed in the methanation process at time t | , | AST charging and discharging power at time t | |
| Calculation factor for CO2 | The upper limit of wind and optical output power | ||
| Gas consumption of GT at time t | Hydrogen energy input to MR at time t | ||
| Thermal energy stored by TST at time t | Is a binary variable, indicating the charging and discharging states of the energy storage device in the t period | ||
| The heat generated by GB at time t | Upper and lower limits of the capacity of the energy storage device | ||
| Gas consumption of GB at time t | Carbon credits traded in IES | ||
| Heat storage status of the heat storage equipment at time t | Actual carbon emissions of IES | ||
| Maximum storage capacity of TST | IES carbon credit allowances | ||
| Electric power is stored by an electrical energy storage device in time t | The t period is directly used for the power consumed by FC power generation | ||
| GB heating efficiency | The gas power stored by the gas storage device in the t period | ||
| WHB efficiency | Predicted value of wind and optical power | ||
| ES state of the electrical energy storage device at time t | Unit power operation and maintenance cost of WT and PV | ||
| Maximum storage capacity of BT | Unit power operation and maintenance cost of EL and FC | ||
| EL’s work efficiency | HST, BT, TST, AST charging/discharging operation and maintenance cost per unit power | ||
| Unit abandoned wind, abandoned light penalty cost | Unit power operation and maintenance cost of GT, WHB, GB, and MR | ||
| Efficiency of FC converter | Charging and discharging power of the energy storage device (HST, TES, ES, AST) | ||
| Heat transfer efficiency of FC | The amount of electricity and natural gas purchased during the t period | ||
| AST’s gas storage status at the time of t | WT, PV working power | ||
| Maximum gas storage capacity of AST | EL, FC working power | ||
| Heat transfer efficiency of FC | HST charging/discharging power in t period | ||
| The total operating cost of the system | BT charge/discharge power in t period | ||
| Scheduling cycle | TST charge/discharge power in t period | ||
| PV and WT system operation and maintenance costs | AST charge/discharge power in time t | ||
| Hydrogen energy system operation and maintenance costs | Working power of GT, WHB, GB, and MR | ||
| Energy storage system operation and maintenance costs | Power obtained by FC from HST in time slot t | ||
| Operation and maintenance costs of CHP-related devices | The maximum power of the energy storage device is charged and discharged at one time | ||
| Efficiency of FC | The capacity of the energy storage device in time t | ||
| Efficiency of FC consumption of H2 | Gas power input to GB for time t | ||
| Carbon trading base price | The cost of cascade carbon trading | ||
| Unit carbon price growth rate | The maximum power purchased from the upper power grid | ||
| Carbon emission range | The power input to EL at time t | ||
| The low calorific value of H2 | TL at the time t | ||
| t time to the higher power grid purchase unit price | The unit price of gas from gas shopping | ||
References
- Wang, Y.; Wang, X.; Yu, H.; Huang, Y.; Dong, H.; Qi, C.; Baptiste, N. Optimal Design of Integrated Energy System Considering Economics, Autonomy and Carbon Emissions. J. Clean. Prod. 2019, 225, 563–578. [Google Scholar] [CrossRef]
- Liu, D.; Luo, Z.; Qin, J.; Wang, H.; Wang, G.; Li, Z.; Zhao, W.; Shen, X. Low-Carbon Dispatch of Multi-District Integrated Energy Systems Considering Carbon Emission Trading and Green Certificate Trading. Renew. Energy 2023, 218, 119312. [Google Scholar] [CrossRef]
- Lu, J.; Liu, T.; He, C.; Nan, L.; Hu, X. Robust Day-Ahead Coordinated Scheduling of Multi-Energy Systems with Integrated Heat-Electricity Demand Response and High Penetration of Renewable Energy. Renew. Energy 2021, 178, 466–482. [Google Scholar] [CrossRef]
- Li, Y.; Zhang, F.; Li, Y.; Wang, Y. An Improved Two-Stage Robust Optimization Model for CCHP-P2G Microgrid System Considering Multi-Energy Operation under Wind Power Outputs Uncertainties. Energy 2021, 223, 120048. [Google Scholar] [CrossRef]
- Eladl, A.A.; ElDesouky, A.A. Optimal Economic Dispatch for Multi Heat-Electric Energy Source Power System. Int. J. Electr. Power Energy Syst. 2019, 110, 21–35. [Google Scholar] [CrossRef]
- Haider, J.; Lee, B.; Choe, C.; Abdul Qyyum, M.; Shiung Lam, S.; Lim, H. SNG Production with Net Zero Outflow of CO2 in an Integrated Energy System: An Energy and Economic Aspects. Energy Convers. Manag. 2022, 270, 116167. [Google Scholar] [CrossRef]
- Anand, H.; Narang, N.; Dhillon, J.S. Multi-Objective Combined Heat and Power Unit Commitment Using Particle Swarm Optimization. Energy 2019, 172, 794–807. [Google Scholar] [CrossRef]
- Wang, C.; Chen, S.; Mei, S.; Chen, R.; Yu, H. Optimal Scheduling for Integrated Energy System Considering Scheduling Elasticity of Electric and Thermal Loads. IEEE Access 2020, 8, 202933–202945. [Google Scholar] [CrossRef]
- Kong, X.Q.; Wang, R.Z.; Li, Y.; Huang, X.H. Optimal Operation of a Micro-Combined Cooling, Heating and Power System Driven by a Gas Engine. Energy Convers. Manag. 2009, 50, 530–538. [Google Scholar] [CrossRef]
- Ma, Y.; Wang, H.; Hong, F.; Yang, J.; Chen, Z.; Cui, H.; Feng, J. Modeling and Optimization of Combined Heat and Power with Power-to-Gas and Carbon Capture System in Integrated Energy System. Energy 2021, 236, 121392. [Google Scholar] [CrossRef]
- Shumei, J.; Xuebo, Q.; Yong, L.; Tianyu, Y.; Yijia, C. Joint Optimal Configuration of P2G Equipment and PV Considering Life-Cycle Carbon Emissions and Carbon Trading of IES. Dianli Zidonghua Shebei 2021, 41, 156–163. [Google Scholar]
- Wang, L.; Dai, W.; Zhu, L.; Wang, X.; Yin, C.; Cong, H.; Shi, T.; Qi, X.; Bi, R. Multi-Objective Expansion Planning of Park-Level Integrated Energy System Considering the Volatility Trend of CETP. IET Gener. Transm. Distrib. 2022, 16, 1225–1243. [Google Scholar] [CrossRef]
- Yan, N.; Ma, G.; Li, X.; Guerrero, J.M. Low-Carbon Economic Dispatch Method for Integrated Energy System Considering Seasonal Carbon Flow Dynamic Balance. IEEE Trans. Sustain. Energy 2023, 14, 576–586. [Google Scholar] [CrossRef]
- Groenemans, H.; Saur, G.; Mittelsteadt, C.; Lattimer, J.; Xu, H. Techno-Economic Analysis of Offshore Wind PEM Water Electrolysis for H2 Production. Curr. Opin. Chem. Eng. 2022, 37, 100828. [Google Scholar] [CrossRef]
- Sarrias-Mena, R.; Fernández-Ramírez, L.M.; García-Vázquez, C.A.; Jurado, F. Electrolyzer Models for Hydrogen Production from Wind Energy Systems. Int. J. Hydrogen Energy 2015, 40, 2927–2938. [Google Scholar] [CrossRef]
- Deng, Z.; Jiang, Y. Optimal Sizing of Wind-Hydrogen System Considering Hydrogen Demand and Trading Modes. Int. J. Hydrogen Energy 2020, 45, 11527–11537. [Google Scholar] [CrossRef]
- Kim, M.; Kim, J. An Integrated Decision Support Model for Design and Operation of a Wind-Based Hydrogen Supply System. Int. J. Hydrogen Energy 2017, 42, 3899–3915. [Google Scholar] [CrossRef]
- Recalde Melo, D.F.; Chang-Chien, L.-R. Synergistic Control between Hydrogen Storage System and Offshore Wind Farm for Grid Operation. IEEE Trans. Sustain. Energy 2014, 5, 18–27. [Google Scholar] [CrossRef]
- Abadlia, I.; Hassaine, L.; Beddar, A.; Abdoune, F.; Bengourina, M.R. Adaptive Fuzzy Control with an Optimization by Using Genetic Algorithms for Grid Connected a Hybrid Photovoltaic–Hydrogen Generation System. Int. J. Hydrogen Energy 2020, 45, 22589–22599. [Google Scholar] [CrossRef]
- Lin, J.; Cai, R. Optimal Planning for Industrial Park-Integrated Energy System with Hydrogen Energy Industry Chain. Int. J. Hydrogen Energy 2023, 48, 19046–19059. [Google Scholar] [CrossRef]
- Li, Q.; Li, R.; Pu, Y.; Li, S.; Sun, C.; Chen, W. Coordinated Control of Electric-Hydrogen Hybrid Energy Storage for Multi-Microgrid with Fuel Cell/ Electrolyzer/ PV/ Battery. J. Energy Storage 2021, 42, 103110. [Google Scholar] [CrossRef]
- Wang, J.; Xue, K.; Guo, Y.; Ma, J.; Zhou, X.; Liu, M.; Yan, J. Multi-Objective Capacity Programming and Operation Optimization of an Integrated Energy System Considering Hydrogen Energy Storage for Collective Energy Communities. Energy Convers. Manag. 2022, 268, 116057. [Google Scholar] [CrossRef]
- Aminudin, M.A.; Kamarudin, S.K.; Lim, B.H.; Majilan, B.H.; Masdar, M.S.; Shaari, N. An overview: Current progress on hydrogen fuel cell vehicles. Int. J. Hydrogen Energy 2023, 48, 4371–4388. [Google Scholar] [CrossRef]
- Rahim Malik, F.; Yuan, H.-B.; Moran, J.C.; Tippayawong, N. Overview of Hydrogen Production Technologies for Fuel Cell Utilization. Eng. Sci. Technol. Int. J. 2023, 43, 101452. [Google Scholar] [CrossRef]
- Wang, K.; Wu, X.; Wang, X.; Dang, P. Two-stage stochastic optimal scheduling for multi-microgrid networks with natural gas blending with hydrogen and low carbon incentive under uncertain environment. J. Energy Storage 2023, 72, 108319. [Google Scholar] [CrossRef]

| Equipment | Capacity/kW | Efficiency | Climbing Constraint | O and m Cost Factor Element/(kw·h) |
|---|---|---|---|---|
| Wind turbine | - | - | - | 0.018 |
| Photovoltaic | - | - | - | 0.008 |
| Electrolyser | 500 | 87% | 20% | 0.016 |
| Fuel cell | 250 | 95% | 20% | 0.0128 |
| Electric boiler | 800 | 80% | 20% | 0.011 |
| Gas boiler | 800 | 95% | 20% | 0.025 |
| Combined heat and power | 600 | 92% | 20% | 0.04 |
| Methane reactor | 250 | 60% | 20% | 0.016 |
| Equipment | Capacity/kW | Capacity Lower Bound | Upper Capacity Constraint | Climbing Constraint | O and m Cost Factor Element/(kw·h) |
|---|---|---|---|---|---|
| Hydrogen storage tan | 200 | 10% | 90% | 20% | 0.016 |
| Thermal storage tan | 500 | 10% | 90% | 20% | 0.016 |
| Air storage tank | 150 | 10% | 90% | 20% | 0.016 |
| Battery | 450 | 10% | 90% | 20% | 0.018 |
| Period Type | Time Frame | Electricity Price/ [CNY(kW·h)−1] |
|---|---|---|
| Valley interval | 01:00—07:00, 23:00—24:00 | 0.38 |
| Meantime segment | 08:00—11:00, 15:00—18:00 | 0.68 |
| Peak hour | 12:00—14:00, 19:00—22:00 | 1.20 |
| Power Consumption Type | Gas-Consuming Type | ||||
|---|---|---|---|---|---|
| a1 | b1 | c1 | a2 | b2 | c2 |
| 36 | −0.38 | 0.0034 | 3 | −0.004 | 0.001 |
| Parameter | Numerical Value |
|---|---|
| Carbon trading base price | 250 CNY/t |
| Length of the carbon trading band | 2 t |
| Carbon trading growth rate | 0.25 |
| Cost/CNY | Scenario 1 | Scenario 2 | Scenario 3 |
|---|---|---|---|
| Total cost | 14,757.94 | 12,065.80 | 11,456.83 |
| Operation and maintenance cost | 1087.13 | 1048.20 | 1104.50 |
| Power purchase cost | 1646.50 | 2254.21 | 2514.25 |
| Gas purchase cost | 6170.48 | 6024.92 | 5525.2 |
| Abandonment cost | 0 | 0 | 0 |
| Carbon trading cost | 5853.83 | 2738.47 | 2312.88 |
| Cost/CNY | Scenario 4 | Scenario 5 | Scenario 6 |
|---|---|---|---|
| Total cost | 20,230.94 | 16,521.44 | 15,627.83 |
| Operation and maintenance cost | 1073.05 | 1023.76 | 1104.50 |
| Power purchase cost | 4258.47 | 3941.51 | 3514.25 |
| Gas purchase cost | 5594.44 | 5701.57 | 5696.20 |
| Abandonment cost | 54.55 | 17.55 | 0 |
| Carbon trading cost | 9250.43 | 5837.06 | 5312.88 |
| Cost/CNY | Scenario 7 | Scenario 8 | Scenario 9 |
|---|---|---|---|
| Total cost | 20,230.94 | 19,712.61 | 15,627.83 |
| Operation and maintenance cost | 1073.05 | 1098.28 | 1104.50 |
| Power purchase cost | 4258.47 | 4704.97 | 3514.25 |
| Gas purchase cost | 5594.44 | 5391.30 | 5696.20 |
| Abandonment cost | 54.56 | 0 | 0 |
| Carbon trading cost | 9250.43 | 8518.06 | 5312.88 |
Disclaimer/Publisher’s Note: The statements, opinions and data contained in all publications are solely those of the individual author(s) and contributor(s) and not of MDPI and/or the editor(s). MDPI and/or the editor(s) disclaim responsibility for any injury to people or property resulting from any ideas, methods, instructions or products referred to in the content. |
© 2025 by the authors. Licensee MDPI, Basel, Switzerland. This article is an open access article distributed under the terms and conditions of the Creative Commons Attribution (CC BY) license (https://creativecommons.org/licenses/by/4.0/).
Share and Cite
Zhu, Y.; Niu, S.; Dai, G.; Li, Y.; Wang, L.; Jia, R. Optimal Economic Dispatch of Hydrogen Storage-Based Integrated Energy System with Electricity and Heat. Sustainability 2025, 17, 1974. https://doi.org/10.3390/su17051974
Zhu Y, Niu S, Dai G, Li Y, Wang L, Jia R. Optimal Economic Dispatch of Hydrogen Storage-Based Integrated Energy System with Electricity and Heat. Sustainability. 2025; 17(5):1974. https://doi.org/10.3390/su17051974
Chicago/Turabian StyleZhu, Yu, Siyu Niu, Guang Dai, Yifan Li, Linnan Wang, and Rong Jia. 2025. "Optimal Economic Dispatch of Hydrogen Storage-Based Integrated Energy System with Electricity and Heat" Sustainability 17, no. 5: 1974. https://doi.org/10.3390/su17051974
APA StyleZhu, Y., Niu, S., Dai, G., Li, Y., Wang, L., & Jia, R. (2025). Optimal Economic Dispatch of Hydrogen Storage-Based Integrated Energy System with Electricity and Heat. Sustainability, 17(5), 1974. https://doi.org/10.3390/su17051974