Article

The Impact of Carbon Emissions Trading and Market Participants on Green Innovation: A Synergistic Effect

School of Economics and Management, Yanshan University, Qinhuangdao 066004, China
*
Author to whom correspondence should be addressed.
Sustainability 2025, 17(5), 1927; https://doi.org/10.3390/su17051927
Submission received: 10 January 2025 / Revised: 19 February 2025 / Accepted: 23 February 2025 / Published: 24 February 2025

Abstract

:
How to incentivize green innovation is an important issue of great concern to scholars. Drawing on the theories of evolutionary analysis and neoclassical economic analysis, this study incorporates environmental policies and market participants into a unified analytical framework to explore the synergistic impacts of carbon emissions trading (CET) and market participants on green innovation. Using a sample of Chinese listed companies from 2006 to 2018, the empirical results based on the difference in difference (DID) model show the following: first, the CET pilot policy significantly promotes pilot firms’ green innovation; second, economic and environmental legitimacy are the mechanisms through which CET promotes corporate green innovation; and third, further analysis shows that CET and market participants have a synergistic effect on firms’ green innovation. This study provides new evidence as to how market-oriented CET affects green innovation through market participants, which provides a theoretical reference for policymakers to use market-based environmental regulation to promote green transformation.

1. Introduction

With increasingly prominent environmental and climate challenges, green innovation is considered to be a fundamental way to transcend the contradiction between the environment and the economy and a fundamental driving force to achieve environmental and economic sustainable development [1,2]. Given the importance of green innovation, how to effectively incentivize green-oriented technological innovation becomes the crux of the matter. Existing studies have shown that green innovation faces not only insufficient market incentives due to “double externalities” on the demand side [3,4,5] but also path dependence formed by carbon lock-in on the supply side [6,7,8], which leads to a lack of motivation for firms to engage in green innovation. Clearly, this requires policies, especially environmental policies, to comprehensively consider and address these impediments in order to effectively promote green innovation [1,3,9,10].
Market-oriented carbon emissions trading (CET) has become the most widely used environmental policy around the world [11,12]. Also known as cap and trade, it works by setting a total cap on emissions, issuing emission permits to firms, and allowing firms to trade the permits as commodities. As a result, it can raise production costs, lower the competitiveness of high-emission firms, and accelerate investments in low-carbon technology innovation [11]. China, as the world’s largest carbon emitter, has implemented carbon emissions trading, energy trading, and water trading, etc., among which highly valued carbon emissions trading was piloted in seven provinces and cities in 2013, with a national carbon market being started in 2018. It is evident that this market-oriented CET has become an important tool to cope with environmental and climate challenges and promote green economic development. In this context, the impact of CET on green innovation has become an important issue that we must consider.
Although large numbers of studies have investigated the impact of CET on green innovation e.g., Refs. [2,11,12,13,14], etc., the mechanism of CET unlocking green innovation still faces theoretical disputes and practical challenges: On the one hand, environmental economists advocate using price signals to provide incentives for firms’ green innovation. This is because the market-based environmental policy (e.g., carbon taxes and CET) can internalize the social costs of environmental degradation (i.e., market externalities), thereby providing more balanced price incentives for green innovation. However, this “demand–pull” approach often faces market failures, e.g., inelastic price signals and information asymmetry, etc. [5,10,15]. For this, evolutionary scholars argue that price signals are necessary, yet insufficient to assure innovative responses on the supply side [15]. They suggest taking the factors into account that shape innovative activity on the supply side (e.g., search routines, knowledge capabilities, technology paradigms, and regimes, etc.) [15,16]. It is not difficult to see that different theories have different approaches to stimulate green innovation, and it requires a broader analytical framework to include these theoretical perspectives in an analysis.
On the other hand, research on environmental regulation and green innovation has mainly focused on the direct impacts of environmental policies on firms, ignoring the impacts of market participants [17,18,19]. How market-oriented environmental policies interact with market participants has failed to attract sufficient attention, and few studies have incorporated it into a unified analytical framework. Obviously, these market participants, such as investors, financial institutions, and competitors, are equally affected by policies and further influence firms’ green innovation. Further research on the synergistic effects of CET and market participants can help us to fully understand the policy’s effects and deepen the research into the drivers of green innovation.
The above research gaps provide an opportunity to further explore the mechanisms by which CET unlocks green innovation. This paper takes China’s CET pilot policy as the background, and it is of great significant to see whether CET can break the carbon “lock-in” and further stimulate green innovation in such a coal-energy-dominated country. Combining the perspectives of environmental economics and evolutionary theory, we focus on firm-level technological regimes and reveal the intrinsic mechanism of CET unlocking green innovation. Using a sample of listed companies from 2006 to 2018, the evidence suggests that China’s CET has a significantly positive impact on firms’ green innovation, and it promotes firms’ green innovation mainly through economic and environmental legitimacy. Further analysis shows that market participants such as investors, financial institutions and competition can strengthen the positive relationship between CET and high-carbon firms’ green innovation.
The marginal contributions of this study to the existing research are as follows: First, this paper provides a new explanation for the impact of CET on green innovation based on different theoretical perspectives. Existing studies explore the impact of CET from the perspectives of cost or price based on neoclassical economic theory [18,19,20,21,22], ignoring factors such as supply-side carbon lock-in and path dependence [15]. By integrating evolutionary theory, this paper reveals the intrinsic mechanism of CET that breaks carbon lock-in and incentivizes green innovation through economic and environmental legitimacy, which deepens the mechanism study of CET. Second, our study reveals the interaction between environmental policy and market participants and their synergistic effects on green innovation. Previous studies on environmental regulation and green innovation were mainly focused on the policies’ direct impact on firms, ignoring the impact of market participants [
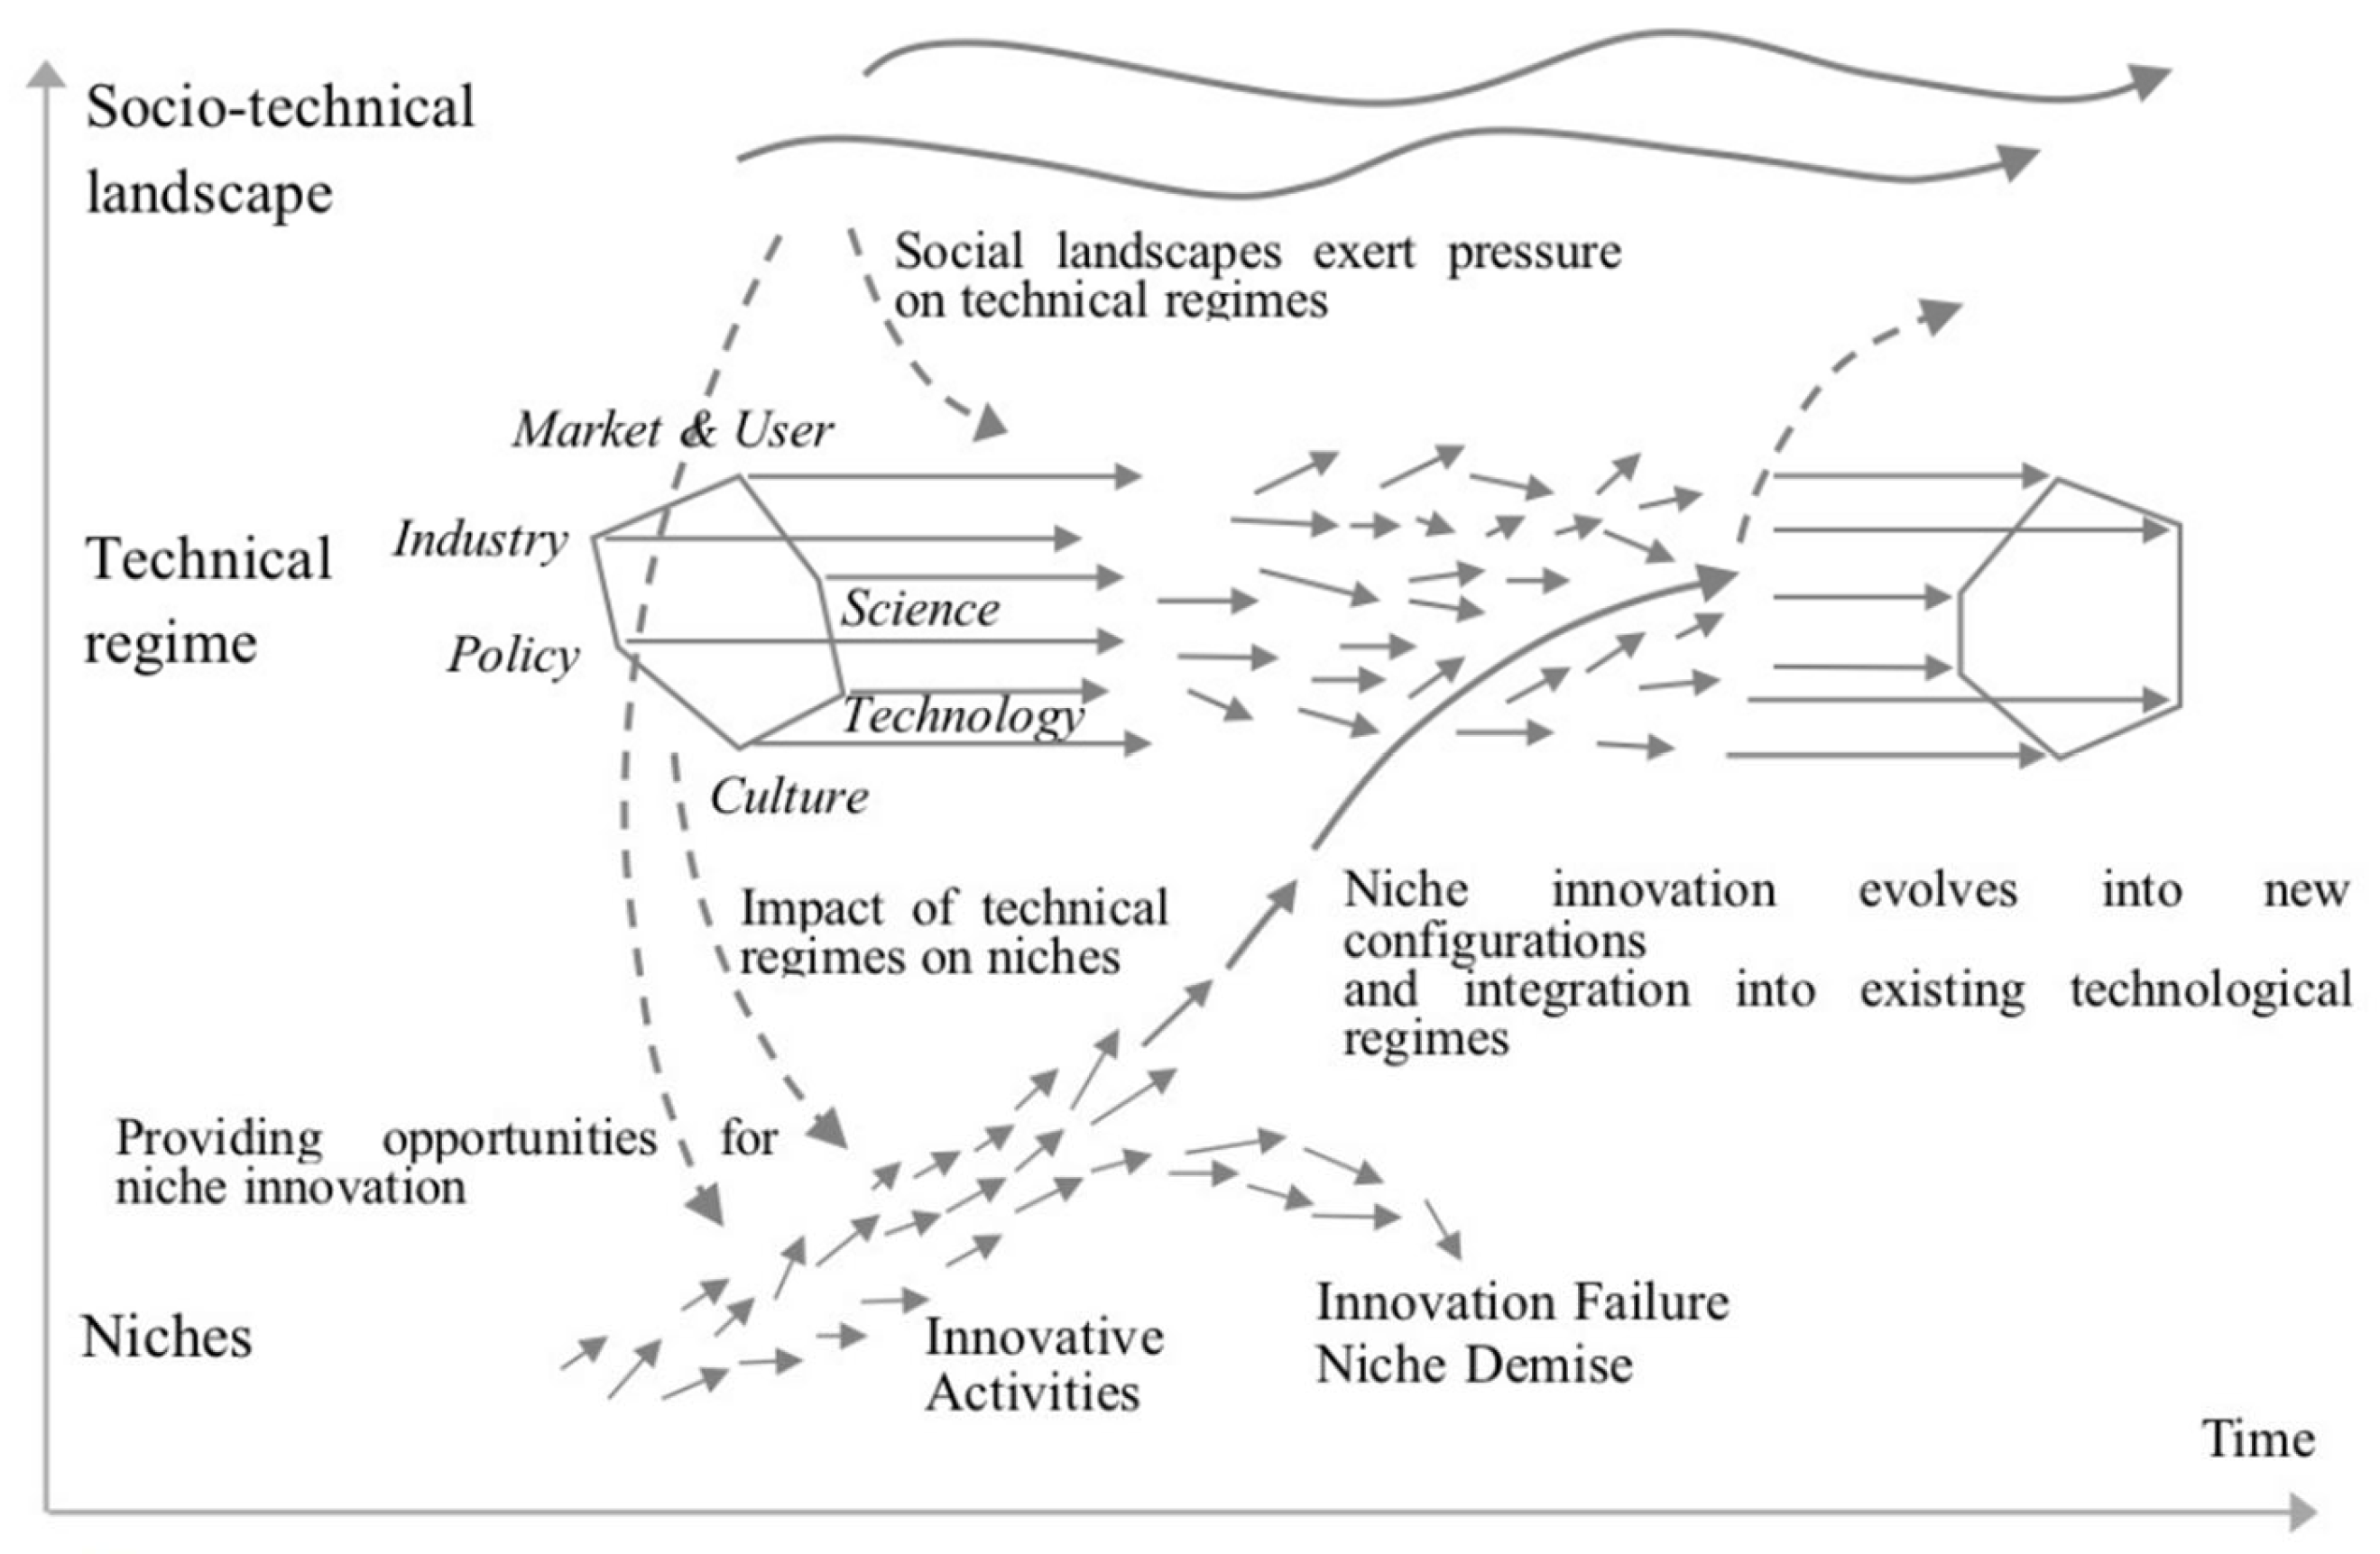
17]. In this paper, while considering the direct impacts of policies on green innovation, we further investigate the synergistic impacts of market participants such as investors, financial institutions, and competitors on green innovation, which helps us to comprehensively understand the effects of these policies and deepen the research into the drivers of green innovation; Third, our study enriches the empirical evidence of multilevel analysis (MLP) at the micro-firm level. Existing studies based on the multilevel perspective (MLP) have mainly used case study methodology and lacked large-sample empirical evidence [6,23,24]. This paper empirically analyzes the impact of CET on green innovation by conceptualizing firm-level technological regimes, including social landscapes, technological regimes, and niches, which extends the empirical research of the multilevel analysis framework (MLP).

2. Literature and Hypothesis

2.1. Literature Review

Green innovation typically refers to innovations consisting of new or improved processes, practices, systems, and products that benefit the environment and the economy and contribute to sustainable development [5,21,25]. As the global transition to a green and sustainable development continues, green innovation become the focus of attention. As we know, green innovation has the characteristics of long-term, risky, and having “double externalities”, which leads to a lack of incentives for firms to engage in green innovation [26,27,28,29].
To stimulate green innovation, existing studies mainly focus on the following aspects: First, demand-side market pull factors, including consumers’ environmental awareness, green payment willingness, and green market, etc. [19,30,31]. However, the pull effect of green markets is often constrained by factors such as information asymmetry and the price of green products, etc., resulting in limited market incentives [32]. Second, supply-side R&D push factors, such as R&D investments, government subsidies, and demonstration projects, etc. [33,34,35]. While these measures promote green innovation, they also face the challenges of ineffective resource allocation and technology path dependence [36]. And third, firm-level specific factors, such as the firm’s innovation ability, resources, and external networks [37,38], also play an important role in green innovation. However, enterprise green innovation is often restricted by resource constraints, short-sighted behavior, profit-seeking, and so on. It is worth noting that with the increasing prominence of environmental and climate challenges, the impact of environmental policies on green innovation have received increasing attention [11,39,40,41,42], and scholars have gradually formed different theoretical perspectives.
On the one hand, neoclassical environmental economists provide economic incentives for green innovation through cost and price signals [15]. As early markets failed to internalize firms’ environmental externalities through costs or prices, command-and-control environmental policies failed to provide effective incentives for green innovation, instead forcing firms to divert their limited resources from “productive” uses to pollution reduction. Obviously, additional costs are detrimental to firms’ innovation [43]. Although Porter’s “innovation compensation” has challenged the conventional wisdom, the conclusions do not reach a consensus [44,45].
Market-oriented environmental policies such as CET can internalize environmental costs and thus use price signals to provide economic incentives for firms’ emissions reduction and innovation activities [12,15]. However, markets always seem to be imperfect, and environmental policies often have limited incentives for green innovation due to insufficient price incentives or asymmetric information, etc. [10,21]. In fact, green innovation is driven not only by economic incentives but also by the resulting social changes [15], which requires a re-examination of the validity of a single economic logic. Studies have shown that demand-side price signals are necessary, while supply-side factors such as search routines, knowledge capabilities, prevailing technology paradigms, and regimes are equally important for green innovation [16], which requires a broader analytical perspective that incorporates these non-market factors [46].
On the other hand, evolutionary scholars provide a complement to environmental economists based on a systems perspective. They incorporate non-market factors such as search routines, knowledge capabilities, prevailing technology paradigms, etc., into their analytical framework and put forward theoretical models such as carbon lock-in and technological regime [8,47]. Carbon lock-in is a “technology–institution” complex formed by carbon-based technology and related institutions. This stable technical system hinders the development and application of green innovation and green technology [8]. Technological regime focuses on the change of technological system, that is, the process of changing a technological system, including technology, institutional rules, and market participants, to another technological system [48]. This theory reveals the intrinsic reason for path dependence in the process of technological evolution.
Evolutionary scholars reveal the reasons why green technology is difficult to develop and diffuse and deepen our understanding of green innovation. However, since concepts such as social landscape, technological regime, and niche are difficult to define and quantify, this line of research mainly focuses on macro case studies and becomes a descriptive “appreciation theory” [49]. The empirical research on technological transformation at the micro firm level needs to be expanded. Combining the perspectives of neoclassical economy theory and evolutionary theory, this study focuses on firm-level technological regimes and tries to reveal the mechanism of CET in unlocking green innovation.

2.2. Theoretical Framework

Multi-level perspective (MLP) is a theoretical framework widely used to portray technological transitions in areas such as transportation systems, energy systems, communication systems, etc. [48,50]. The basic premise of MLP is that transitions are non-linear processes that result from the interplay of multiple developments at three analytical levels: socio-technical landscapes [24], technical regimes, and technical niches (Figure 1) [46,48,51]. (1) The socio-technical landscape is the wider context that influences technological regimes and niches. It usually represents the greatest degree of structuration, in the sense of being beyond the control of individual actors, including political ideologies, societal values, and macro-economic trends. (2) Technical regime is the synthesis of the technical system and institutional system. The regime screens and retains innovative variants to ensure alignment and convergence between new technologies and the existing technological regime, which leads to incremental and path-dependent changes within the regime [52]. (3) Technological niches are the micro-levels where radical novelties emerge, and they act like “incubation rooms” that protect novelties from selection by the mainstream market [53]. Niches also known as protected spaces, ecological niches, etc., such as R&D laboratories, funded technology demonstration projects, etc. [54]. Niche innovations face obstacles from the existing technological regimes when niche innovation deviates from the requirements of those regimes [55].
In this paper, we try to conceptualize the socio-technical landscape, technical regimes, and niches and apply the MLP model to analyze firm-level technological regime transitions in order to shed light on firms’ green innovation process. This is mainly because firms, as the basic decision-making units of the socio-economy, are nested in larger technological regimes through technologies and institutions and influence the entire technological system by making decisions on new technologies, products, etc. An in-depth analysis of firm-level technological transitions helps to better understand the micro-mechanisms of green innovation. Next, we define the concepts needed in the study against the background of China’s CET pilot policy.
First, socio-technical landscapes represent the macro-environments that influence technology regimes and niches, such as policies, wars, and environmental issues [55,56]. With the global transition to low-carbon sustainability, environmental policies have become an important force driving technological transitions [57,58], which exert pressure and influence on existing high-carbon firms, carbon-based technological regimes, and innovation activities, thereby affecting green innovation. It is clear that these environmental policies are beyond the influence and control of the individual and are clearly exogenous [18,25]. Widely used CET, globally, is a typical type of socio-technical landscape that promotes a low-carbon socio-economic transition. Therefore, we use China’s CET pilot policy to proxy the socio-technical landscape.
Second, technological regimes can be divided by their scope into different levels, such as industry, community, and organization. Firm-level technological regimes include dominant technologies, such as carbon-based technologies, matching technologies, etc., and related institutions, such as carbon-based technology standards, technology rules, and product standards. It is through these technologies and institutions that firm-level technological regimes are embedded in higher-level regimes [15]. Similarly, firm-level technological regimes, as the basic decision-making units of the socio-economy, evolve and develop by screening and retaining their own innovative variants to ensure that new technological innovations are aligned and articulated with existing technological regimes [52]. In this paper, we focus on the analysis of firms’ technological regimes, which contributes to a better understanding of the micro-mechanisms of green innovation.
Finally, niches are micro-sites of innovation activities, e.g., corporate R&D laboratories, funded technology demonstration projects, etc. [54], nested within existing technology regimes [24]. Green innovation deviates from the existing fossil technology path, and therefore the development of green niches faces obstacles from the existing technological regime [55,59]. This paper utilizes green innovation to measure green niches, mainly because, on the one hand, green innovation is an important component of niches, especially technological niches, and has been applied in several studies [60]; on the other hand, using green innovation to identify firms’ green technological niche is empirically more accurate and easy to identify. Therefore, we use green innovation to measure firms’ efforts to break through carbon-based technological regimes’ lock-in.

2.3. Hypothesis Development

2.3.1. Impact of CET on Green Innovation

Existing studies have suggested that high-carbon technological regimes screen and retain innovative variants to ensure that new technological innovations and existing technological regimes can be aligned and bridged. As green innovation deviates from the requirements of existing high-carbon technological regimes, these regimes impede green innovation through screening and retention mechanisms, resulting in carbon-based technologies’ lock-in and path dependence [52]. This situation is changing with increasing environmental and climate problems, and environmental policy, as an important socio-technical landscape, has become an important external influence factor for high-carbon technological regimes. These environmental policies destabilize the “elements” of high-carbon technological regimes by creating new rules, standards, and requirements, and they provide the “window of opportunity” needed for the development of green technology niches [23,57,61,62]. In other words, an ideal environmental policy can both increase pressure on existing high-carbon technological regimes and incentivize the development of green technological niches [63]. We predict that CET can both weaken the “technology regime” lock-in of high-carbon firms and incentivize high-carbon firms’ green innovation.
First, CET could undermine the “technology regime” lock-in effect of high-carbon firms through economic and environmental legitimacy. As we know, firms operate not only in an economic environment but also in an institutional environment [24]. From the perspective of economic legitimacy, CET not only increases the cost of quotas, monitoring fees, inspection fees, and other environmental costs for high-carbon firms but also continually raises the operating costs of high-carbon technologies through “carbon trading”. Obviously, increasing costs reduce the economic legitimacy of existing high-carbon technologies, forcing high-carbon technologies to adjust and optimize, thus weakening the lock-in effect of carbon-based technologies. Similarly, from the perspective of environmental legitimacy, CET, in the form of “emission allowances”, requires that carbon-intensive firms meet emission standards or face penalties. This makes the original technological choices and institutional arrangements (e.g., production processes, technical standards, product standards, and traditional values, etc.) that have not previously taken environmental legitimacy into account increasingly face the challenge of new environmental standards. And these carbon-intensive firms have to make technological and institutional adjustments to better meet environmental legitimacy. In summary, under CET, the technologies and institutions based on fossil energy are under pressure for both economic and environmental legitimacy, which weakens the lock-in effect of the original carbon-based technology regimes and forces high-carbon firms to make technological and institutional adjustments to better satisfy economic and environmental legitimacy.
Second, CET can incentivize green-oriented technological innovation in high-carbon firms by increasing the economic and environmental legitimacy of green innovation. In terms of economic legitimacy, previous studies have shown that there is a lack of incentive for green innovation due to “double externalities” [5,26]. However, CET not only provides additional economic incentives for firms to reduce emissions through green innovation but also reduces the uncertainty of green innovation in the form of “carbon rights”. In terms of environmental legitimacy, green innovation usually refers to new or improved processes, practices, systems, or products that help to conserve resources at the source, improve the production process, reduce end-of-pipe pollution emissions, and promote firms realizing the policy requirements of cleaner production and compliant emissions [25], which helps firms to build up a green image and satisfy the environmental legitimacy requirements of stakeholders. It can be seen that green innovation, as a fundamental way to bridge the contradiction between environment and economy, can realize a win–win situation for both the environment and economy and meet the requirements of environmental and economic legitimacy. Facing the economic and environmental legitimacy induced by CET, high-carbon firms will actively turn to green innovation.
In conclusion, by economic and environmental legitimacy, CET can not only weaken high-carbon firms’ “technology–institution” lock-in but also encourage high-carbon firms’ green innovation. This, in fact, not only changes the drivers within the technological regime of high-carbon firms on the supply side of green innovation (such as scale and learning economy, complementary technologies, and infrastructure) but also provides a “window of opportunity” for green innovation on the demand side [56,64]. From the supply side of green innovation, when carbon-intensive firms face a “functional” gap in carbon emissions, the contradiction between the original high-carbon technological regime and the green niche gradually disappears and becomes consistent in the face of economic and environmental legitimacy pressures [15]. To fill the environmental gap, carbon-intensive firms will optimize their internal resource allocation, such as the reallocation of the firm’s existing knowledge base, finance, infrastructure, and other resources between carbon-based technologies and green niches, and actively develop green alternative technologies and replace existing high-carbon technologies, so as to achieve compliant emissions [65]. From the demand side of green innovation, faced with increasingly stringent economic and environmental legitimacy, high-carbon enterprises have the motivation to innovate and reduce emissions in order to continuously reduce environmental costs, as well as the economic incentive to sell additional allowances for a profit. More importantly, CET also provide a broad market expectation for promising green technologies. Green innovation can not only help enterprises achieve the goals of resource conservation and environmental protection and create a good green image, but also help them build green differentiated competitive advantages and obtain green premiums [66]. Therefore, we predict the following:
H1: 
CET has a positive impact on carbon-intensive firms’ green innovation.
H2: 
CET has a positive impact on carbon-intensive firms’ green innovation through economic and environmental legitimacy.

2.3.2. Synergistic Impact of CET and Market Participants on Green Innovation

It has been shown that environmental policies also influence market participants’ decisions, e.g., investors, financial institutions, etc. [67,68,69,70]. Although we have analyzed the direct impact of CET on green innovation, another important question is whether CET can further incentivize green innovation through market participants. In fact, market participants have a significant influence in the process of firms’ technological–institutional transition, and they are seen as key catalysts in accelerating the transition to more sustainable technological regimes [54,71]. We predict that the pressure of environmental and economic legitimacy of CET will affect market participants’ decision-making and thus affect firms’ green innovation. Specifically, policy pressure pushes market participants to pay more attention to high-carbon firms’ environmental and economic legitimacy, and these participants influence high-carbon firms’ technology selection through resource allocation and pressure or promote green innovation by establishing new connections with new projects and new enterprises [1,54].
In this paper, we discuss market participants with direct economic ties to high-carbon firms, such as investors, financial institutions, and competitors, who have an important impact on high-carbon firms’ green innovation. First, investors, as major market participants, directly manage and supervise firms’ innovation activities, technology choices, and green transformation, etc. Under a carbon emissions trading policy, the carbon-based technologies, technical standards, norms, and societal expectations in existing high-carbon technology regimes face economic and environmental legitimacy challenges. It is not difficult to predict that some incumbent investors will support or push firms to engage in green innovation in order to avoid “sunk costs” and to increase the legitimacy of existing carbon-based technologies; others may reduce their commitment to existing high-carbon technology regimes [23], for example, by reducing resource inputs or disengaging from the original technology regimes. They may then seek out green technologies with greater legitimacy and establish new linkages with greener projects or firms, which objectively brings resources and legitimacy to green innovation, thus further promoting its development. Therefore, investors can further strengthen the positive relationship between CET and green innovation.
Second, financial institutions are important drivers of green innovation [72]. High-carbon firms often need to seek financing and other financial services, leading to frequent interactions between financial institutions and existing carbon-based technology regimes. As external stakeholders of high-carbon firms, financial institutions influence green innovation through their own selection function, i.e., when a financial institution invests in/lends money to a project or a firm, the technology and/or design of the project is selected into the existing technology regime [73]. With the implementation of the CET policy, we predict that the policy will also affect the financial institutions’ decision-making, thus promoting green innovation. On the one hand, financial resources such as loans and financing will select and flow to carbon-based technology regimes with higher environmental and economic legitimacy, and it has been found that resources and factors reduce the flow to unstable high-carbon technology regimes [23,62]. On the other hand, financial institutions provide financial support for green innovation activities. For example, financial support for research and development and early commercialization can help promote the development of green technologies.
Third, with the promotion of CET, a large number of low-carbon technologies have emerged in the market, such as wind, solar, photovoltaic, nuclear, biomass, geothermal, tidal, and carbon capture and storage technologies, some of which are already competitive, but most of which are still in the research and development and demonstration stages. It is obvious that market competition can equally affect green innovation in existing high-carbon technology regimes. On the one hand, extensive competitive pressures arise from green markets [74], such as environmental demands from consumers (especially those from international markets), suppliers, and partners [75], who require high-carbon technology regimes to take measures to improve their environmental performance. On the other hand, the innovation efforts and demonstration effects of competitors also influence high-carbon firms’ green innovation, which helps focal firms to identify and imitate competitors’ behaviors to gain legitimacy [76,77]. In summary, market competition will further strengthen the impact of CET on green innovation. The current status of CET research on green innovation in this paper is shown in Table 1 [78].
H3a: 
Investors can strengthen the positive relationship between CET and green innovation.
H3b: 
Financial institutions can strengthen the positive relationship between CET and green innovation.
H3c: 
Market competition can strengthen the positive relationship between CET and green innovation.

3. Methodology

3.1. Sample and Data

To investigate the impact of CET on green innovation, this study takes the background of China’s CET pilot policy launched in 2013 and selects listed companies in the chemical, paper, nonferrous, petrochemical, iron and steel, building materials, aviation, and electric power industries covered by the policy as our initial sample. Considering that national carbon trading was started in 2018, we restricted the sample period to 2006–2018 and ensured that there was a five-year window before and after the implementation of the pilot policy. The detailed sample selection is described below:
First, according to the CET pilot policy, our sample is limited to pilot policy-covered industries, including chemical, paper, nonferrous, petrochemical, steel, building materials, aviation, and power industries. These industries are not only the main industries of carbon emissions but also an important part of the innovation system [81]. Second, given the availability of data, we take listed companies in the above industries as our initial sample. The treatment group of the sample is identified by matching the list of pilot firms participating in emissions trading with the names of listed companies and their subsidiaries, while other firms not covered by the policy constitute the control group; finally, considering the completeness and continuity of the data, ST and *ST firms are excluded, as well as firms with serious missing data, and finally 6418 firm-year observations are obtained.
The data sources are as follows: the financial and accounting data are obtained from the China Stock Market and Accounting Research (CSMAR) database; green patent data, including patent category, patent number, year, and other information, are from CSMAR and the State Intellectual Property Office (SIPO). Finally, we merge the data from different sources.

3.2. Empirical Model

The existing studies usually adopt the difference in difference (DID) model based on a quasi-natural experiment to identify policy treatment effects, such as in Hu et al. (2020) [18] and Ren et al. (2020) [19], which helps to eliminate unobservable time-invariant confounding factors. Following these studies, we also use the DID model to investigate the impact of CET on corporate green innovation:
Y i t = β 0 + β 1 C E T i × P o s t t + ρ X i t + α i + γ t + ε i t
in Equation (1), where i indexes firms, and t indexes years. Y i t is green innovation, measured by the logarithm of green patents in year t of firm i.   C E T i × P o s t t   is the explanatory variable of our interest, and β 1 captures the difference in green innovation between pilot and non-pilot firms before and after policy implementation. X i t   includes a set of control variables defined in the next section. In addition, the model also controls for firm fixed effects α i and year fixed effects γ t to obtain robust estimation results. Our study employs a difference in difference (DID) approach to assess the impact of CET on green innovation using Chinese listed companies. The DID method is particularly suitable for evaluating the causal effect of policy interventions by comparing changes in outcomes between treatment and control groups over time [82]. The analysis process is shown in Figure 2.

3.3. Variable Measurement

Dependent Variable. Green innovation (Gre_PAT): we use the logarithm of the number of green patents plus 1 to measure green innovation (Gre_PATlog). Green patents are identified according to the IPC classification in the “International Patent Green Classification List” proposed by the WIPO. In addition, we further use the number of green invention patents and green utility model patents as alternative measures for robustness tests. The data are obtained from CSMAR database and State Intellectual Property Office database.
Independent Variable. Carbon emissions trading (CET × POST) is the independent variable of our interest, where CET is a dummy variable assigned a value of 1 if a firm is covered by the pilot policy and 0 otherwise; POST is a dummy variable that takes the value of 1 if after 2012 and 0 otherwise. The coefficient of CET × POST captures the difference in green innovation between pilot and non-pilot firms before and after policy implementation.
Mechanism Variables. Economic legitimacy (Eco_Leg) can be measured using the economic or cost pressures imposed by CET, which are often reflected in firms’ environmentally relevant inputs or outputs. First, economic legitimacy is measured with the logarithm of the firm’s investment in environmental governance (Eco_LegInvest), which captures a firms’ environmental inputs as a result of the policy; and second, we further measure economic legitimacy (Eco_LegFee) with their output-based sewage charges [20].
Environmental legitimacy (Env_Leg) adopts two measurements in this paper. Environmental responsibility scores usually reflect the environmental pressures faced by firms (Env_LegCSR), and we firstly use environmental responsibility scores to measure firms’ environmental legitimacy; second, following Li et al. (2018) [83], the firm’s environmental legitimacy (Env_LegJ-F) is measured with the J-F index calculated based on media coverage data. Specifically, this paper selects media reports related to the sample firms and codes them according to the content of the reports (positive, neutral, and negative) so that the measured J-F index take values ranging from −1 to 1; if the value is close to 1, the article is more popular, and if the value is close to −1, the article is less popular.
Market Participants. Investor (Inv) is measured with the proportion of institutional investors’ holdings in the total shares of the listed firm, including the sum of the shareholding ratios of securities brokerages, insurance companies, fund management companies, and qualified foreign investors.
Financial institution (Fin): we use the ratio of total loans (including long-term loans and short-term loans) to operating income to measure the impact of financial institutions, mainly because financial institutions have an impact on firms through financing.
Market competition (HHI): the Herfindahl index has been used to measure market competition. In this paper, 1 minus the Herfindahl index is used to measure the market competition faced by firms.
Control Variables. We further control for other affecting green innovation variables in the model. Firm size (Asset) is measured with the logarithm of the firm’s assets at the end of the year [84]. Firm age (Age) is the number of years since the firm was established. Leverage (Lev) is the ratio of debt to total assets [85], and Revenue is measured using the logarithm of a firm’s total operating income in a year plus one. Cash is measured with the logarithm of the firm’s cash and cash equivalents at the end of a year [86]. R&D is the proportion of R&D investment to total assets. Top_holding uses the proportion of shares held by the largest shareholder [81], and State is the proportion of state investors’ shareholdings to the total amount of share capital of the firm. In addition, unobservable confounders are further considered in the model by controlling for firm and year fixed effects.

3.4. Descriptive Statistics

To avoid spurious regression, we use the Levin–Lin–Chu test to check the station-arity of our data, and the results are reported in Table 2. Column 1 controls for time trend. The results show that our variables are stationary.
Table 3 reports the descriptive statistical analysis of variables. The mean values of the Gre_PATlog is 0.59, and the median value is 0. It can be seen that more than half of the sample firms do not have green innovation outputs. This indicates a low level of green innovation in high-carbon industries, which is mainly due to the lack of economic incentives and insufficient technological innovation capacity [5]. The mean value of CET is 0.33, indicating that 33% of the firms in our sample are covered by the policy. This ratio shows that the coverage of the carbon emissions trading pilot policy is still limited [12]. The descriptive statistics of the remaining control variables are basically consistent with existing studies.

4. Empirical Results

4.1. Baseline Results

4.1.1. Parallel Trend Test

The key identifying assumption for using the DID model is that the green innovation of non-pilot firms provides effective counterfactual variability in the green innovation of pilot firms [18]. A potential challenge to this hypothesis is that the variation between pilot and non-pilot firms may be driven by underlying time trends. To test this hypothesis, we conduct the following tests to examine the parallel trend hypothesis.
First, following Hu et al. (2020) [18], we directly observe the annual average trend of green innovation in pilot and non-pilot firms. As shown in Figure 3, the figure presents the annual average trend of green patents of pilot and non-pilot firms. Before 2012, the trends of green patents among pilot firms and non-pilot firms are basically the same, while after 2012, the green patents of pilot firms show an upward trend. In terms of annual trends in green innovation, there is no significant difference in trends between pilot and non-pilot firms before the implementation of the policy.
Second, based on existing studies [20], we construct a time trend variable (Trend) to capture the linear time trend in the green innovation of pilot and non-pilot firms and assigned values of 1, 2, and 3… 13 in 2006… 2018, respectively. The coefficient of CET × Trend × Pre2013 is statistically insignificant if pilot and non-pilot firms have similar time trends over the period 2006–2012. Specifically, we estimate the following model:
Y i t = β 0 + β 1 C E T i × T r e n d t × P r e 2013 + β 2 C E T i × T r e n d t + β 3 C E T i × P r e 2013 + β 4 T r e n d t × P r e 2013 + ρ X i t + α i + γ t + ε i t
In Equation (2), Trend is the time trend, and other variables are defined as shown in Equation (1). The coefficient β 1 is used to capture the difference in time trend between pilot and non-pilot firms before policy implementation. The estimation results are reported in Table 4. It can be seen that the coefficients of CET × Trend × Pre2013 are insignificant in columns (1)–(2), indicating that there is no systematic difference in time trends between pilot and non-pilot firms. In other words, the model is consistent with the parallel trend assumption of DID.

4.1.2. The Impacts of CET on Green Innovation

The baseline results of CET on firms’ green innovation are reported in Table 5. In columns (1) and (2), we only add fixed effects to the model to compare the changes in green innovation between pilot and non-pilot firms before and after the pilot policy implementation. Column (1) shows that the coefficient of CET × Post is 0.225, which is significantly positive at the 1% level, and the estimated coefficient in column (2) is 5.557, which is also significantly positive at the 1% level. The results indicate that CET promotes green innovation in the pilot firms. In columns (3)–(4), the model further adds control variables to the model, and the estimated coefficients are significantly positive at the 1% level, indicating that the pilot policy promotes firms’ green innovation and supports our hypotheses.
In fact, some earlier studies have reached similar conclusions. For example, Lu et al. (2024) [79], based on China’s carbon emission trading policies, found that market-based environmental regulation tools can effectively reduce environmental pollution in urban areas, Zhang et al. (2021) [80] further analyzed the heterogeneous effects of carbon emission trading policies on innovation, which provided a reference for further research based on the heterogeneity of policy design.

4.1.3. Robustness Tests

(1) PSM-DID Estimation
Although we find a positive impact of CET on firm green innovation, this result may be subject to policy selectivity bias [18], such as selecting economically developed provinces or larger firms, which typically have stronger innovation capabilities. To mitigate this concern, we use a propensity score matching (PSM) approach to address possible selectivity bias [87].
Specifically, we use propensity scores to match firms subject to policy intervention with firms with similar characteristics that are not subject to policy intervention. To obtain reliable results, the most important thing is to select the matching covariates, and the covariates selected from the firm level include the variables of firm size, ROA, leverage, R&D investment, and governance characteristics. Based on 1:1 nearest neighbor matching, the baseline model is re-estimated after the balance test. The estimation results are presented in Table 6. The coefficients of CET × Post in columns (1)–(2) are 0.107 and 1.256, respectively, which are also significantly positive at the 5% level. The results indicate that CET significantly contributes to green innovation in the pilot firms based on the PSM-DID model.
(2) DDD Estimation
Although the baseline model has controlled for firm fixed effects and year fixed effects, the results may be driven by other omitted factors, such as contemporaneous policy shocks, economic agglomeration, etc. [19,88], leading to biased estimates. To address these issues, we perform a DDD estimation as a complementary robustness test based on the differences in pollution intensity across industries (policy-covered versus non-policy-covered industries). Specifically, triple difference further compares the variability in CET on green innovation between pilot firms and non-pilot firms and between covered industries and non-covered industries.
The results based on the DDD model are reported in Table 7. The coefficient of CET × Post × Ind in column (1) is 0.107, which is also significantly positive at the 5% level. The results show that CET has a positive impact on green innovation in the pilot firms. The result of column (2) shows that CET has an insignificant impact on the number of green patents. Overall, these results are similar to what we found in the baseline model.
(3) Other Robustness Tests
In this section, we further test our results using alternative variables and models. First, we further use the number of green invention patents and green utility model patents as alternative measures for robustness tests. Second, given the lagged characteristics of green innovation, we further use a lagged model to test our results.
The estimated results of the alternative variables are shown in Table 8 below. In Panel A column (1), we find that the coefficient of CET × Post is 0.069, which is significantly positive at the 1% level. The results indicate that CET significantly promotes green invention innovation, and the estimated coefficient in column (2) is 0.200, which is also significantly positive at the 1% level. The results indicate that CET also significantly promotes green utility model patents. Columns (1)–(2) in Panel B are the results with a lag of one period, where it can be seen that the results are still robust.

4.2. The Mechanism of CET Unlocking Green Innovation

In this section, we further examine the mechanisms by which CET influences green innovation, namely economic and environmental legitimacy, and these mechanisms are not necessarily mutually exclusive.

4.2.1. Economic Legitimacy

As mentioned above, CET not only increases the cost of quotas, monitoring fees, inspection fees, and other environmental costs for high-carbon firms but also continually raises the operating costs of high-carbon technologies through “carbon trading”. Clearly, increasing costs reduce the economic legitimacy of existing high-carbon technologies, and economic pressures force high-carbon technologies to adjust and optimize, thus weakening the lock-in effect of carbon-based technologies.
To test the mechanism of economic legitimacy, we measure firms’ economic legitimacy using the logarithm of the amount of firms’ investment in environmental governance and emissions charges, respectively, which can reflect the inputs and outputs of firms as a result of environmental improvements. The results are reported in Table 9. The coefficients of CET × Post in column (1) is 1.701, which is significantly positive at the 1% level. The results show that CET has a significant positive impact on firms’ investment in environmental governance. Meanwhile, the estimated coefficient in column (2) is 0.826, which is also significantly positive at the 1% level. The results indicate that CET also increases firms’ environmental costs. These results suggest that carbon emissions trading can drive green innovation through economic legitimacy.

4.2.2. Environmental Legitimacy

In terms of environmental legitimacy, CET requires that carbon-intensive firms meet emission standards in the form of “emission allowances” or face penalties. This makes the original technological choices and institutional arrangements (e.g., production processes, technical standards, product standards, and traditional values, etc.) that have not previously taken environmental legitimacy into account increasingly face the challenge of new environmental standards. And these carbon-intensive firms have to make technological and institutional adjustments to better meet environmental legitimacy.
To test this mechanism, we measure environmental legitimacy pressure using the environmental gap and J-F index. Based on the Hutchinson Environmental Responsibility Score, the environmental gap is measured by environmental liability demerit points, which reflect the environmental pressures faced by firms; another environmental legitimacy measure is measured based on the J-F index used by Li et al. (2018). The results are reported in Table 10. The coefficients of CET × Post in column (1) is 2.607, which is significantly positive at the 1% level. The results show that CET increases the firm’s environmental gap. Meanwhile, the estimated coefficient in column (2) is −0.043, which is significantly negative at the 5% level. The results indicate that firms are facing more environmental legal pressure. This evidence shows that CET increases the firms’ environmental legitimacy pressure, which is similar to the conclusion of Liu and Li (2022) [13] that carbon emissions trading promotes firms’ innovation through external pressure.

4.3. The Synergistic Impacts of CET and Market Participants on Green Innovation

While we have tested the direct impact of CET on green innovation, another important question is whether CET can further synergistically drive green innovation through market participants. We predict that CET will affect market participants, which in turn affects firms’ green innovation. Specifically, we investigate market participants with direct economic ties to high-carbon firms, including investors, financial institutions, and competitors, and analyze the synergistic impacts of CET and market participants on high-carbon firms’ green innovation in terms of synergism, consistency, and intensity, respectively.

4.3.1. Synergistic Effects of CET and Market Participants

First, we analyze the synergistic impacts of CET and market participants on firms’ green innovation. Specifically, the cross-multiplication of CET × Post and market participants (including investors (Inv), financial institutions (Fin), and competitors (HHI)) is used to capture synergistic effects. Table 11 reports the estimation results, which show that the coefficients of the explanatory variables in columns (1)–(3) are significantly positive at the 1% level. This indicates that market participants, represented by investors, financial institutions, and competitors, are all able to strengthen the positive relationship between CET and green innovation, which supports our research hypothesis.

4.3.2. Consistency of CET and Market Participants

We predict that the legitimacy pressure of CET will influence market participants’ focus, stance, and decision-making, and thus firms’ green innovation. CET reinforces consistency by increasing market participants’ attention to high-carbon firms’ environmental and economic legitimacy. Therefore, this section further examines whether CET can contribute to market participants’ increased attention to high-carbon firms’ environmental and economic legitimacy. The results are reported in Table 12 below, which shows that the coefficients of CET × Post × Inv, CET × Post × Fin, and CET × Post × HHI are significantly positive at least at the 10% level, indicating that CET promotes market participants’ attention to environmental legitimacy and economic legitimacy.

4.3.3. Intensity of CET and Market Participants

Different market participants have differentiated responses to CET, and we further analyze the impact of policies on green innovation through market participants from an intensity perspective. Specifically, we construct variables to capture investors’ sensitivity to the carbon price (CET × Post × Inv × Price), financial institutions’ sensitivity to the carbon price (CET × Post × Fin × Price), and competitors’ sensitivity to the price (CET × Post × HHI × Price) to reflect the intensity of market participants. The results are reported in Table 11. As shown in Table 13, the synergistic effects between financial institutions and market competition increases significantly with the increase in carbon price, while the effects between investors and green innovation does not increase significantly with the increase in carbon price, which suggests that there are some differences in the synergistic effects between CET and market participants on green innovation under different policy intensities.

5. Conclusions and Policy Implications

Stimulating green innovation is an important issue of great concern to scholars, and differentiated mechanisms and methods have been used to incentivize green innovation from different theoretical perspectives. This paper reveals the mechanism of CET in unlocking green innovation, combining the perspectives of neoclassical economy theory and evolutionary theory. In the context of China’s CET pilot policy, based on a sample of listed companies from 2006 to 2018, we find that the CET pilot policy significantly promotes pilot firms’ green innovation, and economic and environmental legitimacy are the mechanisms through which CET promotes green innovation. Further analysis shows that market participants such as investors, financial institutions, and competition can strengthen the positive relationship between CET and high-carbon firms’ green innovation. Our findings are consistent with those of Chen et al. (2021) [2] where we extend their study by including market participants. CET contributes significantly to green innovation, especially through economic and environmental legitimacy mechanisms. Moreover, market participants play an important synergistic role in this process, further amplifying the effect of the policy. These findings provide important insights into understanding how CET policies can drive green transformation through multifaceted mechanisms. Future studies could further explore the heterogeneity of these mechanisms across industries and regions and how market forces can be better used through policy design to drive green innovation.
This study has the following implications in the context of green transformation: First, existing studies on CET and green innovation mostly focus on whether to innovate or not and lack an in-depth understanding of the process of green innovation. This paper combines the theory of environmental economics with evolutionary theory to reveal the intrinsic mechanism of CET in unlocking green innovation from the supply and demand sides through legitimacy pressure. It can be seen that among the incentives for green innovation, in addition to the demand-side economic incentives for green innovation, supply-side R&D inputs, knowledge, practices, and corresponding resource inputs are equally important; Second, we find that market participants also play an important role in the green transition process of high-carbon firms. The synergistic effects between CET and market participants further reinforce that the government should guide market participants to promote high-carbon firms’ green innovation through resource allocation, compliance pressure, etc., so as to comprehensively promote green technological innovation as a priority during the transition window. In general, the analysis of green innovation under the framework of MLP is helpful to further broaden the analysis framework of green innovation.

Author Contributions

Conceptualization, Y.H.; methodology, Y.H.; software, J.L.; validation, J.L.; formal analysis, J.L.; investigation, R.H.; resources, R.H.; data curation, R.H.; writing—original draft preparation, J.L. and S.F.; writing—review and editing, J.S. and S.F.; visualization, J.S.; supervision, Y.H.; funding acquisition, Y.H. All authors have read and agreed to the published version of the manuscript.

Funding

This research is funded by the Hebei Province Social Science Foundation Program (grant number: HB21GL007, Research on the impact mechanism and countermeasure of market-based environmental regulation on industrial green development).

Institutional Review Board Statement

Not applicable.

Informed Consent Statement

Not applicable.

Data Availability Statement

The variables used in this paper are collected from the China Stock Market and Accounting Research (CSMAR) and Wind Database.

Conflicts of Interest

This study was conducted solely for scientific objectives, and the authors declare no conflicts of interest.

References

  1. Edmondson, D.L.; Kern, F.; Rogge, K.S. The co-evolution of policy mixes and socio-technical systems: Towards a conceptual framework of policy mix feedback in sustainability transitions. Res. Policy 2019, 48, 103555. [Google Scholar] [CrossRef]
  2. Chen, Z.; Zhang, X.; Chen, F. Do carbon emission trading schemes stimulate green innovation in enterprises? Evidence from China. Technol. Forecast. Soc. Change 2021, 168, 120744. [Google Scholar] [CrossRef]
  3. Bretschger, L.; Pittel, K. Twenty Key Challenges in Environmental and Resource Economics. Environ. Resour. Econ. 2020, 77, 725–750. [Google Scholar] [CrossRef] [PubMed]
  4. Popp, D. Environmental Policy and Innovation: A Decade of Research. Int. Rev. Environ. Resour. Econ. 2019, 13, 265–337. [Google Scholar] [CrossRef]
  5. Horbach, J.; Rammer, C.; Rennings, K. Determinants of eco-innovations by type of environmental impact—The role of regulatory push/pull, technology push and market pull. Ecol. Econ. 2012, 78, 112–122. [Google Scholar] [CrossRef]
  6. Söderholm, P. The green economy transition: The challenges of technological change for sustainability. Sustain. Earth 2020, 3, 6. [Google Scholar] [CrossRef]
  7. Meadowcroft, J. What about the politics? Sustainable development, transition management, and long term energy transitions. Policy Sci. 2009, 42, 323–340. [Google Scholar] [CrossRef]
  8. Unruh, G.C. Understanding carbon lock-in. Energy Policy 2000, 28, 817–830. [Google Scholar] [CrossRef]
  9. Heggelund, G.M. China’s climate and energy policy: At a turning point? Int. Environ. Agreem.-Polit. Law Econom. 2021, 21, 9–23. [Google Scholar] [CrossRef] [PubMed]
  10. Fagerberg, J. Mobilizing innovation for sustainability transitions: A comment on transformative innovation policy. Res. Policy 2018, 47, 1568–1576. [Google Scholar] [CrossRef]
  11. Bai, J.; Ru, H. Carbon Emissions Trading and Environmental Protection: International Evidence. Manag. Sci. 2024, 70, 4593–4603. [Google Scholar] [CrossRef]
  12. Klaus, G.; Florian, S.; Thomas, W. Environmental Policies and directed technological change. J. Environ. Econ. Manag. 2024, 124, 102916. [Google Scholar]
  13. Liu, M.; Li, Y. Environmental regulation and green innovation: Evidence from China’s carbon emissions trading policy. Financ. Res. Lett. 2022, 48, 103051. [Google Scholar] [CrossRef]
  14. Sun, C.; Tie, Y.; Yu, L. How to achieve both environmental protection and firm performance improvement: Based on China’s carbon emissions trading (CET) policy. Energy Econ. 2024, 130, 107282. [Google Scholar] [CrossRef]
  15. Legrand, A.M.; Bocquet, R.; Gandia, R. Multi-level neo-institutional analysis of pressures and tensions for adopting a digitally driven business model innovation: Responses from a French energy incumbent. Technol. Forecast. Soc. Change 2024, 205, 123458. [Google Scholar] [CrossRef]
  16. Loorbach, D.; Frantzeskaki, N.; Avelino, F. Sustainability transitions research: Transforming science and practice for societal change. Annu. Rev. Environ. Resour. 2017, 42, 599–626. [Google Scholar] [CrossRef]
  17. Zhang, Y.J.; Shi, W.; Jiang, L. Does China’s carbon emissions trading policy improve the technology innovation of relevant enterprises? Bus. Strateg. Environ. 2020, 29, 872–885. [Google Scholar] [CrossRef]
  18. Hu, Y.; Ren, S.; Wang, Y.; Chen, X. Can carbon emission trading scheme achieve energy conservation and emission reduction? Evidence from the industrial sector in China. Energy Econ. 2020, 85, 104590. [Google Scholar] [CrossRef]
  19. Ren, S.; Hu, Y.; Zheng, J.; Wang, Y. Emissions trading and firm innovation: Evidence from a natural experiment in China. Technol. Forecast. Soc. Change 2020, 155, 119989. [Google Scholar] [CrossRef]
  20. Ren, S.; Yang, X.; Hu, Y.; Chevallier, J. Emission trading, induced innovation and firm performance. Energy Econ. 2022, 112, 106157. [Google Scholar] [CrossRef]
  21. Borghesi, S.; Cainelli, G.; Mazzanti, M. Linking emission trading to environmental innovation: Evidence from the Italian manufacturing industry. Res. Policy 2015, 44, 669–683. [Google Scholar] [CrossRef]
  22. Teixidó, J.; Verde, S.F.; Nicolli, F. The impact of the EU Emissions Trading System on low-carbon technological change: The empirical evidence. Ecol. Econ. 2019, 164, 106347. [Google Scholar] [CrossRef]
  23. Kivimaa, P.; Kern, F. Creative destruction or mere niche support? Innovation policy mixes for sustainability transitions. Res. Policy 2016, 45, 205–217. [Google Scholar] [CrossRef]
  24. Geels, F.W. Micro-foundations of the multi-level perspective on socio-technical transitions: Developing a multi-dimensional model of agency through crossovers between social constructivism, evolutionary economics and neo-institutional theory. Technol. Forecast. Soc. Change 2020, 152, 119894. [Google Scholar] [CrossRef]
  25. Cecere, G.; Corrocher, N.; Gossart, C.; Ozman, M. Lock-in and path dependence: An evolutionary approach to eco-innovations. J. Evol. Econ. 2014, 24, 1037–1065. [Google Scholar] [CrossRef]
  26. Rennings, K. Redefining innovation—Eco-innovation research and the contribution from ecological economics. Ecol. Econ. 2000, 32, 319–332. [Google Scholar] [CrossRef]
  27. Li, D.; Zhao, Y.; Zhang, L.; Chen, X.; Cao, C. Impact of quality management on green innovation. J. Clean Prod. 2018, 170, 462–470. [Google Scholar] [CrossRef]
  28. Xie, R.; Teo, T.S. Green technology innovation, environmental externality, and the cleaner upgrading of industrial structure in China—Considering the moderating effect of environmental regulation. Technol. Forecast. Soc. Change 2022, 184, 122020. [Google Scholar] [CrossRef]
  29. Stojčić, N. Social and private outcomes of green innovation incentives in European advancing economies. Technovation 2021, 104, 102270. [Google Scholar] [CrossRef]
  30. Wang, K.; Zheng, L.J.; Lin, B. Demand-side incentives, competition, and firms’ innovative activities: Evidence from automobile industry in China. Energy Econ. 2024, 132, 107426. [Google Scholar] [CrossRef]
  31. Priem, R.L.; Li, S.; Carr, J.C. Insights and new directions from demand-side approaches to technology innovation, entrepreneurship, and strategic management research. J. Manag. 2012, 38, 346–374. [Google Scholar] [CrossRef]
  32. Marinovic, I.; Skrzypacz, A.; Varas, F. Dynamic Certification and Reputation for Quality. Am. Econ. J. Microecon. 2018, 10, 58–82. [Google Scholar] [CrossRef]
  33. Guerzoni, M.; Raiteri, E. Demand-side vs. supply-side technology policies: Hidden treatment and new empirical evidence on the policy mix. Res. Policy 2015, 44, 726–747. [Google Scholar] [CrossRef]
  34. Markman, G.D.; Gianiodis, P.T.; Phan, P.H. Supply-side innovation and technology commercialization. J. Manag. Stud. 2009, 46, 625–649. [Google Scholar] [CrossRef]
  35. Kalcheva, I.; McLemore, P.; Pant, S. Innovation: The interplay between demand-side shock and supply-side environment. Res. Policy 2018, 47, 440–461. [Google Scholar] [CrossRef]
  36. Shan, C.; Ji, X. Environmental Regulation and Green Technology Innovation: An Analysis of the Government Subsidy Policy’s Role in Driving Corporate Green Transformation. Ind. Eng. Innov. Manag. 2024, 7, 39–46. [Google Scholar]
  37. Barbosa, N.; Faria, A.P.; Eiriz, V. Industry-and firm-specific factors of innovation novelty. Ind. Corp. Change 2014, 23, 865–902. [Google Scholar] [CrossRef]
  38. Kyläheiko, K.; Puumalainen, K.; Pätäri, S.; Jantunen, A. How do firm-and industry-specific factors affect innovation and financial performance? Int. J. Technol. Intell. Plan. 2017, 11, 230–251. [Google Scholar] [CrossRef]
  39. Cui, J.; Zhang, J.; Zheng, Y. Carbon pricing induces innovation: Evidence from China’s regional carbon market pilots. AEA Pap. Proc. 2018, 108, 453–457. [Google Scholar] [CrossRef]
  40. Bel, G.; Joseph, S. Emission abatement: Untangling the impacts of the EU ETS and the economic crisis. Energy Econ. 2015, 49, 531–539. [Google Scholar] [CrossRef]
  41. Hu, Y.; Du, S.; Wang, Y.; Yang, X. How Does Green Insurance Affect Green Innovation? Evidence from China. Sustainability 2023, 15, 12194. [Google Scholar] [CrossRef]
  42. Hu, Y.; Li, R.; Du, L.; Ren, S.; Chevallier, J. Could SO2 and CO2 emissions trading schemes achieve co-benefits of emissions reduction? Energy Policy 2022, 170, 113252. [Google Scholar] [CrossRef]
  43. Albrizio, S.; Kozluk, T.; Zipperer, V. Environmental policies and productivity growth: Evidence across industries and firms. J. Environ. Econ. Manag. 2017, 81, 209–226. [Google Scholar] [CrossRef]
  44. Ambec, S.; Cohen, M.A.; Elgie, S.; Lanoie, P. The Porter Hypothesis at 20: Can Environmental Regulation Enhance Innovation and Competitiveness? Rev. Environ. Econ. Policy 2013, 7, 2–22. [Google Scholar] [CrossRef]
  45. Porter, M.E.; Van der Linde, C. Toward a new conception of the environment-competitiveness relationship. J. Econ. Perspect. 1995, 9, 97–118. [Google Scholar] [CrossRef]
  46. Köhler, J.; Geels, F.W.; Kern, F.; Markard, J.; Onsongo, E.; Wieczorek, A.; Alkemade, F.; Avelino, F.; Bergek, A.; Boons, F. An agenda for sustainability transitions research: State of the art and future directions. Environ. Innov. Soc. Trans. 2019, 31, 1–32. [Google Scholar] [CrossRef]
  47. Geels, F.W.; Kemp, R. Dynamics in socio-technical systems: Typology of change processes and contrasting case studies. Technol. Soc. 2007, 29, 441–455. [Google Scholar] [CrossRef]
  48. Geels, F.W. A socio-technical analysis of low-carbon transitions: Introducing the multi-level perspective into transport studies. J. Transp. Geogr. 2012, 24, 471–482. [Google Scholar] [CrossRef]
  49. Fuenfschilling, L.; Truffer, B. The structuration of socio-technical regimes—Conceptual foundations from institutional theory. Res. Policy 2014, 43, 772–791. [Google Scholar] [CrossRef]
  50. Coenen, L.; Benneworth, P.; Truffer, B. Toward a spatial perspective on sustainability transitions. Res. Policy 2012, 41, 968–979. [Google Scholar] [CrossRef]
  51. Avelino, F.; Wittmayer, J.M.; Pel, B.; Weaver, P.; Dumitru, A.; Haxeltine, A.; Kemp, R.; Jørgensen, M.S.; Bauler, T.; Ruijsink, S.; et al. Transformative social innovation and (dis)empowerment. Technol. Forecast. Soc. Change 2019, 145, 195–206. [Google Scholar] [CrossRef]
  52. Smith, A.; Raven, R. What is protective space? Reconsidering niches in transitions to sustainability. Res. Policy 2012, 41, 1025–1036. [Google Scholar] [CrossRef]
  53. Geels, F.W.; Schot, J. Typology of sociotechnical transition pathways. Res. Policy 2007, 36, 399–417. [Google Scholar] [CrossRef]
  54. Kivimaa, P.; Boon, W.; Hyysalo, S.; Klerkx, L. Towards a typology of intermediaries in sustainability transitions: A systematic review and a research agenda. Res. Policy 2019, 48, 1062–1075. [Google Scholar] [CrossRef]
  55. Markard, J.; Truffer, B. Technological innovation systems and the multi-level perspective: Towards an integrated framework. Res. Policy 2008, 37, 596–615. [Google Scholar] [CrossRef]
  56. Geels, F.W. The multi-level perspective on sustainability transitions: Responses to seven criticisms. Environ. Innov. Soc. Trans. 2011, 1, 24–40. [Google Scholar] [CrossRef]
  57. Rogge, K.S.; Reichardt, K. Policy mixes for sustainability transitions: An extended concept and framework for analysis. Res. Policy 2016, 45, 1620–1635. [Google Scholar] [CrossRef]
  58. Kern, F.; Rogge, K.S.; Howlett, M. Policy mixes for sustainability transitions: New approaches and insights through bridging innovation and policy studies. Res. Policy 2019, 48, 103832. [Google Scholar] [CrossRef]
  59. Geels, F.W. The dynamics of transitions in socio-technical systems: A multi-level analysis of the transition pathway from horse-drawn carriages to automobiles (1860–1930). Technol. Anal. Strateg. Manag. 2005, 17, 445–476. [Google Scholar] [CrossRef]
  60. Peng, B.; Zheng, C.; Wei, G.; Elahi, E. The cultivation mechanism of green technology innovation in manufacturing industry: From the perspective of ecological niche. J. Clean Prod. 2020, 252, 119711. [Google Scholar] [CrossRef]
  61. Turnheim, B.; Geels, F.W. Regime destabilisation as the flipside of energy transitions: Lessons from the history of the British coal industry (1913–1997). Energy Policy 2012, 50, 35–49. [Google Scholar] [CrossRef]
  62. Turnheim, B.; Geels, F.W. The destabilisation of existing regimes: Confronting a multi-dimensional framework with a case study of the British coal industry (1913–1967). Res. Policy 2013, 42, 1749–1767. [Google Scholar] [CrossRef]
  63. Geels, F.W. Multi-level perspective on system innovation: Relevance for industrial transformation. In Understanding Industrial Transformation; Springer: Berlin/Heidelberg, Germany, 2006; pp. 163–186. [Google Scholar]
  64. Geels, F.W. Disruption and low-carbon system transformation: Progress and new challenges in socio-technical transitions research and the Multi-Level Perspective. Energy Res. Soc. Sci. 2018, 37, 224–231. [Google Scholar] [CrossRef]
  65. Kotilainen, K.; Aalto, P.; Valta, J.; Rautiainen, A.; Kojo, M.; Sovacool, B.K. From path dependence to policy mixes for Nordic electric mobility: Lessons for accelerating future transport transitions. Policy Sci. 2019, 52, 573–600. [Google Scholar] [CrossRef]
  66. Fernando, Y.; Jabbour, C.J.C.; Wah, W.-X. Pursuing green growth in technology firms through the connections between environmental innovation and sustainable business performance: Does service capability matter? Resour. Conserv. Recycl. 2019, 141, 8–20. [Google Scholar] [CrossRef]
  67. Lin, S.; Tian, S.; Wu, E. Emerging stars and developed neighbors: The effects of development imbalance and political shocks on mutual fund investments in China. Financ. Manag. 2013, 42, 339–371. [Google Scholar] [CrossRef]
  68. Guo, M.; Kuai, Y.; Liu, X. Stock market response to environmental policies: Evidence from heavily polluting firms in China. Econ. Model. 2020, 86, 306–316. [Google Scholar] [CrossRef]
  69. Yang, W.; Lai, P.; Han, Z.; Tang, Z. Do government policies drive institutional preferences on green investment? Evidence from China. Environ. Sci. Pollut. Res. Int. 2022, 30, 8297–8316. [Google Scholar] [CrossRef] [PubMed]
  70. Basse, M.; Hou, D.; Mandaroux, R. Do investors care about carbon emissions under the European Environmental Policy? Bus. Strategy Environ. 2021, 31, 268–283. [Google Scholar] [CrossRef]
  71. Hodson, M.; Marvin, S.; Bulkeley, H. The intermediary organisation of low carbon cities: A comparative analysis of transitions in Greater London and Greater Manchester. Urban Stud. 2013, 50, 1403–1422. [Google Scholar] [CrossRef]
  72. Geddes, A.; Schmidt, T.S. Integrating finance into the multi-level perspective: Technology niche-finance regime interactions and financial policy interventions. Res. Policy 2020, 49, 103985. [Google Scholar] [CrossRef]
  73. Dosi, G. Finance, innovation and industrial change. J. Econ. Behav. Organ. 1990, 13, 299–319. [Google Scholar] [CrossRef]
  74. Yang, D.; Jiang, W.; Zhao, W. Proactive environmental strategy, innovation capability, and stakeholder integration capability: A mediation analysis. Bus. Strategy Environ. 2019, 28, 1534–1547. [Google Scholar] [CrossRef]
  75. Zhang, B.; Wang, Z.; Lai, K.-H. Mediating effect of managers’ environmental concern: Bridge between external pressures and firms’ practices of energy conservation in China. J. Environ. Psychol. 2015, 43, 203–215. [Google Scholar] [CrossRef]
  76. Xue, D.; Ding, Y.; Yu, L.; Deng, X. The Impact of Green Institutional Pressure from Local Governments on Corporate Innovation: An Empirical Evidence from Foreign-Invested Enterprises in China. Sustainability 2023, 15, 11678. [Google Scholar] [CrossRef]
  77. Ma, Y.; Wang, J.; Lv, X. Institutional pressures and firms’ environmental management behavior: The moderating role of slack resources. J. Environ. Plan. Manag. 2023, 66, 2513–2535. [Google Scholar] [CrossRef]
  78. He, Z.; Wang, D.; Li, J.; Fang, W.; Yang, Y.; Ji, M. An Evolutionary Stability Study of Zero-Carbon Transition for Shipping Enterprises Considering Dynamic Penalty and Carbon Quota Trading Mechanisms. Sustainability 2024, 16, 10684. [Google Scholar] [CrossRef]
  79. Lu, H.; Cheng, Z.; Yao, Z.; Xue, A. Impacts of pilot carbon emission trading policies on urban environmental pollution: Evidence from China. J. Environ. Manag. 2024, 359, 121016. [Google Scholar] [CrossRef] [PubMed]
  80. Zhang, P.; Yue, J.; Cheng, H. The impact mechanism of the ETS on CO2 emissions from the service sector: Evidence from Beijing and Shanghai. Technol. Forecast. Soc. Change 2021, 173, 121114. [Google Scholar] [CrossRef]
  81. Ren, S.; Cheng, Y.; Hu, Y.; Yin, C. Feeling right at home: Hometown CEOs and firm innovation. J. Corp. Financ. 2021, 66, 101815. [Google Scholar] [CrossRef]
  82. Gao, C.; Li, X.; Hou, J. Does Carbon Emission Trading Affect China’s Green Innovation? An Exploration from the Perspective of the Enterprise Lifecycle. Sustainability 2024, 16, 10242. [Google Scholar] [CrossRef]
  83. Li, D.; Huang, M.; Ren, S.; Chen, X.; Ning, L. Environmental legitimacy, green innovation, and corporate carbon disclosure: Evidence from CDP China 100. J. Bus. Ethics 2018, 150, 1089–1104. [Google Scholar] [CrossRef]
  84. Chang, X.; Fu, K.; Low, A.; Zhang, W. Non-executive employee stock options and corporate innovation. J. Financ. Econ. 2015, 115, 168–188. [Google Scholar] [CrossRef]
  85. Lin, K.Z.; Mills, L.F.; Zhang, F.; Li, Y. Do political connections weaken tax enforcement effectiveness? Contemp. Account. Res. 2018, 35, 1941–1972. [Google Scholar] [CrossRef]
  86. He, F.; Yan, Y.; Hao, J.; Wu, J.G. Retail investor attention and corporate green innovation: Evidence from China. Energy Econ. 2022, 115, 106308. [Google Scholar] [CrossRef]
  87. Heckman, J.J.; Ichimura, H.; Todd, P.E. Matching as an econometric evaluation estimator: Evidence from evaluating a job training programme. Rev. Econ. Stud. 1997, 64, 605–654. [Google Scholar] [CrossRef]
  88. Cai, X.; Lu, Y.; Wu, M.; Yu, L. Does environmental regulation drive away inbound foreign direct investment? Evidence from a quasi-natural experiment in China. J. Dev. Econ. 2016, 123, 73–85. [Google Scholar] [CrossRef]
Figure 1. Multi-level perspective on transitions.
Sustainability 17 01927 g001
Figure 2. The process of method research.
Sustainability 17 01927 g002
Figure 3. Annual average of Gre_Patlog.
Sustainability 17 01927 g003
Table 1. Review of the current status of CET’s impact on green innovation.
ResultsMechanismsSynergistic Effect
PositiveEconomic Legitimacy
Environmental Legitimacy
InvestorFinancial
Institution
Competitor
Liu and Li (2022) [13]
Sun et al. (2024) [14]
Loorbach et al. (2017) [16]
Geels (2020) [24]
Yang et al. (2022) [69]
Basse et al. (2021) [70]
Lu et al. (2024) [79]
Zhang et al. (2021) [80]
Note: ✓ indicates that the study supports or includes the corresponding category.
Table 2. Results of panel unit root tests.
VariableLevin–Lin–Chu TestResults
(1)(2)
Gre_PATlog−24.706 ***stationary
CET−34.757 ***stationary
Asset−170.000 ***stationary
Age−72.507 ***stationary
Lev−51.136 ***stationary
Revenue−35.987 ***stationary
Cash−89.117 ***stationary
R&D−46.352 ***stationary
Top_Holding−80.292 ***stationary
State−63.956 ***stationary
Note: *** significant at 1%.
Table 3. Descriptive statistics.
VariableMeanSDMinMidMax
Gre_PATlog0.5880.9930.0000.0007.118
Gre_Inv_Patlog0.2920.7050.0000.0006.923
Gre_Uti_Patlog0.4400.8580.0000.0005.881
CET0.3340.4720.0000.0001.000
Asset22.1771.47412.31421.97928.520
Age16.1475.4652.00016.00043.000
Lev0.64311.1490.0070.497877.256
Revenue21.5971.61911.45621.46028.693
Cash5.8341.6370.0005.83611.732
R&D10.6048.5860.00016.13223.770
Top_Holding37.24916.0120.28635.60589.986
State11.32620.4280.0000.00097.122
Note: the table reports the descriptive statistics of variables used in this study from 2006 to 2018.
Table 4. Parallel trend test.
VariablesGre_PatlogGre_Patlog
(1)(2)
CET × Trend × Pre20130.008−0.006
(0.020)(0.020)
Controls Y
Firm fixed effectsYY
Year fixed effectsYY
Constant0.789 ***−4.874 ***
(0.070)(0.873)
Observations64186418
R-squared0.6880.699
Robust t-statistics in parentheses; *** p < 0.01.
Table 5. Impacts of CET on green innovation.
VariablesGre_PatlogGre_PatGre_PatlogGre_Pat
(1)(2)(3)(4)
CET × Post0.225 ***5.557 ***0.212 ***5.689 ***
(0.037)(1.795)(0.037)(1.792)
Controls YY
Firm fixed effectsYYYY
Year fixed effectsYYYY
Constant0.153 ***1.026−5.062 ***−33.988 ***
(0.031)(1.456)(0.381)(10.002)
Observations6418641864186418
R-squared0.6870.7680.7010.770
Robust t-statistics in parentheses; *** p < 0.01.
Table 6. PSM-DID estimates of the impact of CET on green innovation.
VariablesGre_PatlogGre_Pat
(1)(2)
CET × Post0.107 **1.256 **
(2.486)(2.231)
ControlsYY
Firm fixed effectsYY
Year fixed effectsYY
Constant−4.447 ***−25.651 ***
(−11.481)(−5.014)
Observations55875587
R-squared0.6240.430
Robust t-statistics in parentheses; *** p < 0.01, ** p < 0.05.
Table 7. DDD estimates of the impact of CET on green innovation.
VariablesGre_PatlogGre_Pat
(1)(2)
CET × Post × Ind0.107 **−3.420
(2.115)(−1.476)
ControlsYY
Firm fixed effectsYY
Year fixed effectsYY
Constant−6.011 ***−58.183 ***
(−25.272)(−9.958)
Observations21,63821,638
R-squared0.7200.758
Robust t-statistics in parentheses; *** p < 0.01, ** p < 0.05.
Table 8. The results of other robustness tests.
Panel A: Alternative Measurements
VARIABLESGre_Inv_PatlogGre_Uti_Patlog
(1)(2)
ETS × Post0.069 ***0.200 ***
(0.026)(0.035)
ControlsYY
Firm fixed effectsYY
Year fixed effectsYY
Constant−2.345 ***−4.021 ***
(0.261)(0.360)
Observations64186418
R-squared0.7010.664
Panel B: Alternative Models
VARIABLESGre_PatlogGre_Pat
(1)(2)
L.ETS × Post0.194 ***3.519 *
(0.039)(1.841)
ControlsYY
Firm fixed effectsYY
Year fixed effectsYY
Constant−4.423 ***−20.356
(0.398)(13.250)
Observations64186418
R-squared0.7060.779
Robust t-statistics in parentheses; *** p < 0.01, * p < 0.1.
Table 9. Mechanisms of economic legitimacy.
VariablesEco_LegInvestEco_LegFee
(1)(2)
CET × Post1.701 ***0.826 ***
(0.277)(0.247)
ControlsYY
Firm fixed effectsYY
Year fixed effectsYY
Industry year trendYY
Province year trendYY
Constant−11.483 ***−23.442 ***
(2.849)(2.820)
Observations64136418
R-squared0.5020.706
Robust t-statistics in parentheses; *** p < 0.01.
Table 10. Mechanisms of environmental legitimacy.
VariablesEnv_LegCSREnv_LegJ-F
(1)(2)
CET × Post2.607 ***−0.043 **
(0.388)(0.019)
ControlsYY
Firm fixed effectsYY
Year fixed effectsYY
Constant42.920 ***−0.406 *
(3.720)(0.226)
Observations64186418
R-squared0.5390.283
Robust t-statistics in parentheses; *** p < 0.01, ** p < 0.05, * p < 0.1.
Table 11. Synergistic impact analysis of CET and market participants.
VariablesGre_PatlogGre_PatlogGre_Patlog
(1)(2)(3)
CET × Post × Inv0.006 ***
(0.001)
CET × Post × Fin 0.159 ***
(0.043)
CET × Post × HHI 0.309 ***
(0.069)
ControlsYYY
Firm fixed effectsYYY
Year fixed effectsYYY
Constant−4.776 ***−4.947 ***−2.089 ***
(0.378)(0.385)(0.247)
Observations640764186418
R-squared0.7030.7020.858
Robust t-statistics in parentheses; *** p < 0.01.
Table 12. Consistency analysis of CET and market participants.
VariablesEnv_LegCSREco_LegInvest
(1)(2)(3)(4)(5)(6)
CET × Post × Inv0.021 ** 0.081 ***
(0.010) (0.013)
CET × Post × Fin 0.939 *** 0.677 **
(0.344) (0.326)
CET × Post × HHI 1.239 * 5.103 ***
(0.633) (0.777)
Inv0.006 −0.013
(0.717) (−1.311)
Fin 0.001 * −0.001
(1.816) (−0.046)
HHI −0.407 −1.220 ***
(−1.301) (−2.824)
ETS × Post0.5151.018 ***1.312 ***−1.771 **2.168 ***1.141 ***
(0.565)(0.320)(0.311)(0.756)(0.465)(0.404)
ControlsYYYYYY
Firm fixed effectsYYYYYY
Year fixed effectsYYYYYY
Constant−10.132 ***−10.145 ***−10.891 ***45.752 ***43.622 ***43.938 ***
(2.865)(2.807)(2.845)(3.747)(3.610)(3.587)
Observations640264136413479848074807
R-squared0.5020.5020.5020.5450.5390.546
Robust t-statistics in parentheses; *** p < 0.01, ** p < 0.05, * p < 0.1.
Table 13. Intensity analysis of CET and market participants.
VariablesGre_PatlogGre_PatlogGre_Patlog
(1)(2)(3)
CET × Post × Inv × Price0.000
(1.132)
CET × Post × Fin × Price 0.007 ***
(4.244)
CET × Post × HHI × Price 0.007 **
(2.447)
ETS × Post × Inv0.005 ***
(2.945)
ETS × Post × Fin 0.067
(1.560)
ETS × Post × HHI 0.155 **
(2.089)
ControlsYYY
Firm fixed effectsYYY
Year fixed effectsYYY
Constant−4.882 ***−4.952 ***−2.064 ***
(−12.475)(−12.908)(−8.070)
Observations592864185937
R-squared0.7130.7040.864
Robust t-statistics in parentheses; *** p < 0.01, ** p < 0.05.
Disclaimer/Publisher’s Note: The statements, opinions and data contained in all publications are solely those of the individual author(s) and contributor(s) and not of MDPI and/or the editor(s). MDPI and/or the editor(s) disclaim responsibility for any injury to people or property resulting from any ideas, methods, instructions or products referred to in the content.

