1. Introduction
The construction industry and, moreover, the production of concrete—which, globally, is the most used material after water—requires different raw materials and implies various potential environmental impacts [
1,
2,
3,
4]. Considering that cement, one of the primary components of concrete, has a highly carbon-intensive production process contributing up to 8% of total global CO
2 emissions [
2], concrete is considered a highly carbon-intensive product as well. Furthermore, concrete production itself has potential environmental impact. Although concrete has a relatively short production chain, the processes vary even within the same geographical region [
4]. It is necessary to understand them in detail to identify hotspots and processes with the potential for environmental performance improvements.
In Panama, the construction industry accounted for approximately 17% of the GDP in 2023, significantly surpassing the regional average of around 6% [
5]. This highlights the sector’s critical role in supporting the country’s economy, driven by the growing demand for infrastructure to meet the needs of a growing population. Panama’s cement consumption per capita (283 kg) surpasses the Latin American and Caribbean average (275 kg), reflecting robust construction activity [
6]. This suggests notable infrastructure and urban development driven by increased concrete production. The high consumption highlights Panama’s growing construction sector, positioning it as a key player in regional development while emphasizing the need for sustainable practices to mitigate potential environmental impacts. It is crucial to consider the broader implications of this activity.
Panama’s sustainable development initiatives include the National Water Security Plan 2015–2050 [
7] and the National Energy Plan 2015–2050 [
8]. The “Reduce tu Huella” (Reduce your Footprint) program, which is based on the Greenhouse Gas Protocol [
9], the 2006 IPCC Guidelines for National Greenhouse Gas Inventories [
10], the Water Footprint Network [
11], and life cycle assessment international standards [
12,
13,
14,
15,
16], supports public and private organizations in managing water and carbon footprints, aligning with national climate action. These efforts reflect global agendas such as the 2030 Agenda and Sustainable Development Goals [
17] and other international initiatives [
18], addressing resource efficiency and material footprints. As a major global and local industry, concrete production requires improved processes to minimize environmental impacts.
Concrete production is often discussed as a generic process, both in scientific literature and in technical documents, where flow diagrams and production processes are presented as being standardized across facilities. However, this generalization fails to account for the substantial variability that exists between individual concrete plants. These variations arise due to multiple factors, such as plant type, local conditions, and access to resources. Even within the same company, concrete plants may operate under different conditions, influencing their environmental performance. Many global and region-specific studies have demonstrated that different technological routes might imply variability in the environmental impacts of cement-based products.
For instance, Oliveira et al. [
19] present variability in the life cycle of concrete block CO
2 emissions and cumulative energy demand in Brazil; Silva et al. [
4] present variability of the environmental impact of ready-mix concrete for Brazil; Wałach [
20] studies the factors affecting the environmental impact of concrete structures, including the technological processes. Mack-Vergara et al. [
21] and Miller et al. [
3] focused their studies on the water-related environmental impacts of concrete production and their variability due to different technological routes. Furthermore, a study on water consumption for concrete production in Panama was recently conducted, where the specific water consumption per cubic meter of concrete was estimated for 11 concrete plants during 2022 [
22]. These studies demonstrate the need to characterize concrete production and other cement-based products from an environmental perspective and the need for primary data.
In the case of water-related impacts, this is even more important since these impacts are sensitive to local conditions [
23]. Furthermore, water-related environmental impacts have been less studied than energy and CO
2-related impacts [
3]. Since water-related environmental impacts are increasing in many regions of the world [
24], these impacts must be considered as well. Controversies exist regarding the most effective methods to mitigate these impacts, with differing opinions on practices such as water recycling and the use of alternative energy sources.
While previous studies have explored the environmental impacts of concrete production, including variability in energy and CO2 emissions, few have focused on the characteristics of the technological routes for concrete production, which are one of the main sources of variability in environmental performance. This study fills a critical gap by providing the primary data of the concrete production process collected from 20 concrete plants in Panama, offering an in-depth analysis of water, energy, and CO2 flows, areas that are often under-represented in environmental assessments.
The aim of this study is to compare the technological routes of concrete production in Panama from an environmental perspective, including water, energy, and CO2 flows per process, to identify opportunities for improvement. By examining qualitative environmental indicators such as water, energy, and CO2 flows, this study identifies the key similarities and differences among production plants. These findings not only provide a more nuanced understanding of the industry but also lay the groundwork for the future development of a comprehensive environmental database that could help establish appropriate consumption and emissions benchmarks tailored to specific types of concrete plants.
2. Methodology
This study began by engaging with the industry to gather primary data on concrete production in Panama (
Figure 1). Technical visits to 20 concrete production plants belonging to a total of 5 different companies were carried out. All plants included in this study produce ready-mix concrete. A gate-to-gate system boundary was used in this study following a life cycle assessment approach, including dosage, concrete mixing, truck washing, yard washing, dust control, facilities, and transportation [
12,
13].
The 20 concrete plants represent more than 60% of the national concrete production in 2022, according to the statistics published by the National Institute of Statistics and Census (INEC) [
25]. The technical visits included concrete plants located in Panama City as well as in the countryside, representing a range of locations and production scales nationwide in Panama (
Figure 2). All concrete plants are located in populated regions (townships with more than 1500 inhabitants).
Technical visits were conducted to identify the plants’ processes, environmental flows, and environmental applications. These visits included all the activities carried out within the concrete production plant. The tour was guided by the plant manager and/or the sustainability personnel. The plant manager provided technical insights and general information about the plant’s operations, and the sustainability staff provided specific information on the environmental indicators. For specific processes that directly impacted sustainability technological routes, it was possible to talk with those directly in charge of the process. Qualitative variables were used to describe and compare the water, energy, and CO2 flows per process within each concrete plant. This information was gathered through a pre-structured technical survey created in Microsoft Forms.
To validate the layout of the plants and to accurately identify the processes, Google Earth images and drone aerial images were used to confirm the physical space of each plant and the water, energy, and CO2 flows. These images, along with the data collected during the visits, were critical for creating detailed flowcharts for each concrete production plant. By using the internal data obtained from the technical visits and technical surveys, a comprehensive database of processes and the associated water, energy, and CO2 flows for each of the 20 concrete plants was created. This database served as the foundation for further analysis, particularly focusing on identifying best practices and areas for potential environmental improvement.
The flowcharts mapped the inputs and outputs of water, energy, and CO2 at each stage of the concrete production process, including dosage, concrete mixing, truck washing, yard washing, dust control, facilities, and transportation.
With the database in place, the next step involved conducting statistical analysis to compare water and energy usage across the different plants. Due to the binary and qualitative nature of the data, a hierarchical clustering analysis was perfomed using the Dice similarity index to better detect patterns in the technological routes of the plants. This binary structure made the Dice index particularly suitable, as it effectively measures the degree of overlap between datasets where the presence or absence of characteristics is the primary focus. The Dice index places emphasis on shared characteristics, which is crucial in this study to identify common practices between the plants [
27]. This analysis produces an index showing the similarity of the plants (from 0 to 1, where 1 represents plants that are identical). This is showcased through dendrograms that branch out into the groups detected, determined by the number of branches with a 0.75 index of similarity. The result of the analysis is shown through dendrograms which cluster the plants by the similarity inferred by the Dice index [
28]. This approach allows patterns and similarities in water and energy management to be identified, highlighting priority areas for sustainability improvements. All of the analyses were performed in RStudio (2024.04.2 Build 764) [
29].
By employing this method, it is easier to visualize clusters of plants that exhibit similar behaviors in terms of water recycling, energy consumption, and process efficiency. These clusters allow for the identification of best practices and potential areas for improvement, especially in terms of reducing environmental footprints. The resulting dendrograms, thus, provide an important tool for understanding the diversity of production methods and their environmental impact within the same industrial sector. The insights gained through the hierarchical clustering analysis provide a foundation for further analysis of environmental efficiency in concrete production using a bigger database.
This study does not quantify resource usage and emissions of concrete production because the available quantitative data in Panama are limited and not disaggregated as flows per specific process. Technical visits confirmed this gap, making detailed process-level quantification beyond the study’s scope. Instead, the study focuses on qualitative analysis, providing critical guidance for companies to identify internal measurement needs and encouraging more detailed data collection efforts in the future.
3. Results
During the technical visits, notable differences were observed between concrete production plants due to the technologies they employ. Variations were also found within plants belonging to the same company, largely dependent on the availability of resources based on their geographic location. For example, plants in rural areas experienced more frequent issues with water and electricity supply.
Primary data on water consumption, energy use, and CO
2 emissions in concrete production were collected from all 20 plants visited.
Table 1 presents the inflows and outflows for the water consumption indicator for the 20 production plants visited, and
Table 2 presents the inflow and output flows for the energy and CO
2 emissions indicators for the 20 production plants visited. These tables present the qualitative data collected to elaborate the flowcharts and to facilitate the clustering analysis and similarity dendrograms. CO
2 emissions were not directly measured, as plant managers explained that these could be estimated based on energy consumption. Most concrete plants include administrative offices, a laboratory for fresh concrete testing, vehicle maintenance areas, and storage for cement, additives, aggregates (both fine and coarse), water, and fuel tanks. They also have concrete trucks (mixers) and other heavy equipment, as well as designated areas for truck and yard washing and dust control. In Panama, wind direction varies across provinces but is predominantly influenced by trade winds, especially during the dry season from December to April [
30]. These winds often blow from northeast to southwest [
31], aiding the dispersion of solid particles such as sand and cement. This seasonal wind pattern can carry dust over long distances, potentially impacting air quality and surrounding communities. Therefore, effective dust control measures, such as covering storage areas and using water sprays, are essential to minimize environmental and health potential impacts.
In terms of aggregate storage, many plants maintain moisture by using water sprinklers. In some cases, aggregates are stored indoors, under a roof, or partially enclosed by walls or screens. These practices, along with the use of ice (cubed or flaked) and cooling systems (chillers) for mixing water, help regulate the temperature of the aggregates, which is crucial for controlling the temperature of the concrete mix. These measures are particularly necessary due to Panama’s ambient temperature, which ranges from 20.8 °C to 33.9 °C, requiring tailored strategies for temperature management [
32].
The concrete plants use multiple water sources, including potable water from public supply networks, groundwater from private wells, river water transported by tanker trucks, harvested rainwater, and ice (purchased or produced on-site). Some plants recycle water from sedimentation basins for different tasks. Water outflows are managed in various ways: some water evaporates on-site, and other portions are channeled into stormwater drains or discharged into nearby land or waterbodies after basic treatment. Sanitary sewage is typically directed to the municipal sewage systems or to closed septic tanks.
Energy is supplied through grid connections and portable diesel-powered generators, which are essential in plants with frequent power outages. The energy powers the production equipment, cooling systems, laboratories, automobile repair garages, and offices. Two plants adopt technology for captured CO
2 injection into fresh concrete [
33], which introduces CO
2 into the mix, requiring CO
2 storage and supply systems. In general, direct CO
2 emissions from plants result from fossil fuel use in generators and mixers, and indirect emissions are linked to electricity consumption (for instance, the electricity use in the office, laboratory, and other facilities), following the Greenhouse Gas Protocol scopes 1 and 2, respectively [
9].
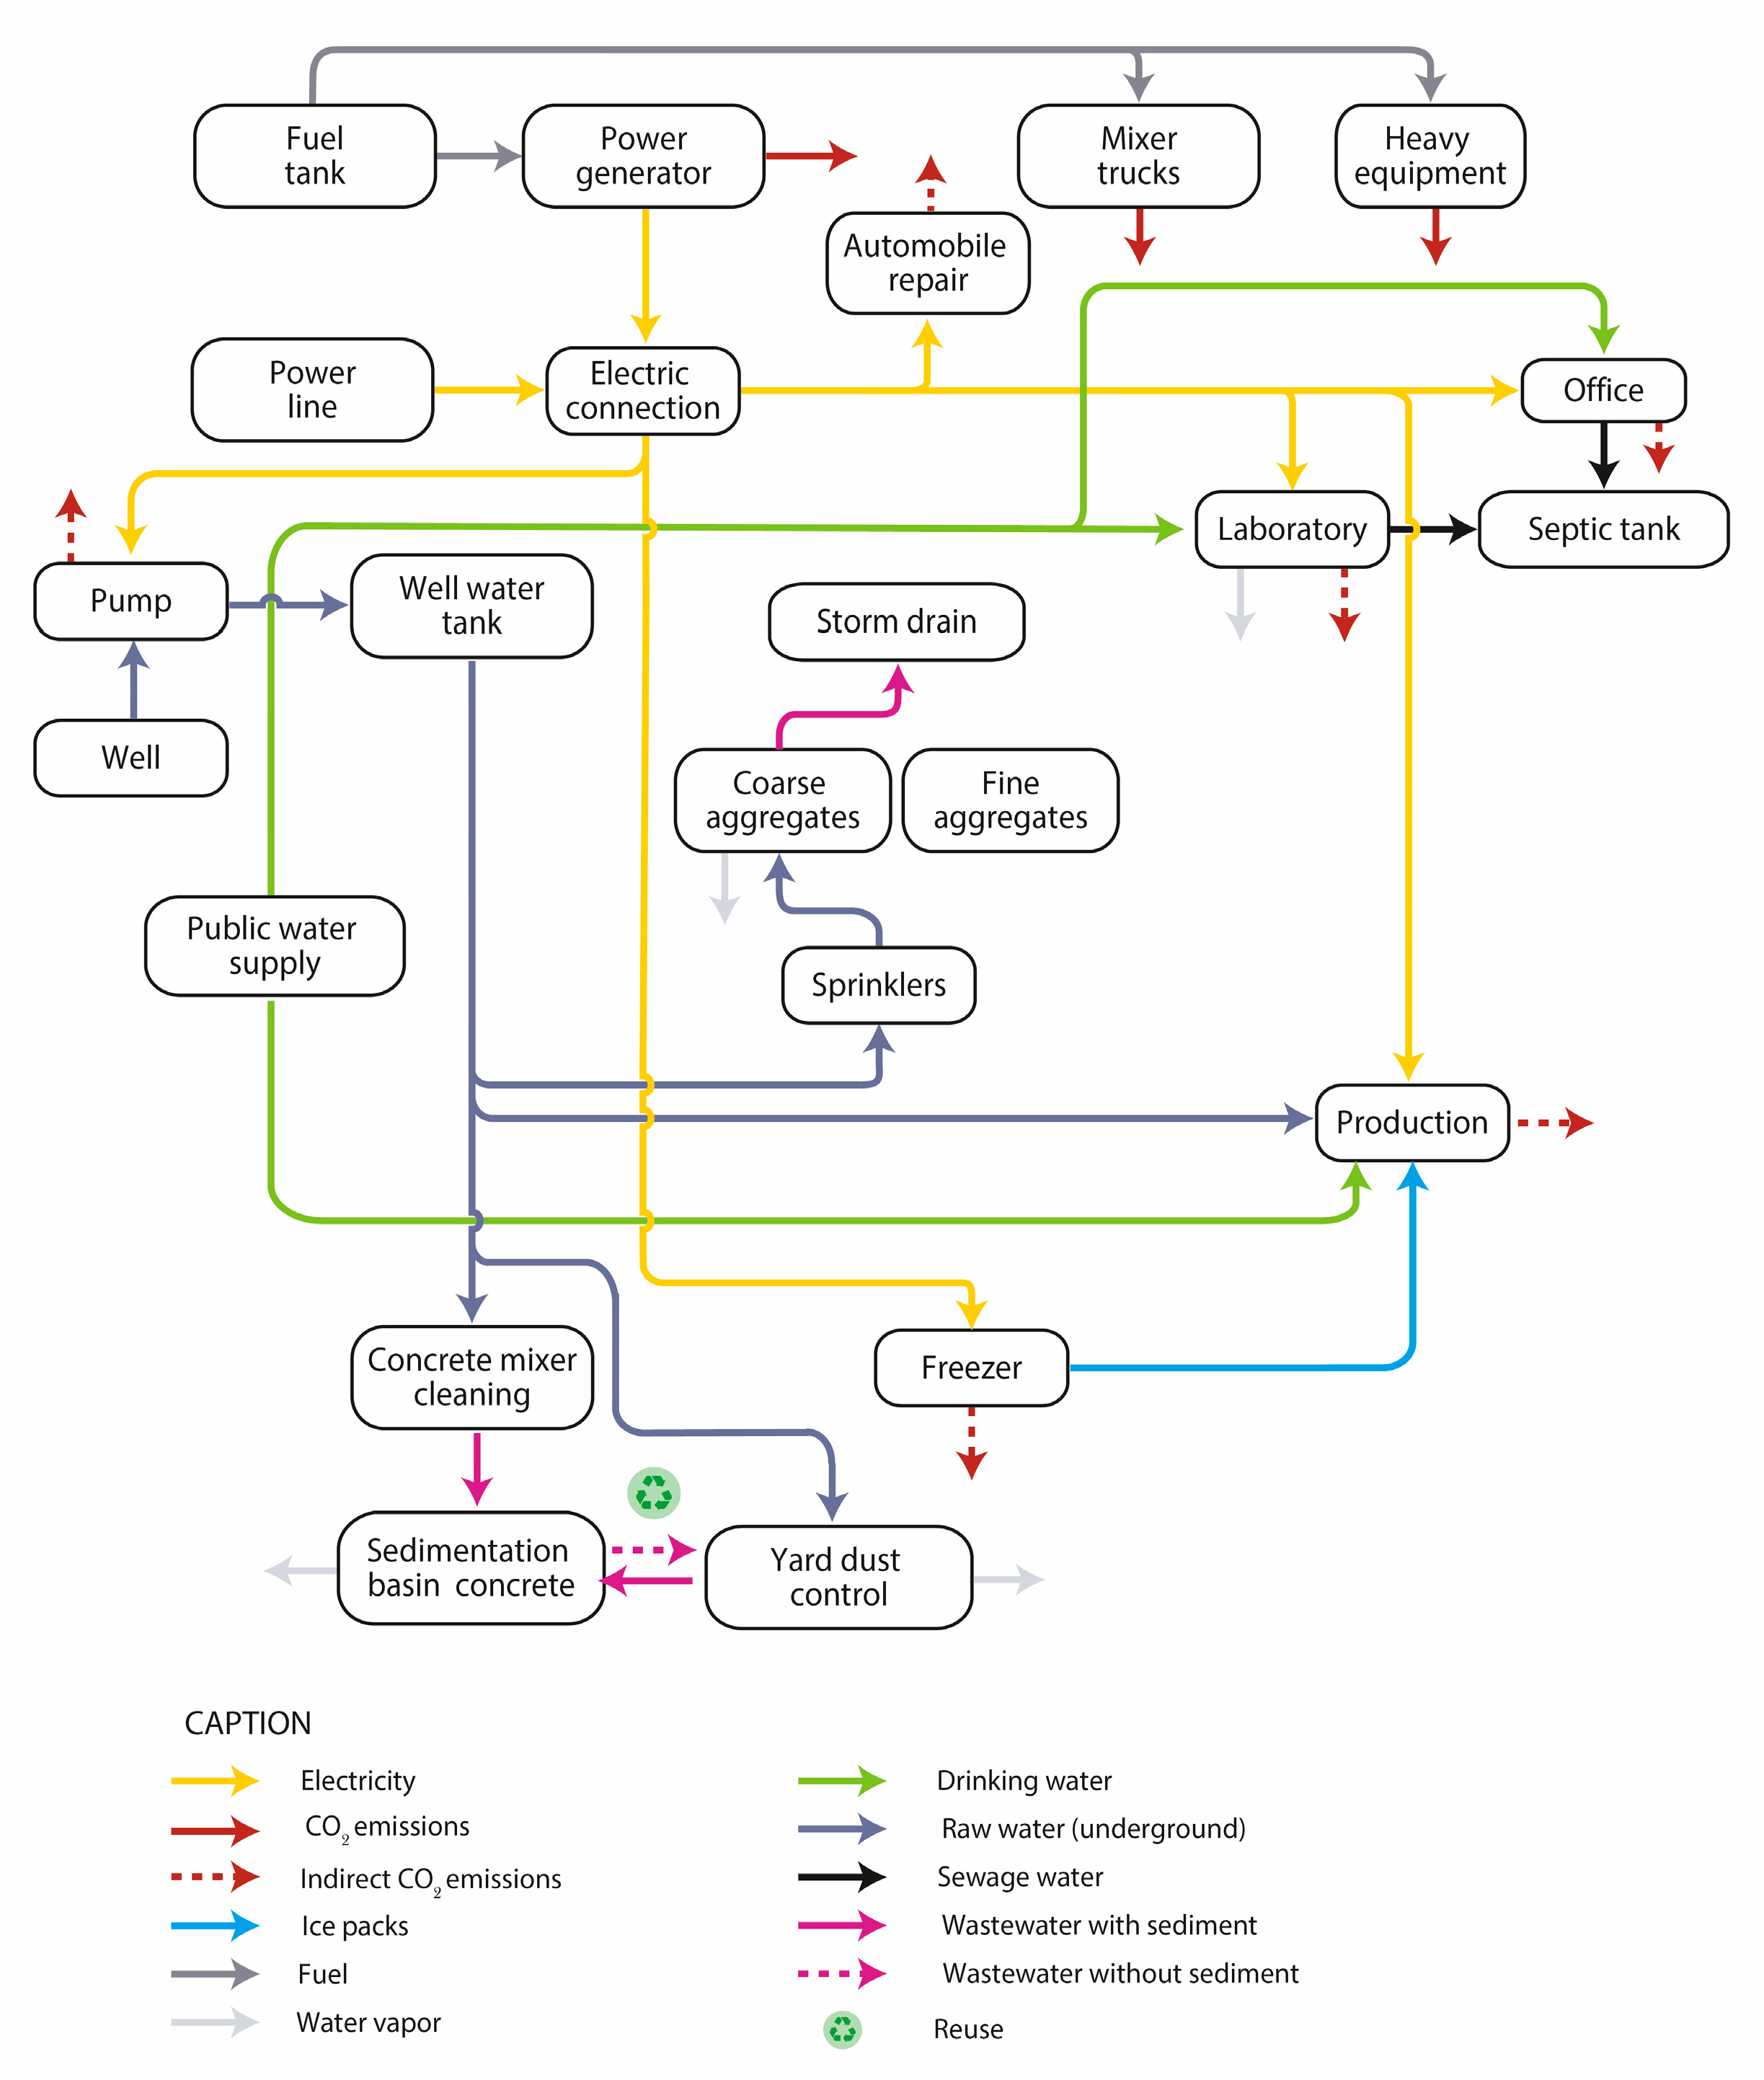
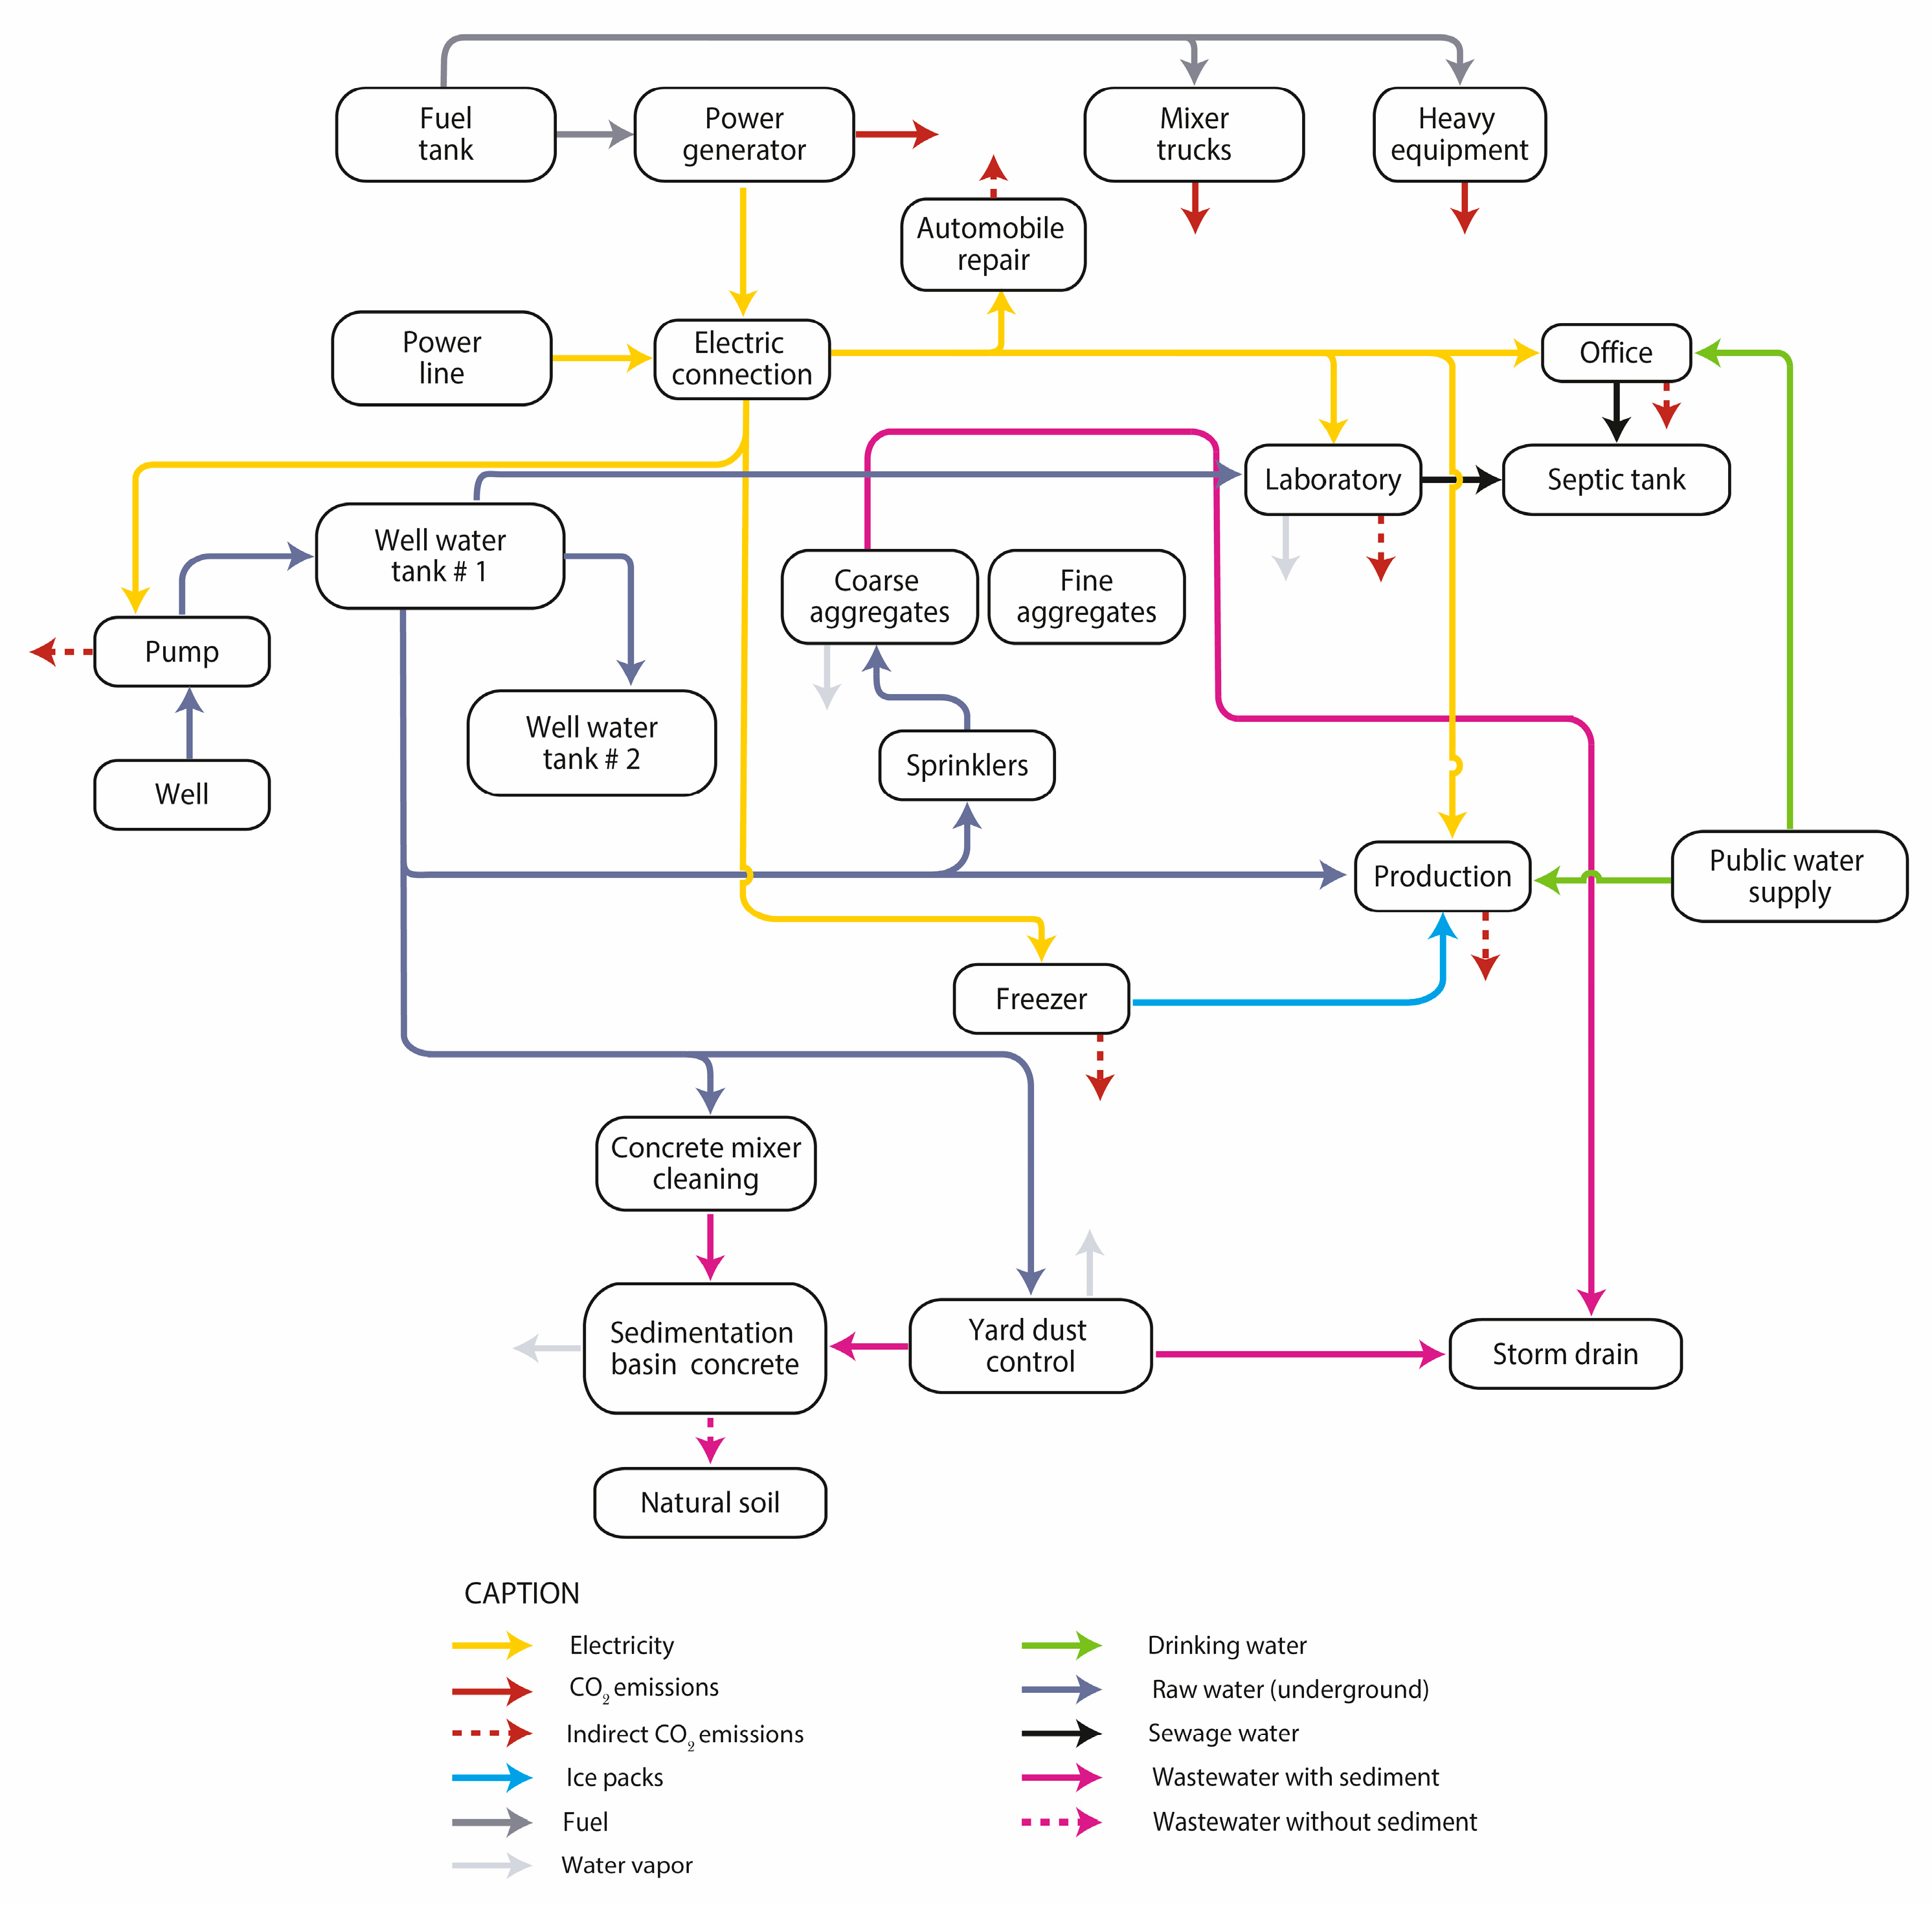
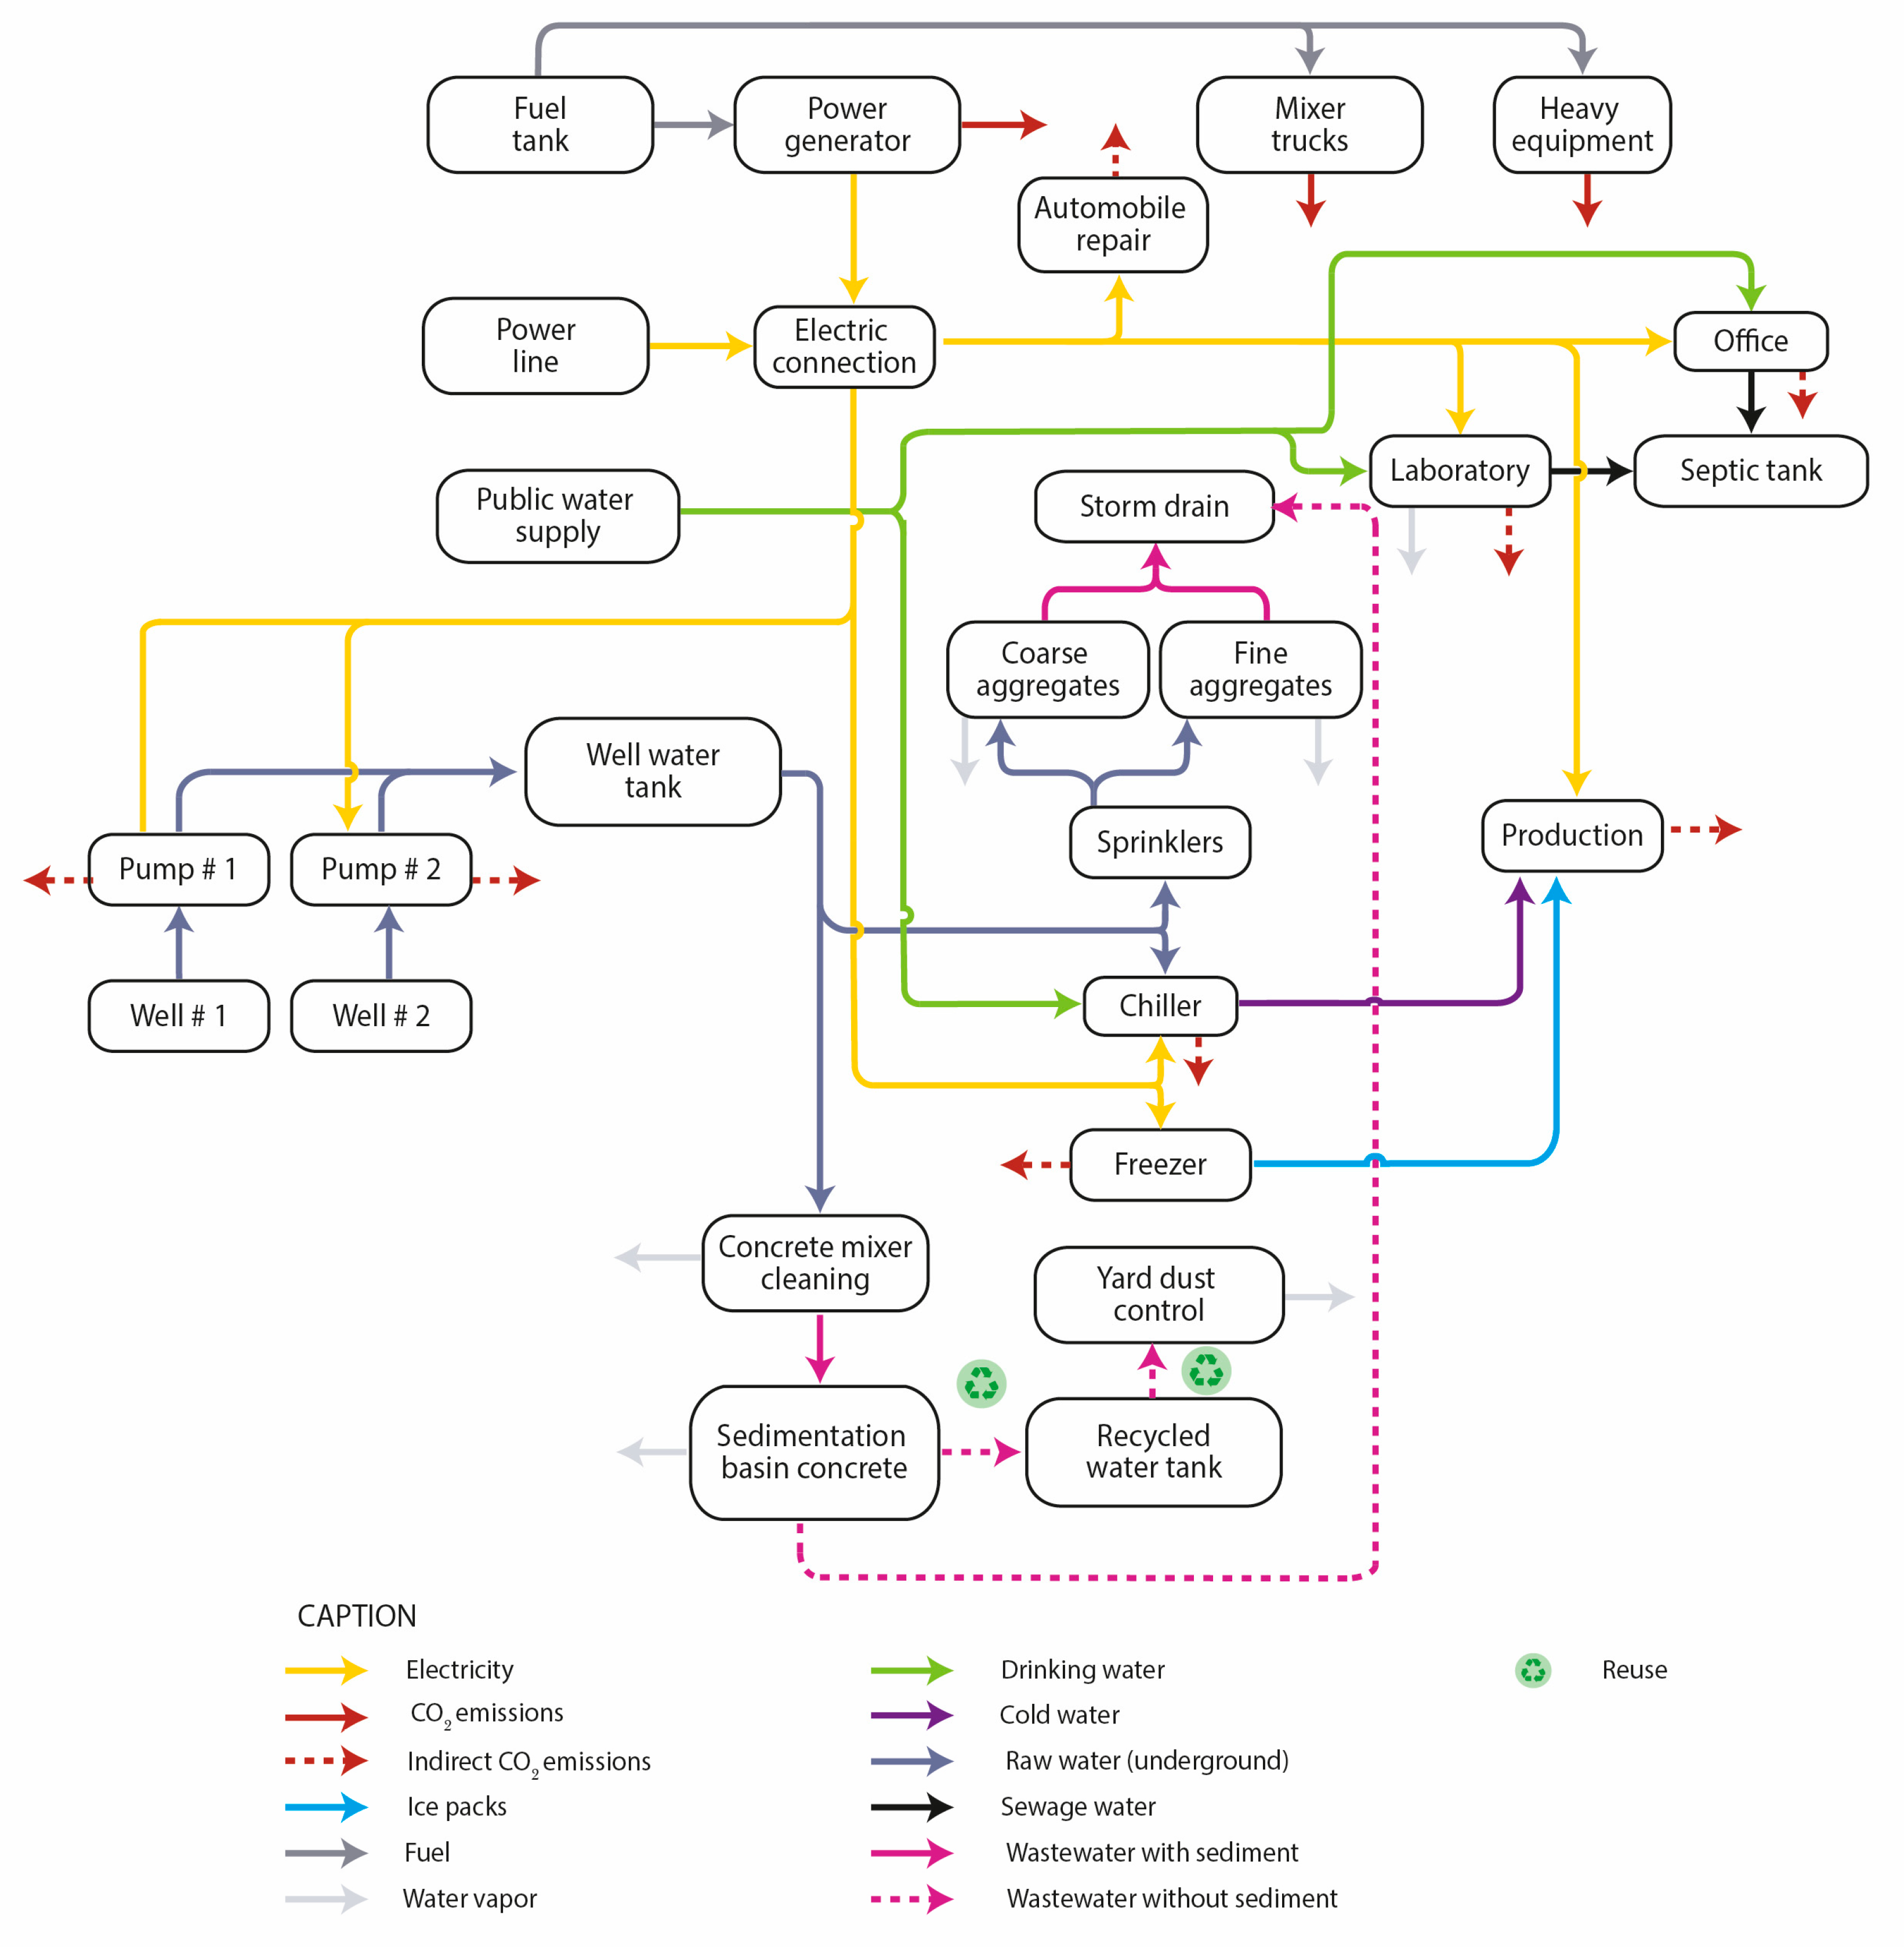
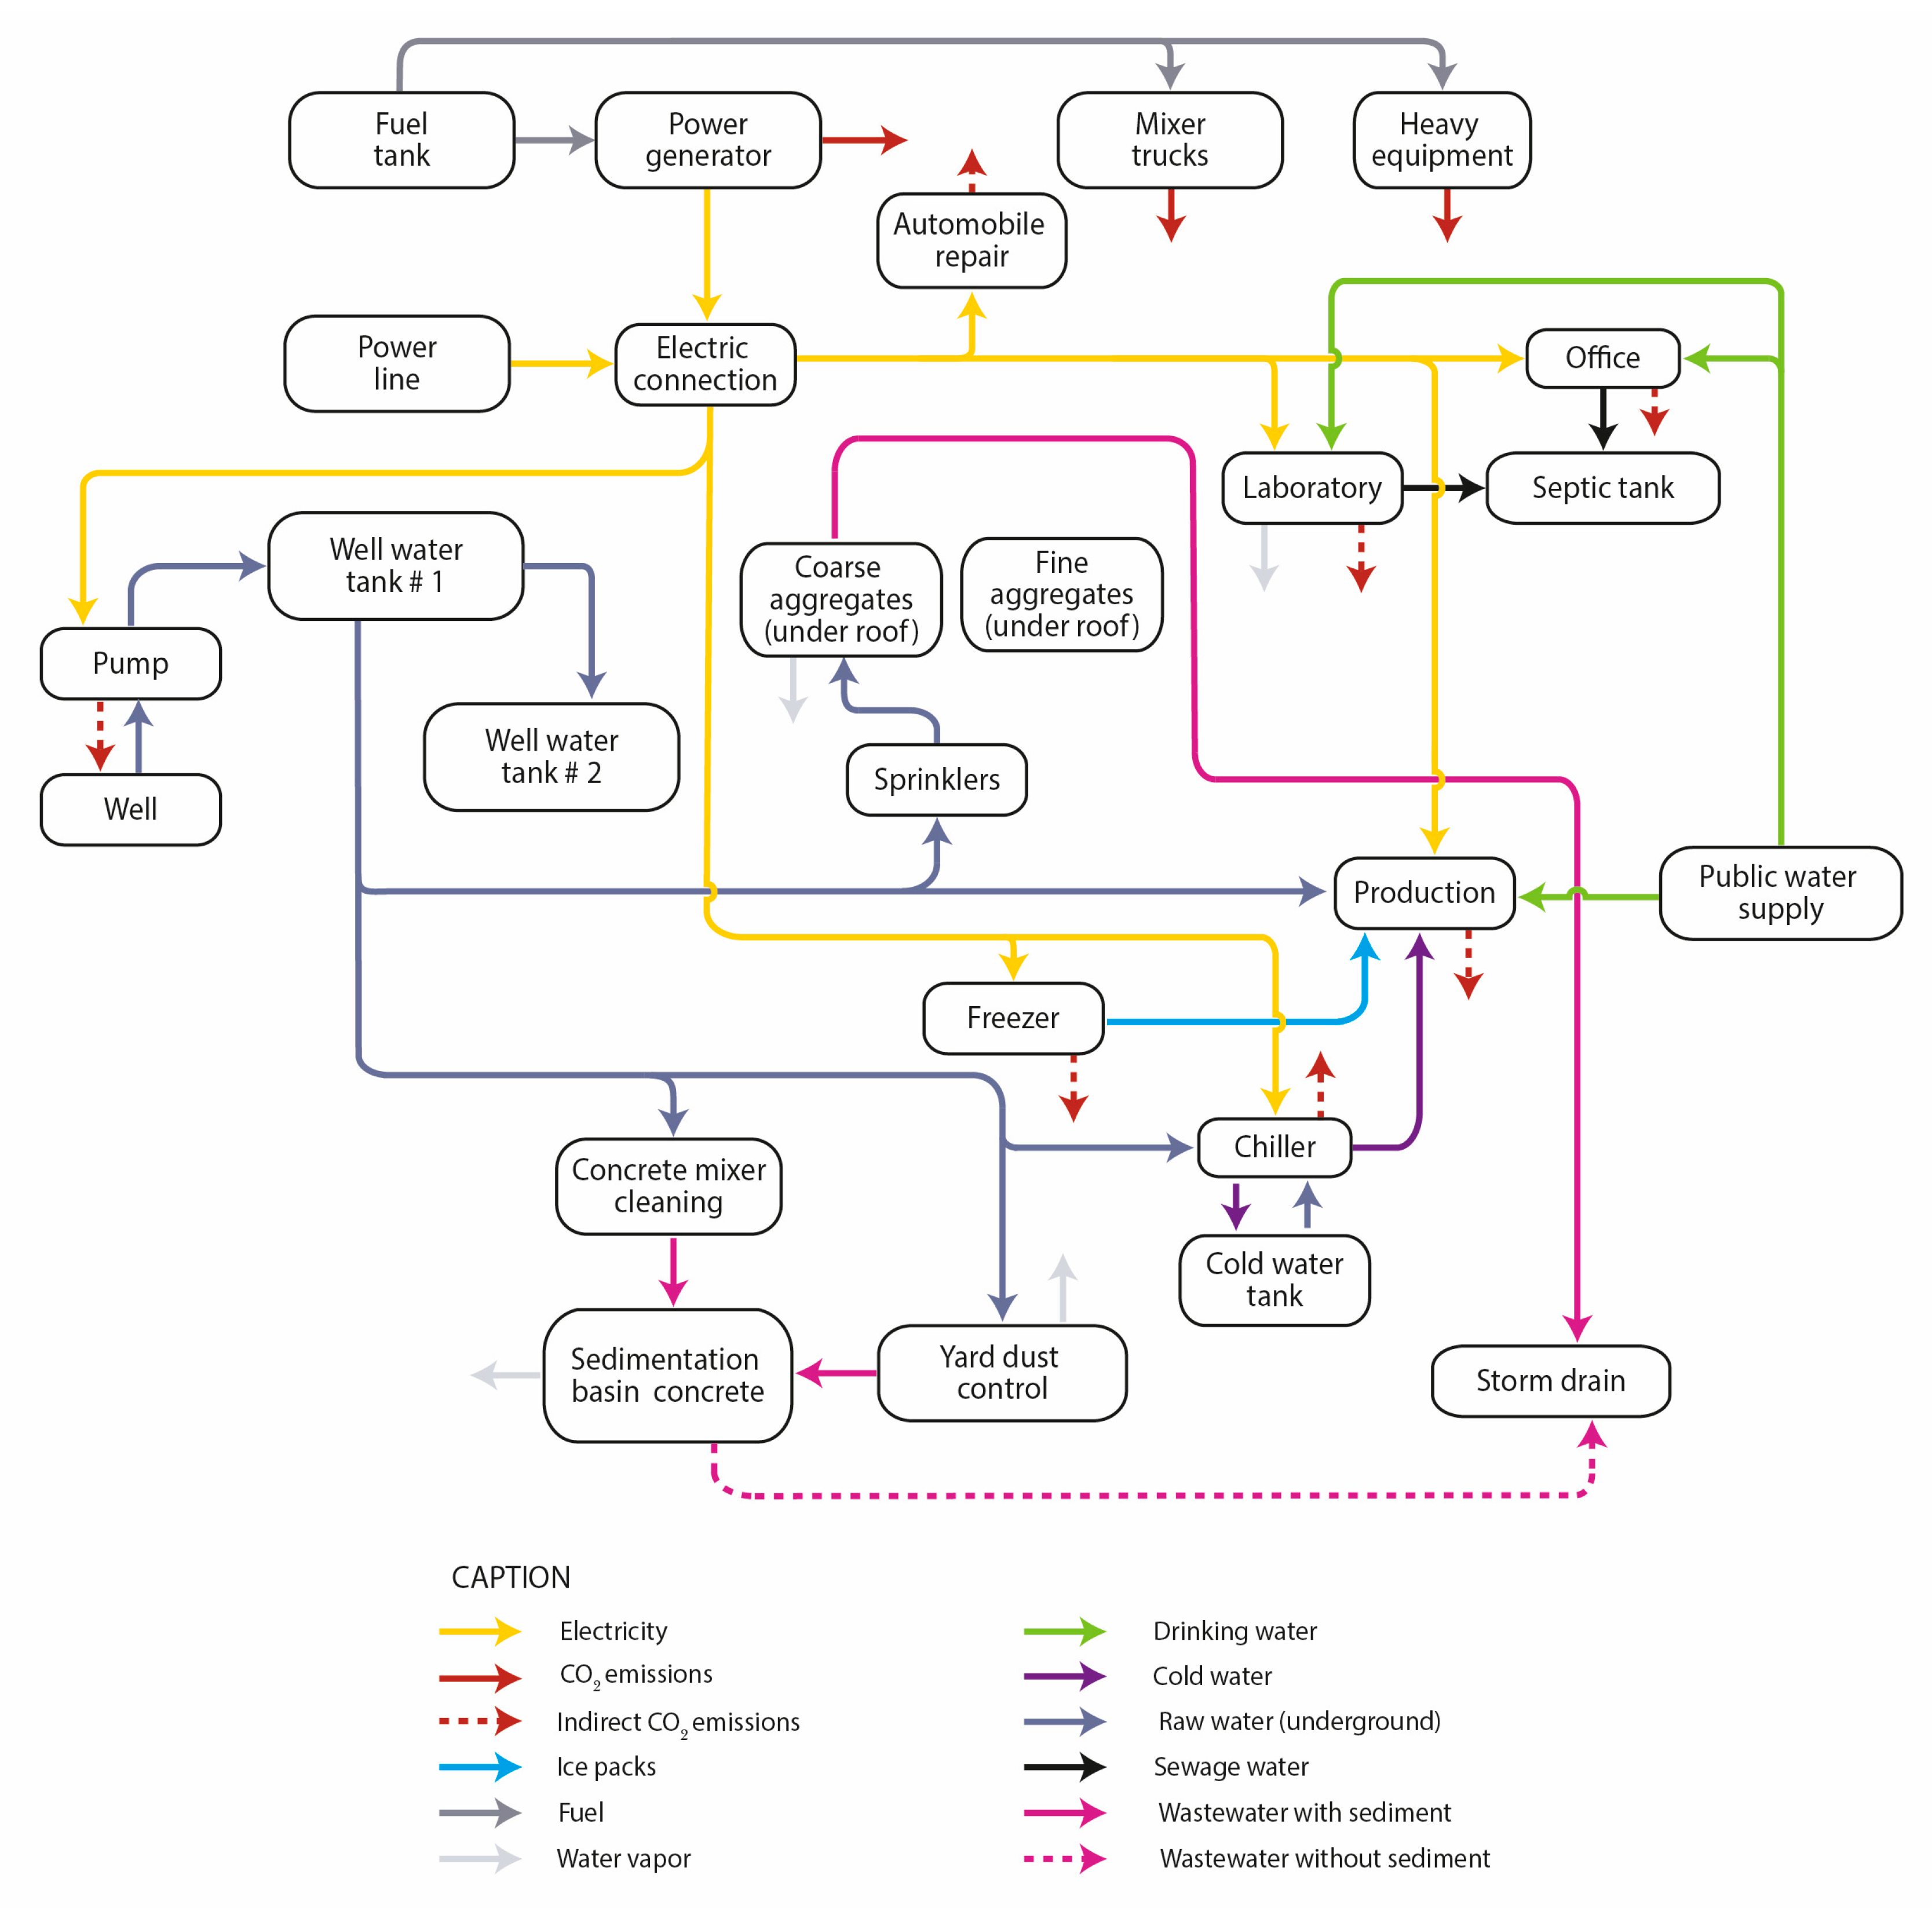
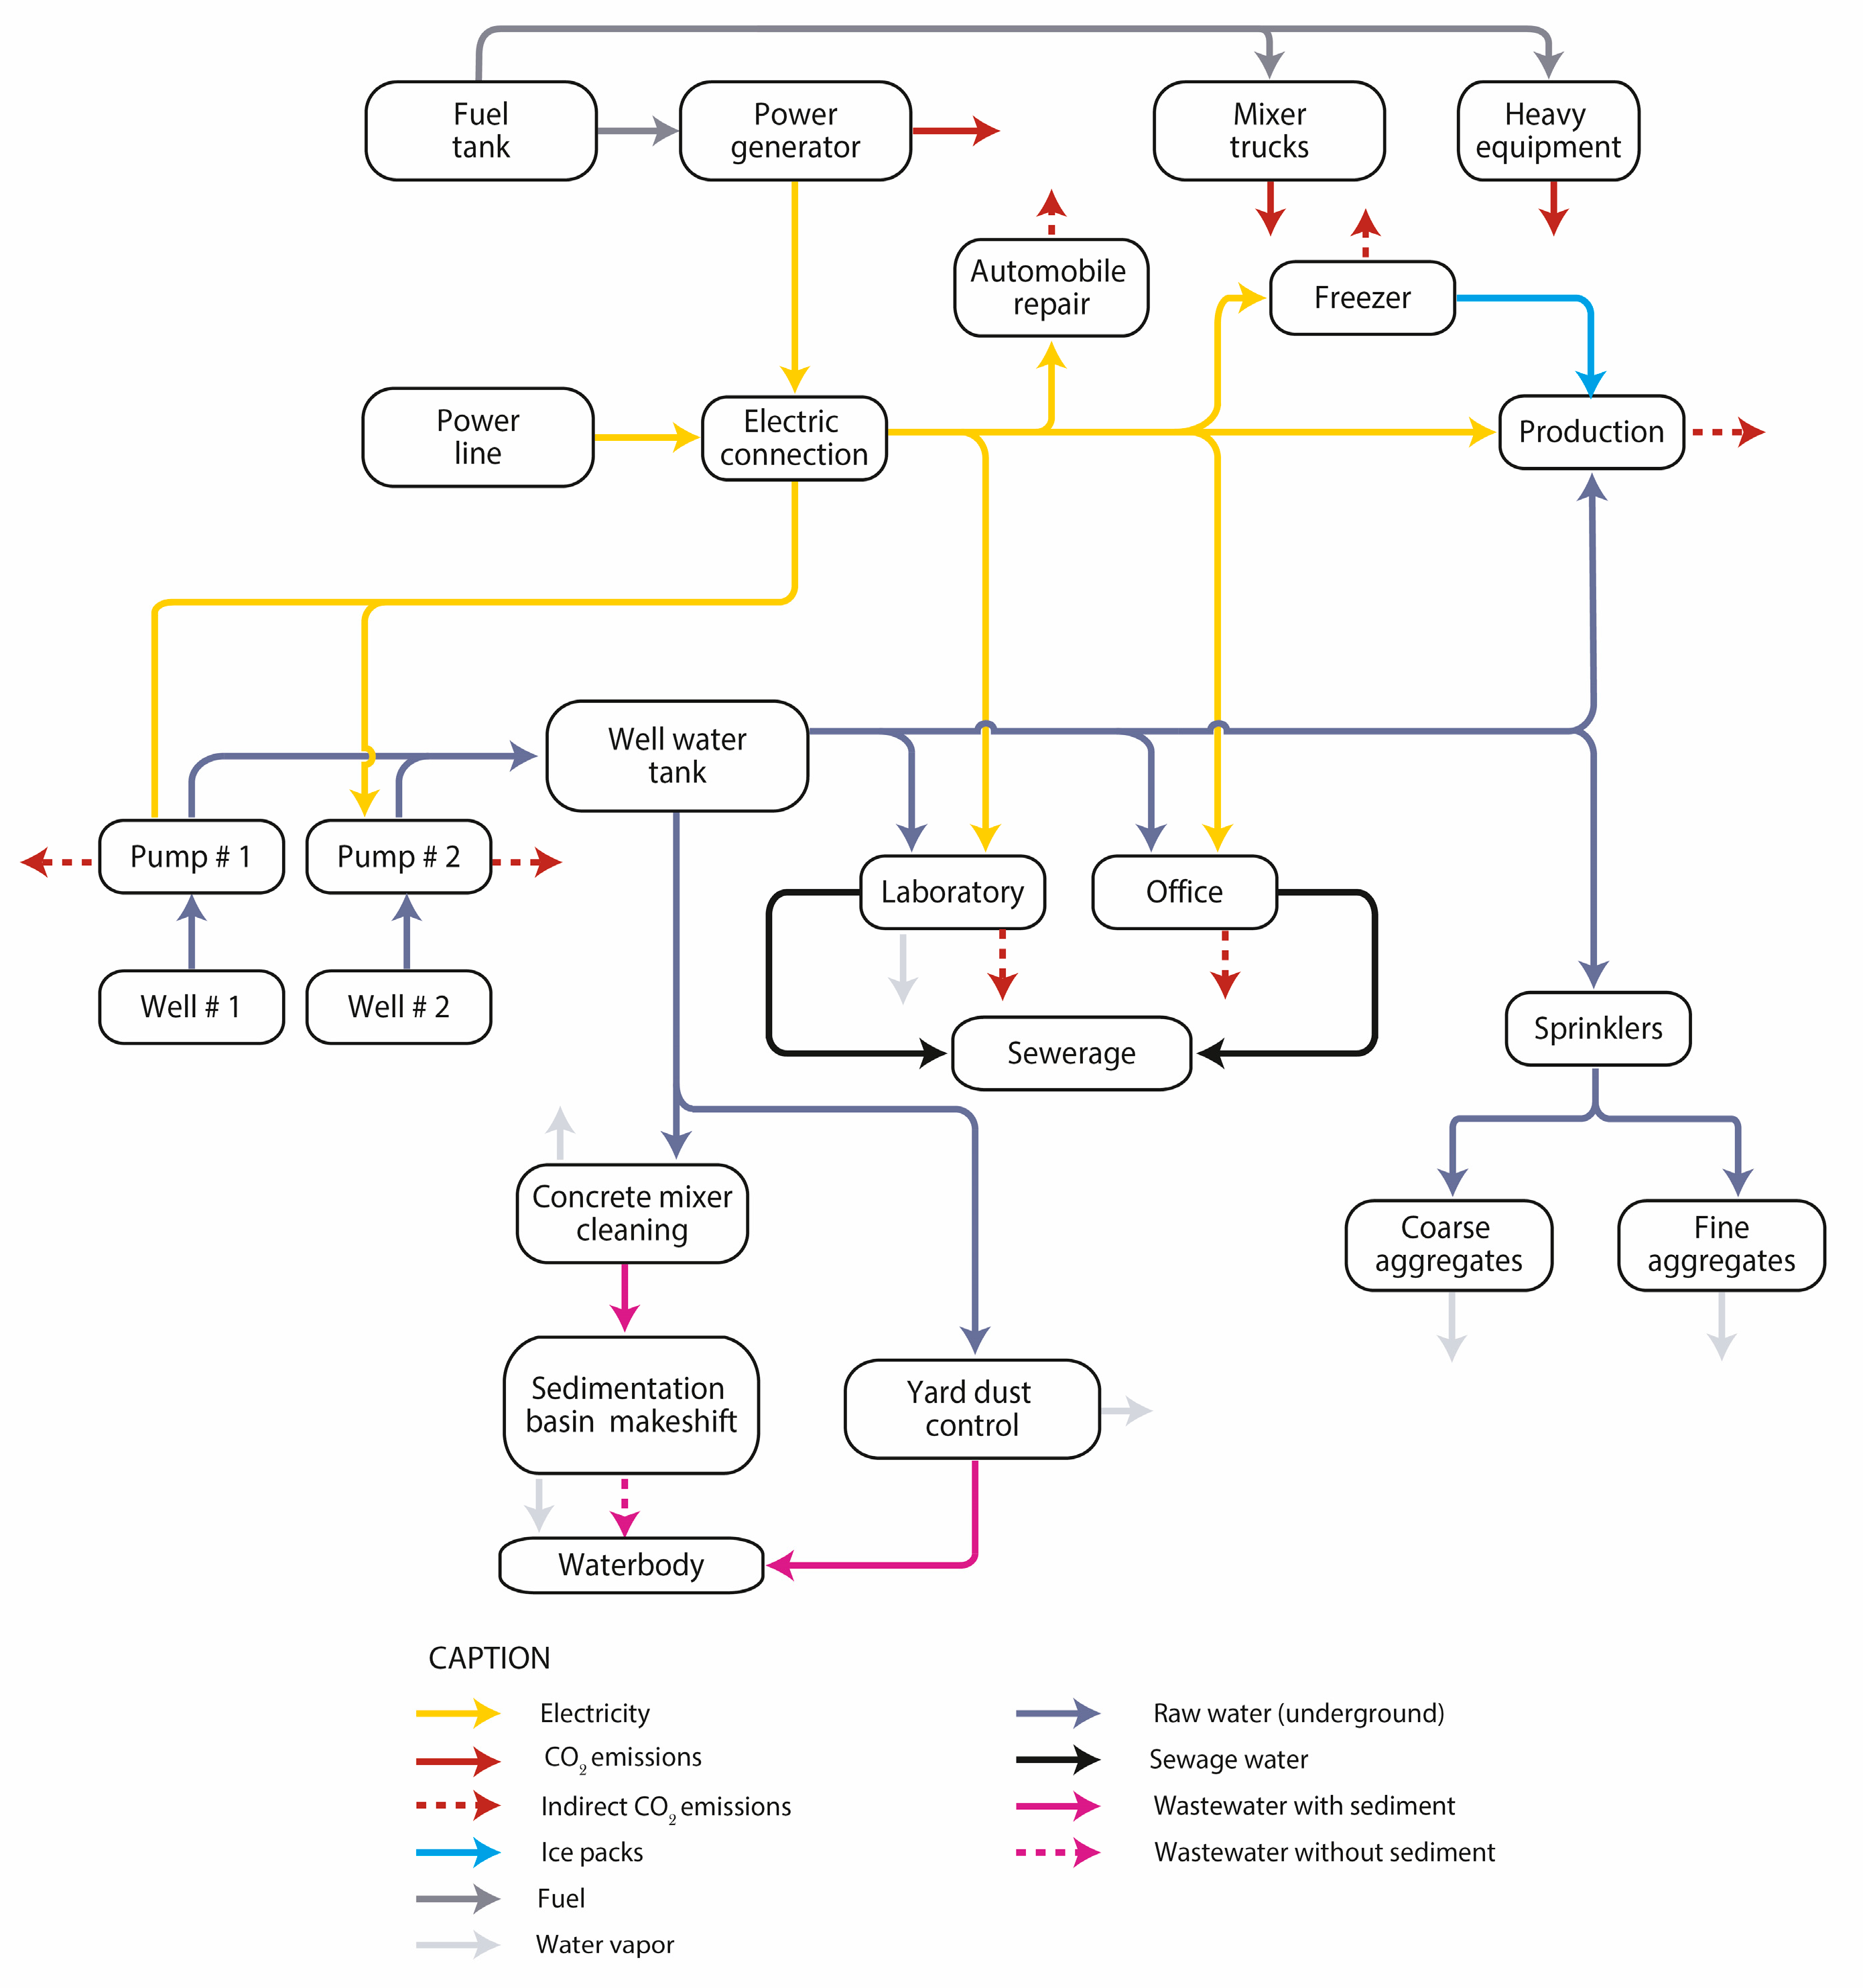
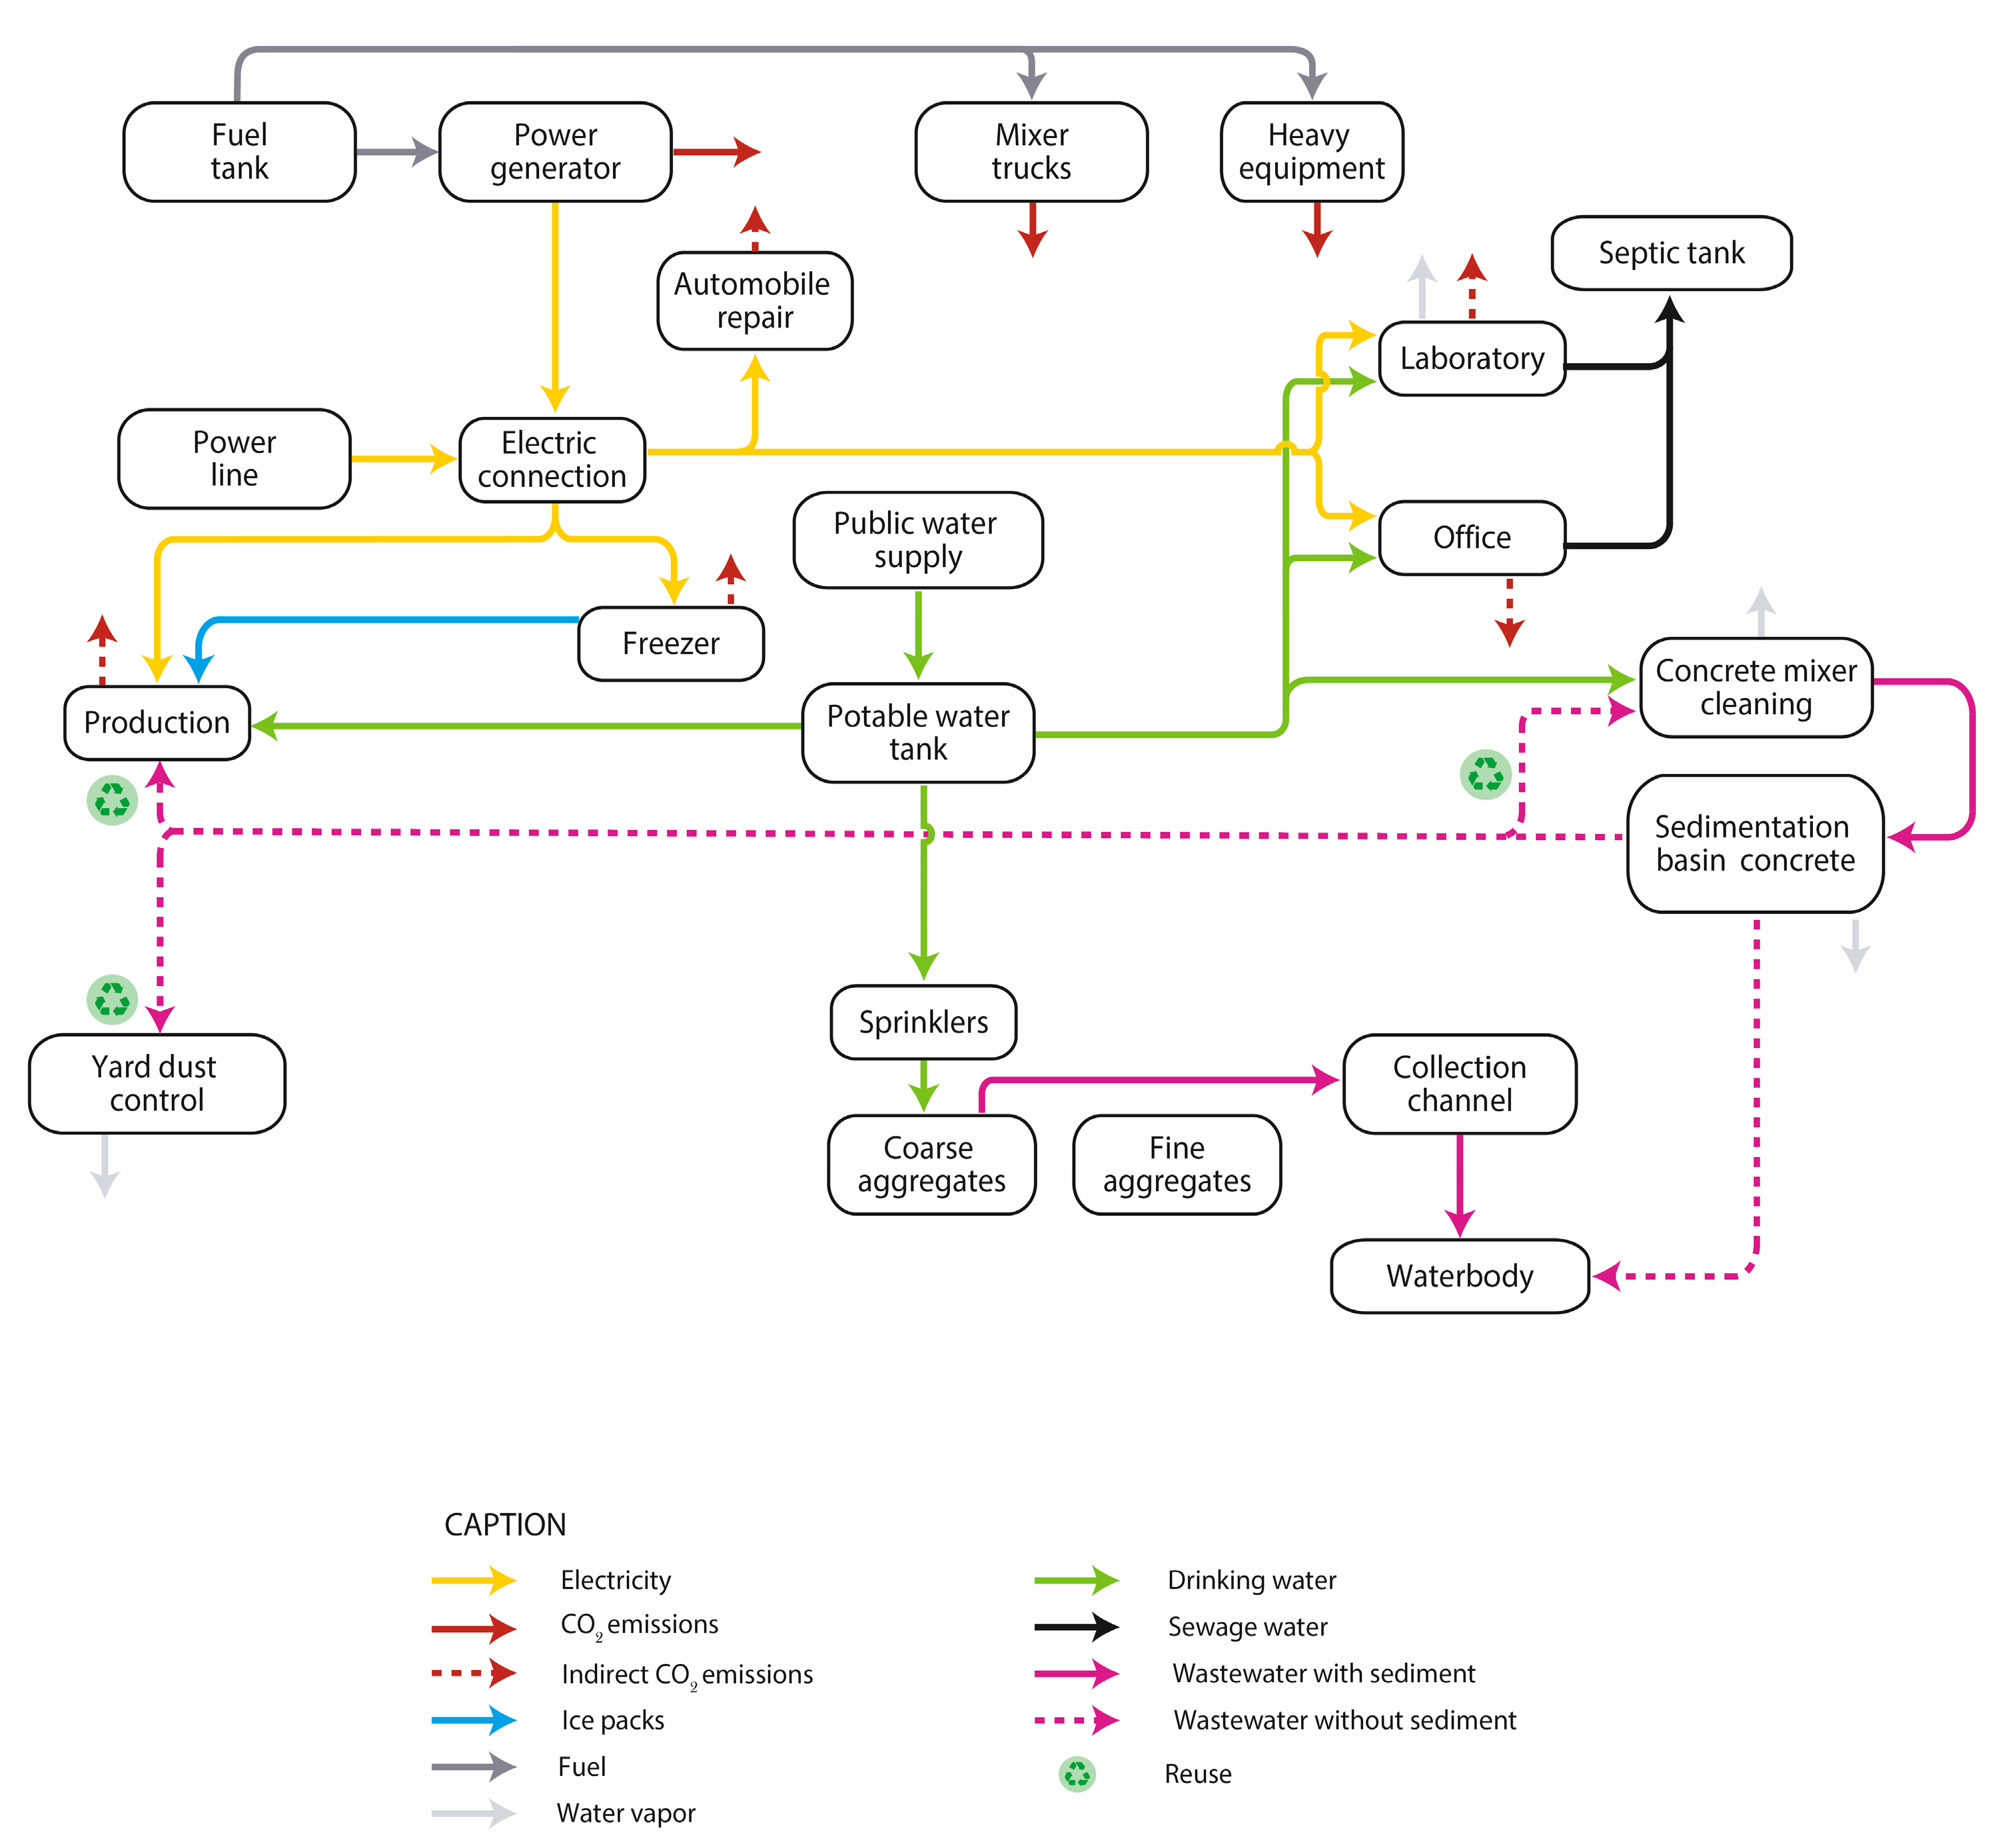
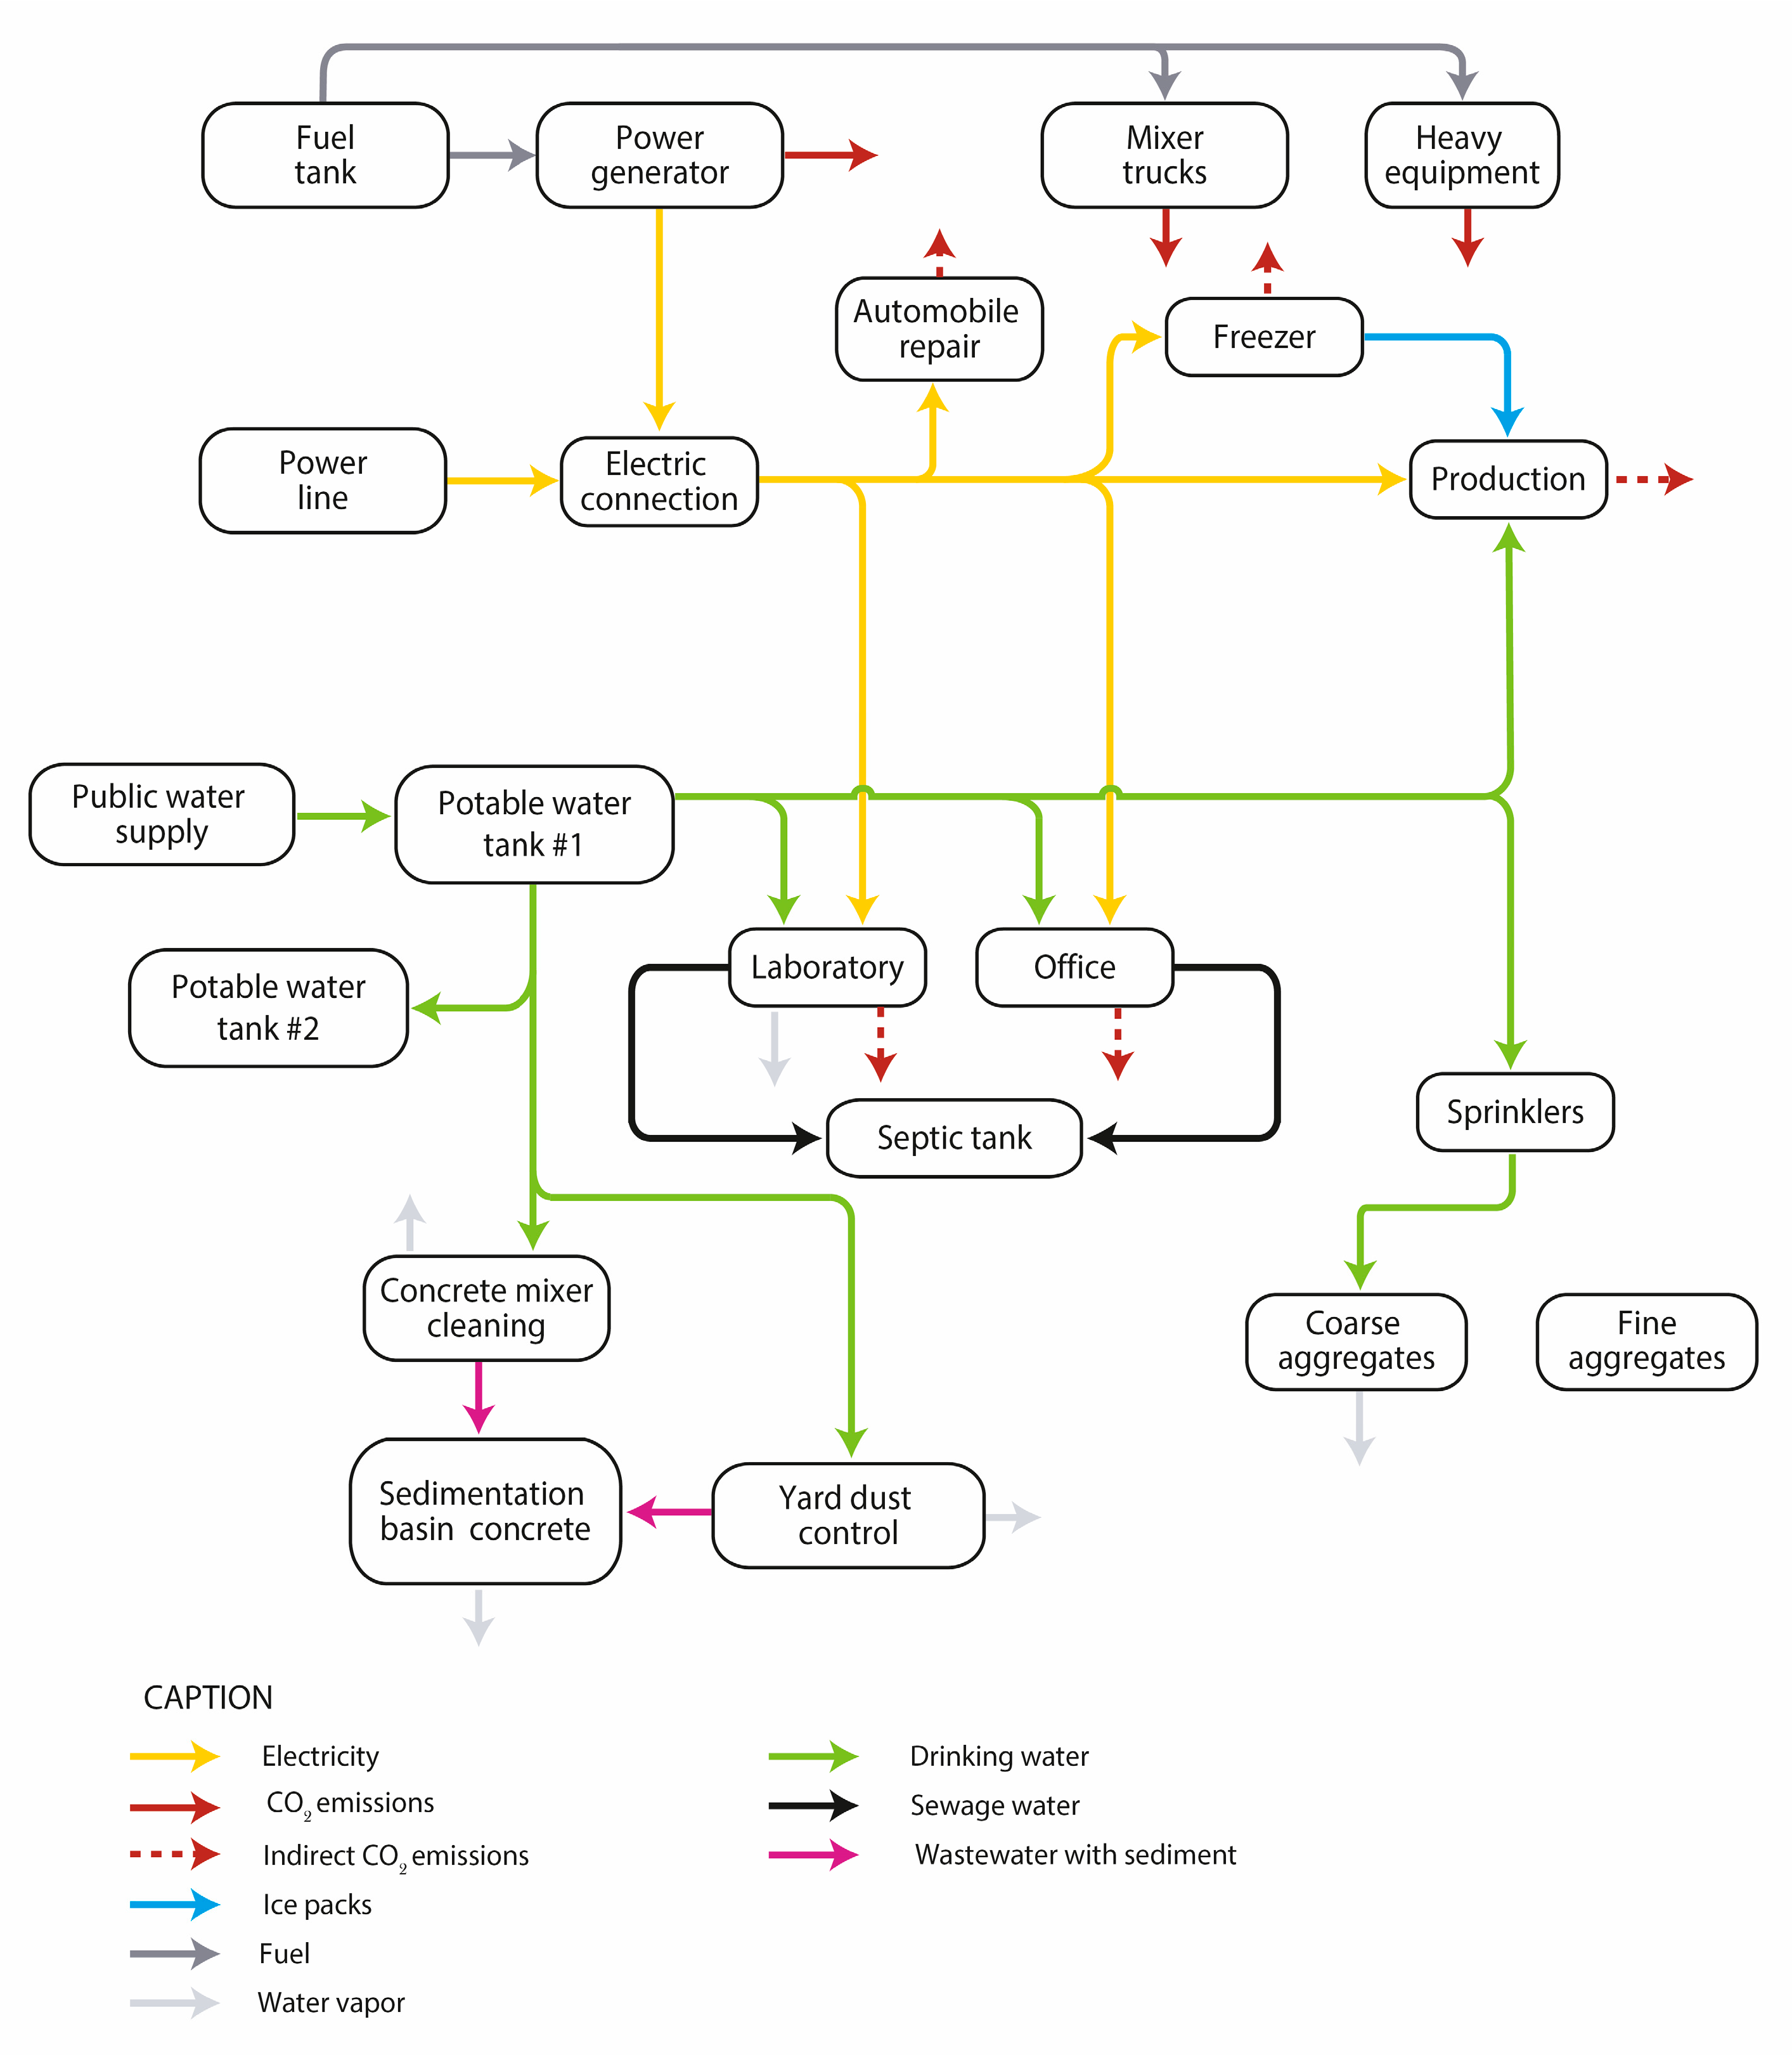
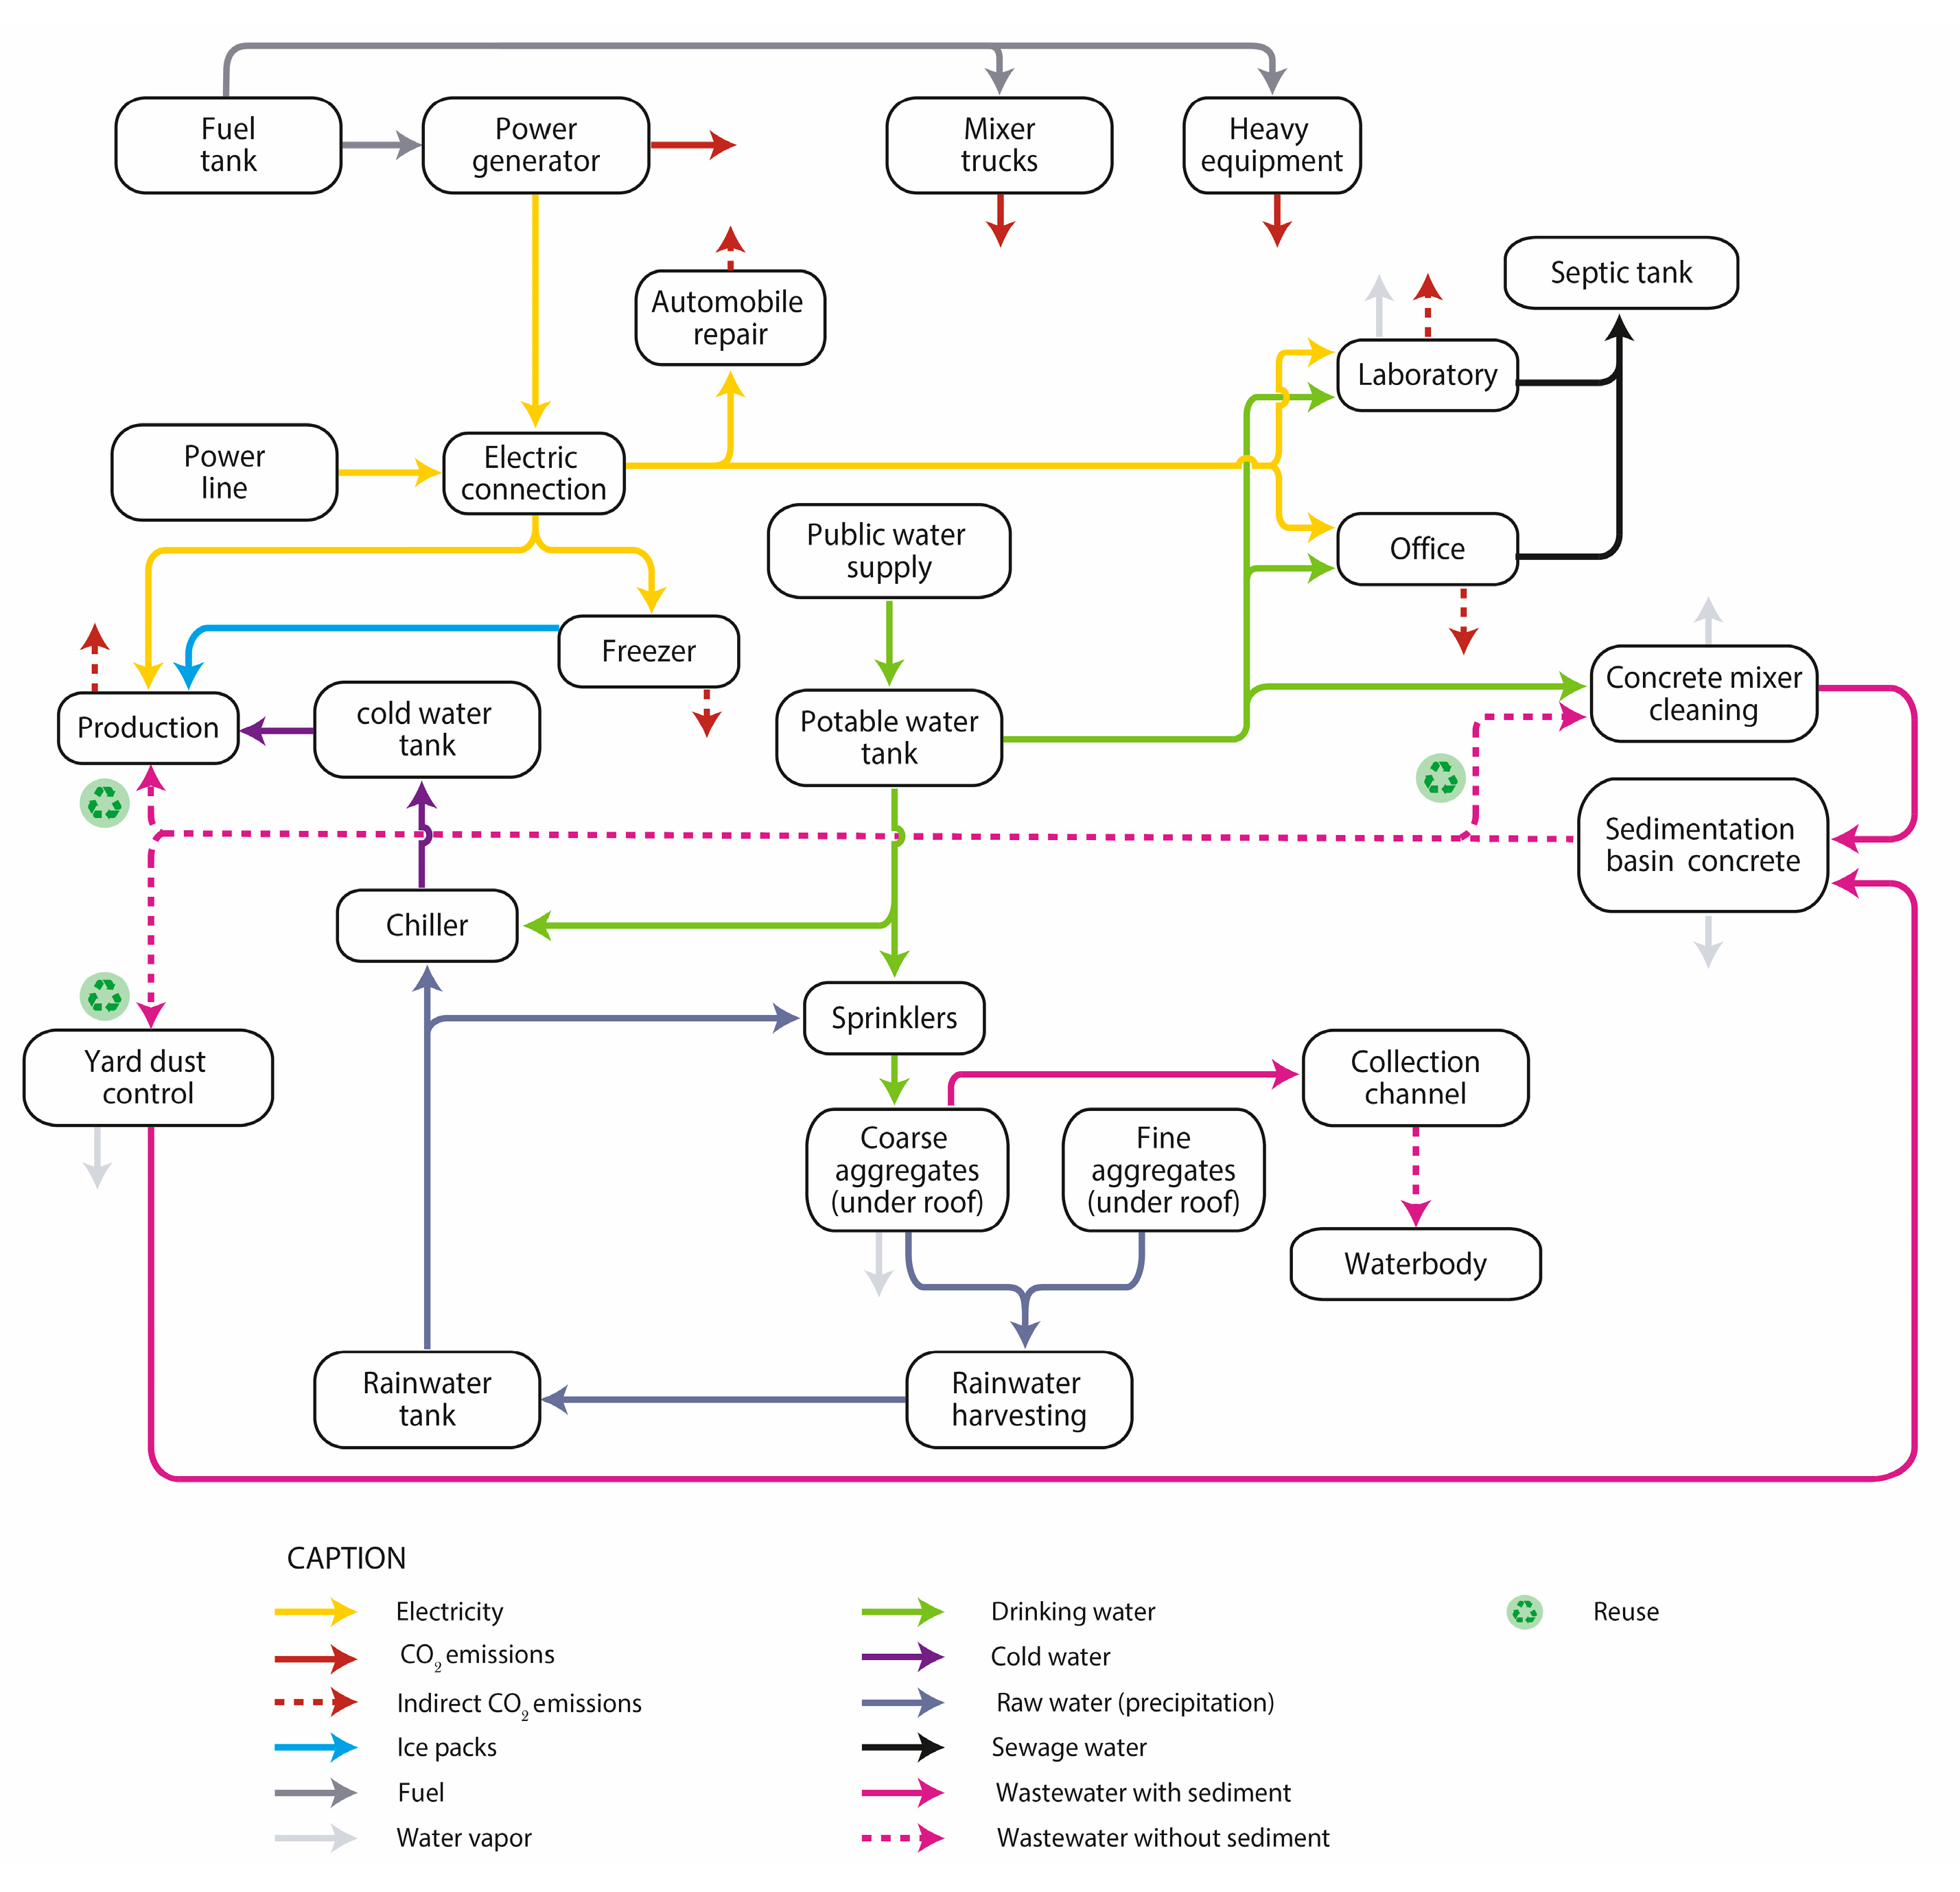
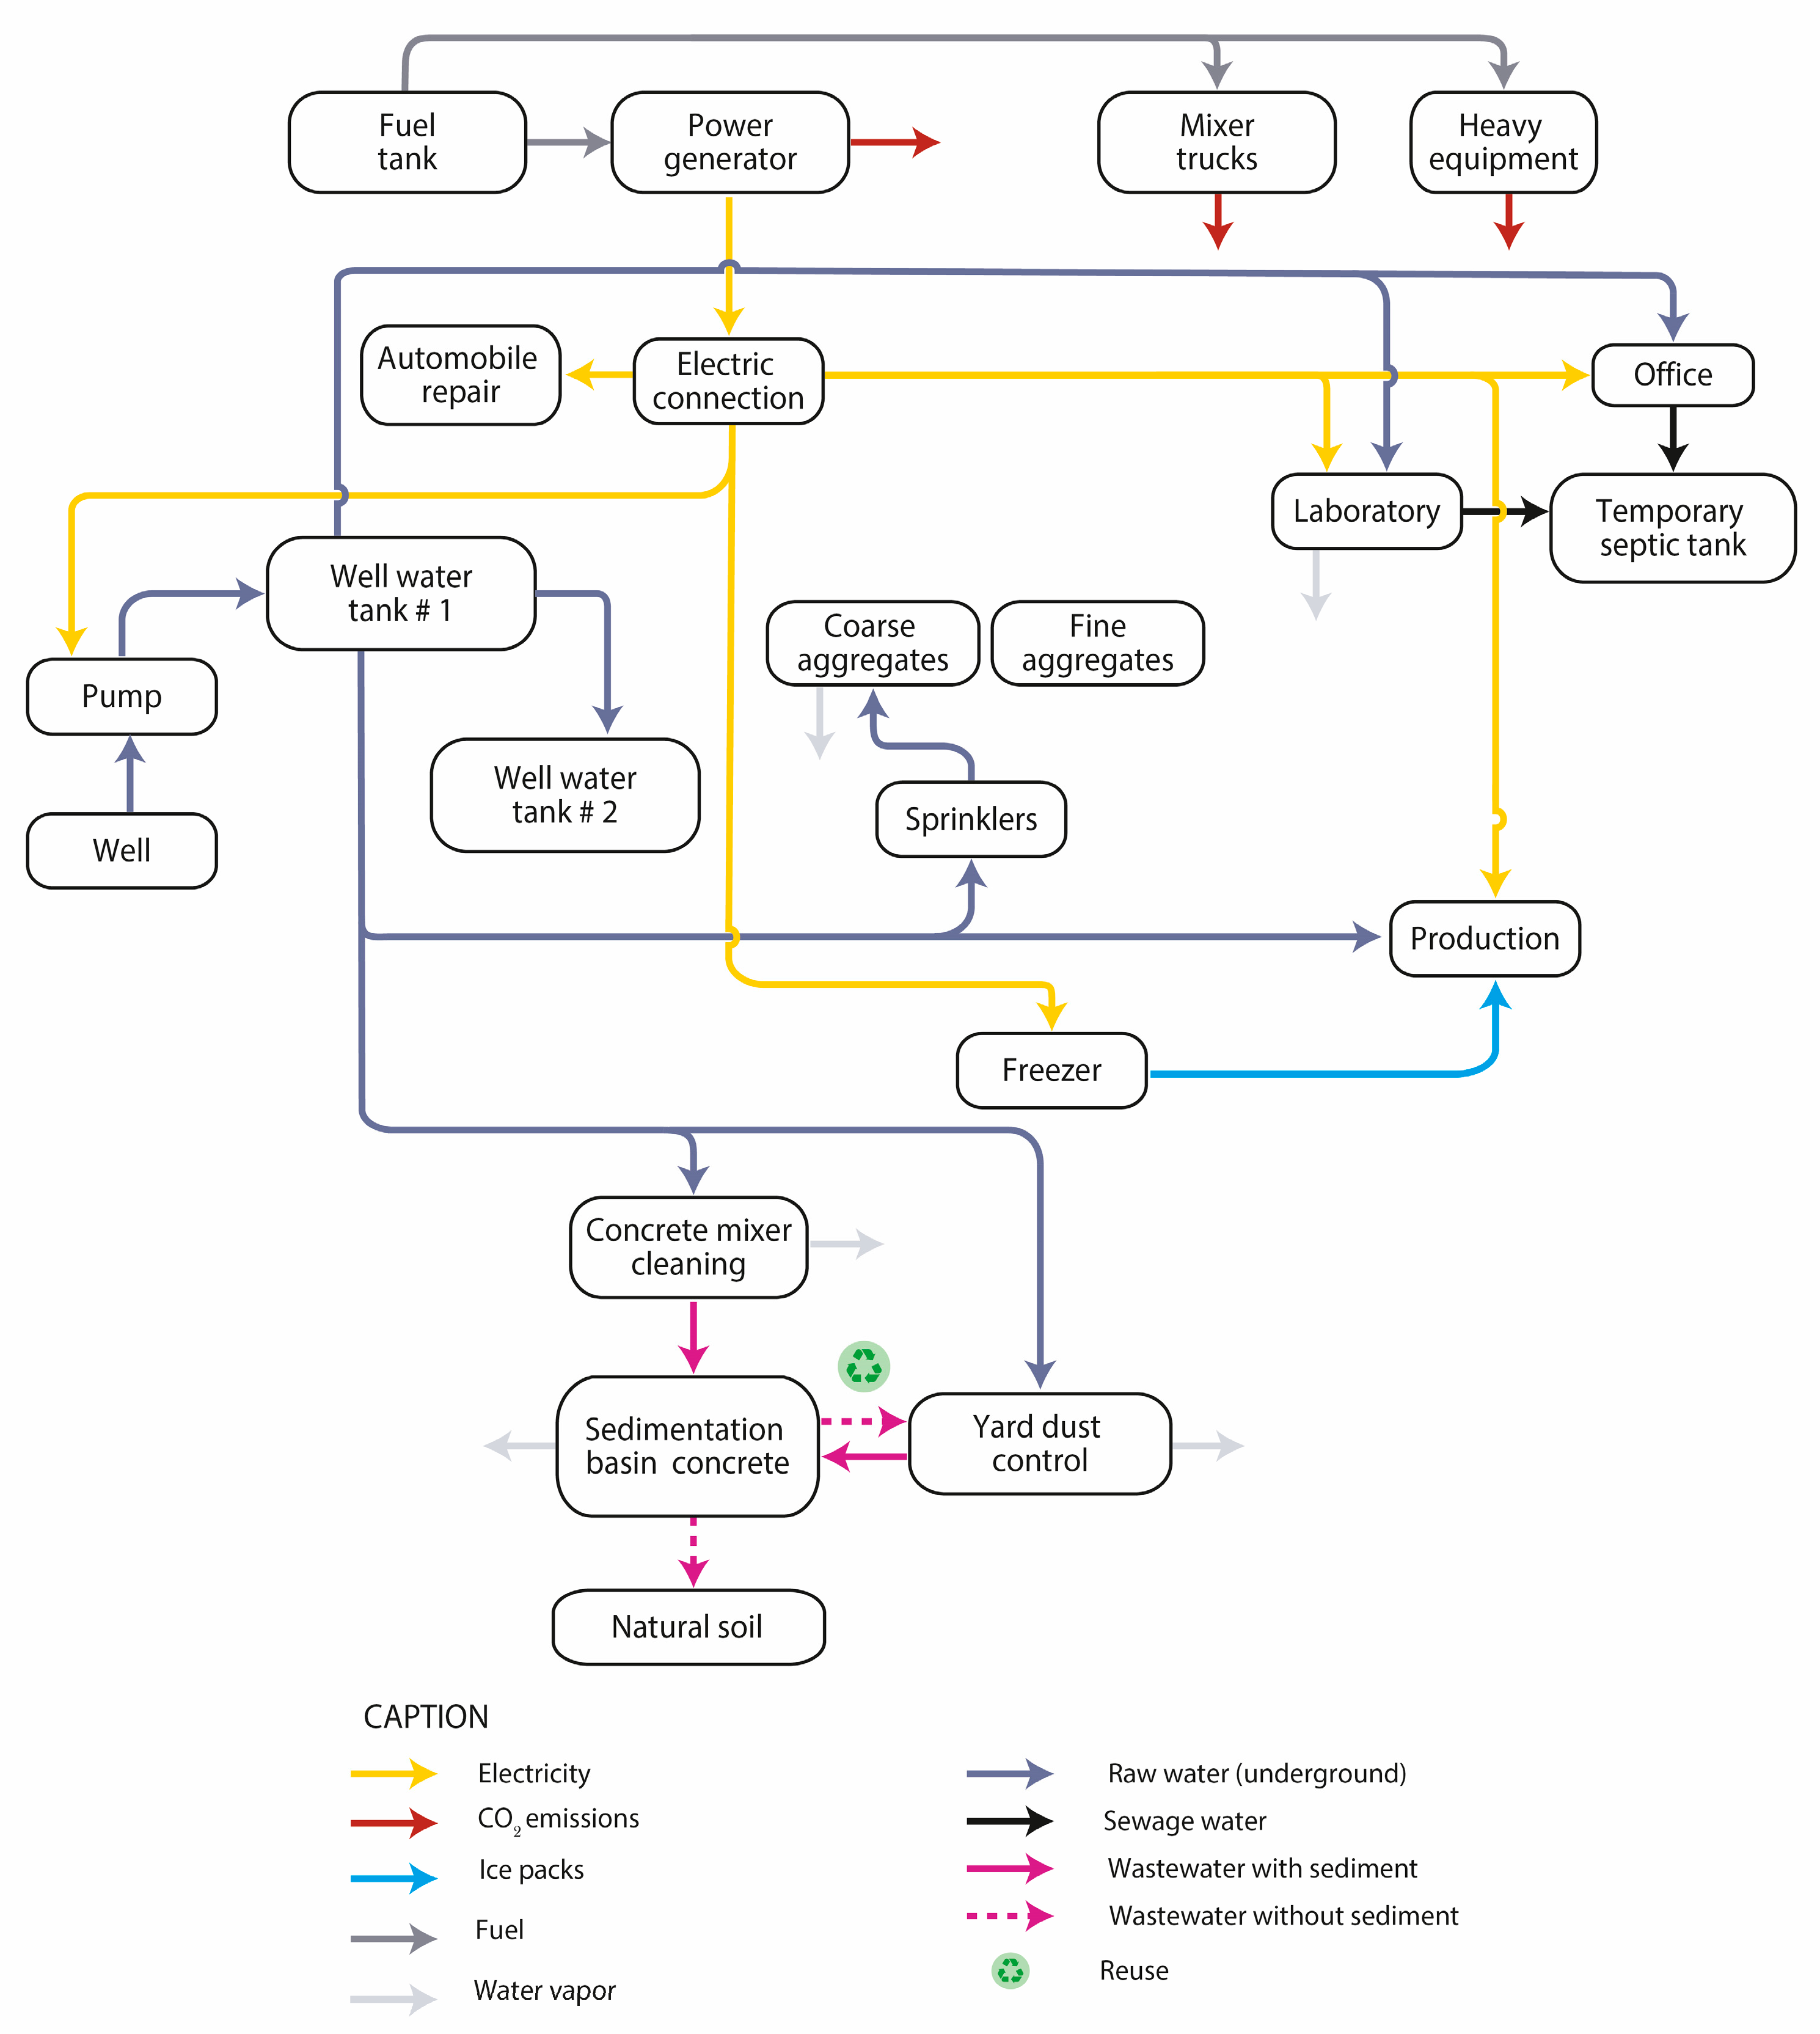
3.1. Flowcharts of Concrete Production Technological Routes
During the diagramming process, similarities were observed in the concrete manufacturing processes, with plant #1 (
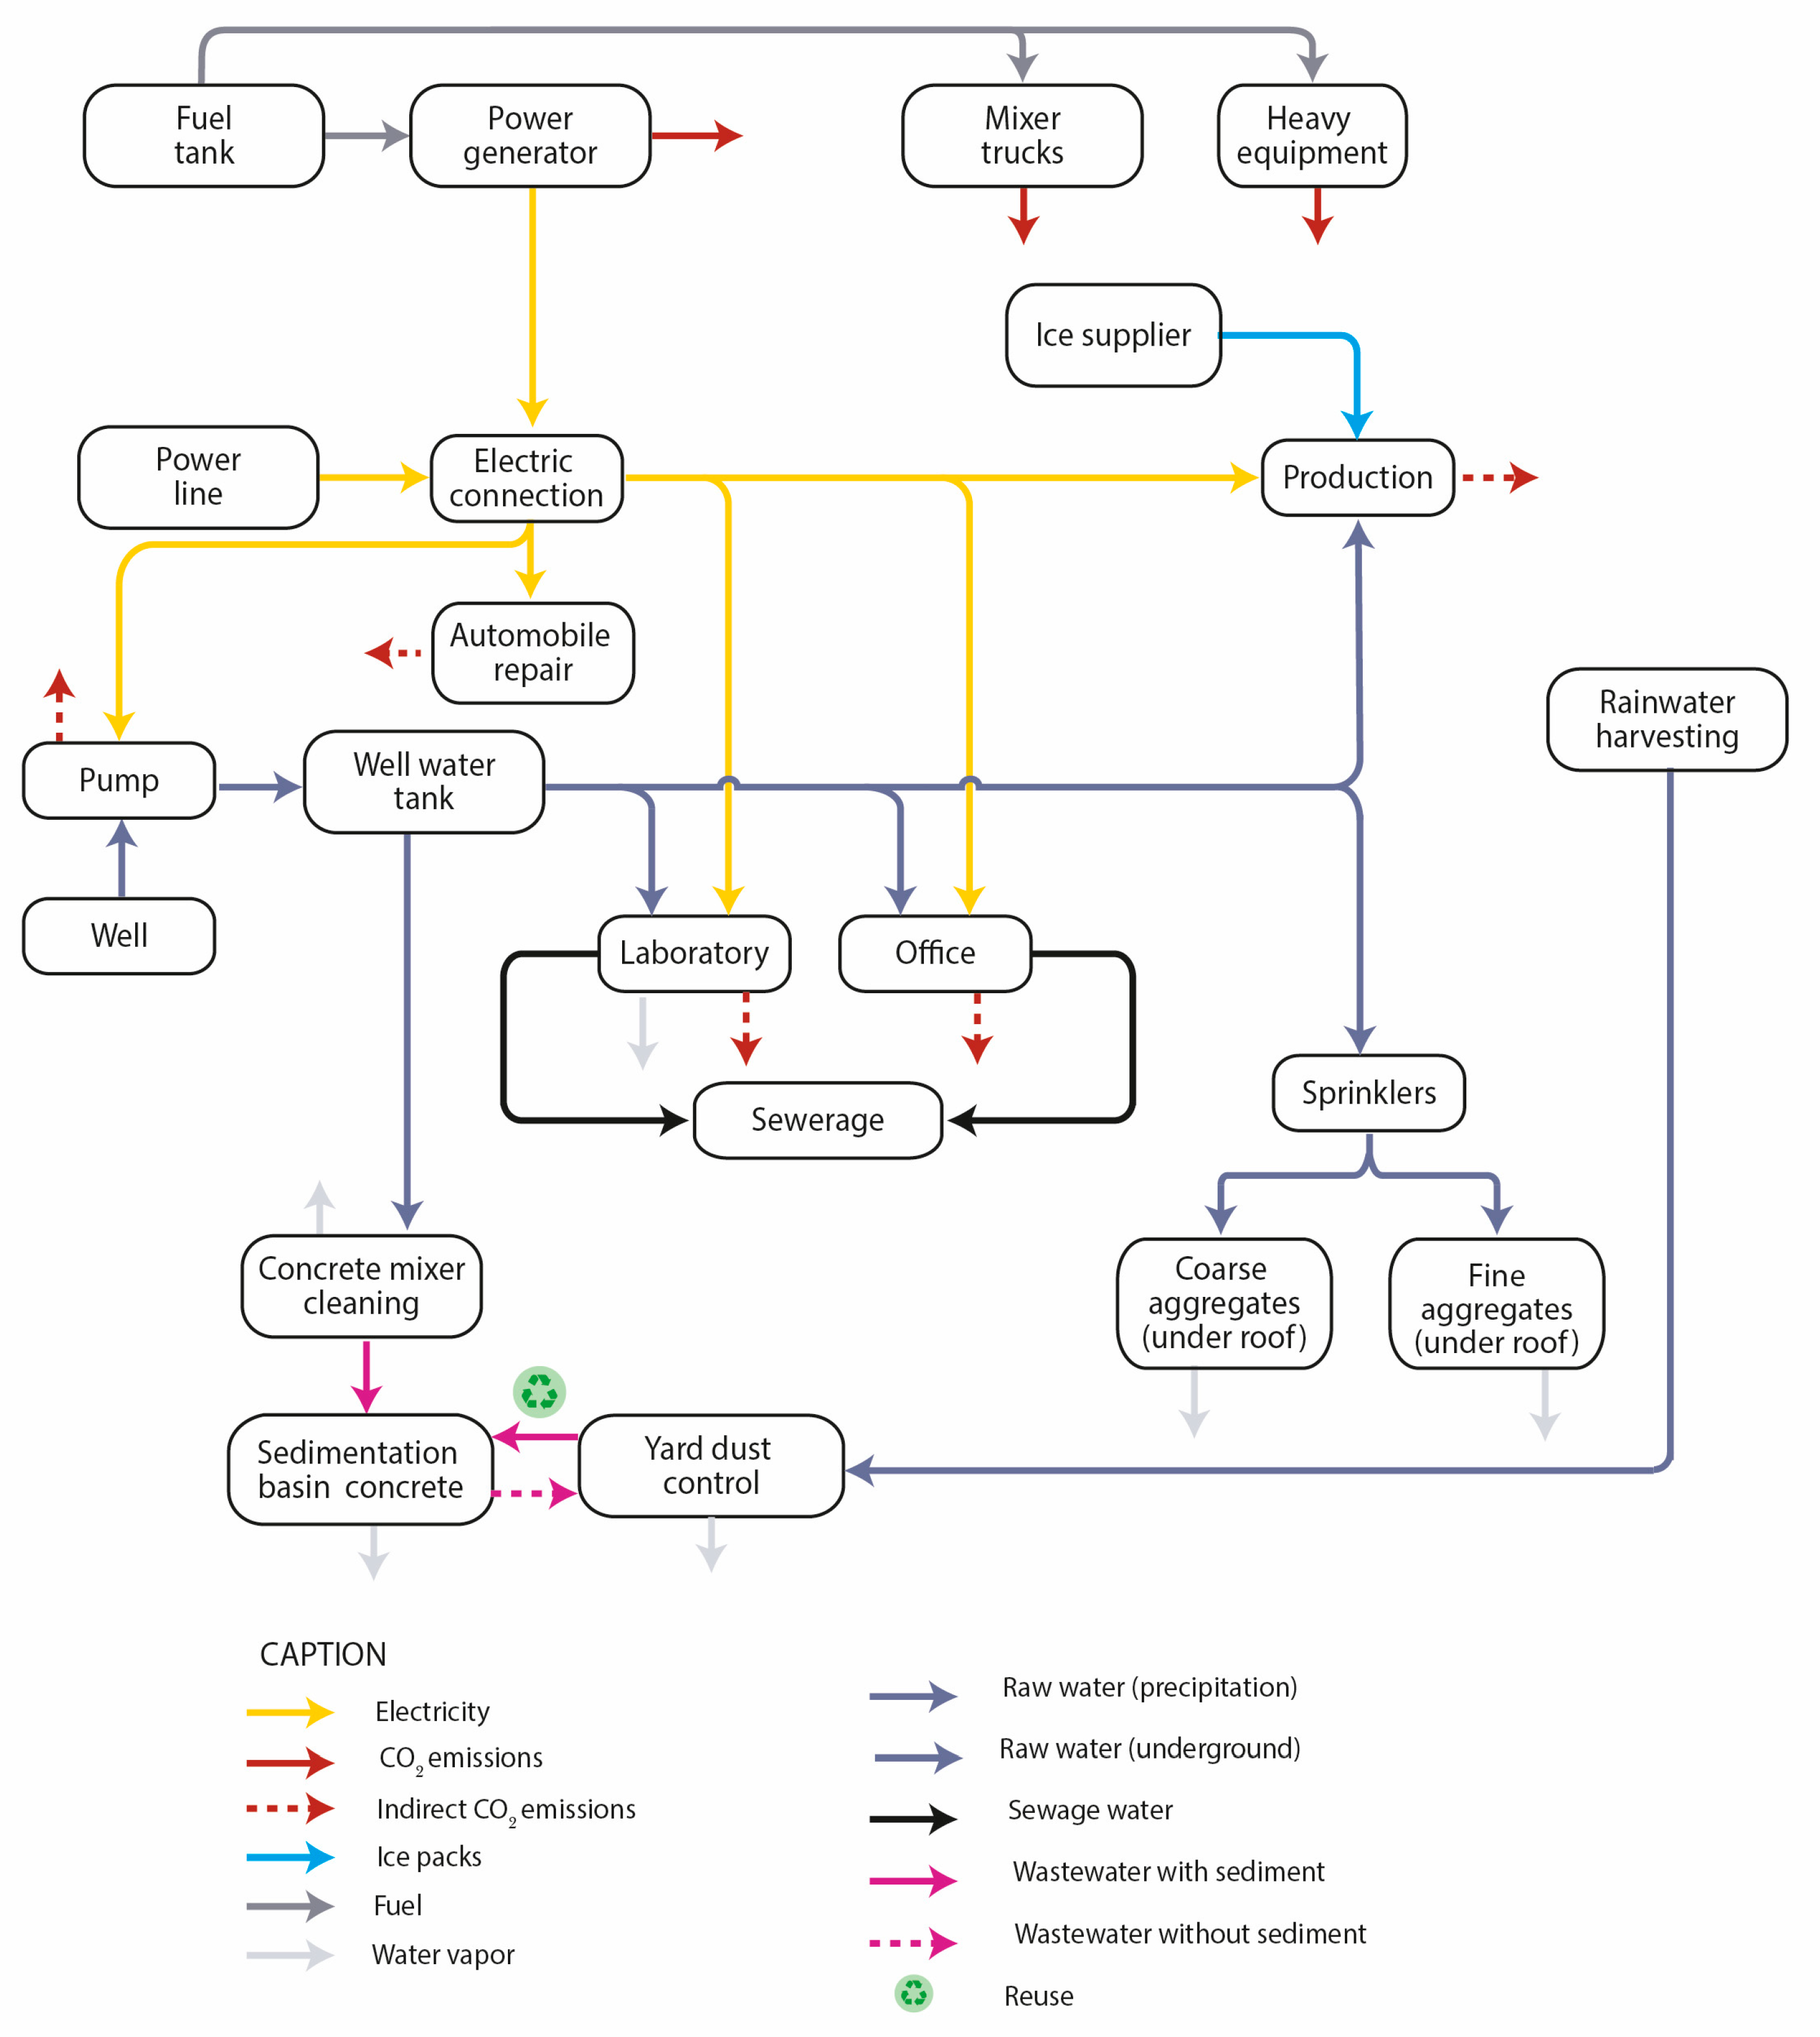
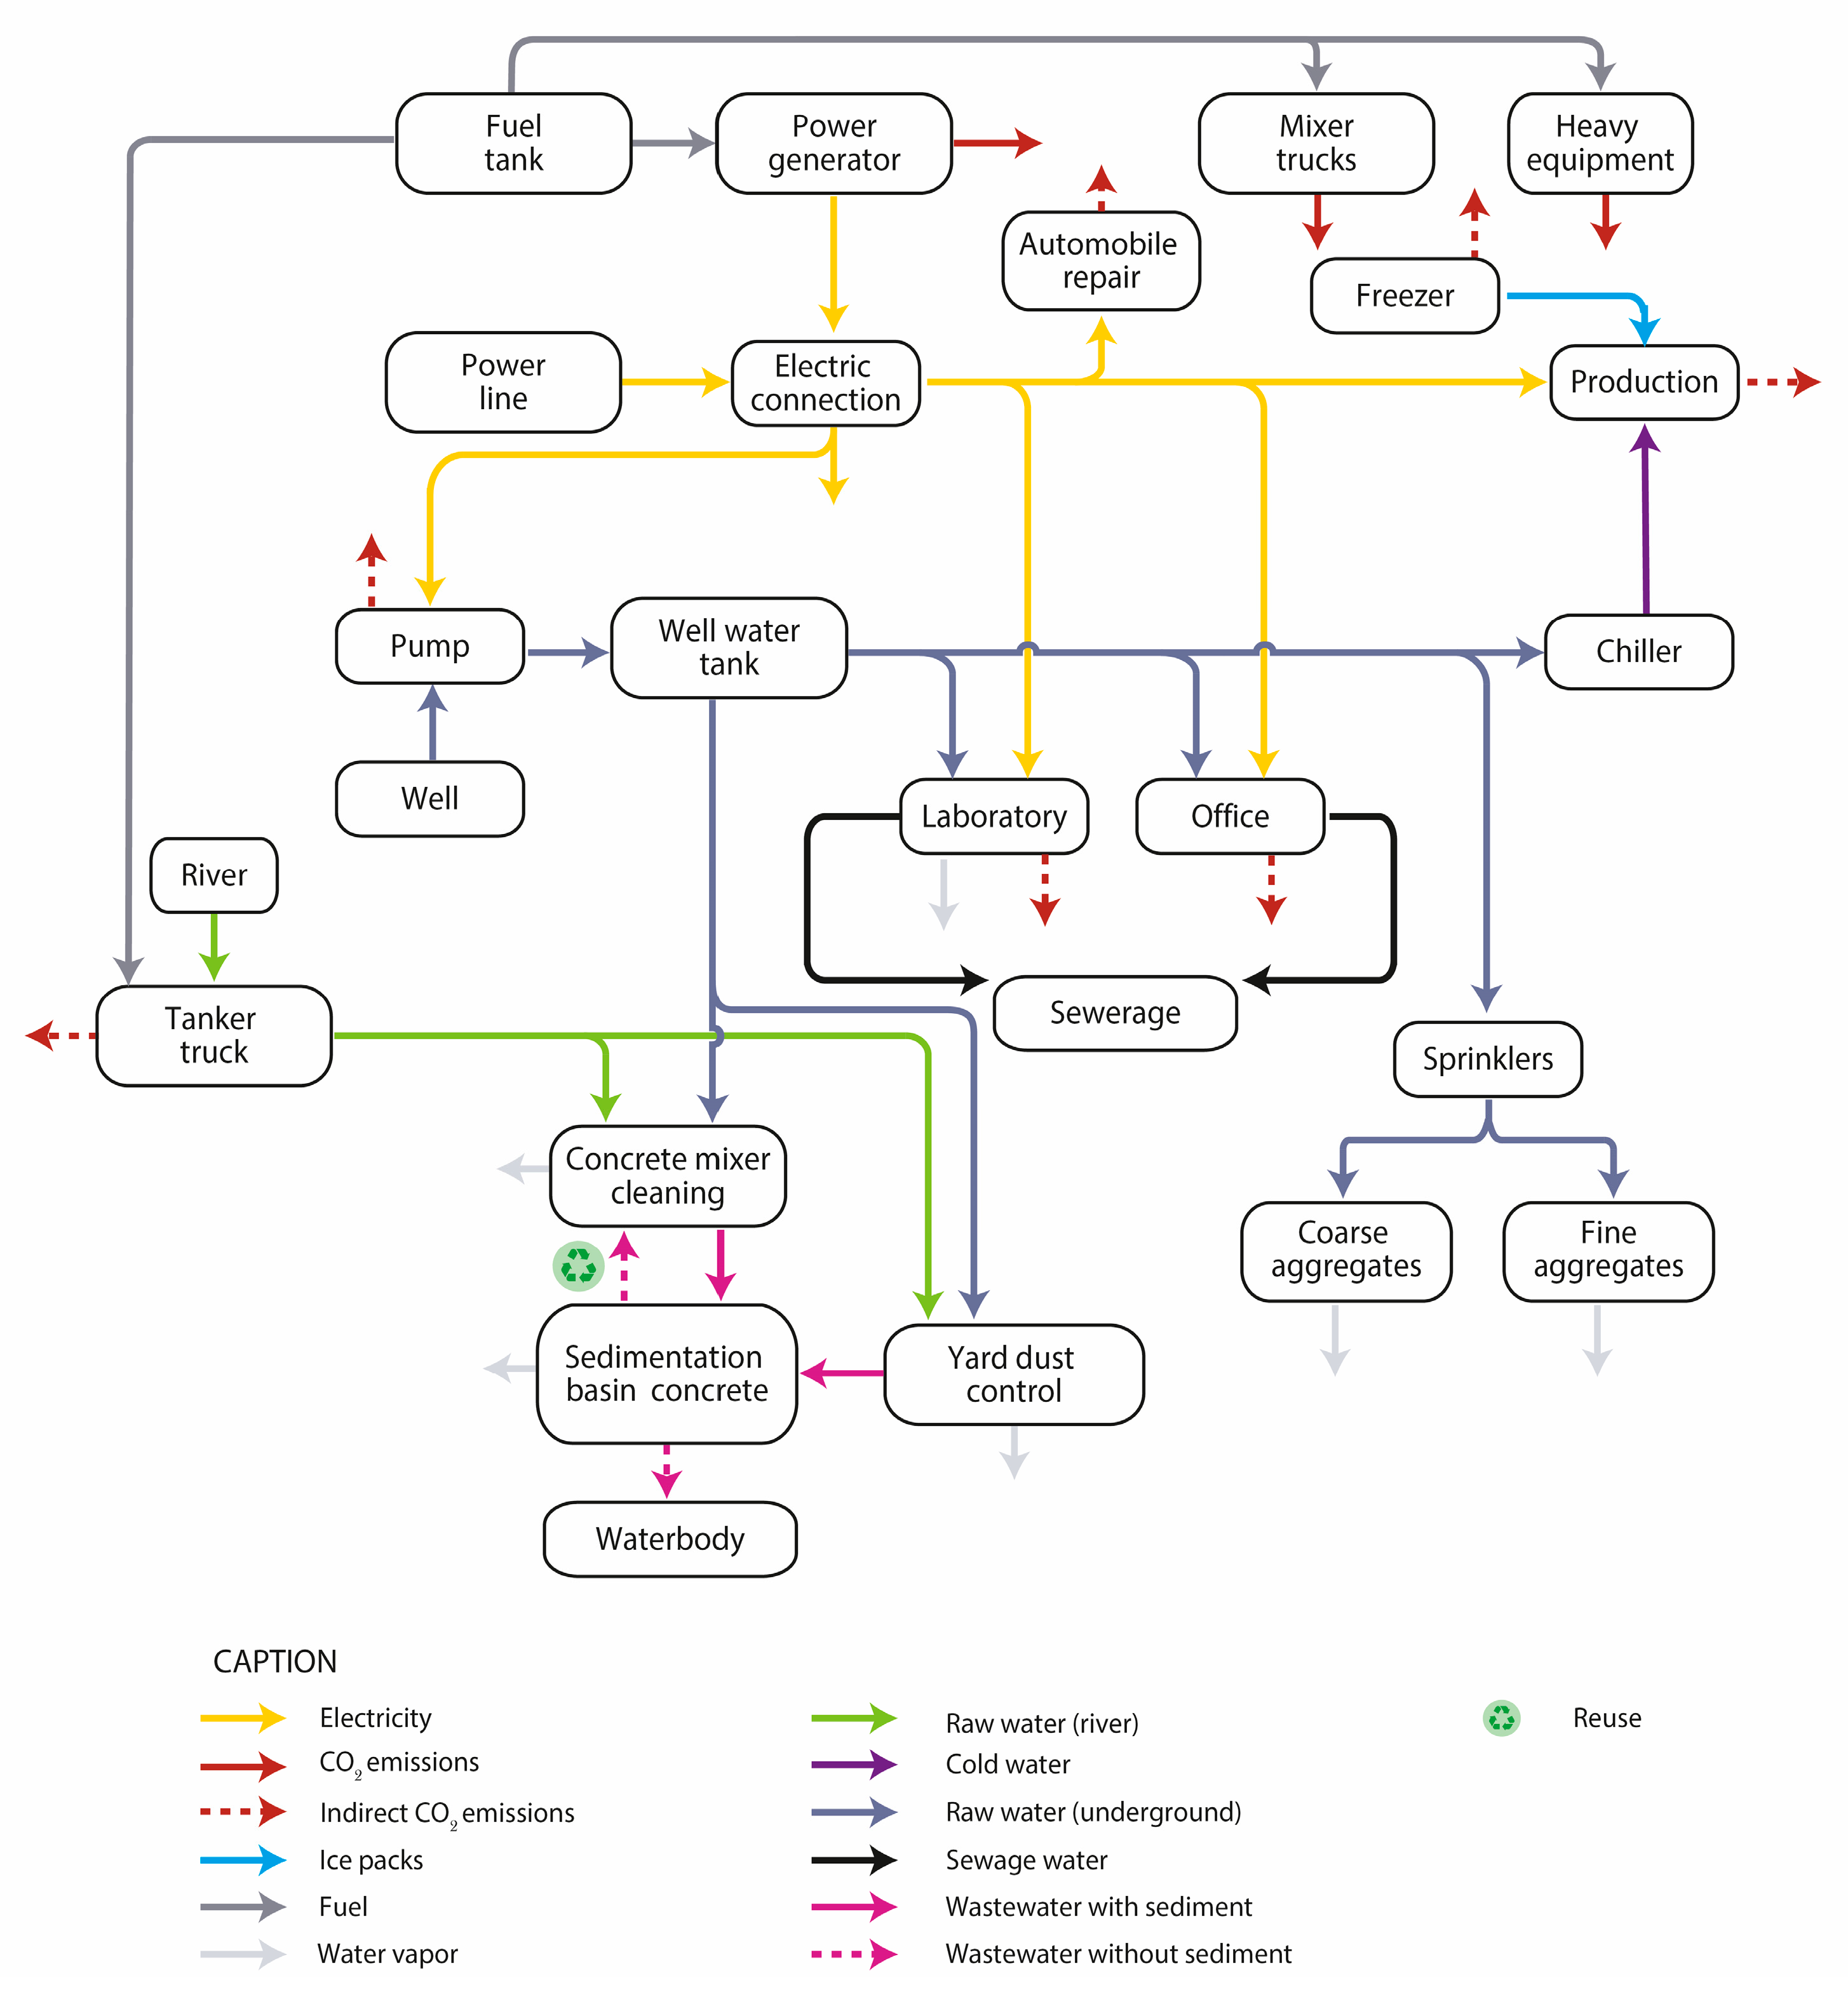
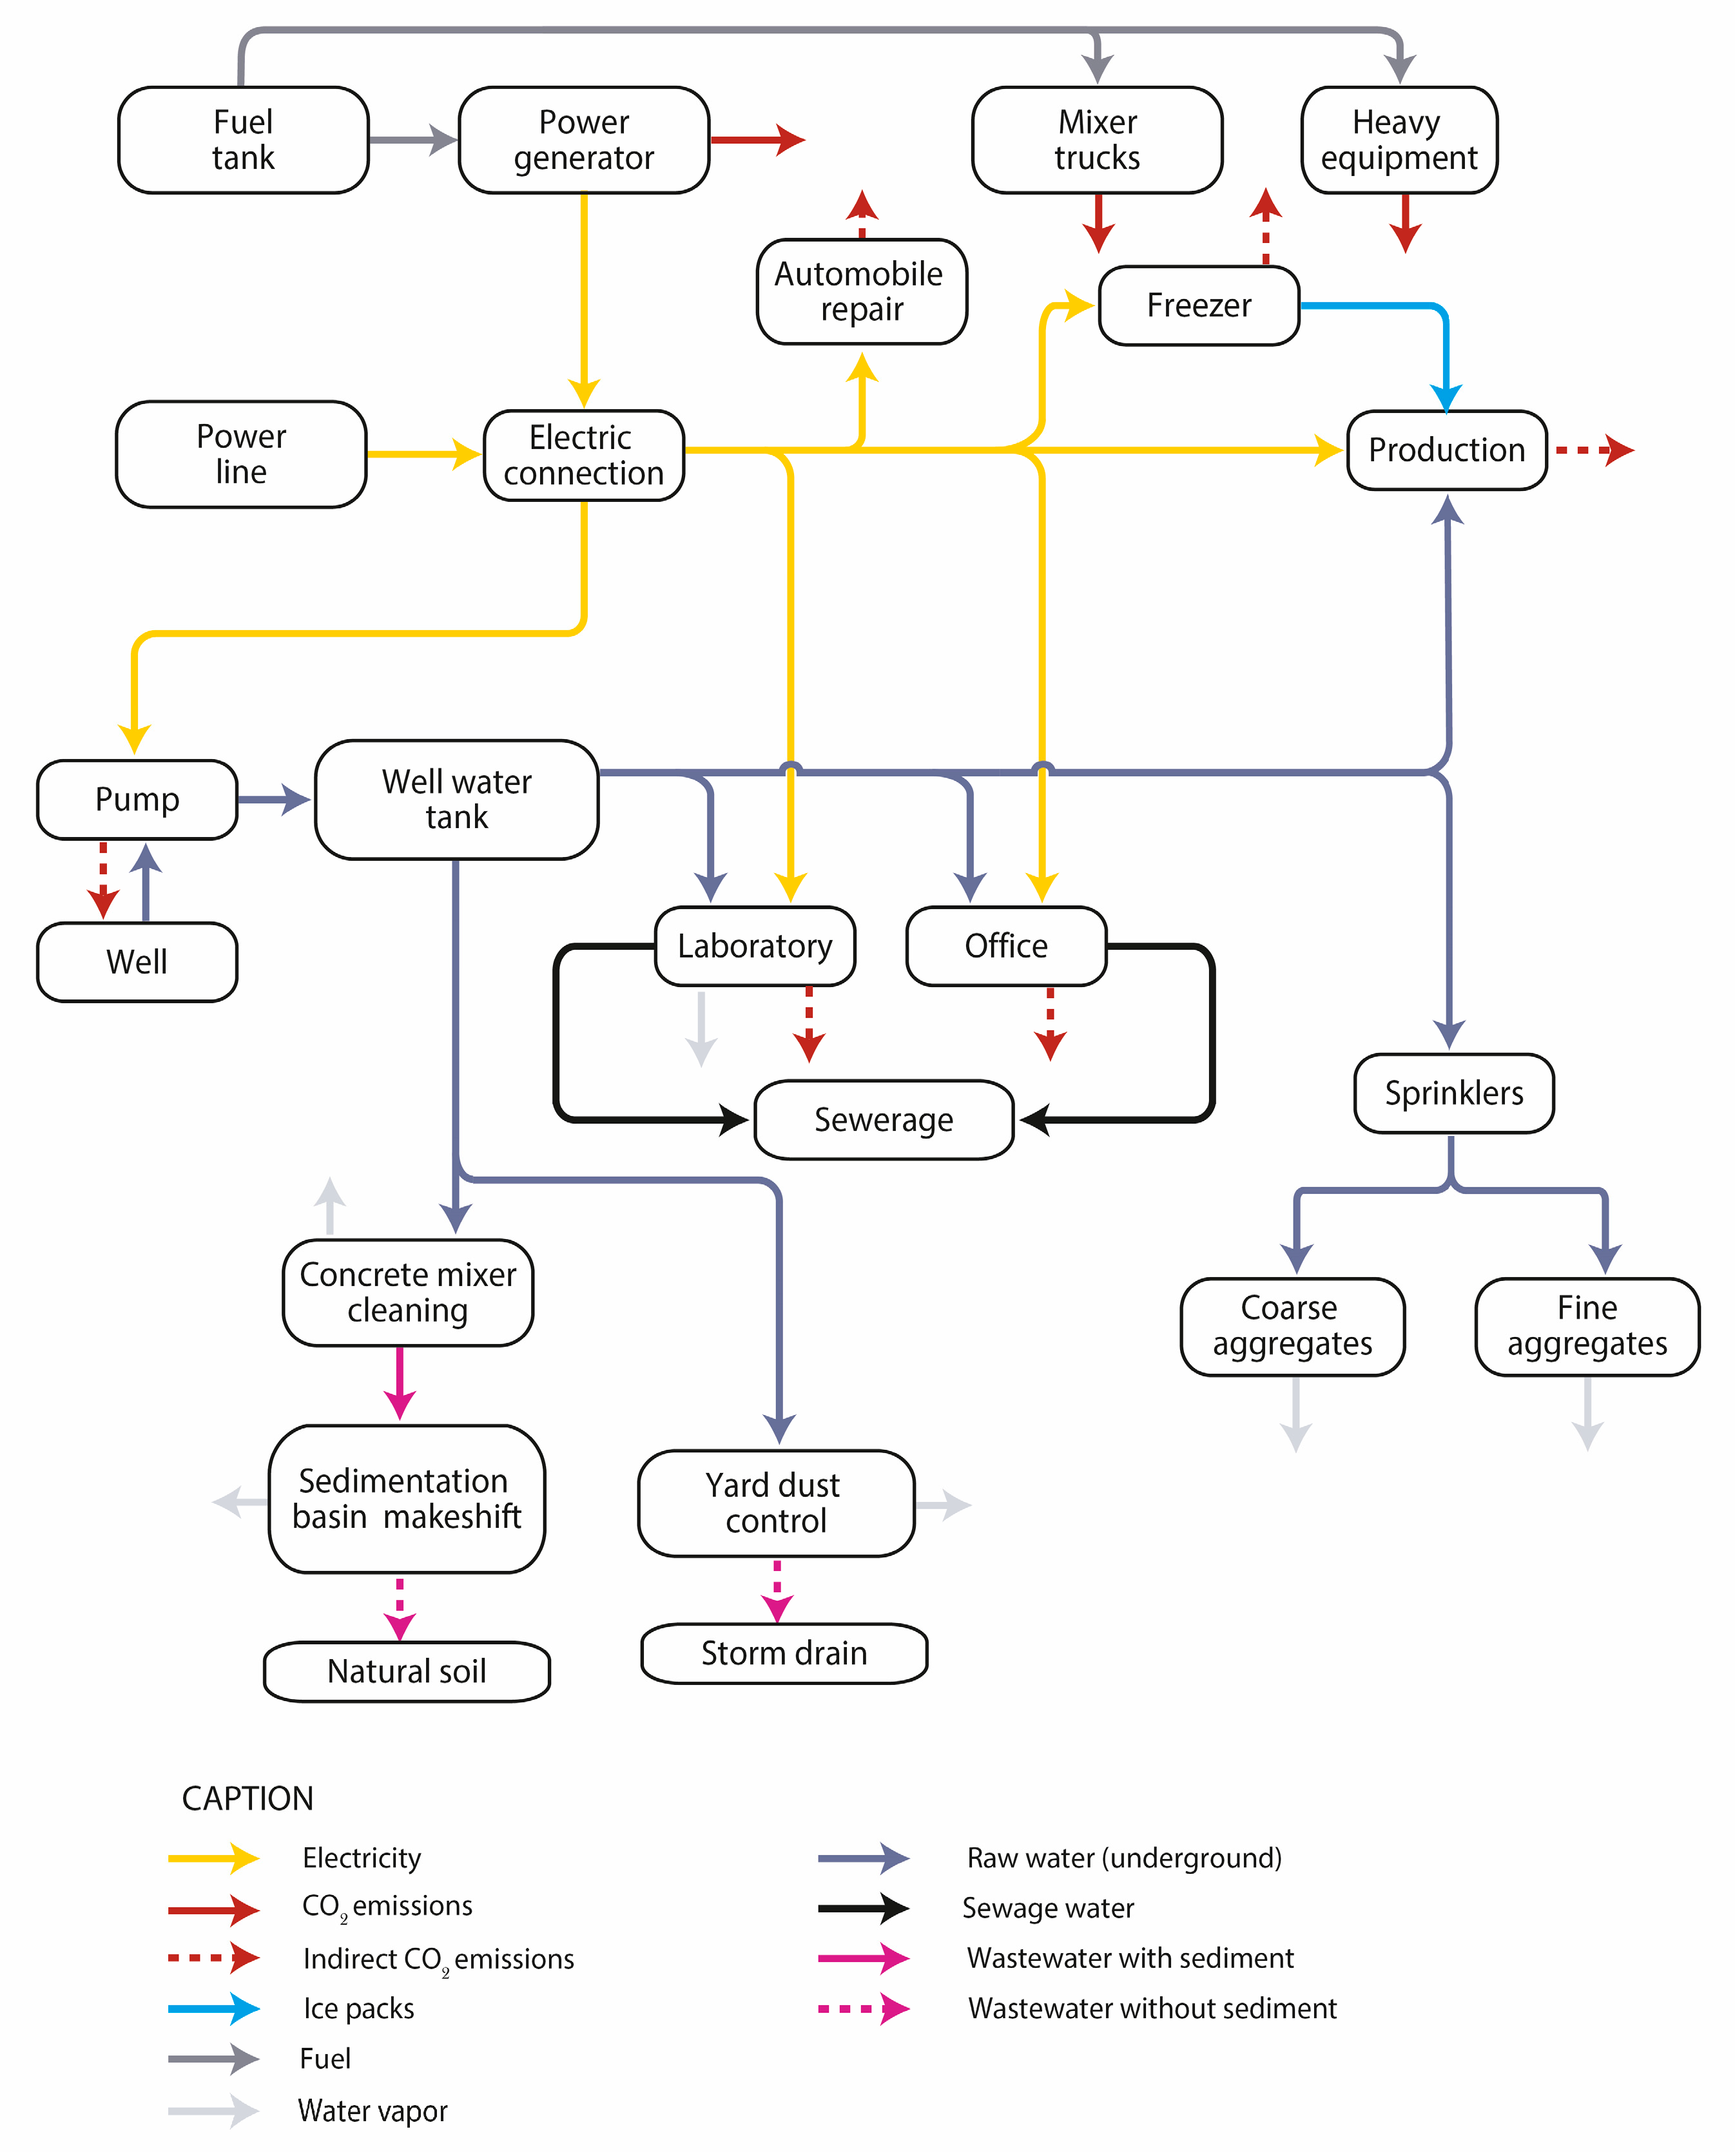
Figure 3) being established as the “standard plant” in terms of process inputs and outputs. The rest of the detailed flowcharts of concrete production technology routes can be found in
Appendix A,
Appendix B,
Appendix C,
Appendix D and
Appendix E. Plant #1 is in an urban area and has water inlets from the public supply and from underground water extraction wells. The water is used for production, truck washing, cooling, moisture control (of aggregates), and in office and laboratory facilities. It is connected to the electrical supply that powers all the machinery. As it is connected to power lines, carbon dioxide emissions are estimated indirectly by using the consumption of the machines. On the other hand, it has a fuel tank (diesel) that feeds the generator, mixer trucks, and weighing equipment. The burning of this fossil fuel directly generates CO
2 emissions. This structure of a connection to the power line and a fuel tank is a standard feature of ready-mix concrete plants.
3.2. Similarity Dendrograms Based on Flowchart Data Analysis
After obtaining the flowcharts of the 20 concrete production plants, an analysis was carried out using the database that contained detailed information on the sources, storage, outputs, and destination of water, as well as energy use, CO2 reuse (particular cases), and direct and indirect emissions. This analysis was carried out qualitatively, based on the processes identified and documented in the forms completed during the technical visits and interviews. During previous meetings with concrete producers, it was established that, in the national context, there is no specific quantitative data (by process) for concrete production. For this reason, the analysis with dendrograms focused on identifying the most and least common processes, as well as those that are more and less sustainable, from the perspective of potential environmental impacts. This allows producers to understand which processes need priority for the implementation of independent measurements, considering that this will be a gradual process for the country, given the initial state in which the collection of sustainability data in the industry is.
Plants #2 through #20 were grouped according to the 75% similarity obtained from the dendrogram clusters carried out by considering all inflow and outflow of water and energy in the 20 concrete production plants visited. This was carried out in order to ensure a grouping based on similarities and, at the same time, highlight peculiar cases. This resulted in five clusters of plants.
Cluster A: Plants #4, #5, #6, #7, #14, #17, #19, and #20: This is the group with the largest number of plants; these are most similar to plant #1 in terms of general aspects regarding their common reliance on both well water and potable water as main sources, as well as their use of ice cubes in the production process. Six out of eight plants reuse sediment-free wastewater in at least one stage. Half of them use chillers for cold water, whereas the other half do not, and all have concrete sedimentation tanks and septic tanks for black water disposal. Most plants discharge wastewater into storm drains, and all plants use diesel fuel, with seven connected to the electrical grid. All plants emit direct CO
2, with seven measuring indirect CO
2 emissions, and only plant #20 uses CO
2 introduction as an additive in its mix. These shared characteristics of water and energy management, alongside similar emission practices, justify their classification into a single cluster (the specifications and flowcharts for each plant in this cluster can be found in
Appendix A).
Cluster B: Plants #9, #10, #11, and #12: These plants utilize groundwater as their main water source, with plant #10 additionally implementing rainwater harvesting. Furthermore, all facilities employ ice cubes for temperature control in their processes. Notably, plant #11 utilizes chilled water, highlighting a distinct approach to cooling compared to the others. In terms of water management, three plants incorporate sedimentation basins. Regarding wastewater disposal, three plants direct their sewage into sanitary sewer systems. Each facility operates using diesel fuel and maintains connectivity to the electrical grid, relying solely on diesel-powered generators in emergency situations. Importantly, all plants exhibit direct emissions of CO
2 and actively monitor their indirect emissions (the specifications and flowcharts for each plant in this cluster can be found in
Appendix B).
Cluster C: Plants #8, #13, #15, and #18: All these plants rely on public water supply as their main water source. Three plants utilize ice cubes in their processes, while plant #8 uses flaked ice. In terms of water reuse, three plants reuse sediment-free wastewater in their operations. All plants incorporate concrete sedimentation basins, and most manage their wastewater using septic tanks. Additionally, two plants discharge their residual water into storm drains, and two discharge into natural bodies of water. Energy-wise, all plants are connected to the electrical grid and use generators only in emergencies. In terms of environmental impact, all plants share the characteristics of producing direct CO
2 emissions, monitoring their indirect emissions, and not using CO
2 additives (the specifications and flowcharts for each plant in this cluster can be found in
Appendix C).
Cluster D: Plants #2 and #3: Both plants primarily utilize potable water, with plant #2 additionally incorporating rainwater harvesting and well water, while both use chilled water and cubed ice. Each facility actively reuses sediment-free wastewater in at least one process and is equipped with concrete settling tanks. In terms of wastewater disposal, both plants direct their treated water into natural bodies of water. Furthermore, both facilities operate on diesel fuel, are connected to the electrical grid, and rely on generators only during emergencies. All plants exhibit direct CO
2 emissions and monitor their indirect emissions; however, only plant #3 utilizes CO
2 additives in its mix (the specifications and flowcharts for each plant in this cluster can be found in
Appendix D).
Cluster E: Plant #16: This is a temporary plant created only for specific projects, in which mainly well water and reused wastewater without sediments are used in simple processes. It has a temporary septic tank; the destination of its wastewater is the same continuous land because it does not have any connection and has a small concrete sedimentation tub. Because it is temporary, it does not have a connection to power lines but works completely with a generator driven by diesel, with diesel used for the equipment. It does not estimate its indirect CO
2 emissions or use CO
2 additives (the specifications and flowchart of the plant in this cluster can be found in
Appendix E).
3.2.1. Water, Energy, and CO2 Emissions Flows
This general dendrogram of similarity (from which clusters were identified) illustrates the variability in water and energy consumption among concrete production plants. This dendrogram provides insights into how these variables are inter-related and highlights the greater impact of water consumption variability compared to energy consumption.
The combined dendrogram for both water and energy consumption (
Figure 4) showed that 13 clusters were needed to achieve a 90% similarity, 5 clusters for 75% similarity, and 2 clusters for 60% similarity. This indicates a higher weight of water consumption variability compared to energy consumption.
In addition to this general similarity dendrogram, which integrates all water and energy flows, individual dendrograms were developed for each of these indicators. This made it possible to distinguish each indicator independently and analyze the lack of homogeneity in the processes of the production plants from the two main variables of the study: water consumption and management and energy use. By performing this separate analysis, it was possible to more accurately identify variations in practices and technologies related to water and energy use at each plant, evidencing sustainability patterns and areas with the greatest need for standardization in the industry. This methodology helped to highlight the disparity in resource management and to lay the groundwork for differentiated approaches to the improvement of each environmental indicator.
3.2.2. Energy and Fuel Consumption at the Concrete Production Plants Visited
When analyzing energy and fuel consumption flows alone (
Figure 5), in contrast to water consumption, the plants could be grouped into three clusters for a 90% similarity and two clusters for 75% similarity.
Of the 20 concrete production plants visited, 18 are connected to the local power grid, while the remaining 2 mobile plants rely entirely on alternative electricity sources. Among the grid-connected plants, three experience frequent power outages and must switch to backup power during these interruptions. One permanent plant relies solely on the grid but is located in an area with a stable power supply. The two mobile plants utilize diesel-powered generators daily, while five of the fixed plants use generators intermittently to compensate for outages. These generators, essential for maintaining operations during disruptions, run on diesel fuel and require weekly maintenance to ensure efficiency and reliability.
Electricity consumption is measured via utility bills for the 18 grid-connected plants, providing clear insight into their energy use. In contrast, the two mobile plants estimate their electricity consumption based on the amount of fossil fuel used by their generators.
All plants operate vehicle fleets powered by diesel, generally consisting of 6 to 15 mixer trucks per plant, although one larger plant maintains a fleet of 26 to 30 trucks. Additionally, heavy machinery such as front loaders is used for handling aggregates and other on-site processes. A total of 18 of the plants have on-site diesel storage tanks for refueling, while the remaining 2 depend on external fueling stations.
Regarding emissions, all 20 plants track their direct CO2 equivalent emissions, while 18 also calculate their indirect emissions, providing a comprehensive understanding of their environmental impact.
3.2.3. Water Consumption and Disposal at the Concrete Production Plants Visited
When analyzing water consumption flows alone (
Figure 6), it was necessary to group the concrete production plants into 14 clusters to achieve a 90% similarity, 7 clusters for 75% similarity, and 3 clusters for 60% similarity.
For the variables related to water flows, water sources, storage, types of outflows, and destinations, the study identified several key patterns.
Regarding inflows, 19 out of the 20 plants use cubed ice to lower the temperature of the concrete during mixing, while one plant uses flaked ice, which, due to its shape and size, absorbs more heat and significantly reduces the temperature [
34]. The most common water source is raw well water, used in 15 of the plants. Water treated using sedimentation processes in concrete basins—which have between one and four sedimentation stages depending on the plant—is referred to by plant managers as “tinas de sedimentación” (settling tanks). This treated water is used in 15 plants, primarily for yard washing, with some plants also utilizing it for wetting aggregates, truck washing, and, in rare instances, mixing.
Potable water from the public supply is used by 14 plants, which is essential for them in concrete production; those without access to potable water rely on raw well water for the mixing of concrete. Less common sources include cold water, rainwater, and natural bodies of water. Eight plants use cold water from chillers in the mixing process, two collect rainwater for specific uses, and one plant sources water as a backup from nearby bodies of water using tanker trucks.
In terms of storage, the eight plants using cold water require chillers, with four of them also having dedicated tanks to store and maintain water at the desired temperature. Raw well water is the most stored source, held in tanks at 14 of the 15 plants that use it. Of the 14 plants using potable water, 7 have tanks to store it as a backup in case of supply disruptions. One of the two plants collecting rainwater stores it in tanks for distribution across various processes.
For outflows, all 20 plants have the same categories of discharge: blackwater, wastewater with sediments, sediment-free wastewater, and water vapor. The proportions vary depending on each plant’s treatment and sedimentation systems. Disposal methods for blackwater include connections to sanitary sewers in 4 plants, closed septic tanks in 14, and temporary septic tanks for the 2 mobile plants. Sediment-free wastewater is handled differently: in 11 plants, it is discharged to storm drains, 8 treat and release it into bodies of water, 6 connect to the storm sewer, 2 direct it through collection channels within the plant’s terrain, and 1 discharges directly onto adjacent natural land.
As for the destination of wastewater with sediment, 18 plants send it to concrete settling tanks, 1 uses rudimentary excavated tubs for dredging, and 1 combines both a tub and an excavated area for this purpose.
This greater variability in water consumption is consistent with the limited regulations overseeing water use in concrete production processes in Panama. The fewer regulations and greater variability reflect how water is utilized differently across plants, influencing the overall environmental indicators. This highlights the need for more stringent regulations and standardized practices to manage water consumption effectively in the concrete production sector.
4. Discussion
In Panama, improving water and energy efficiency in industrial processes has a significant impact on public health and quality of life [
7,
8]. Furthermore, evaluating these environmental aspects would help mitigate potential environmental impacts such as water scarcity resulting from high water consumption in vulnerable areas and climate change driven by energy-intensive activities and CO
2 emissions [
14,
16]. As the country grows, efficient resource management reduces pollution, conserves scarce water resources, and lowers CO
2 emissions. These practices improve air and water quality, which are associated with respiratory diseases and waterborne illnesses [
35]. Additionally, energy-efficient technologies support sustainable economic growth by creating jobs and lowering operational costs for businesses [
36]. This not only benefits the environment but also enhances the well-being and living standards of Panamanian communities.
Although waste generation is not within the scope of this study, it is another relevant environmental aspect that should be considered in the implementation of a circular economy approach in the construction industry [
37].
The implementation of best practices in concrete plants in Panama has both significant technical and economic potential implications [
38,
39,
40]. Measuring environmental indicators, such as water, energy, and CO
2 emissions, would provide critical data for decision making, aligning with the “Reduce tu Huella” initiative and enabling companies to standardize reporting and improve sustainability. Practices such as water recycling and rainwater harvesting can reduce operational costs by minimizing reliance on the public water network and lowering energy needs for groundwater pumping. Renewable energy adoption, such as solar panels, is highly feasible given Panama’s climate and could significantly cut fossil fuel consumption, enhancing both sustainability and cost efficiency. The roof of the aggregates is used for temperature control, reducing water spraying demand. However, this might be used for rainwater harvesting and solar panels as well. Regular maintenance of vehicles and equipment further reduces diesel usage, supporting environmental and economic goals. Two of the visited concrete plants have implemented the injection of CO
2 into the concrete mix. Although this practice reduces (in theory) the carbon footprint, it also demands energy for CO
2 storage. Therefore, further studies might be needed to validate this practice as sustainable [
41].
While upfront investments are required for monitoring systems and renewable energy infrastructure, the long-term benefits include reduced resource consumption, lower operational costs, and compliance with emerging national standards [
42]. Additionally, improving water and energy efficiency contributes to public health, reducing pollution, and enhancing community well-being [
43]. The openness of companies to collaborate with academia underscores the feasibility of these innovations in Panama. Overall, these best practices not only enhance environmental performance but also position companies for sustainable growth in a competitive industry.
Concrete production is a lot more complex than what is usually perceived. Several technological routes could be used for the same end product: concrete. Furthermore, the different processes—water, energy, and CO2 flow—from each technological route can influence the environmental performance of different concrete production plants regarding water, energy, and CO2 emissions. There is a need to raise awareness among small, medium, and large concrete-producing companies of the collection of information on the environmental performance of their operations.
Most research has focused on cement production due to its substantial contribution to CO
2 emissions. Concrete production, on the other hand, has received less attention. Therefore, environmental studies on concrete production are needed, especially in Panama, where numerous companies and plants are involved in this activity, whereas cement and clinker plants are relatively scarce. The existing best practices related to concrete are mostly geared toward reducing the cement and clinker content in concrete mixtures [
44]. For example, Habert et al. [
2] emphasize practices for both the cement and concrete industries, advocating for optimized concrete structure designs to minimize volume, reduce cement consumption, and lower clinker content, primarily to mitigate CO
2 emissions. Nevertheless, studies addressing the environmental performance of concrete production processes themselves are lacking.
No studies have been found in the literature that comprehensively characterize concrete production in terms of environmental flows such as water and energy usage. While some mention variability in environmental indicators, the detailed technological routes involved in concrete production remain understudied. This gap underscores the importance and novelty of the present study, which seeks to address this critical issue in a local context. Based on technical visits and interviews with representatives of the 20 concrete production plants, the different sources and uses of water and energy, as well as CO2 emissions, were identified.
Many different water sources were identified. This is critical for integrated water resource management in water-stressed regions [
45]. Regarding energy, most of the concrete plants are connected to the power lines, and all of them use fossil fuels for concrete transportation and other activities. The use of CO
2 in the concrete mix was observed in two of the visited concrete plants. This flow is constantly measured. However, CO
2 emissions could not be directly measured; they could be estimated based on electricity and fossil fuel consumption. Some of the differences in the processes for water and energy sources respond to local conditions such as climate and locally available resources and technologies. Nonetheless, there is potential for innovative applications that could be adapted to local conditions.
The first best practice worth mentioning is the measurement and monitoring of environmental indicators, as observed in some companies; this could be an opportunity for improvement in other companies. Some of the companies are even subscribed to the environmental assessment initiative “Reduce tu Huella” (Reduce your Footprint) [
46] in its two modalities of water footprint and carbon footprint. It was also observed that some companies use the Global Reporting Initiative Standards (GRI) [
47], and one of the companies follows the Concrete Sustainability Council Certification System [
48]. Measuring each concrete plant’s water and energy consumption as well as CO
2 emissions is the base for decision making and future actions towards reducing these environmental aspects.
The relevance of this study is further emphasized by its alignment with the “Reduce tu Huella” initiative. This program is set to become a national standard, making it critical for concrete production studies to align with its methodologies and requirements. By utilizing this tool, the study not only contributes to a better understanding of environmental impacts but also supports the future implementation of standardized practices in the industry. The standardization of data collection and reporting—as advocated for by the “Reduce tu Huella” initiative—is crucial for ensuring consistency and comparability of environmental performance across different concrete plants in Panama.
However, not all the plants that were visited carry out periodic measurements, and most of the concrete plants only measure total energy (fuel and electricity) and water from the public water network since these are the resources they must pay for. Even though not all concrete plants are currently measuring environmental indicators, the engineers in charge have shown interest in implementing this practice.
Other best practices include water recycling within the concrete plant since many processes, such as washing the yard, dust control, etc., do not require potable water. Many studies even explore the use of recycled water and alternative water sources in concrete production [
49,
50]. Unfortunately, not all concrete plants have implemented water recycling practices. Rainwater harvesting is another best practice that would reduce the pressure on the public water network and reduce the need to extract groundwater, which also entails energy consumption for pumping the water. This practice has great potential in Panama due to the heavy rainfall that the country receives during most of the year [
32]. However, special attention must be given to the quality of the water, which could vary greatly but could still fulfill certain uses [
51].
The aggregate spray process can increase water consumption when aggregates are not indoors and when sprinkling is not controlled. Having the aggregates indoors for temperature control reduces the frequency of water sprinkling and the need to use water cooling systems that require electricity. Moreover, regarding energy, there is huge potential for implementing renewable energy sources using solar panels, for instance. As well as with rainwater harvesting, solar energy has great potential due to Panama’s climate [
52]. Regarding diesel consumption, some of the companies have stated that one of their strategies for reducing it is to have regular maintenance services for their concrete trucks and other equipment. However, this is not the case for all concrete plants that were visited.
It is worth noting that there is a potential link between water consumption and energy consumption for many of the processes [
53]. A water reduction in one process could mean an increase in energy consumption and vice versa; therefore, both environmental aspects should be considered in sustainable concrete production. Furthermore, being more efficient in water and energy consumption would contribute to reducing operational costs for the concrete-producing companies, which would be a benefit that, together with reducing environmental impacts, could lead to sustainable concrete production. Further analysis of these primary data, which will establish a statistical relationship between energy consumption per cubic meter of concrete produced and water consumption per cubic meter of concrete produced, is needed.
The technical visits revealed that the concrete-producing companies are open to working with academic institutions to adopt sustainable practices. This study is innovative as the first instance of industry and academics working together on a research project aimed at practical applications for sustainable development in the Panamanian concrete production sector. Measurements based on an established reference framework of water, energy, and CO2 emissions will not only bring environmental benefits by being useable toward implementing practices that reduce the potential environmental impacts associated with the production of concrete but also imply economic benefits since, by reducing resource consumption, a company’s operational costs are reduced.
5. Conclusions
This study provides a comprehensive characterization and comparison of concrete production processes in Panama, focusing on water, energy, and CO2 flows per process to identify opportunities for improvement. It addresses significant research gaps by providing qualitative primary data from 20 concrete plants, offering valuable insights into resource use and environmental impacts. These findings contribute to adaptation and mitigation efforts in alignment with national and international sustainability initiatives.
The analysis revealed substantial variability in technological routes and resource consumption practices among the studied plants, with no standardization in their processes. The clustering analysis grouped the plants into a model plant and five additional clusters based on resource use and methodologies, highlighting water usage and sources as the most diverse factor. Few concrete plants currently implement water-efficient practices; however, the exceptions demonstrate the industry’s potential to adopt and benefit from such improvements.
Energy consumption was more uniform, with 90% of the plants connected to the national power grid, supplemented by diesel generators during power outages. Yet, the potential for renewable energy implementation, particularly solar energy, remains largely unexploited. Panama’s climatic conditions present an ideal opportunity for adopting solar energy, which would reduce reliance on fossil fuels.
The identified best practices provide a roadmap for improvement. These include monitoring environmental indicators to guide decision making, implementing water recycling, harvesting rainwater to reduce pressure on public water networks, and adopting solar energy. Regular maintenance of equipment was also highlighted as a strategy to lower fuel consumption and CO2 emissions. Further studies on the energy implications of CO2 injection technologies are also necessary to refine their sustainability potential.
These measures not only reduce environmental impacts but also offer significant economic benefits, such as decreased operational costs, aligning with Panama’s national sustainability initiatives. Standardized guidelines and comprehensive data collection are essential to ensure consistent and impactful sustainability practices across the sector.
Future research should prioritize collecting quantitative process-level data to enable comprehensive water and carbon footprint assessments. Furthermore, the trade-offs between water and energy consumption should be explored.
For the Panamanian concrete industry, this study demonstrates the potential to lead regional sustainability efforts by adopting and standardizing best practices. Internationally, the findings provide a framework for industries in similar contexts to address resource inefficiencies and environmental challenges. By providing foundational data and actionable recommendations, this research lays the groundwork for long-term improvements in the concrete industry.
_Su.png)


