1. Introduction
The European Union’s (EU’s) Common Agricultural Policy (CAP) serves as one of the most significant policy frameworks designed to support the agricultural sector across its member states. Established to address the evolving challenges of agriculture, the CAP key objective for 2023–2027 is to support sustainable agricultural income and the resilience of the agricultural sector [
1]. As a result, it is expected to improve long-term food security and agricultural diversity, as well as to ensure the economic sustainability of agricultural production. These goals are achieved through a system of financial support and policy measures organized into two primary pillars. The first pillar includes direct payments to farmers and market measures to stabilize agricultural markets, while the second pillar focuses on rural development programs, which address structural issues, environmental sustainability, and the generational renewal of the farming population [
2].
The second pillar’s rural development national programs contribute to the sustainability of agricultural production through measures aimed, among other things, at ensuring the renewal of generations in the agricultural sector. The aging of the rural population is a serious problem for the development of the agricultural sector in Greece, as in the European Union. To address this issue, the CAP’s rural development programs emphasize measures aimed at attracting young people to agriculture and supporting their establishment in the sector. One such measure is the “first establishment of young farmers” initiative, which provides targeted financial assistance and support to individuals under 40 years old who aspire to pursue farming as a profession. By lowering barriers to entry and enhancing the competitiveness of young farmers, this measure contributes directly to the renewal and long-term resilience of the agricultural population.
In Greece, as part of the national Rural Development Program (2014–2020), Sub-Measure 6.1 “Establishment of Young Farmers” was established to enhance farm competition through the inclusion of young people in the country’s agricultural activities. According to the ministry’s official data, the initiative was well-received and participated in by beneficiaries around the country [
3].
Despite the apparent success of Sub-Measure 6.1 in attracting young participants, there has been limited academic exploration into the satisfaction levels of these beneficiaries or the program’s overall effectiveness in achieving its stated objectives. Evaluating participant satisfaction is crucial for understanding whether the program’s design, implementation, and outcomes align with the needs and expectations of young farmers. Such insights can inform future policy development, ensuring that measures targeting young farmers are both impactful and responsive to the challenges they face. Moreover, assessing the program’s ability to retain young entrants in agriculture is essential for determining its long-term contribution to the renewal of the rural population and the sustainability of the sector.
The main objective of the present research is to ascertain the level of satisfaction among young farmers participating in Sub-Measure “Establishment of Young Farmers” of the RDP 2014–2020. The research was conducted using the Multi-Criteria Satisfaction Analysis (MUSA) method with a sample of 89 young farmers who were located in the region of Central Macedonia in Greece and had successfully completed the program. The final objective was to analyze the effectiveness of the setting up of the young farmers program, trying to answer the question of whether the first settlement incentives can attract and retain young or new entrants in the agricultural area to achieve the goal of renewing the agricultural population in the rural area sector.
To achieve these aims, this study employs the Multi-Criteria Satisfaction Analysis (MUSA) method, a quantitative tool designed to measure and analyze user satisfaction in complex systems. The MUSA method is based on multi-criteria decision analysis and enables the evaluation of satisfaction levels by considering multiple criteria simultaneously. It identifies the areas where beneficiaries’ expectations are being met or exceeded and highlights aspects requiring improvement. By quantifying the importance of various satisfaction dimensions and calculating global and partial satisfaction levels, the MUSA method provides policymakers with actionable insights for optimizing program effectiveness. In the context of Sub-Measure 6.1, MUSA allows for a detailed assessment of young farmers’ experiences throughout the program, from the application process to the realization of program benefits. The following literature review presents fields where the MUSA method has been implemented and justifies the selection of this method for our research.
2. Literature Review
A literature review was conducted to analyze the methodologies used for measuring customer satisfaction for products or services. These studies included mainly research projects on services, especially in the agricultural sector [
4,
5,
6,
7,
8,
9,
10,
11].
The best-known definition of satisfaction is based on Oliver’s Disconfirmation of Expectations paradigm [
12,
13], which defines satisfaction as “the result of a subjective comparison between the customer’s expectations and perceptions”. In order to investigate the degree of satisfaction, the Multi-Criteria Satisfaction Analysis (MUSA) method is used.
The MUSA methodology has been used in many studies to investigate the degree of satisfaction for products and services and to facilitate the decision-making process.
Kitsios et. al. [
14] applied the MUSA method to measure the degree of satisfaction of 142 users of an electronic medical appointment system of a public hospital in Thessaloniki, Greece. The results of the study included that ease of use is a competitive advantage of the platform, while service quality is the most critical criterion, which contributes significantly to user dissatisfaction. Finally, it was found that the quality of the platform’s website is a critical criterion for users.
In addition, another study in which the MUSA methodology was used is that of Drosos et. al. [
15], in which the satisfaction of residential customers with electricity providers in Greece was measured. Specifically, in a sample of 689 residential customers, the results show that they were satisfied with the providers, with the criteria considered being products, services, customer service, and pricing policy. In the context of research to develop strategies to increase the likelihood of customers choosing a pharmacy as their “regular” pharmacy, the study by Glaveli et al. [
16] employed the MUSA method to assess customer satisfaction levels and identify service areas that could provide a competitive advantage for pharmacies. A structured questionnaire was used to collect data from randomly selected pharmacy customers in Thessaloniki. The survey successfully gathered 223 usable responses, which formed the basis of the analysis. The findings highlight reputation, contribution to the community, and professional expertise/behavior of the pharmacist(s) and staff as the criteria that contribute most to customer satisfaction and the choice of a pharmacy as “regular”. In addition, the results of the study suggest that the above variables, combined with a fast and error-free service, respect, and confidentiality, can be used as advantages over the competition. Apostolidis [
17], in his research, seeks the attitudes and opinions of visitors to the Kaimaktsalan Ski Centre, applying the MUSA method to determine the recreational value of the area, which is a pole of alternative tourism options for Northern Greece. The results show how Mount Voras can be sustainably managed through different tourism intervention scenarios, following the European model and the strategies set by the European Commission on climate change.
Bournaris [
18] sought to investigate user satisfaction from the use of agricultural e-government services in Greece. The results showed that the average level of user satisfaction is high, but there are still actions to be taken to improve the e-government services provided, while users attached great importance to the criteria of interaction and accessibility. Drosos et al. [
19] used the MUSA method to find the level of satisfaction of retail customers of four banks in Greece, with the results showing that staff, customer service, products, and services, as much as branch network, are the competitive advantage of banks having high performance and importance. The literature also includes a study by Drosos et al. [
20] regarding the measurement of consumer satisfaction from the use of milk sellers, the cooperative “Thesgala”. Researchers used the MUSA method to examine the degree of consumer satisfaction with the company’s products in terms of prices, human resources, stores, customer service, and the products themselves. With 500 participants, the results of the MUSA method showed absolute customer satisfaction regarding product quality, at a rate of 90.8%.
Ntanos et al. [
21] studied the satisfaction of university students from internship programs, with a sample of 173 students, taking into account the following criteria: effectiveness of the internship, organization, internship subject, and company of implementation. The results showed that the organization of the internship was the most critical criterion, while more emphasis should be placed on the internship object and its effectiveness, which students underestimated. Another study, which concerns cooperatives in Greece, is by Drosos et al. [
22], regarding the degree of satisfaction of the cooperatives from the banking services they received. The results obtained after analyzing 150 questionnaires using the MUSA method showed that the most important criteria of the satisfaction of agricultural cooperatives towards banks were those of products/services and branch/network. These were seen as the competitive advantage that banks should focus on.
Ntereka et al. [
23] applied the MUSA method to identify the level of passenger satisfaction on Greek Railways, with the results showing a very low level of overall passenger satisfaction. Karasmanaki et al. [
24], were also concerned with investigating citizens’ satisfaction with the actions of the state to facilitate investment in renewable energy and identifying the weaknesses of the current investment environment. Using the Multi-Criteria Satisfaction Analysis (MUSA) method, an analysis of eight criteria was conducted, which showed a low level of citizen satisfaction, while the most important weaknesses were related to the licensing process and policies to mitigate fossil fuel monopolies and improve the competitiveness of renewable energy. Another survey of the latter using the MUSA method sought to improve the information disseminated through the media on renewable energy (RE) investments. The results of the survey showed citizens’ dissatisfaction regarding the information they receive from the media on RE, while the lowest satisfaction was recorded for information on available subsidies for RE investments, as well as on changes in the institutional framework. Tiganis et al. (2023) [
25] studied customer satisfaction in small food supply chains, focusing on the marketing mix they use. Through the Multi-Criteria Satisfaction Analysis method of a sample of 766 consumers, it was found that sales and producers are considered the most important elements of the mix, and that they are the competitive advantage of small supply chains, with consumers reporting high satisfaction from them. Sales processes and producers are elements that should be given more emphasis in terms of improvement efforts. Bozic et al. (2024) [
26] used the MUSA methodology in order to assess the quality of air travel services within Croatia between 2016–2018. It was thus found that a traveler’s satisfaction is highly dependent on the services at the departure airport, with the integration of passenger demand levels being a key improvement priority.
3. The Multi-Criteria Satisfaction Analysis (MUSA) Method
Multi-criteria analysis comprises a set of methods, models, and approaches designed to help one or more decision-makers to handle semi-structured decision problems with multiple criteria [
27]. The final question, however, is “why should the company choose the MUSA method?” The answer lies in the fact that it is a simple and understandable method that offers direct answers about customer satisfaction in the form of qualitative data and carries validity through testing (as opposed to applying statistical methods). In particular, the MUSA method stands out from the other methods, as it gives us results that are catalytic in improving the quality system. The purpose of the MUSA method is to synthesize the preferences of a set of customers into a quantitative mathematical value function [
27]. This synthesis is based on a set of criterion variables, which make up an individual’s overall satisfaction. Through the MUSA method, it is sought to estimate the satisfaction of a set of individuals based on the value and preference system of that set, which is considered a whole [
27].
The methodology follows the basic principles of qualitative regression analysis Equations (1) and (2), with restrictions of normalization described by Equation (3), and makes use of linear programming techniques, represented by Equation (4) [
27].
Y* is the collective value function estimate Y*, where
n is the number of criteria and
b is the weight of the
i criterion. The variables σ
+ and σ
− are referred as the overestimation and underestimation errors, respectively [
27]. In order to make the model easier to use and calculate results—linear program—the use of new variables aims to minimize the sum of the error variables.
At this point, the importance of setting variables of underestimation error for each individual customer should be stated. That is because Equation (4) is used for every customer who expressed a definite satisfaction opinion [
18].
In the Action Diagram (
Figure 1) [
27], the MUSA method provides a table divided into four points, on which the satisfaction dimensions are identified, after combining the satisfaction weights and the Average Satisfaction Indexes for each criterion. With the help of the Action Diagram, we identify the strengths and weaknesses of satisfaction and the direction that efforts for improvement should take. The Improvement Diagram, on the other hand (
Figure 2), also consists of quadrants that demonstrate the rate of improvement [
27]. More specifically, they show which dimensions of satisfaction should be improved, without, however, showing the result or the extent of the improvement effort. The Improvement Diagram is formed by the Average Demand Index, the weight of each criterion, and the Average Effectiveness Index, which expresses the level of dissatisfaction offered by a criterion [
27].
4. Criteria and Sub-Criteria
The sample of this survey consisted of farmers from the region of Central Macedonia in Greece who participated in and successfully completed the program. The number of beneficiaries to this measure in the region of Central Macedonia was 3360, while the beneficiaries from all the Greek Regions reached 13,905 [
28]. A total of 150 farmers were selected to participate in the survey using simple random sampling. However, the final number of participants in this satisfaction survey was 89, as the remaining 61 did not wish to participate.
Data collection was carried out through a questionnaire comprising two parts: the first part focused on the demographic characteristics of the farmers, and the second part assessed satisfaction levels in three phases of the program (at the beginning, during the program, and after the completion of the program). The results recorded a generally positive level of satisfaction both with the overall program and partially with the criteria and sub-criteria examined. Furthermore, critical points regarding the importance of the criteria and sub-criteria were identified and, in each case, the priority to be given to their improvement efforts was found. The young farmers who participated in the research exhibited higher satisfaction regarding the Clarity and Duration of the Sub-Measure. Consistency is the most crucial criterion in relation to the others and constitutes a competitive advantage of the program alongside functionality. Sustainability, realism, and duration take precedence in priority, while all criteria are prioritized in improvement efforts, except for eligibility, a criterion which holds the third priority. At the beginning of the program, the most critical sub-criteria, each within its respective category, are the application submission deadline and participation prerequisites. Both the latter, as well as commitments and obligations, the objectives of the business plan, and the application submission deadline, are subject to improvement to the same extent, with priority. Throughout the program, the ability to implement the program and the consistency in payment disbursement were critical for young farmers, while payment application and the consistency of payment disbursement constitute a fundamental improvement priority. Regarding the program’s end, effectiveness in the extent of young farmers’ utilization, as well as the possibilities for development and expansion of operations through the program, are critical for farmers. Focusing on these aspects should initially guide improvement efforts.
The structure of the anonymous questionnaire, as shown in
Supplementary Materials, consisted of two parts: the first one was composed of questions about the demographic data of the participants, but also of questions aimed at collecting data about their farm. The second part concerned exclusively the degree of satisfaction of the participants in the three phases of the Young Farmers program (Graph 9) with regard to some criteria, each of which included sub-criteria (Graph 10). The satisfaction questions were in the form of 5-point Likert scale responses, as they followed the structure of a questionnaire analyzed by the MUSA method [
27] and thus, the second part started with a Total Satisfaction question, followed by questions on the criteria and sub-criteria covering the Young Farmers’ Partial Satisfaction with the Program.
The division of the Program into three phases, as well as the criteria and sub-criteria presented below, were based on the description of the program according to the Hellenic Ministry of Rural Development and Food [
1].
The first phase of the Program, is examined regarding the participants’ satisfaction, is mentioned as “When Submitting the Application”. During that phase, the criteria below were examined:
Duration;
Clarity;
Realism;
Eligibility.
The second phase of the program, which is mentioned as “During the Program”, has been examined regarding the criteria below:
Flexibility;
Functionality;
Consistency.
The last phase is mentioned as “After the completion of the program”, and the criteria which were examined are as follows:
The data were first analyzed using IBM SPSS 25.0 Statistics software, and the descriptive analysis is presented below. Then, using Musa for Windows software, total and partial satisfaction results were obtained, both numerically and in the form of graphs, as presented below.
5. Results
The analysis of the results was made in two phases for each criterion. In the first analysis, the overall satisfaction is presented, while in the second analysis the partial satisfaction of each sub-criterion is analyzed.
At first the demographic data for the sample shows that the majority of young farmers who responded to the questionnaire were male, with an age at the time of application between 25–30 years old. Most young farmers were single, with only 25% declaring themselves married, and their family was mainly composed of three, four, and five members. The majority declared they hold a high school diploma, while a few declared they were graduates of a Higher Education Institution (HEI) or Technical Education Institution (TEI). Young farmers also stated that they had no training related to the Agricultural Sector and that their Individual Annual Income was equal to or less than EUR 7500. In addition, their Family Annual Income was equal to or less than EUR 20,000.
Regarding their holding and their activity, most of them at the beginning of the program had a crop production holding, while few of them declared themselves to have a livestock or mixed production holding. Most of the holdings of the young farmers were located in the prefecture of Thessaloniki, and a very small proportion of the participants in the program had farms in the prefectures of Serres, Chalkidiki, Imathia, Pieria, and Kilkis. The land owned by young farmers was mainly mixed, but there were several rented and few owned. Many of them did not exceed 100 hectares in area when they entered the program. Finally, few of the young farmers indicated that their permanent residence was in a mountainous area and few in a disadvantaged area, with most indicating the “Other” option.
5.1. Overall Satisfaction
Overall, young farmers are satisfied with the program at a rate of 60.7%. In general, however, it can be observed that the positive responses to each criterion are more than the negative ones.
Of the criteria examined, the criterion “Clarity” received the highest number of satisfaction and absolute satisfaction responses, with a percentage of 76.4%. This was followed by the “Duration” criterion with a satisfaction rate of 71.9% and “Functionality” at 62.9%. However, it is important to note that the “Sustainability” criterion received the highest percentage of neutral responses, 40.5%. Moreover, although the average number of negative responses did not exceed 20%, the criterion “Development Opportunities” had the highest percentage of dissatisfied responses, 31%.
Table 4 presents in detail the results for overall and partial satisfaction.
As determined by the MUSA method [
27],
Table 5 displays the weights and the Average Satisfaction, Demanding, and Improvement Indexes of the criteria (partial satisfaction) and total satisfaction.
From the data in the table above, the Action Diagram and Improvement Diagram below were derived. So firstly, in terms of the importance of the criteria, we can see that the most important criterion for young farmers in the program is “Consistency” (17.1%). This is followed by “Duration” (12.2%), followed by “Realism” (11.0%), “Functionality” (10.8%), and “Sustainability” (10.6%). The remaining criteria do not exceed 9%.
In terms of satisfaction, the criterion with the highest satisfaction rate is “Consistency” (86%), followed by “Functionality” (82%), “Clarity” (81.4%), and “Flexibility” (81%). Out of all the criteria, the “Duration” criterion has the lowest satisfaction percentage (33.8%), followed by the “Realism” criterion, both of which have rates below 40%. Overall satisfaction has an index of 59.4%.
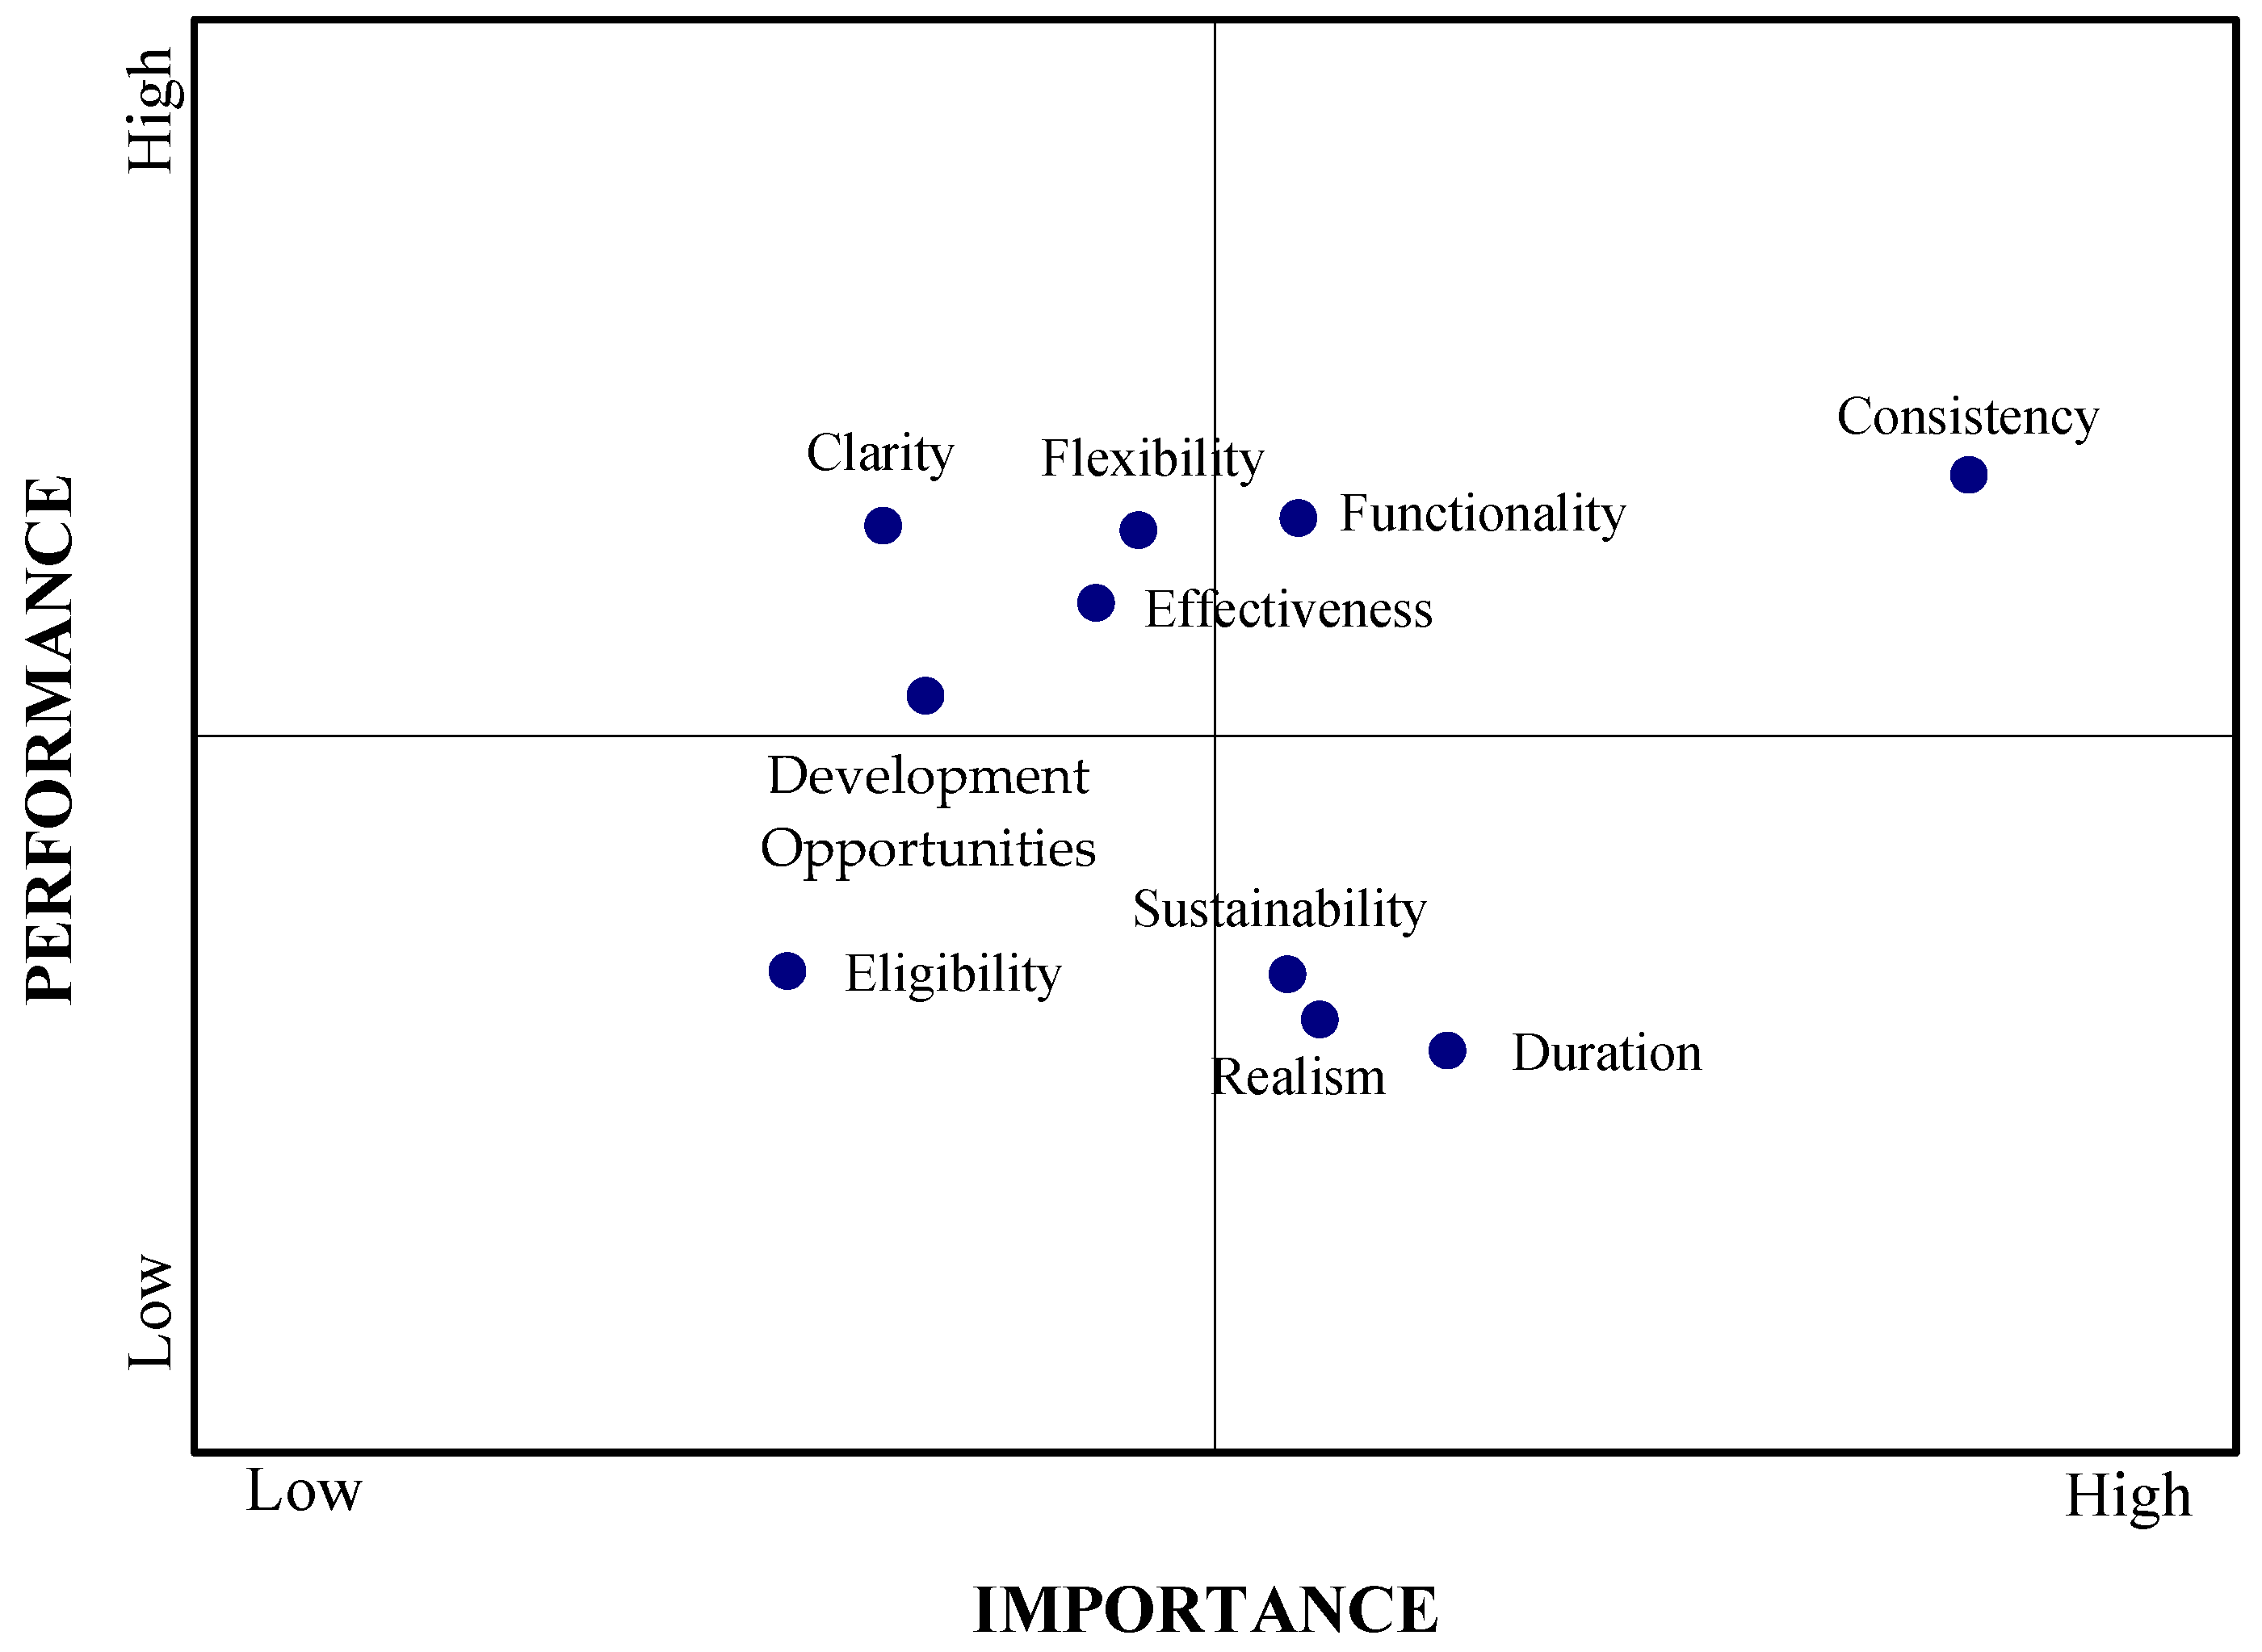
The weights of the criteria combined with the Average Satisfaction Indexes lead to the creation of the Action Diagram (
Figure 3). With the help of the Diagram, the strong and weak points in customer satisfaction and the orientation of efforts to improve them are obtained.
Based on the Action Diagram, it can be seen that the criteria “Sustainability”, “Duration”, and “Realism”, which are priorities of the program, are in the action area, as the young farmers were not satisfied with them (weak points). In the area of strength are ‘Functionality’ and ‘Consistency’, which the young farmers consider important and which they are most satisfied with (comparative advantage). ‘Eligibility’ is located in the area of validity, and although not critical enough at present, it may in the future be a concern for the quality of the program. It is worth noting that the satisfaction of young farmers for this criterion is particularly low. Finally, in the resource transfer area are “Development potential”, “Clarity”, and “Effectiveness”; they are the last priorities, with high performance, despite not being considered important by young farmers.
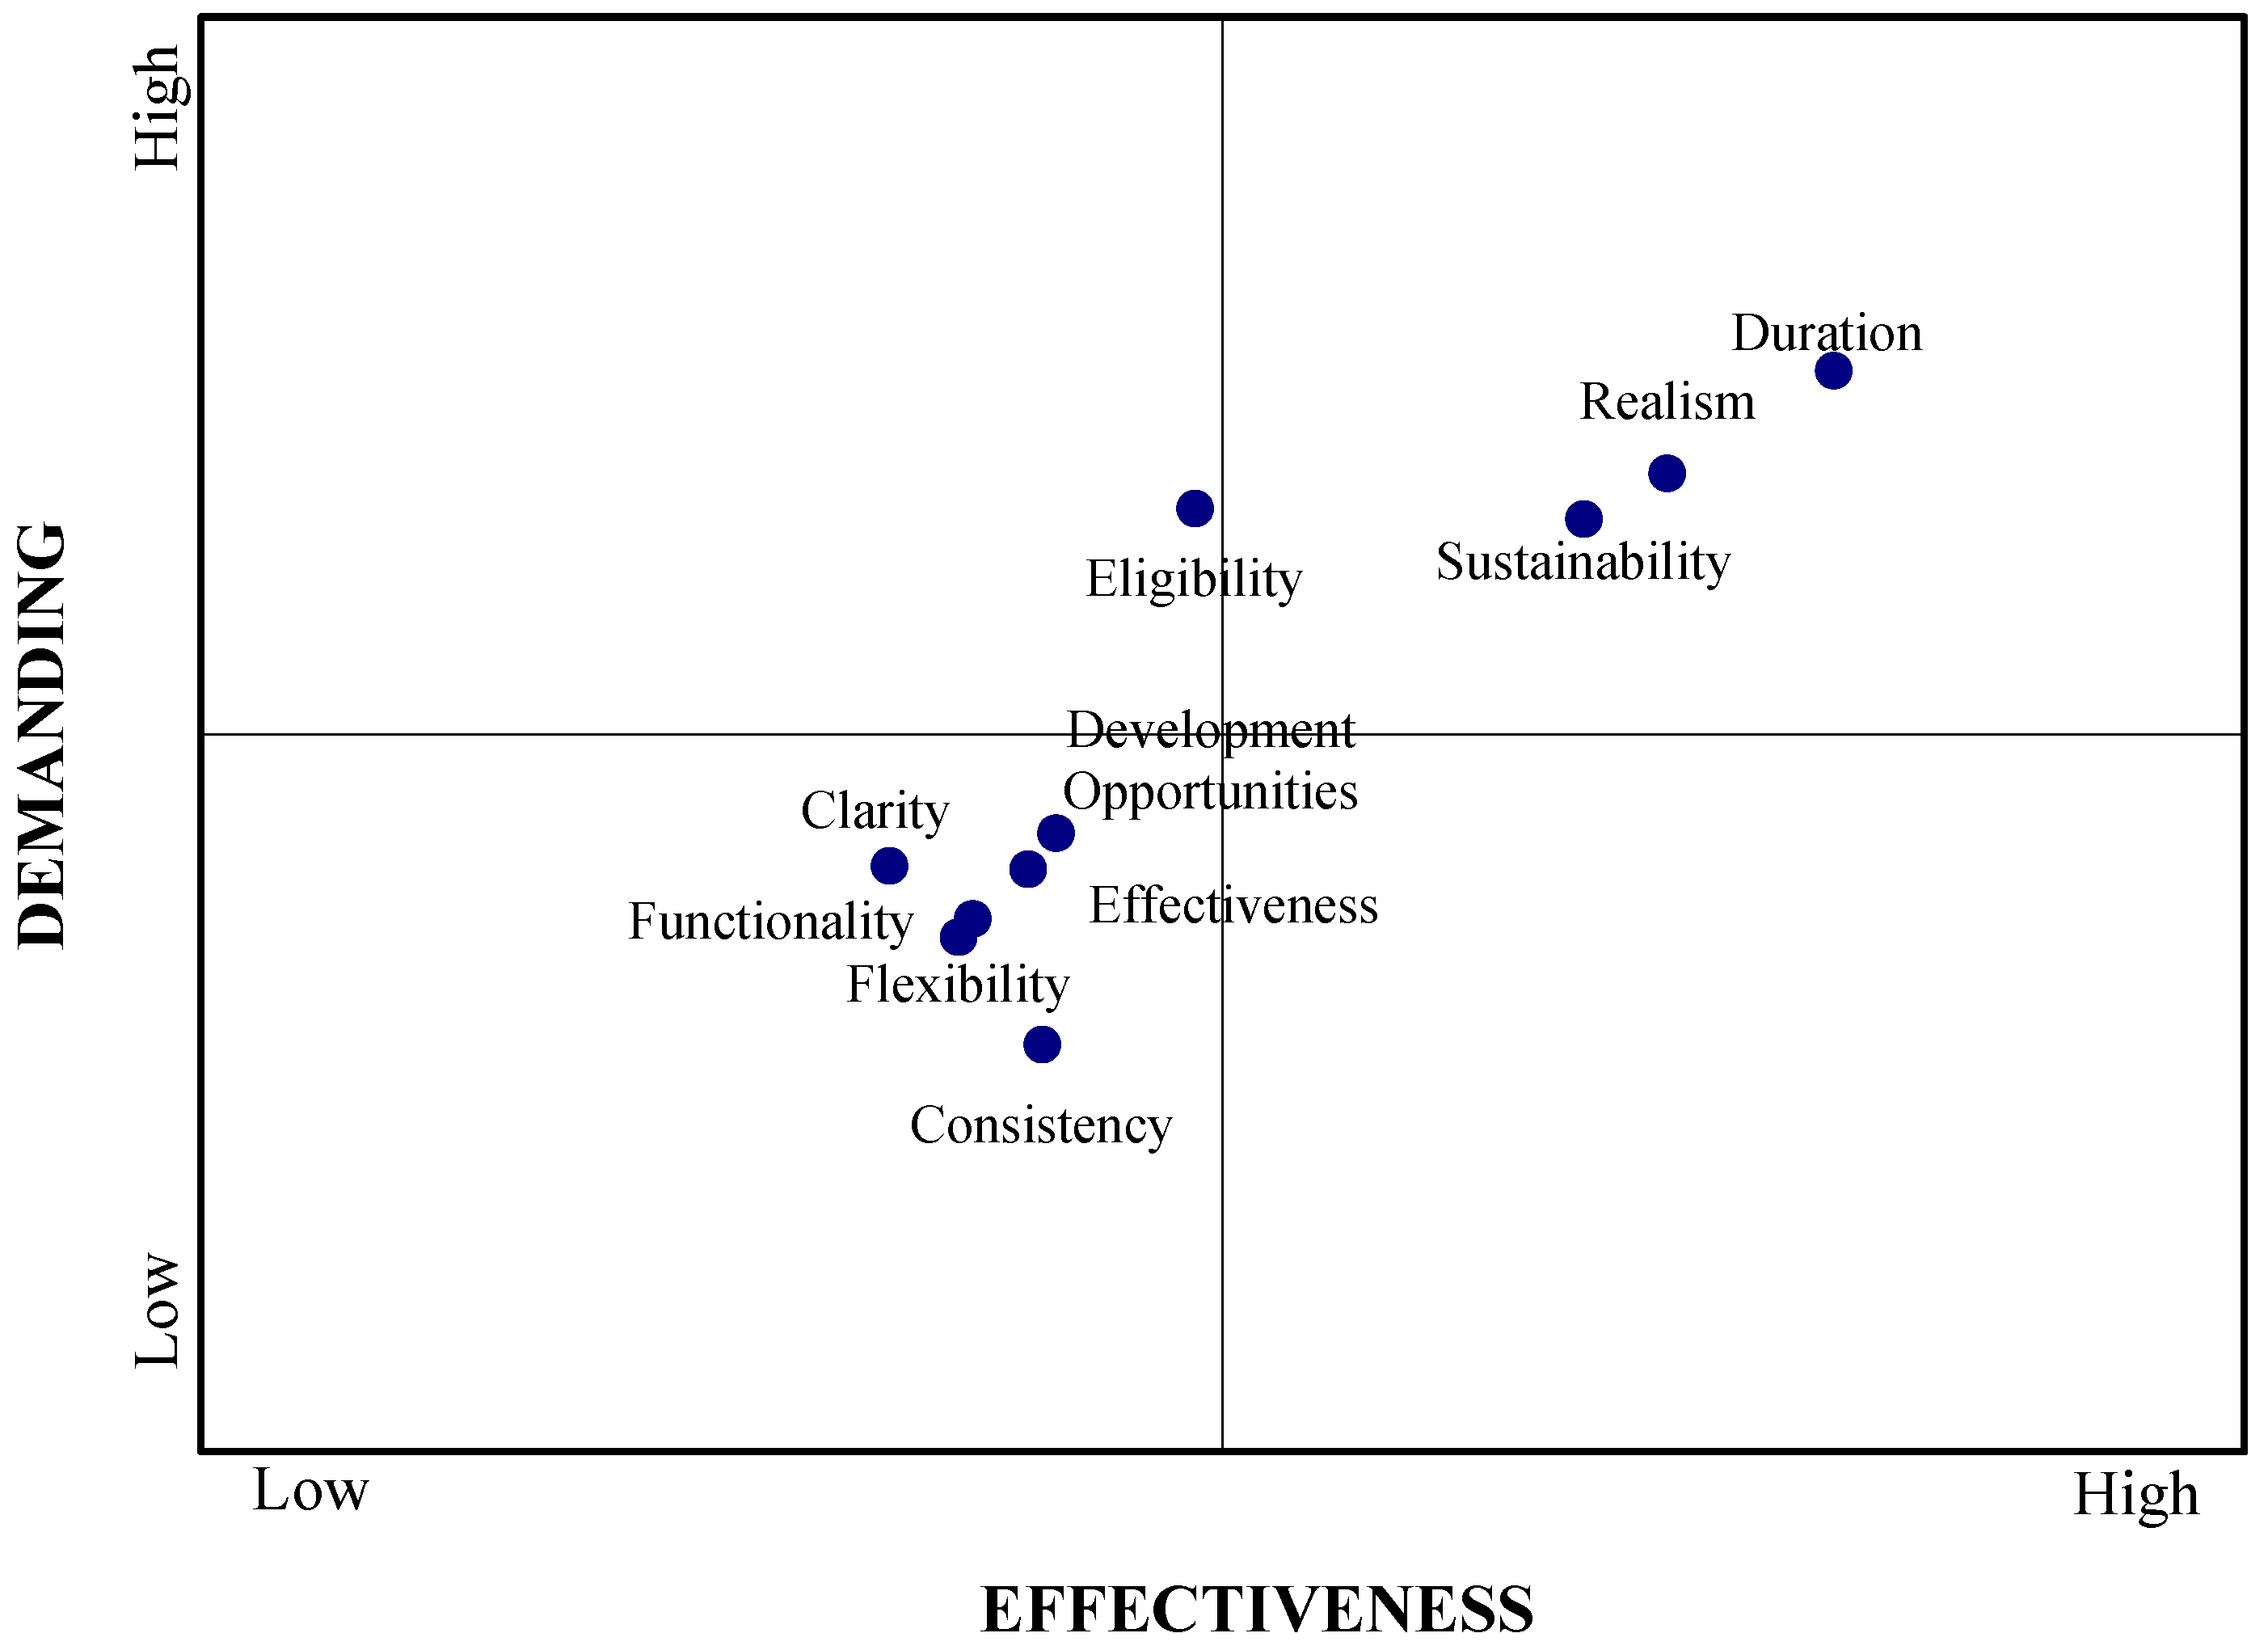
The Improvement Diagram (
Figure 4) is the following figure, and it was created using the average Effectiveness and Demanding Indexes.
It is important to note that, according to the diagram, there is not a single criterion in the first quadrant; that is, no criterion is both so effective and so low maintenance. Therefore, the second priority, which, on the other hand, consists of the criteria in the upper-right and lower-left quadrants, must receive the majority of improvement efforts. This is because practically all of the criteria are positioned in this priority. The criterion for “Eligibility” is the last in line for improvement because the ladder is overly strict and inefficient.
5.2. Partial Satisfaction Analysis Phase 1: When Submitting the Application
5.2.1. Duration
The criterion “Duration” is examined in the first phase of the program, during the application period, and comprises four sub-criteria, as seen in
Table 6.
Based on the data presented in
Table 6, it can be observed that young farmers expressed general satisfaction with these sub-criteria. Notably, the sub-criterion “Duration of the Application Deadline” received the highest percentage of satisfied responses (78.6%). Other sub-criteria that received high satisfaction rates were “Duration of collection of supporting documents” (74.2%) and “Duration of the program” (68.5%). Finally, “Duration of payment phases” has gathered the highest dissatisfaction rate of 24.7%.
The weights for the sub-criteria of the criterion “Duration” are shown in
Table 7, along with the Average Satisfaction, Average Demanding, and Average Improvement Indexes. Through this data, the action and Improvement Diagram for this criterion were derived.
Thus, based on the weights, it can be seen that the most important sub-criterion for young farmers is “Application Deadline” (54.4%), which also has with the highest satisfaction rate (97.5%). In terms of weight and Satisfaction Index, “Duration of collection of supporting documents” is also important with rates of 25% and 94.5%, respectively. Young farmers deemed the “Duration of the program” sub-criterion as essential, giving it a low weight of 12.4% and an Average Satisfaction Index of 86.4% and finally “Duration of payment phases” had the lowest weight of 8.2% and an Average Satisfaction Index of 77%.
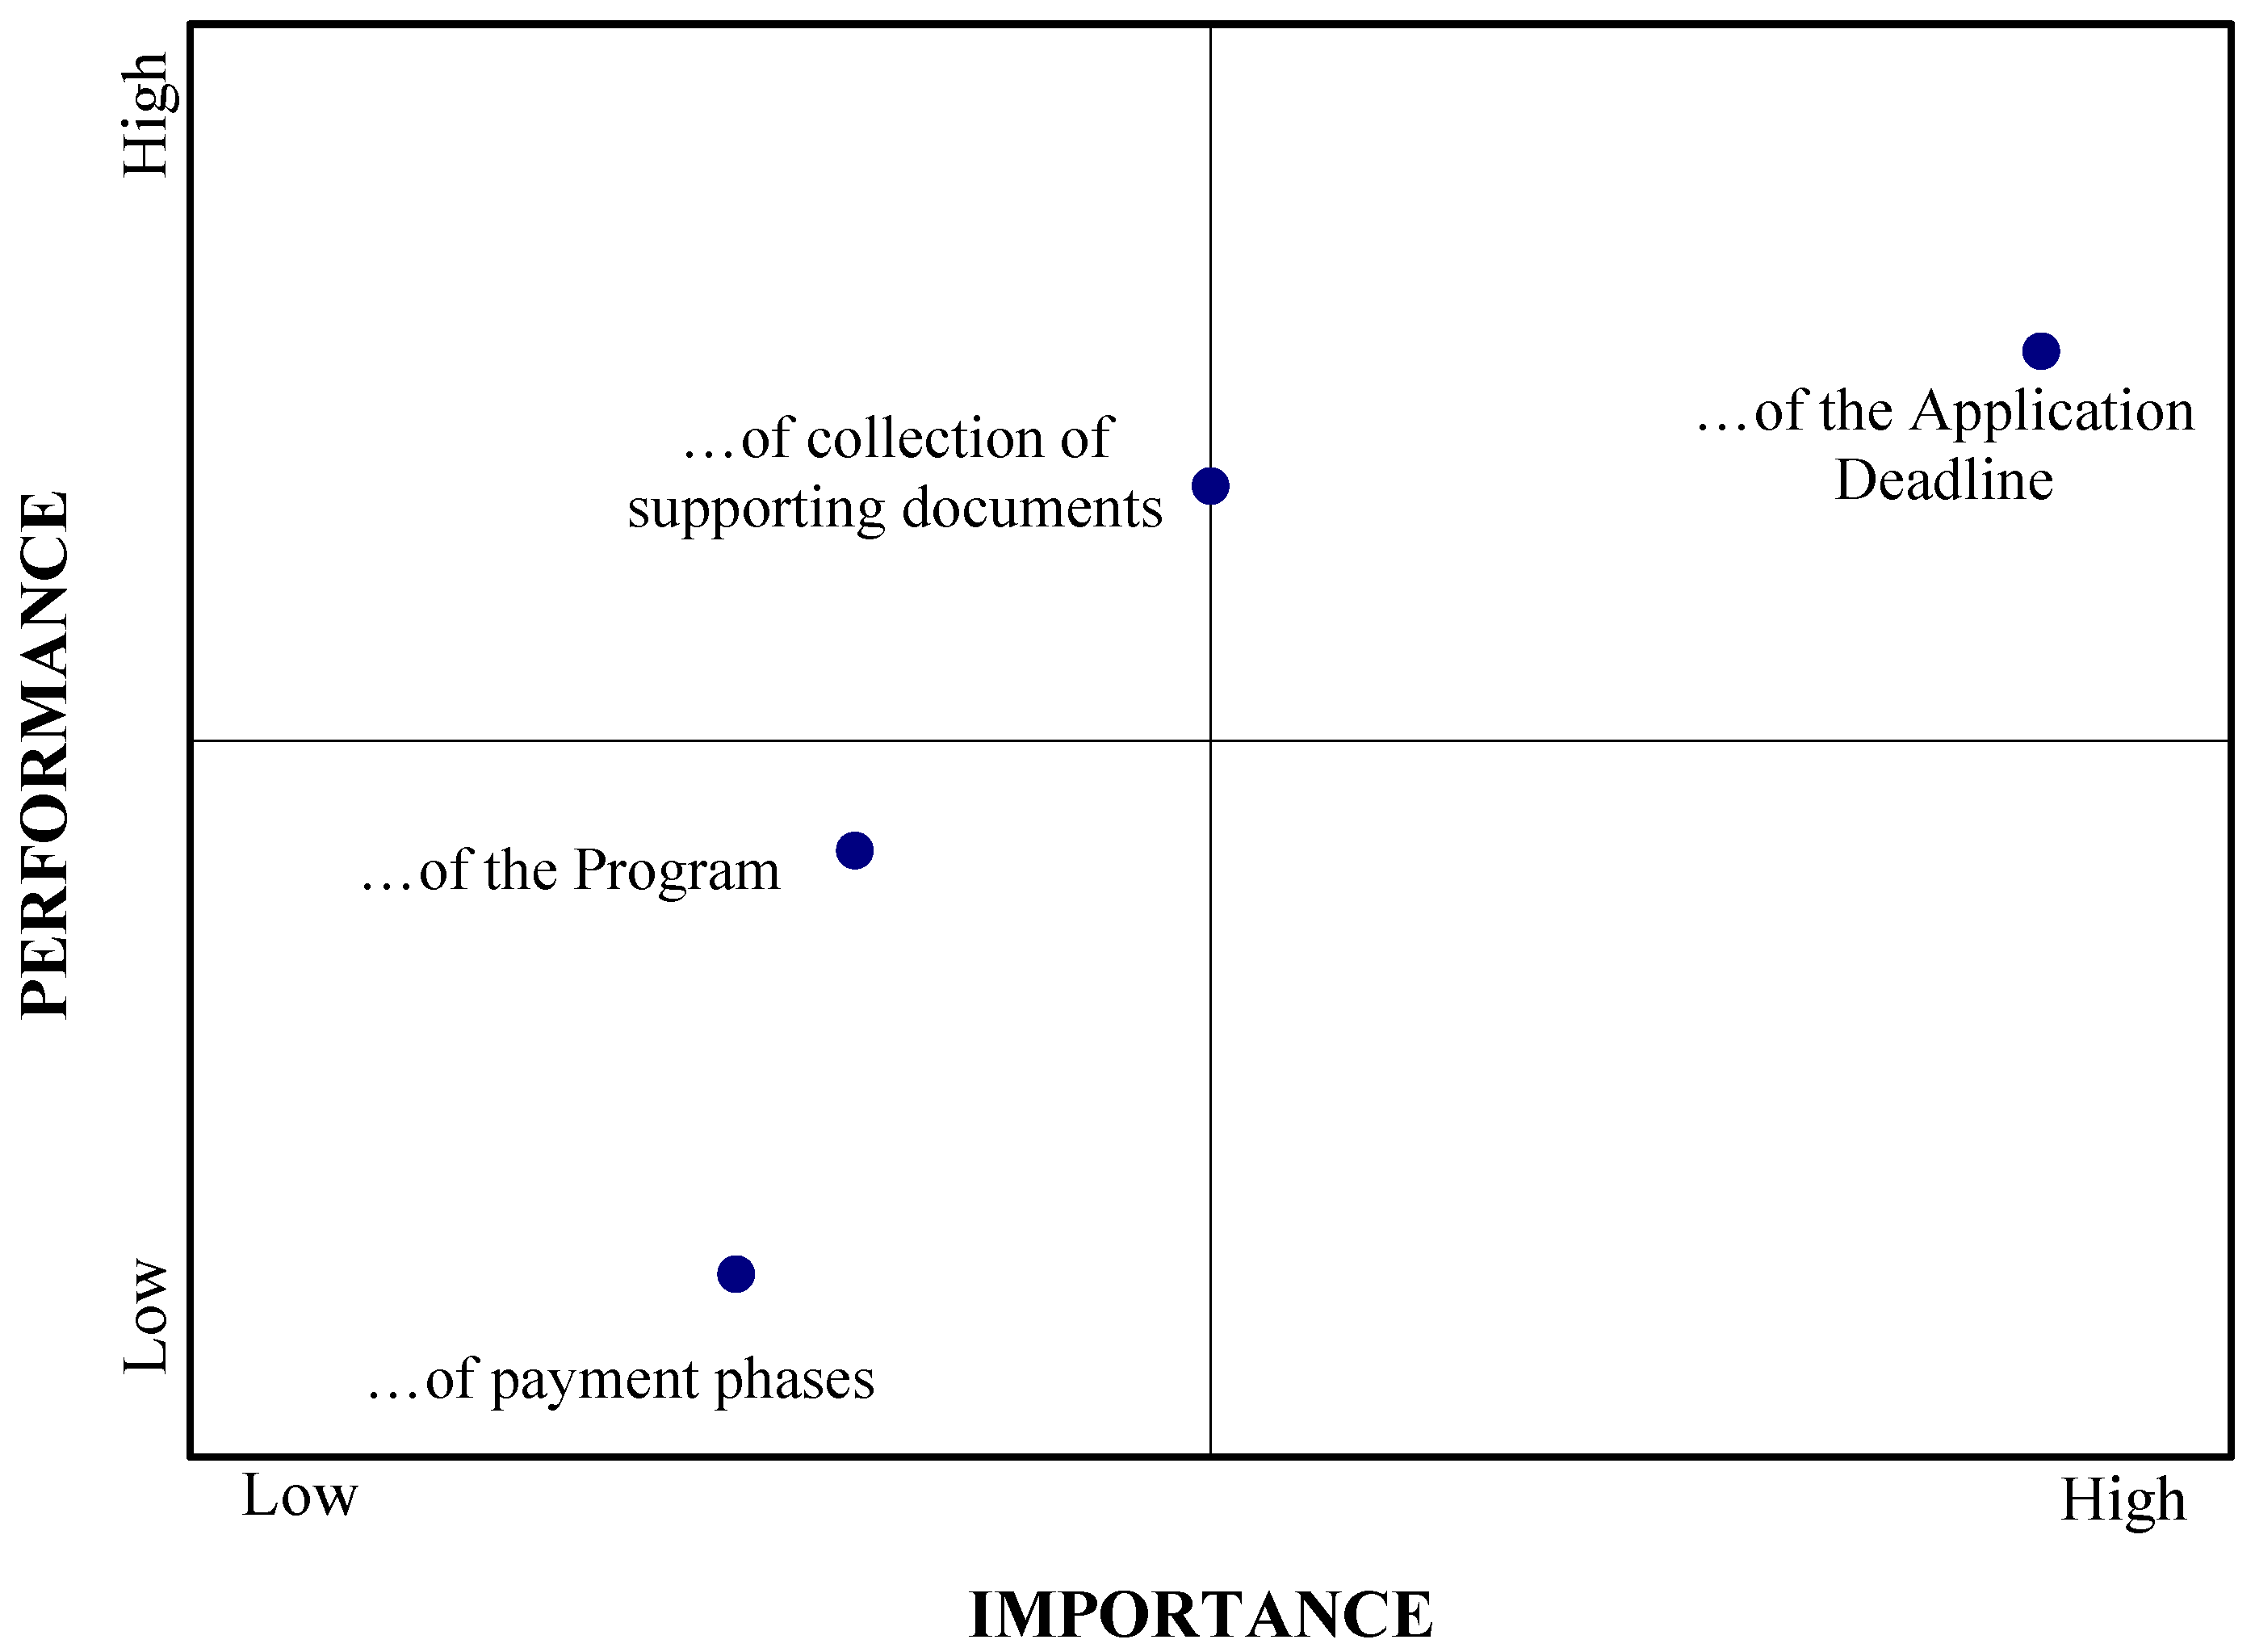
Therefore, based on the above, the Action Diagram (
Figure 5) is obtained, according to which:
The respondents are more satisfied with the more important criteria and less satisfied with the less important criteria, as evidenced by the fact that the sub-criteria are exclusively grouped in the power and current status areas. However, as can be seen, “Duration of gathering supporting documents” is on the axis, meaning that it is not a crucial sub-criterion in comparison to the others.
Therefore, in the case of the “Duration” criterion, the “Application deadline” should be given the highest priority, followed right after by the “Program duration” and the “Duration of payments.” Future consideration of the final two sub-criteria should receive a lot of attention because they could be crucial and significant.
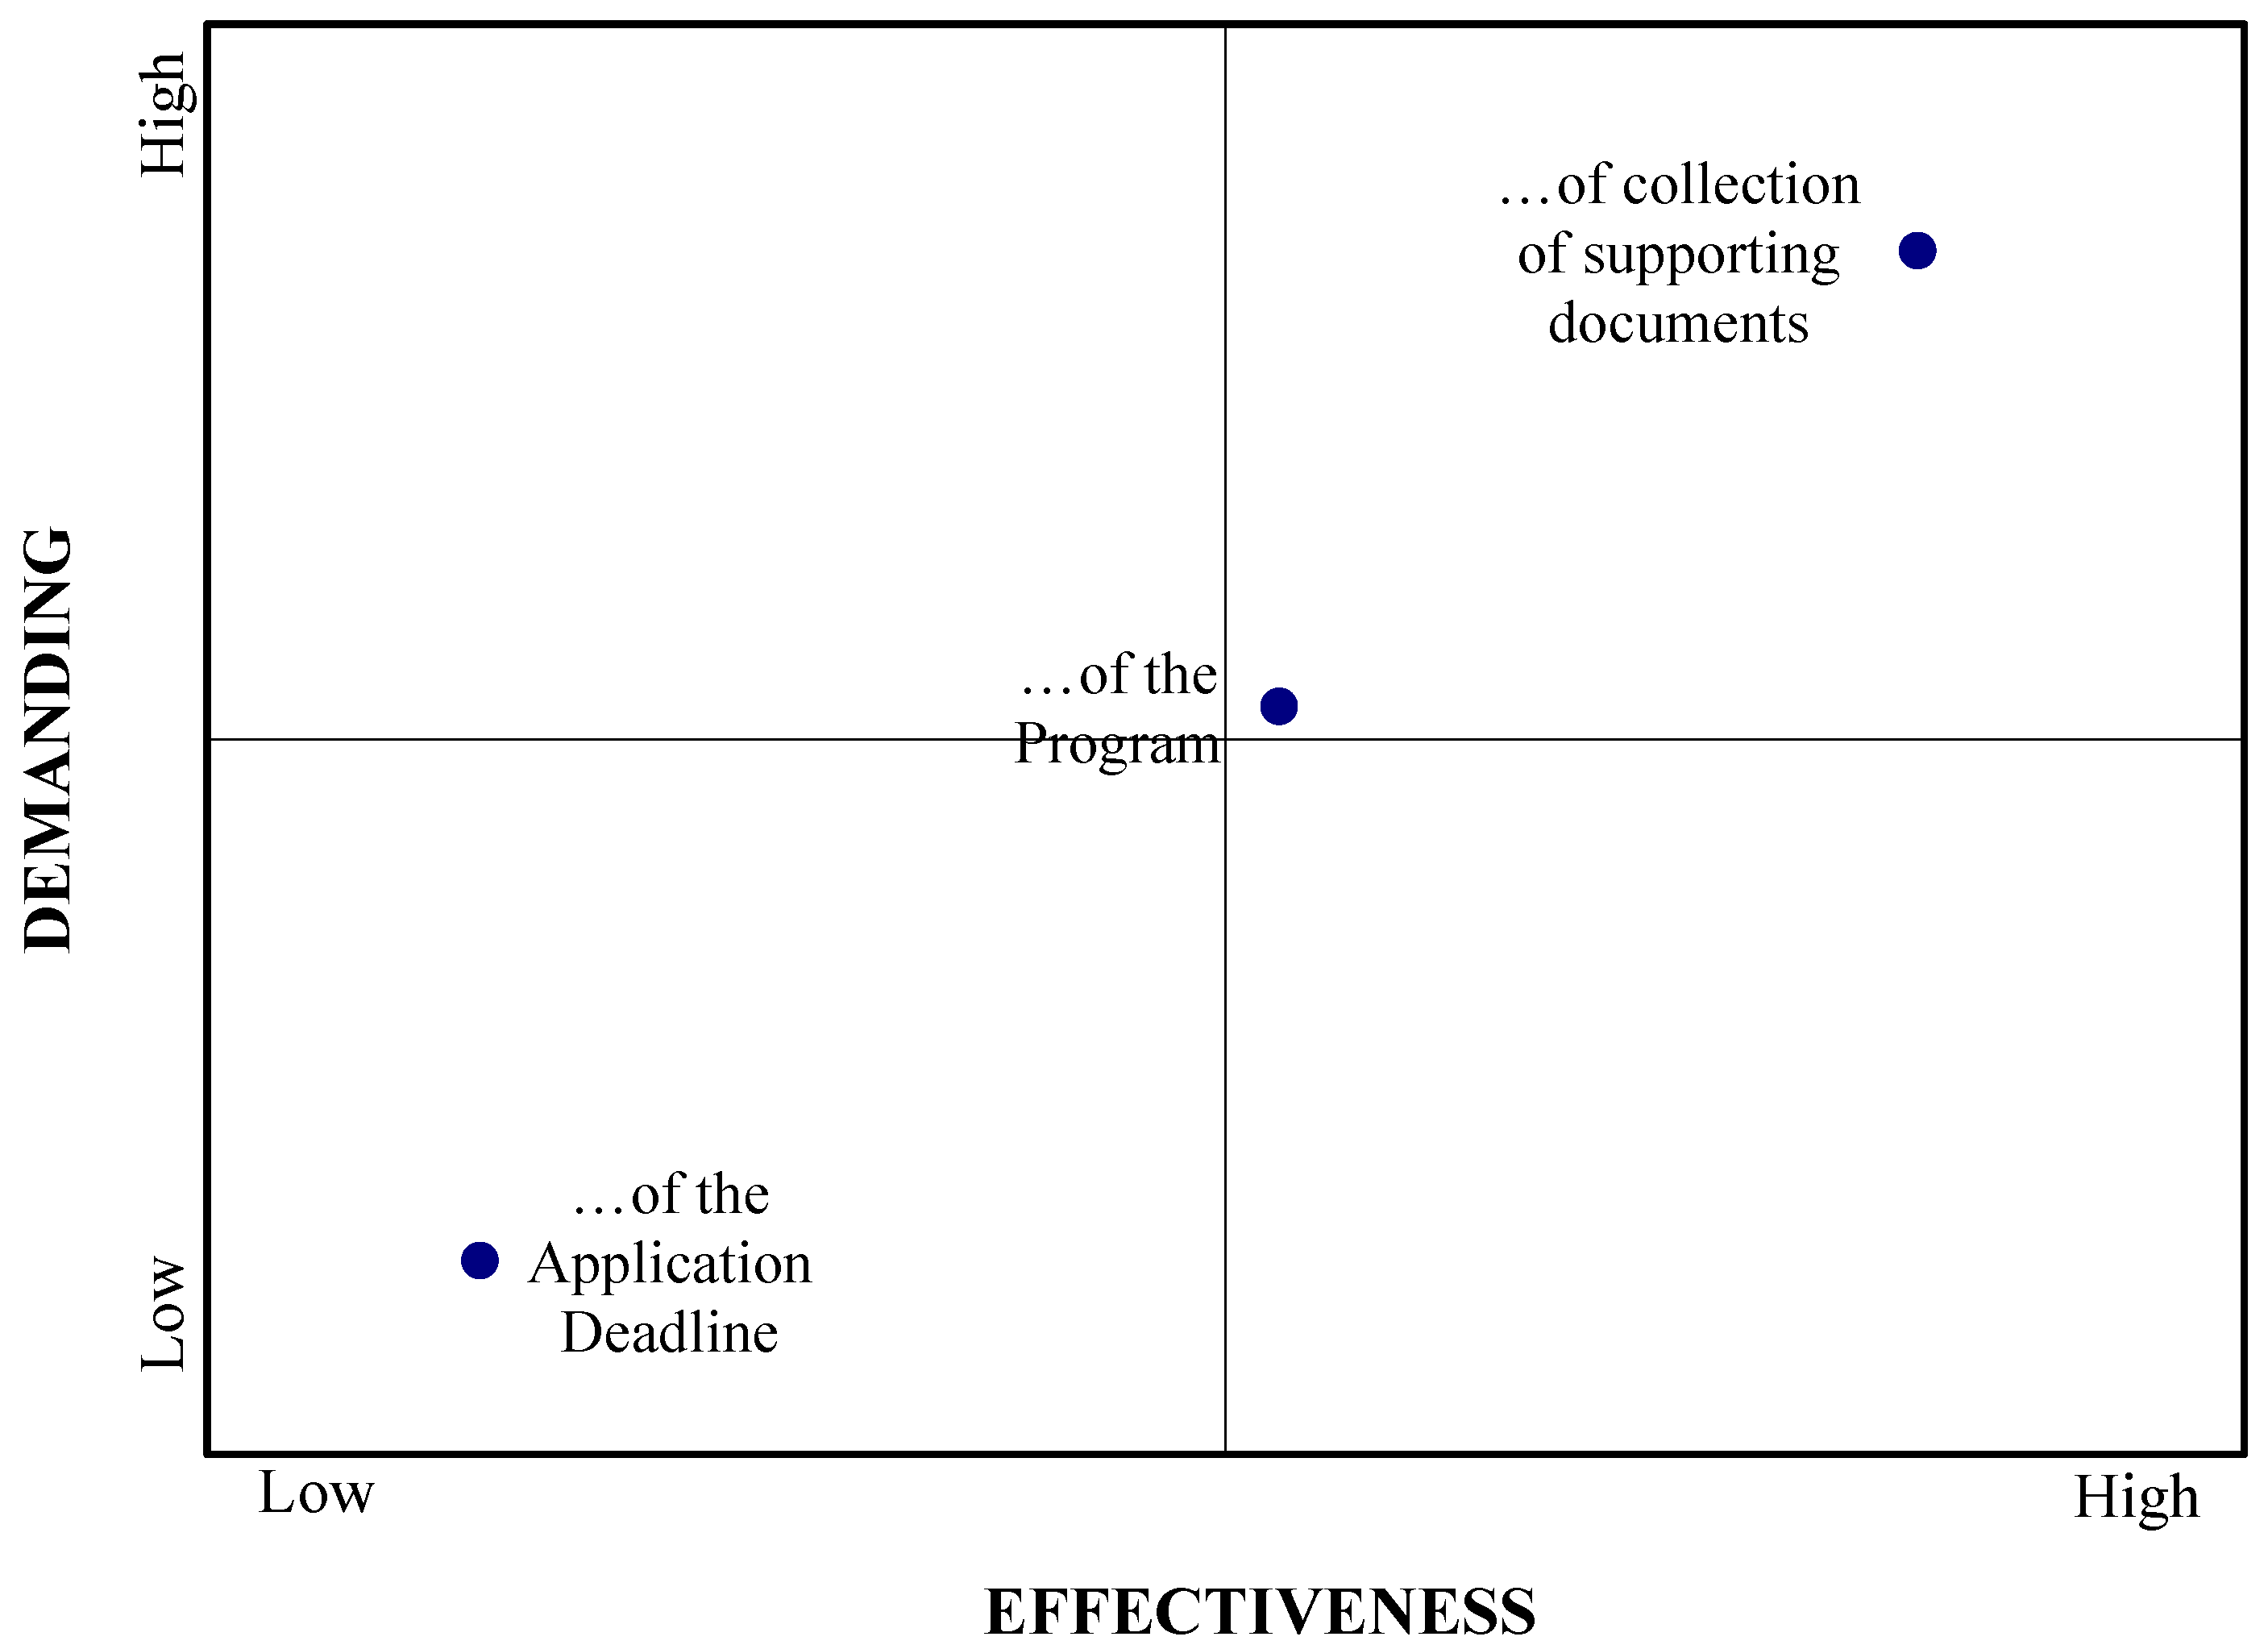
Improvement efforts should concentrate on both “Duration of payment phases” and “Program duration” (sub-criteria with high effectiveness and responsiveness) as well as “Duration of collection of supporting documents” and “Deadline for submission of applications” (sub-criteria with low effectiveness and responsiveness). This is illustrated in the Improvement Diagram (
Figure 6), which is formed by the data in
Table 7 for the average Improvement Index and Demanding Index.
5.2.2. Clarity
For the second criterion examined during the application period (Phase 1),
Table 8 shows that, in general, young farmers declared satisfied with its sub-criteria. Specifically, for the sub-criterion “Explanation of the program”, the satisfaction rate was 67.4%, and for “Explanation of program commitments and obligations”, a satisfaction rate of 68.5% was obtained.
Based on
Table 9, it is clear that there is no variation between the weights and average indexes of the two sub-criteria, so the Action and Improvement Diagrams for this criterion cannot be formed.
5.2.3. Realism
The ‘Realism’ criterion is the third criterion of the application period (Phase 1) and comprises the three sub-criteria.
Table 10 shows the frequencies of satisfaction and dissatisfaction responses of young farmers with regard to these sub-criteria.
Positive replies were received on the degree of satisfaction, as can be shown. “Realistic deadline for applications” had the highest rate (66.3%), followed closely by “Realistic commitments and obligations” (65.2%). “Realistic and achievable business plan objectives” comes next, with a 51.7% overall satisfaction rating. However, “Realistic and achievable objectives of the business plan” received the most negative feedback.
Since there is no variance between the weights, the data derived from the MUSA method in
Table 11 only leads to the creation of an Improvement Diagram (
Figure 7), as the Action Diagram cannot be defined.
In particular, it is observed that “Realistic commitments and obligations” and “Realistic and achievable business plan objectives” have high effectiveness and demanding, and the sub-criterion “Realistic deadline for applications” has low effectiveness and demanding. For this reason, all of the above sub-criteria have priority for improvement efforts.
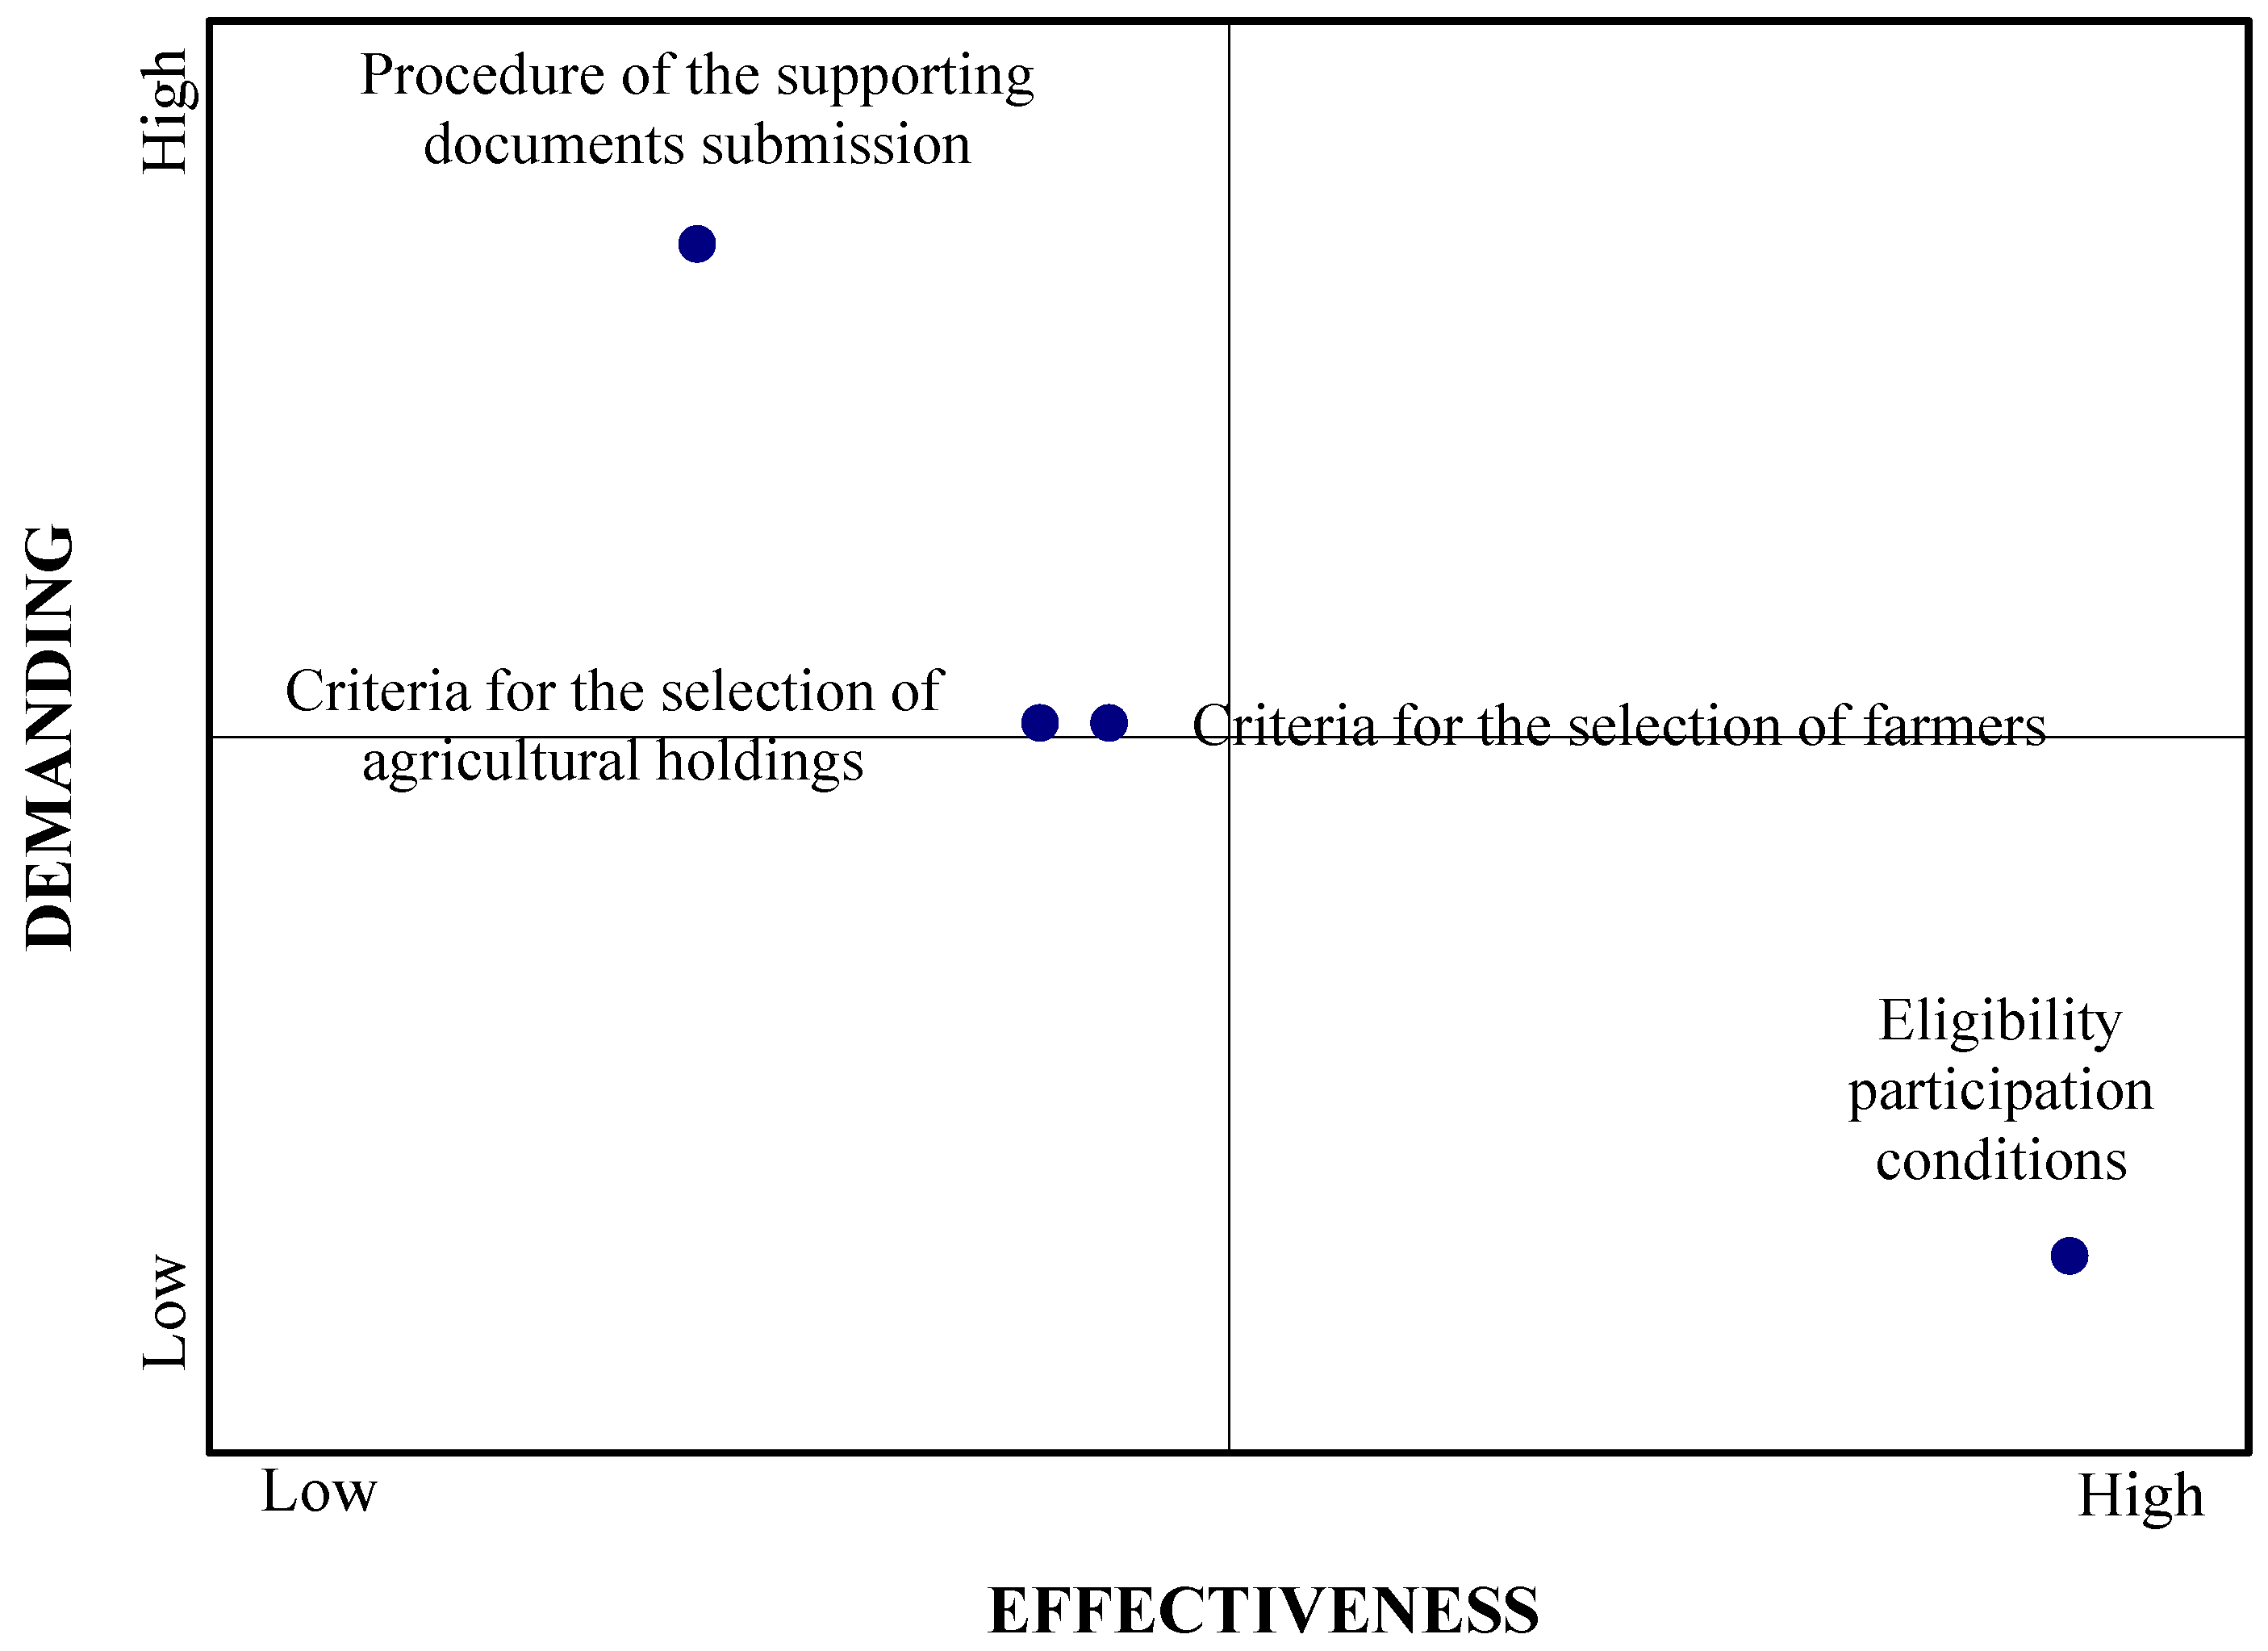
5.2.4. Eligibility
The last criterion of the first period is ‘Eligibility’, which includes four sub-criteria, as shown in
Table 12.
It is important to note that, young farmers were more satisfied with the “Procedure of the supporting documents submission”, as it received the highest percentage of positive responses (59.5%) of the other sub-criteria, and at the same time the lowest percentage of negative answers (13.5%), while there were no totally dissatisfied respondents.
In terms of satisfaction, the above sub-criterion is followed in descending order by “Eligibility participation conditions” (50.5%), “Criteria for the selection of agricultural holdings” (48.3%), and finally, “Criteria for the selection of farmers” (41.6%).
The following table (
Table 13) with weights and indexes of the sub-criteria shows the following:
The sub-criterion “Eligibility participation conditions” is by far the most important for young farmers, with a percentage of 58.6%, while the others are considered less important with percentages not exceeding 15.8%.
Moreover, the most important sub-criterion has the highest rate of satisfaction, reaching 94.3%, while the others are at about the same level, with satisfaction rates not exceeding 88.1%.
In this way, the Action Diagram (
Figure 8) emerges, according to which young farmers seem to be more satisfied with the “Eligibility Participation Conditions”, which is a very important criterion (validity area), while they are less satisfied with the not so important sub-criteria “Criteria for farm selection”, “Criteria for the selection of agricultural holdings”, and “Procedure for submission of the supporting documents” (validity area).
The next step is to use the Improvement Diagram (
Figure 9) to select findings for improvement efforts. The priority for improvement appears to be the “Eligibility Criteria/Conditions for Participation”, with the next priority identified as the third priority area, which includes the remaining three sub-criteria for improvement.
5.3. Partial Satisfaction Phase 2: During the Program
“Flexibility”, “Functionality”, and “Consistency” were the criteria used to assess the young farmers’ partial satisfaction during the second phase of the program, which was “During the Program”. The results for each sub-criteria of the second phase’s criteria, as determined using the MUSA Method, are examined below.
5.3.1. Flexibility
According to the
Table 14, it is observed that the positive responses on satisfaction with the sub-criteria are more than the negative ones (32.5% for Possibility of business plan modifications and 31.4% for Possibility of changes), but the neutral responses exceeded the positive ones in percentage for each sub-criterion, with values of 60.7% and 62.9%, respectively.
Table 15 shows the weights and indexes; data, that in this case, do not lead to the creation of an Action and Improvement Diagrams, as there is no variation in the weights and indexes of the sub-criteria. Therefore, the latter cannot be compared in terms of their importance and priority in improvement efforts.
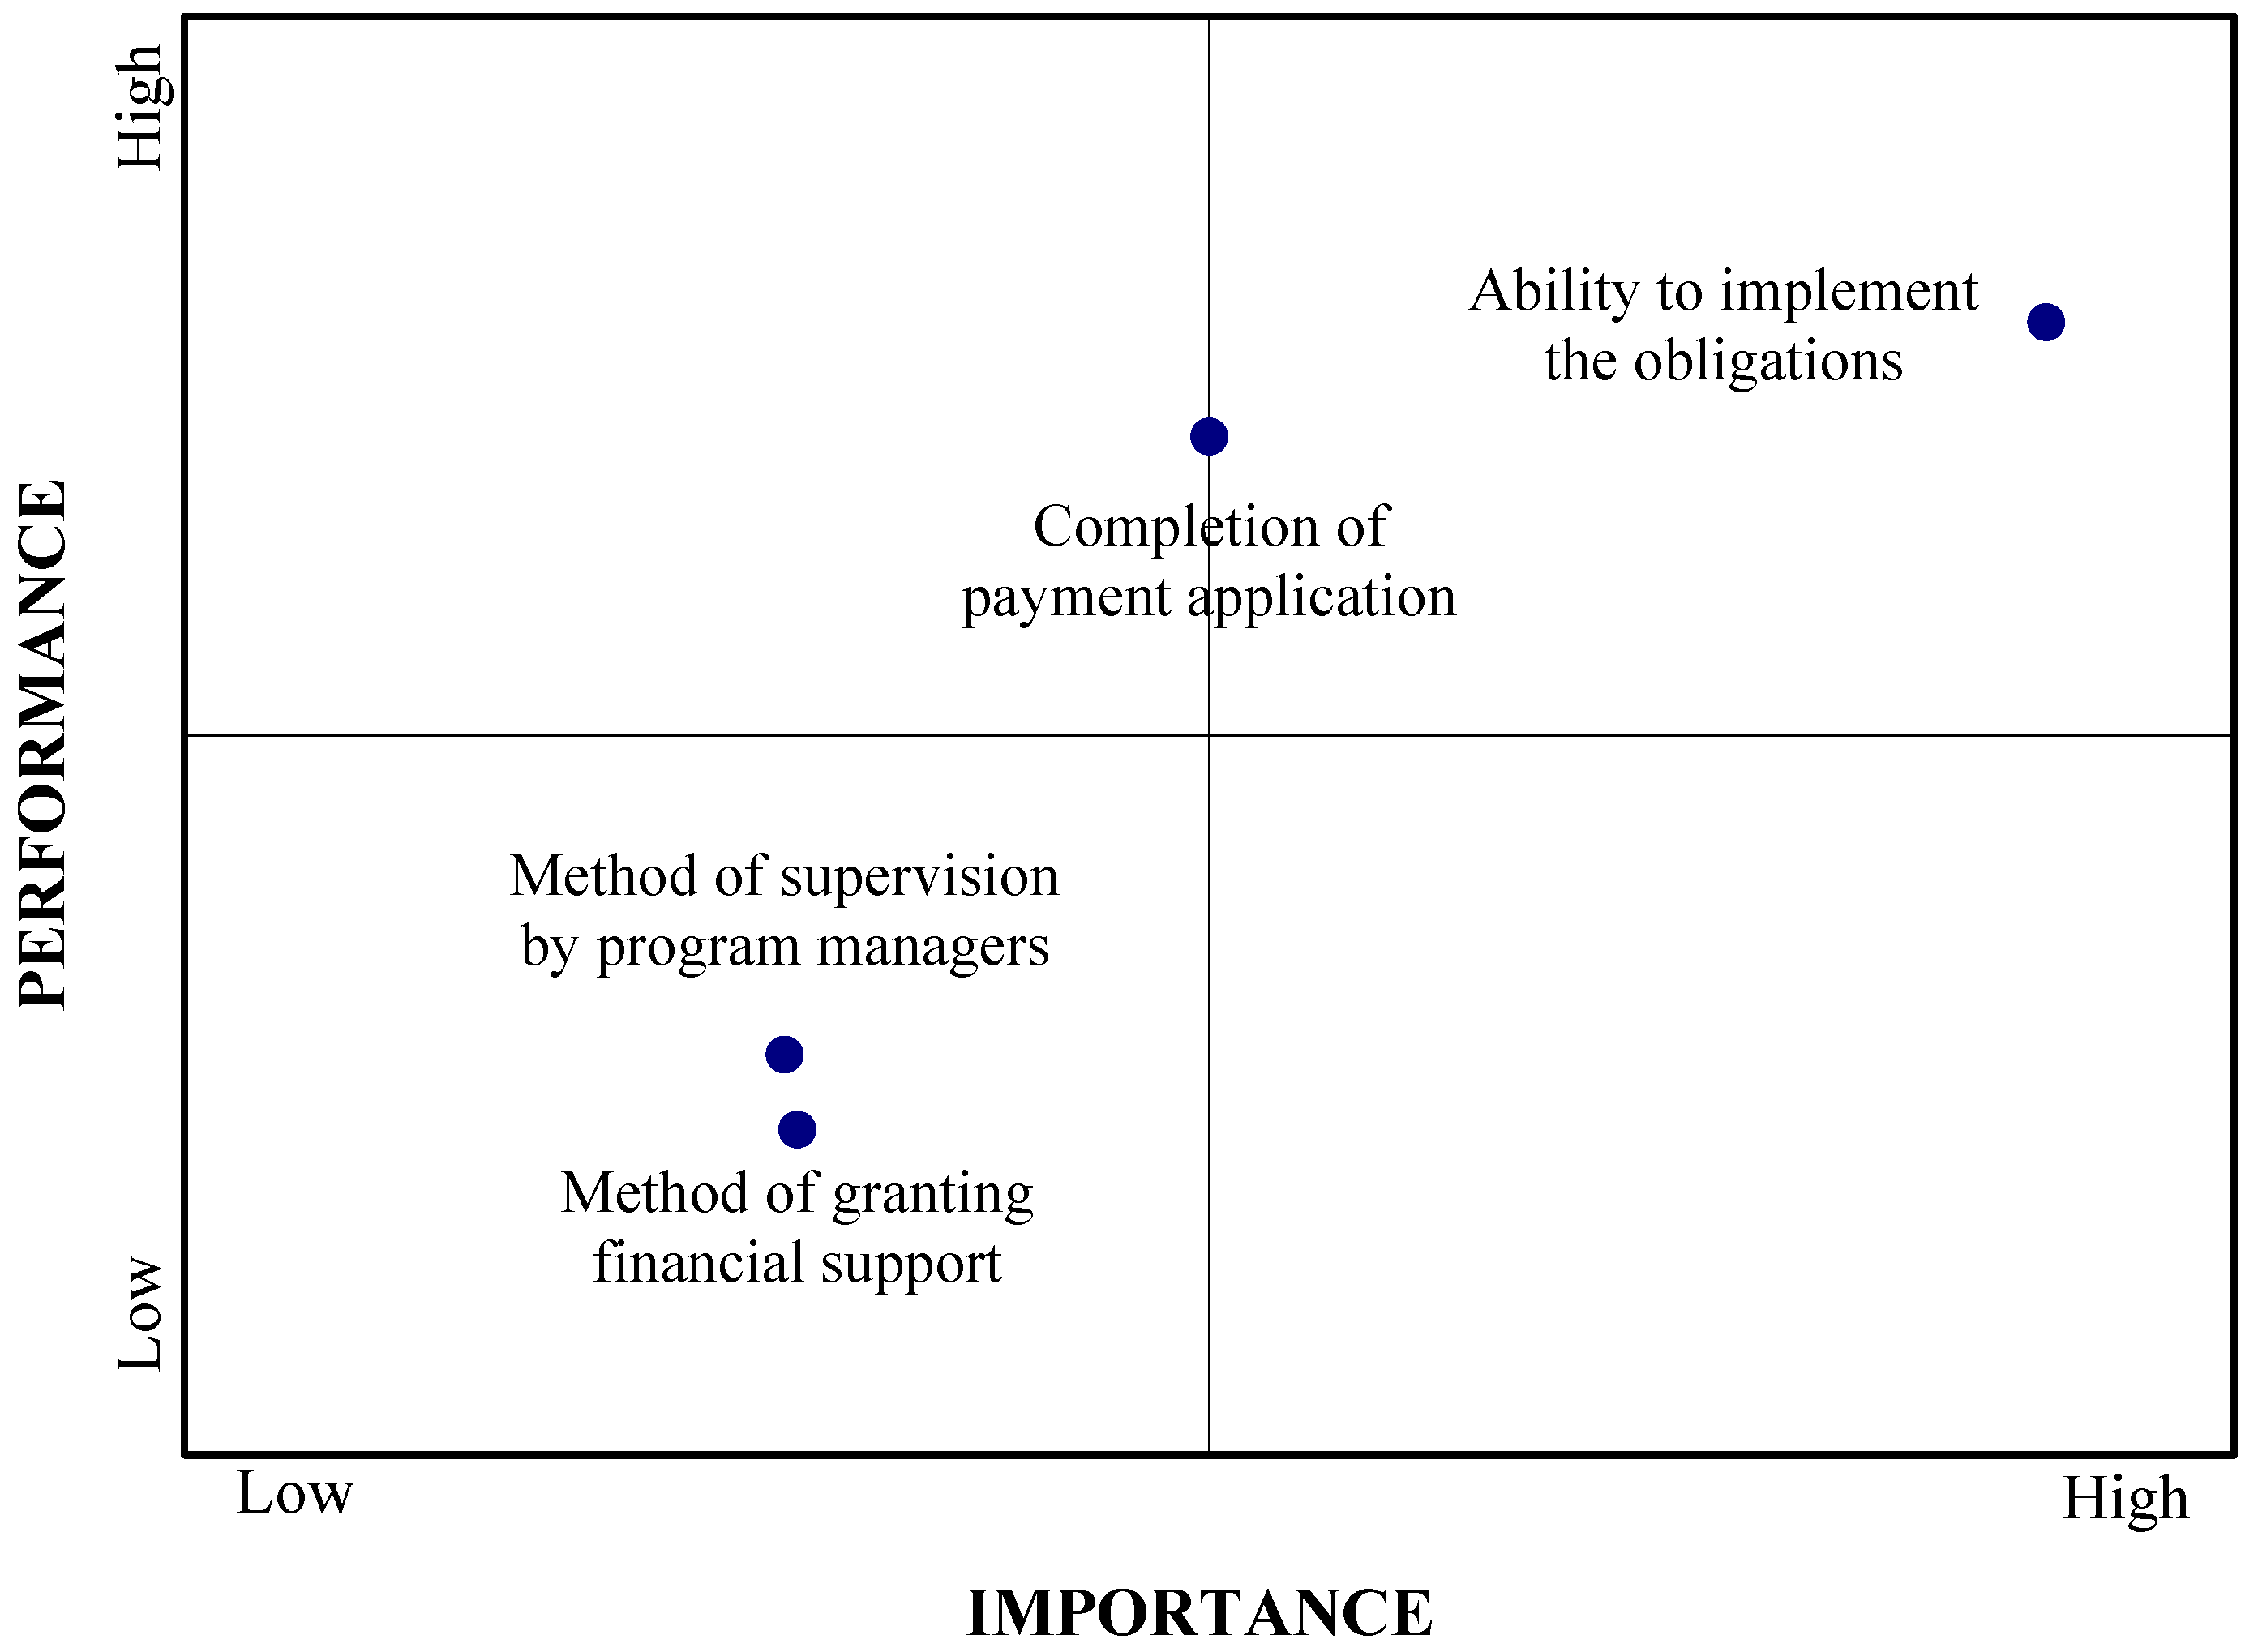
5.3.2. Functionality
The MUSA Method is then used to analyze the sub-criteria, which are part of the criterion “Functionality”. As a result, “Ability to implement the obligations” has the highest satisfaction rate in
Table 16, at 85.4%. This is followed by “Method of supervision by program managers” at 72.0%, “Completion of payment application” at 67.4%, and “Method of granting financial support” at 58.4%. “Ability to implement the obligations” (7.9%) obtained, by far, the lowest percentage of neutral comments, while the other sub-criteria had equal percentages. In contrast, “Method of granting financial support” (24.8%) received by far the highest number of neutral responses.
Table 17 demonstrates that the ability of young farmers to implement their program obligations is, by far, the most important factor (64.2%), while the completion of the payment application (25.0%), the way financial support is granted (5.7%), and finally, the way of supervision (5.1%) are considered important with much lower percentages. The average satisfaction rates for the above are, respectively, 98.3%, 94.5%, 71.4% and 74%.
With the above data, the Action Diagram (
Figure 10) shows that also in the criterion of “Functionality”, the young farmers are more satisfied with the important sub-criterion “Ability to implement the obligations” and less satisfied with the “Method of supervision by program managers” and “Method of granting financial support” sub-criteria that are less important and have future criticality. Finally, it is worth pointing out that the sub-criterion “Completion of payment application” is situated directly on the axis, suggesting a lack of clarity regarding its priority and criticality.
The Improvement Diagram (
Figure 11) focuses efforts for improvement first on “Completion of payment application”, then on “Method of granting financial support” and “Ability to implement the obligations”, with the last but equally important priority for improvement being the sub-criterion “Method of supervision by program managers”.
5.3.3. Consistency
The last criterion examined during the 2nd phase of the program is “Consistency”, which includes the following sub-criteria: “Consistency and leniency of installment payments” and “Initial data compared to what was in place during the program”. Thus, it can be observed that young farmers were generally satisfied with both sub-criteria, with the former having a satisfaction rate of 52.8% and the latter 49.4%, while negative responses reached 28.1% and 25.8% in both cases. Finally, neutral responses were more frequent in the second sub-criterion, at 24.7%, compared to 19.1% in the first sub-criterion (
Table 18).
The Action Diagram (
Figure 12) derived from the weights and Average Satisfaction Indexes (
Table 19) indicates that consistency and leniency in payment of instalments is a very important sub-criterion of consistency, for which young farmers are most satisfied, and which is a comparative advantage of the program. However, a crucial sub-criterion that requires consideration moving forward is the initial data compared to what was in place during the program.
The Improvement Diagram (
Figure 13) on the other hand, urges to improve first the “Consistency and leniency of installment payments”, while the second sub-criterion of Consistency (Initial data compared to what was in place during the program) comes last in priority.
5.4. Partial Satisfaction Phase 3: After the Completion of the Program
Using the MUSA Method, the results of the criteria “Effectiveness”, “Development Opportunities”, and “Sustainability”, which belong to the third phase of the program, “After the completion of the program”, were also analyzed. The latter have, in turn, sub-criteria, which are analyzed below.
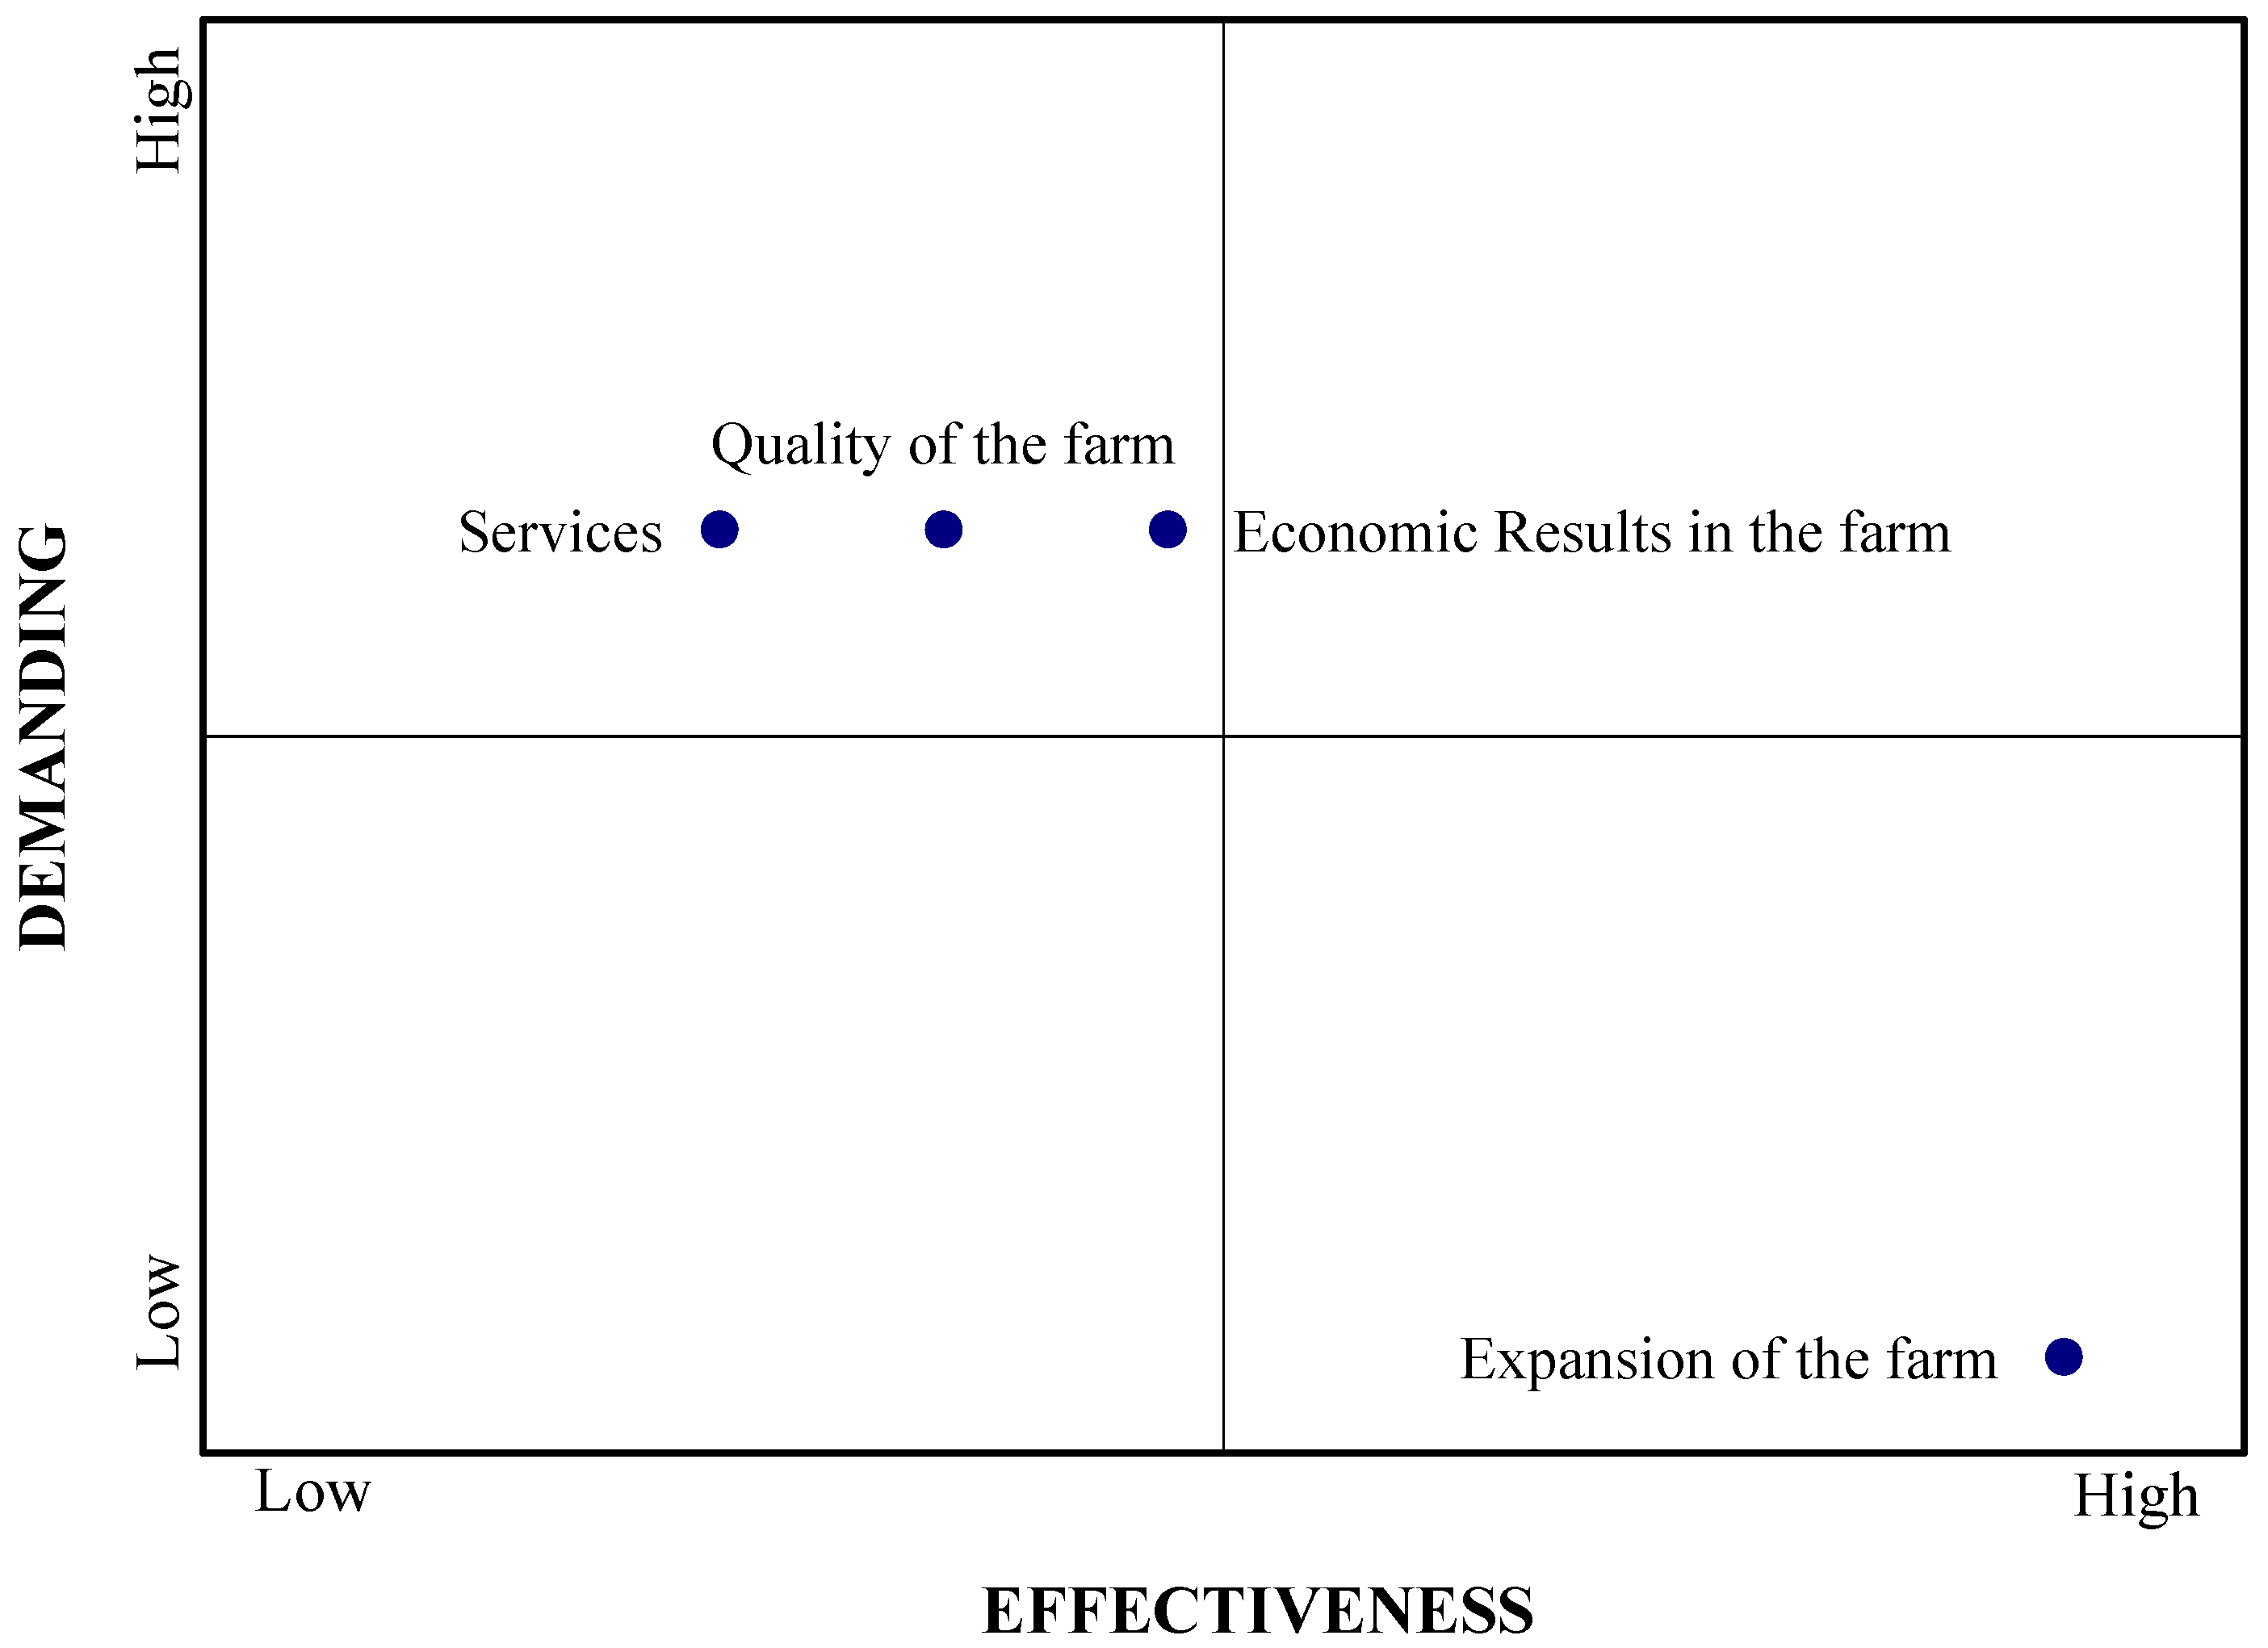
5.4.1. Effectiveness
For the sub-criteria of “Effectiveness” data are given in the tables below (
Table 20 and
Table 21).
The frequency table (
Table 20) identifies the “positive attitude” of the young farmers from the sub-criteria, namely the latter declare that they are most satisfied by the service they received from the program (50.6%), by the quality of their farm after the program (46.0%), and its size (expansion) (44.9%), but they are also satisfied by the economic results that the program brought to their farm, at a rate of 41.6%. Neutral responses ranged between 32.0% and 36.0%, with dissatisfaction responses reaching 22.5% for economic results, 21.4% for quality, 20.2% for area, and 16.9% for services.
According to
Table 21, the most important of the other sub-criteria is considered, by a difference of about 29%, to be the expansion of the agricultural holding after the program was completed (47.1% compared to the same weight of the other sub-criteria, 17.7%), which has a Satisfaction Index of 94.7%, when the other sub-criteria approach the same index at 88–89%.
Thus, from the Action Diagram for the above sub-criteria (
Figure 14), the expansion of the farm is a comparative advantage of the program, while the others are potentially critical. Finally, from the Improvement Diagram (
Figure 15), expansion is the priority for improvement, while the other sub-criteria are in the third priority, according to the MUSA method.
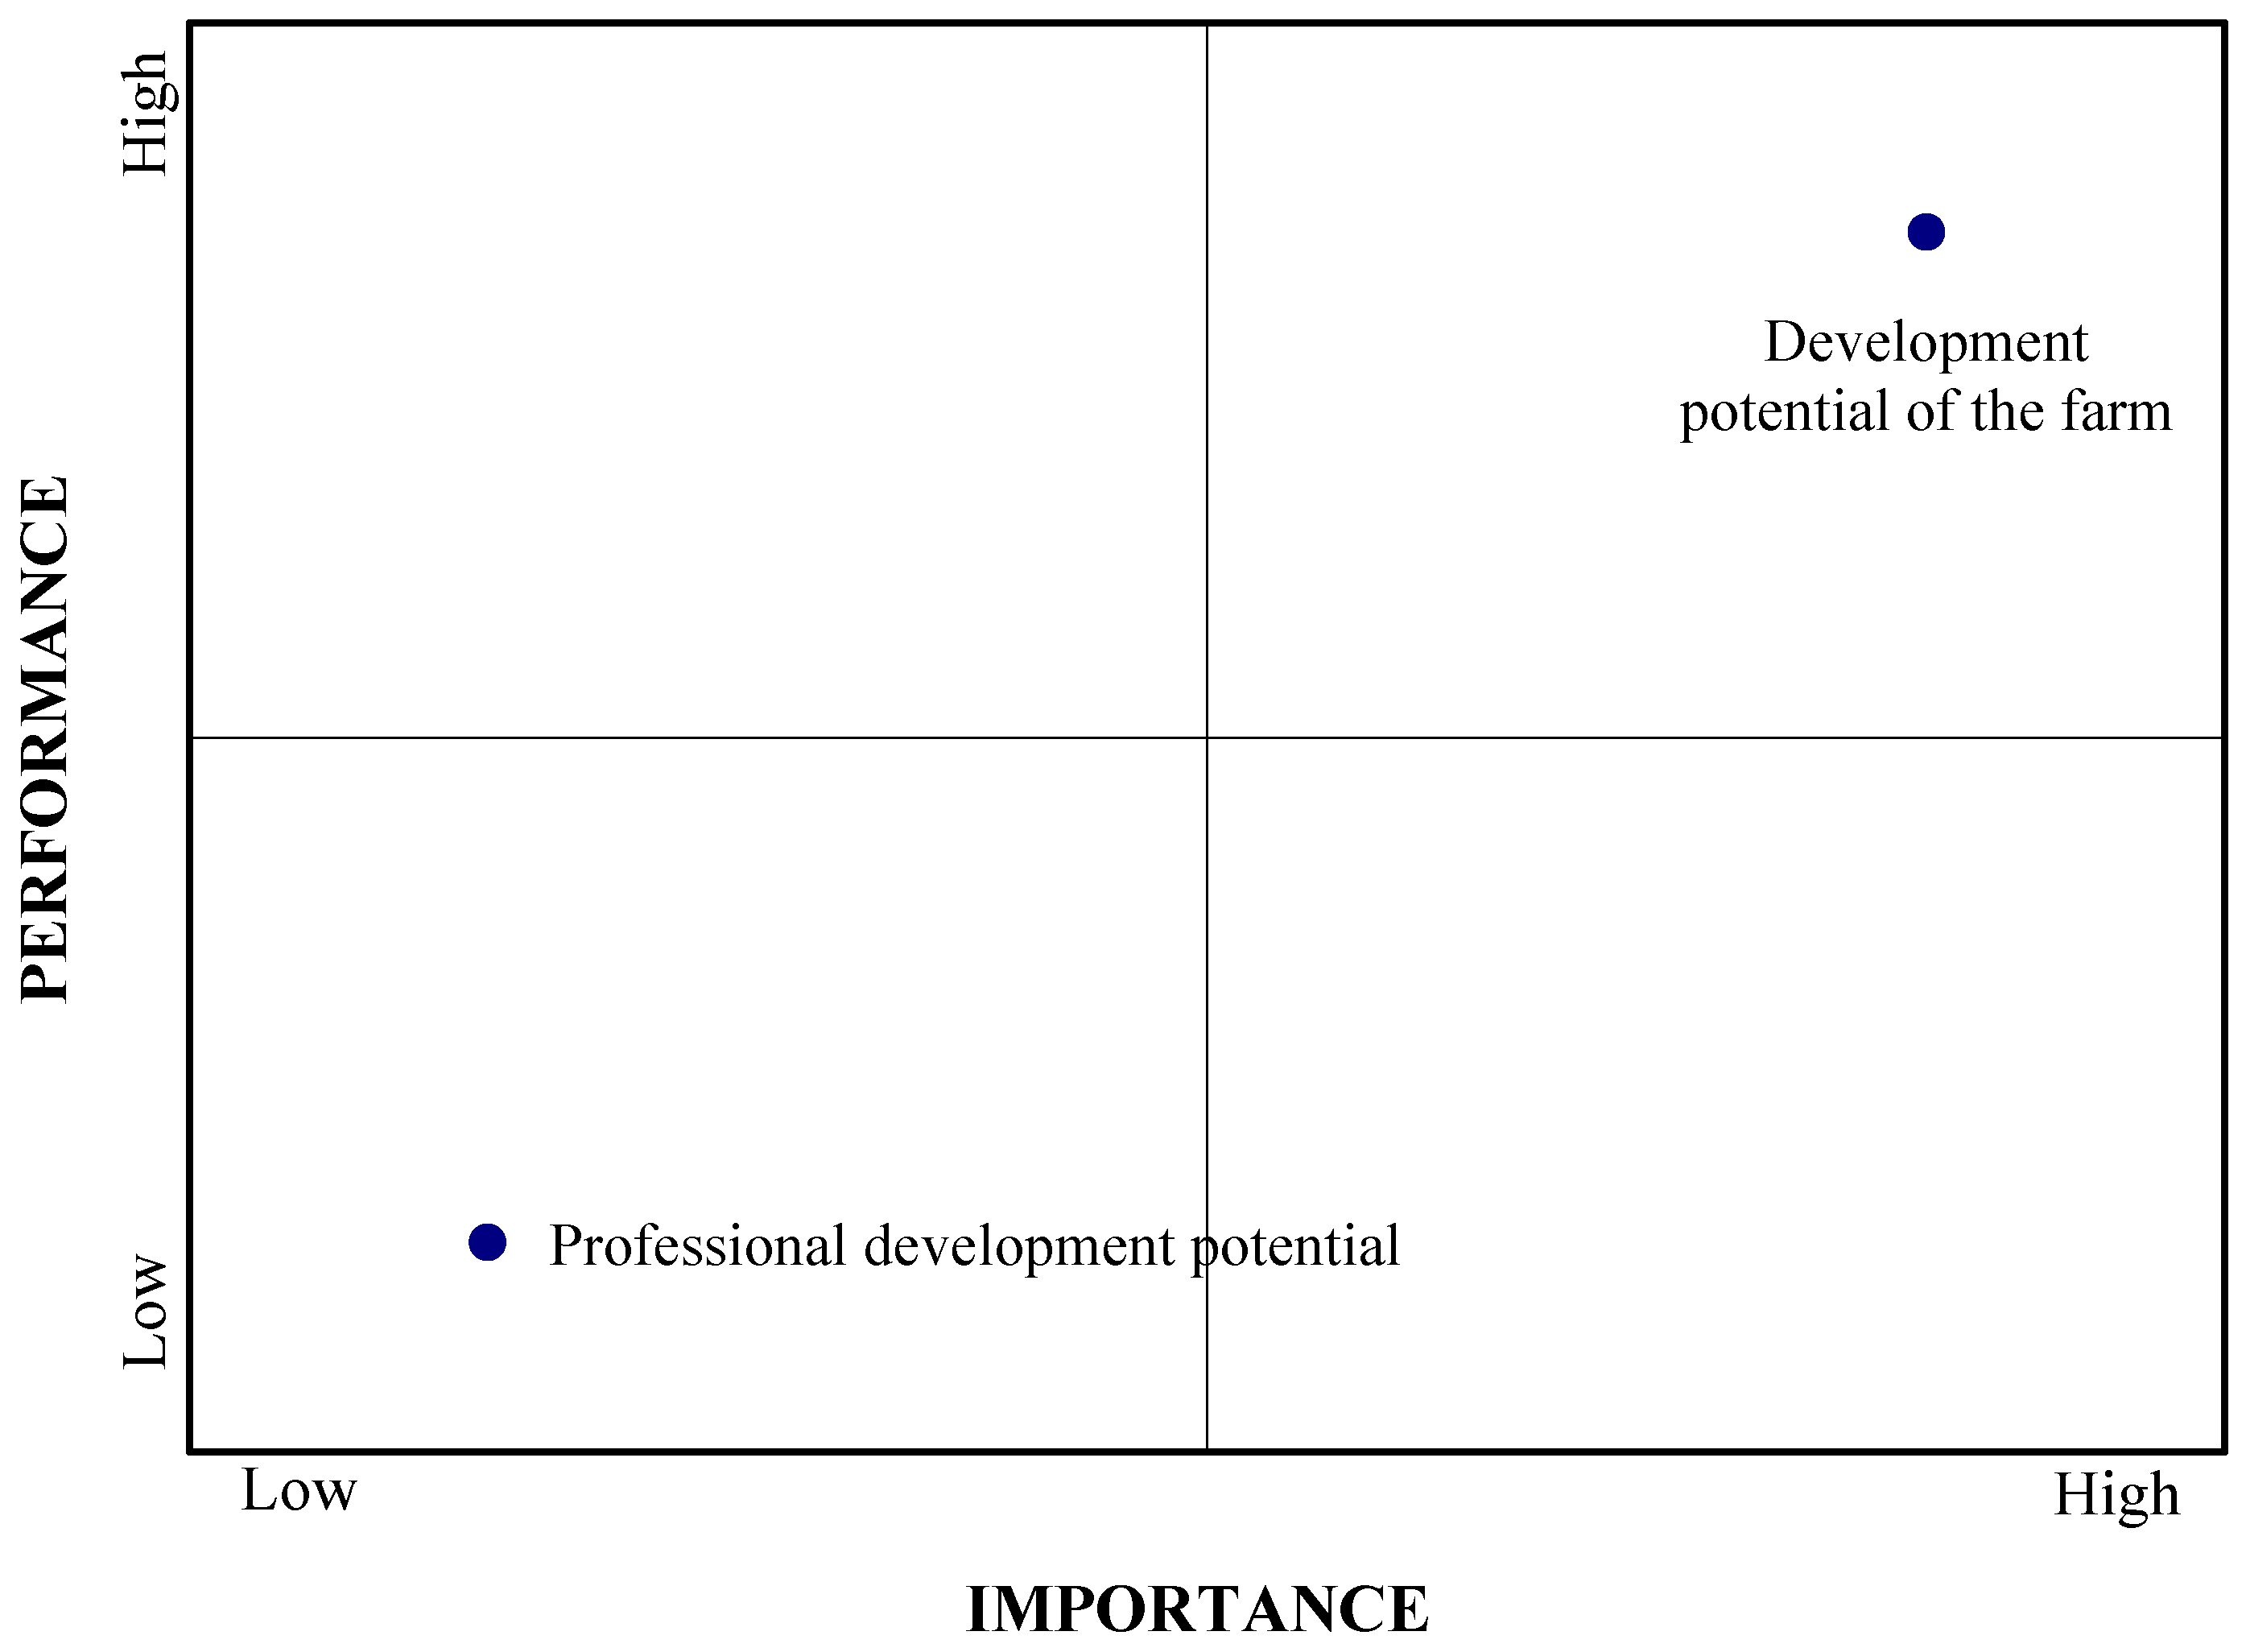
5.4.2. Development Opportunities
The next criterion, “Development Opportunities”, of the third period was examined both from the farm and from the point of view of the young farmer. The frequency table shows that the positive satisfaction responses “outweigh” the negative responses, as 40.5% of the young farmers were satisfied with the professional development opportunities offered by the program, and 34.8% were satisfied with the development potential of their farm (
Table 22). Negative responses reached 29.3% for both sub-criteria, while neutral responses reached 30.3% and 36.0%, respectively. It is necessary to note that the neutral answers were more than the positive ones regarding the possibilities of development and expansion of the holding.
Moreover, for young farmers, it seems that the potential for farm development is more important than the potential for professional development, with a large difference of 89.5% compared to 10.5%, while the first sub-criterion has a Satisfaction Index of 95.8% in contrast to the second sub-criterion which reaches 79.3% (
Table 23).
From the resulting Action Diagram, it can be observed that farm development opportunities are a comparative advantage for the program, as young farmers consider them important and are more satisfied with them, compared to professional development opportunities, which are probably a critical sub-criterion in the future, and for which young farmers are less satisfied (
Figure 16).
Finally, the Improvement Diagram shows that priority in improvement efforts should be given first to farm growth and development opportunities, and then to professional development opportunities, which have high demanding but low effectiveness (
Figure 17).
5.4.3. Sustainability
The last criterion of the third and last phase of the program, which is examined below in terms of its sub-criteria through the MUSA method, is “Sustainability”. This criterion consists of two sub-criteria, ‘Creation of a sustainable farm’ and ‘Ability to maintain a sustainable farm’, for which the satisfaction responses were positive, neutral, and negative in similar proportions. In particular, for the first sub-criterion mentioned above, positive responses were more than the others and reached 39.3%, with neutral responses reaching 32.6%, and negative responses “coming last” with 28.1%. For the second sub-criterion, however, neutral responses came first with 38.2%, followed by positive responses at 34.8%, and finally, negative responses at 27% (
Table 24).
The table of weights and indexes (
Table 25) shows that no sub-criterion is more or less important than the other, such that neither an Action Diagram nor an Improvement Diagram can be derived.
6. Conclusions
The present study was an attempt to measure the satisfaction of the farmers who participated in the Sub-Measure 6.1 “Establishment of Young Farmers” in 2016. The Multi-Criteria Satisfaction Analysis (MUSA) methodology was used to measure satisfaction. The notable difference and at the same time the comparative advantage of the method is the possibility of extracting qualitative results that directly answer, and without the need for further analysis, the questions “what is critical for customer satisfaction?” and “what needs to be improved?” [
27].
Therefore, the satisfaction of young farmers was examined through criteria, both for the initial phase of the program, during which they applied for participation, and for the period during and at the end of the program. The data from the analysis revealed overall satisfaction of the young farmers with the program; however, there were critical criteria and sub-criteria in each phase, which are presented for improvement of the program.
Firstly, regarding overall satisfaction, young farmers are satisfied and positive responses in all criteria outweigh negative responses. Among the criteria, young farmers seem to be most satisfied with the Clarity and Duration of the sub-measure, with Consistency being the greatest “strong point” of the program. Through the Action And Improvement Diagrams resulting from MUSA data analysis, Sustainability, Realism, and Duration are critical and priority criteria (the weakest points), while Consistency together with Functionality are the comparative advantage of the program. In addition, all criteria have priority in terms of improvement efforts except for eligibility, which is the lowest priority.
Specifically for the application phase and the duration criterion, the most critical sub-criterion is the deadline for submission of applications. However, improvement efforts should focus equally on all sub-criteria. The clarity sub-criteria show no variation, so there are no Action and Improvement Diagrams to produce comparative results. The sub-criteria of Realism had the same, such that they could not be compared in terms of their criticality, but it was found that both the commitments and obligations, the objectives of the business plan, and the deadline for applications could be improved to the same extent. Furthermore, for the eligibility criterion, it was found that the conditions of participation are the most critical sub-criterion, while at the same time it is a comparative advantage, and is the main priority in terms of improvement efforts, compared to the other sub-criteria.
With respect to the criteria examined during the project, the flexibility sub-criteria did not show any variation in their weights and indexes, and therefore cannot be compared in terms of criticality and priority in improvement efforts. However, the ability to implement program obligations appears to be critical, which falls under the functionality criterion, with the completion of the payment application being the main priority criterion for improvement. The consistency criterion includes consistency and diligence in payment of instalments as the most critical sub-criterion, which should also be the focus of improvement efforts.
Finally, regarding the criticality of the sub-criteria examined at the end of the program, it is observed that the effectiveness of the program on the area of holding of the young farmers is a very critical point and belongs to the first priority in the improvement efforts. In addition, another critical sub-criterion is the potential for farm expansion through the program, which should also be the focus of improvement efforts. Finally, the sub-criteria related to program Sustainability have no variation in the data leading to their criticality, so they cannot be compared with each other.
The above is a basis for asking further research questions and analyzing issues to strengthen the existing literature. One research proposal could be to correlate the economic outcomes of participants with their level of satisfaction with the program. On the other hand, a comparison with results from other EU countries that have introduced the same CAP measure will be useful. In addition, studying the satisfaction of young farmers from participating in the same sub-measure in the following programming periods and comparing the results with those of the present study is another interesting approach and could further contribute to the improvement of government services. Finally, the use of the same sample to study the subsequent career path of farmers and the development of their farms can provide an even clearer picture of the provision of financial support by the state.
The results of this study are limited to the number of participants that have successfully completed the program. For this reason, the results are useful for the local policy makers especially in the region of Central Macedonia in Greece. The findings are expected to provide valuable insights for policymakers, enabling them to refine and enhance future initiatives aimed at addressing the demographic and economic challenges facing the agricultural sector.


