Article

Production of Soft Magnetic Materials Fe-Si and Fe-Si-Al from Blends of Red Muds and Several Additives: Resources for Advanced Electrical Devices

1
School of Materials Science and Engineering (Ret.), The University of New South Wales, Sydney, NSW 2052, Australia
2
Department of Enrichment and Processing of Minerals and Technogenic Raw Materials, National University of Science and Technology “MISIS”, Moscow 119049, Russia
3
Laboratory of Complex Ores Metallurgy Problems, A. A. Baikov Institute of Metallurgy and Materials Science, Russian Academy of Science, Moscow 119334, Russia
4
School of Metallurgical and Ecological Engineering, University of Science and Technology Beijing, Beijing 100083, China
5
Engineering Centre, Plekhanov Russian University of Economics, Moscow 117997, Russia
6
Technical Physics Department, G.N. Gumilyov Eurasian National University, Astana 010008, Kazakhstan
7
Moscow Power Engineering Institute, National Research University, Moscow 111250, Russia
8
Independent Researcher, Bhubaneshwar 751013, India
*
Author to whom correspondence should be addressed.
Sustainability 2025, 17(5), 1795; https://doi.org/10.3390/su17051795
Submission received: 15 January 2025 / Revised: 15 February 2025 / Accepted: 19 February 2025 / Published: 20 February 2025

Abstract

:
The present study developed a novel approach for transforming red mud (RM) into soft magnetic materials (SMMs) for applications in advanced electrical devices in the form of Fe-Si and Fe-Si-Al alloys. A total of ten blends were prepared based on two RMs, three iron oxide additives (Fe2O3, black and red mill scales), alumina and carbonaceous reductants in a range of proportions. Carbothermic reduction of the blends was carried out in a vertical Tamman resistance furnace at 1600–1650 °C for 30 min in an argon atmosphere; synthetic graphite was used as a reductant. Reaction products were characterized using scanning electron microscopy (SEM), energy dispersive spectroscopy (EDS), X-ray fluorescence (XRF) and X-ray diffraction (XRD). Significant amounts of Fe-rich metallic droplets/regions of different grain sizes (0.5 to 500 μm) were produced in these studies. The formation of Fe-Si alloys with Si contents from 3.9 to 6.7 wt.% was achieved in 8 out of 10 blends; the optimal levels of Si for SMMs ranged from 3.2 to 6.5 wt.%. There was clear evidence for the formation of Fe-Si-Al (up to 1.8 wt.% Al) alloys in 4 out of 10 blends. In addition to lowering operating challenges associated with RM processing, blending of RMs with iron oxide additives and alumina presents a novel recycling approach for converting RMs into valuable SMMs for possible emerging applications in renewable energy, storage, electrical vehicles and other fields. Along with reducing RM stockpiles across the globe, this approach is expected to improve resource efficiency, mitigating environmental impacts while generating economic benefits.

1. Introduction

Red mud, also known as bauxite residue, is a massive waste by-product of the aluminum industry, generated during the production of alumina from the bauxite ore by the Bayer method [1]. Producing one tonne of alumina generates an estimated 1.0–1.5 tonnes of red mud [2]. With the global generation of RM expected to exceed 200 million tonnes annually, red mud stockpiles have surpassed 4.6 billion tonnes worldwide, and continue to increase steadily [3,4]. RM is considered as one of the largest industrial wastes produced in the nonferrous metal industry [5]. The production of red mud is expected to increase at an even faster rate in future due to upward trends in global demand for aluminum metal, and with continued decline in the availability of high-grade bauxite ore [6,7]. Generally stored in vast waste reserves, RM is a significant environmental threat due to its high salinity, high alkalinity, presence of radioactive elements, small particle sizes and being voluminous [8,9]. Several environmental incidents involving red mud storage facilities have already been reported in the literature [10]. In addition to spillage, there is a strong likelihood of soil and groundwater contamination, which can harm the local population as well as the surrounding ecosystem [11]. Environmentally sustainable, technically and economically feasible disposal of red mud is a major challenge and a pressing issue for the aluminum industry as a whole. With typical utilization/recycling rates for RMs ranging between 4–10% across the globe [12], developing novel, economically viable recycling routes and producing value-added products from RMs is a great incentive. Most current options can only accommodate a small fraction of the red mud generated globally [13].
In the present research, we present a novel approach to the transformation of red mud into value added products for different technological applications, e.g., advanced electrical devices, ferrous alloys and others. A brief overview is presented next on the current status of RM waste management strategies, basic background on soft magnetic materials and aims of the investigation for a proper perspective.

1.1. RM Waste Management Strategies

Extensive efforts have been made toward processing, recycling and utilizing RM waste and resource recovery; several excellent reviews are available on various aspects of managing RM waste [12,14,15,16]. Depending on the composition of the bauxite ore and technical processes involved in the extraction of bauxite, the major constituents of RM are: Fe2O3: 11–46 wt.%; Al2O3: 15–21.2 wt.%; SiO2: 4.4–18.8 wt.%; TiO2: 4.9–21.2 wt.%; CaO: 1–22.2 wt.%; and Na2O: 1–10.3 wt.% [17]. Key approaches used in RM recycling include building and functional materials [18,19,20]; recovery of iron and other metals [21,22,23], adsorption, removal of impurities, material modification etc. [24,25,26].
Cementitious materials have been prepared by mixing RMs (up to 24%) with waste slags as filler materials for mine backfilling and stabilizing underground cavities; this approach takes advantage of the high alkalinity, fine particulate sizes and extensive capillary pores present in the RMs to produce materials with high compressive strength [27]. Red mud has also been used extensively in the preparation of pavement materials for the construction of roads [28]. High contents of iron and alumina were found to aid the clinkering process, the production of concretes and cements with desired compressive and flexural strengths [29]. Mixtures of clay and RM (20–50 wt.%) were sintered (800–1100 °C) to prepare ceramic bricks for construction applications [30]; other types of bricks such as non-fired, ceramic glazed tiles, non-steam cured bricks, hollow bricks, decorative bricks, fly ash bricks etc. have also been prepared [31,32]. Glass ceramics containing CaO, SiO2 and Al2O3 have been produced with up to 85% industrial waste mixtures (fly ash and RM) [33]; lightweight building aggregate ceramics have also been prepared with mixtures of RMs, fly ash and silica [34].
Fe-bearing constituents of RMs are typically present in the form of oxides or oxyhydroxides; their concentrations can range between 11 to 46 wt.% depending on the source and location [17,35]. Several techniques such as hydrometallurgical [36], low temperature carbothermal reduction [37], high gradient superconducting magnetic separation [38], sulfuric acid leaching [39], smelting reduction [40], suspension reduction [41], bioleaching [42] etc. have been used for separating and recovering iron-bearing phases. In order to extract the residual alumina from RMs, hydrometallurgical as well as biometallurgical approaches have been developed [43]. Titanium has been recovered from various RMs using acid leaching followed by heat treatments [44] or through hydrolysis, calcination and acid leaching [45]. Several studies have been reported on extracting rare earth elements such scandium, yttrium, gallium etc. from RMs using selective leaching with minerals as well organic acids in a hydrometallurgical approach [46,47]. Other applications of RMs include the treatment of wastewater, producing magnetic additives from red mud and bagasse, alumina based, neutralizing acid mine drainage, mitigation of environmental impacts, preparation of nickel iron and copper ions adsorbents [48,49,50,51].

1.2. Soft Magnetic Materials

The discovery of silicon-based electrical steels is considered a major milestone in the field of soft magnetic materials (SMMs) [52]. Soft magnetic materials play a key role in the conversion of electrical energy and power electronics through devices such as transformers, inductors, electrical machines, motors and generators, etc.; these can rapidly switch their magnetic polarization under small, applied fields [53]. In both AC and DC applications, these materials play a vital role in various facets of power generation, conversion and energy sectors [54]. With an annual growth rate in excess of 18%, the worldwide demand for SMMs is expected to reach about 103,000 tonnes in 2023 [55]. New electrical vehicles, including charging piles, photovoltaic and variable-frequency air conditioning units, accounted for 29.2%, 33.4% and 26.1%, respectively of the total demand for SMMs [56].
Silicon steels dominate the global market (more than 90% by volume) of soft magnets, and are a material of choice for electrical machines and large transformers [57]. Together with balanced characteristics, magnetic parameters and low costs, electrical steels with a silicon content of 3.2 wt.% are among the most widely used SMMs [58]. However, these SMMs, both amorphous and nanocrystalline phases, are limited by their poor mechanical strengths, limited availability, and high costs that significantly hamper their widespread industrial utilization [59]. With better permeability and lower losses, ductile high silicon steels (Fe-6.5 wt.% Si) are showing great promise for high power inductors [60]. Ternary alloys such as Fe-Si-Al, Fe-Si-Cr, Fe-Si-Cu and others are also being developed toward enhancing saturation polarization and improved ductility and for high-frequency applications [61].
Although these materials have been used in the industry for several decades, the demand for electrical steels is skyrocketing these days, especially for use in high-powered electrical motors for electrical vehicles. Efficient and cost-effective SMMs play a key role in the adoption of electric vehicles and in renewable electricity. According to global statistics for 2024, 13.68 million electric vehicles were sold, 2.54 million charging stations installed and the revenue was expected to reach 786.2 billion USD worldwide [62]. Therefore, there is immense potential for developing new technologies and avenues by producing basic material resources for electrical steels/SMMs.

1.3. Aims of the Investigation

Although several approaches are being used for recycling RMs, the overall recycling rates continue to be very low (~10%). For a recycling approach to be commercially successful, its economic viability along with environmental sustainability is of crucial importance. With the focus on producing value added products from RMs, this investigation aimed to transform RMs into electrical steels for utilization in advanced electrical devices. Using iron-based additives, alumina and carbonaceous reductants, RMs were transformed into Fe-Si and Fe-Si-Al SMMs. The present research could lead to significant advances in waste valorization and environmental sustainability by producing basic raw materials for emerging applications in renewable energy, storage, electrical vehicles, mobile communications, and robotics.

2. Materials and Methods

2.1. Materials and Blend Compositions

Two sets of studies were carried out in this investigation based on RMs from two sources and their blends with several additives, namely, Fe2O3, primary (black) mill scales (MS) and secondary (red) mill scales. Two RMs labeled as RMA and RMB were sourced from the Ural Aluminum Plant, Kamensk-Uralsky, Russian Federation and the Bogoslovsky Aluminum Plant Russian Federation, respectively. While the black MS is composed of three different iron oxides, namely wüstite (FeO), magnetite (Fe3O4), and hematite (Fe2O3), the red MS is essentially composed of red ferric oxide (Fe2O3) [63]. These mill scales were sourced from the steel plants of ArcelorMittal, Temirtau, Kazakhstan. Further details of their basic characteristics are given elsewhere [64]. In Set I, two blends were prepared: blend#1 (20 g RMA + 20 g of Fe2O3) and blend#2 (20 g RMA + 20 g of red MS). The composition of RMA and its blends are provided in Table 1. With red MS ≈ 100% Fe2O3 (apart from minor impurities), the data for the Fe2O3 holds for the red MS as well.
In Set II, a fraction of RMB was replaced with alumina (Al2O3). Two combinations were used as follows: in the first one, 20 g of RMB was replaced with 5 g Al2O3 + 15 g RMB; and in the second one, 20 g RMB was replaced with 10 g Al2O3 + 10 g RMB. These mixtures were then blended with 20 g Fe2O3 or 20 g red MS. The composition of the RMB and its blends have been provided in Table 2.
In Set III, black MS was used as the iron additive, which is a mixture of three iron oxides, namely, FeO, Fe2O3 and Fe3O4; the net iron content is listed in Table 3 as Fe2O3. As the black MS, the primary mill scale, is often referred to as just MS, the label MS is used in Table 3.
Synthetic graphite was used as the reductant in these investigations; 10 g of graphite was added to 40 g of RMs/various blends prior to the heat treatments.

2.2. Experimental

The carbothermic reduction of blends was carried out in a vertical Tamman resistance furnace. The schematic representation of the furnace and details regarding the furnace operation have been presented elsewhere [64]. Small graphite crucibles (diameter: 20 mm; height: 90 mm, wall thickness: 2 mm) were used to load about 10 g of various powdered blends; three of these crucibles were then loaded in a large cylindrical graphitic container for simultaneous heat treatments. A W-Re thermocouple was placed in the large crucible for measuring temperatures and thermal control. The furnace was heated to 1600–1650 °C at a heating rate of 10–20 °C/min and was continuously purged with argon (0.5 L/min). Specimens were held at the set temperature for 30 min. At the end of the heat treatment, the furnace was switched off. The crucibles were allowed to cool down within the furnace; the samples were extracted from the furnace at room temperature. All experiments and analytical investigations on the heat treated products were repeated at least three times. A number of analytical techniques, such as scanning electron microscopy (SEM), energy dispersive spectroscopy (EDS), X-ray diffraction (XRD), and X-ray fluorescence (XRF), were used for in-depth characterization. The SEM, EDS, and XRF investigations were carried out on a Tescan Vega 3 (TESCAN, Czech Republic with Oxford instruments EDS detector) with sub-micron resolution. The specimens were carbon-coated prior to microscopic investigations; XRF/EDS was carried out for microscopic and elemental analyses of the reaction products. The XRD data were collected with an X-ray diffractometer (Difrey 401, Scientific Instruments, St. Petersburg, Russia) with Cu Kα radiation: 45 KV, 40 mA, angular range: 10–90°, step size: 0.1° and a time step: 5 s [64].

3. Results

3.1. Set I: Blends of RMA with Fe2O3 and Red MS

Figure 1 shows SEM-EDS images of reaction products after carbothermic reduction of RMA at 1600–1650 °C for 30 min. The metallic phase is present throughout the matrix in the form of very small micron sized droplets. The slag phase/other solid phases can be seen clearly. The typical composition of the metallic phase was identified as: 86.9 wt.% Fe, 9.9 wt.% Si and 1.1 wt.% P. The constituents of the slag phase were: 46.9 wt.% O, 25.4 wt.% Al, 24.6 wt.% Ca, 2.4 wt.% Si, 0.4 wt.% Mg, and 0.3 wt.% Fe. SEM-EDS observations were carried out at a number of close-lying points in various regions; average values as determined from several measurements are reported here.
Figure 2 shows SEM-EDS images of reaction products after carbothermic reduction of the 20 g RMA + 20 g Fe2O3 blend at 1600–1650 °C for 30 min. The metallic droplets had grown in size, although they were still micron sized. The typical composition of the metallic phase was determined as: 92.3 wt.% Fe, 5.6 wt.% Si and 2.1 wt.% Ti. The constituents of the slag phase were: 45.3 wt.% O, 39.4 wt.% Ca, 14.8 wt.% Si, and 0.5 wt.% Fe. The level of Si had reduced significantly in the metallic droplets; however, the Si levels had increased significantly in the slag phase. These results indicate that the blending of RMA with Fe2O3 caused the movement of Si from the metallic phase to the slag phase. Some slag domains/areas containing high levels of alumina were also observed.
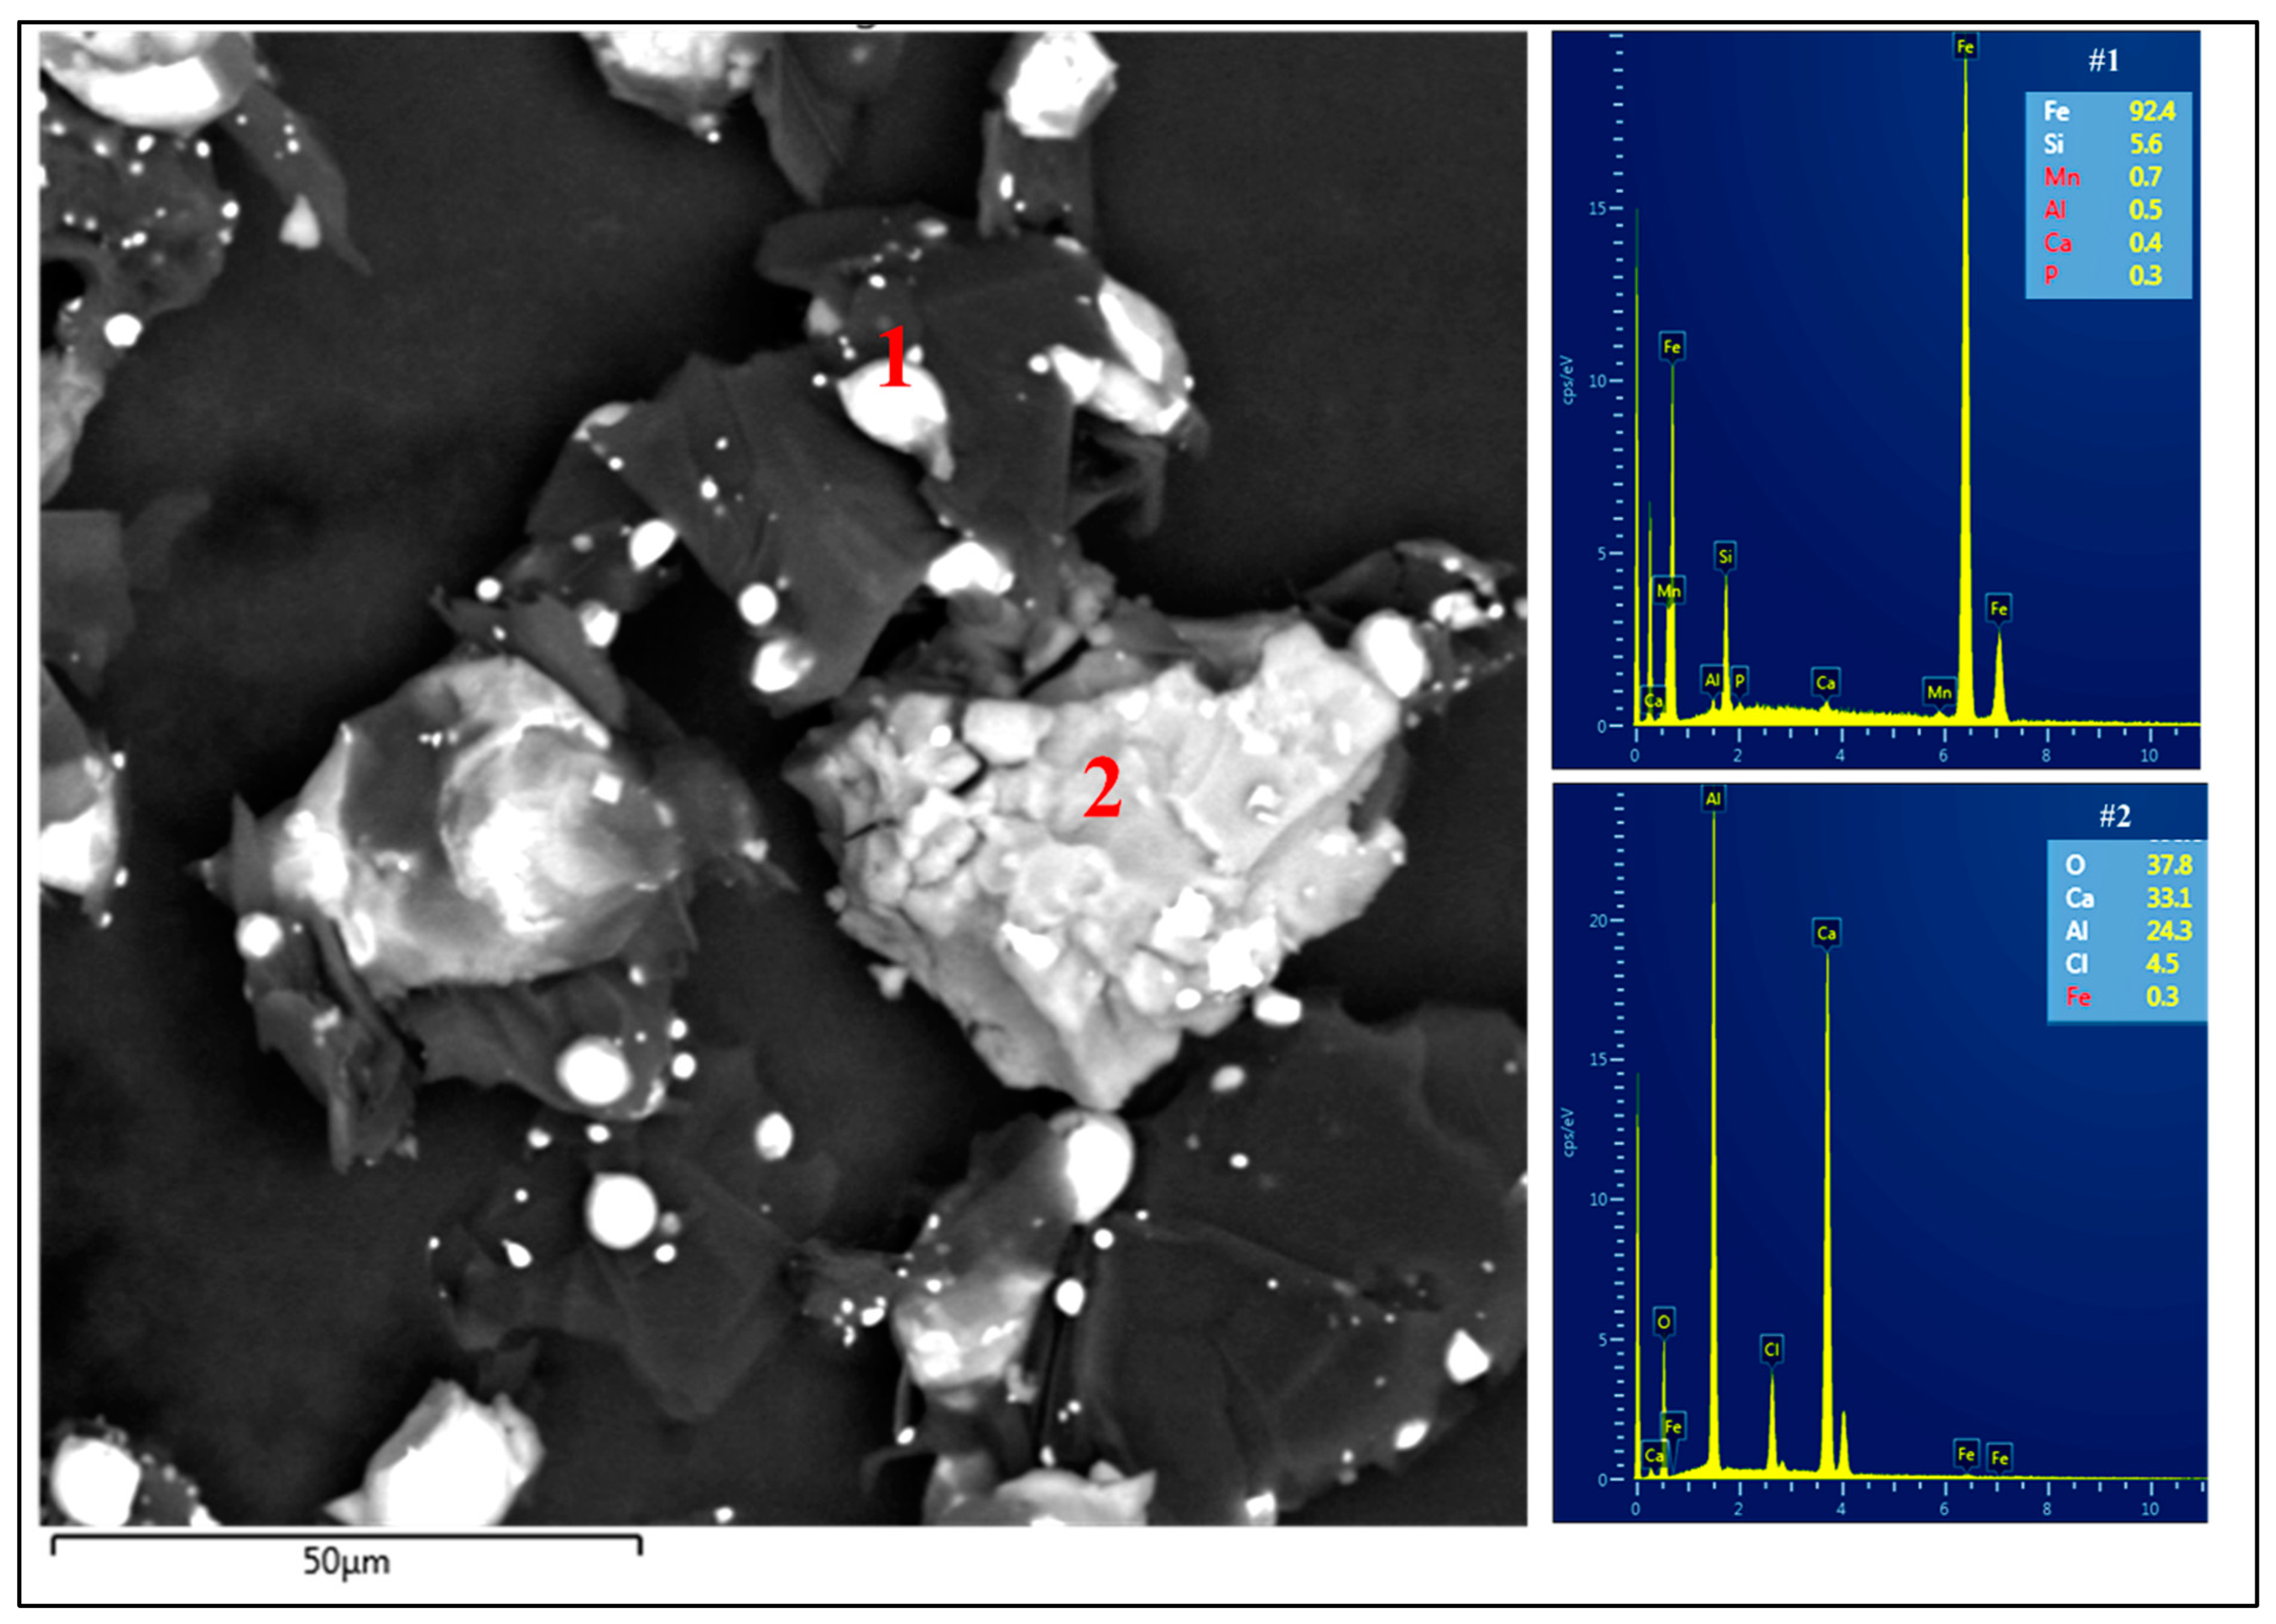
Figure 3 shows SEM-EDS images of reaction products after carbothermic reduction of the 20 g RMA + 20 g red MS blend at 1600–1650 °C for 30 min. The metallic droplets had grown significantly in size. The typical composition of the metallic phase was determined as: 92.4 wt.% Fe, 5.6 wt.% Si, 0.5 wt.% Al, 0.4 wt.% Ca and 0.3 wt.% P. The constituents of the slag phase were: 37.8 wt.% O, 33.1 wt.% Ca, 24.4 wt.% Al, 4.5 wt.% Cl, and 0.3 wt.% Fe. Some slag regions containing significant amounts of silica were also recorded.
A comparison of key findings from Figure 1, Figure 2 and Figure 3 in terms of elemental distributions is shown in Figure 4. Seen as bright droplets, the size of the metallic droplets showed a continuous increase in going from Set I to Set III. In the case of Figure 4A (RMA), the presence of Fe was recorded both in the metallic phase as well as the slag phase. Similar observations were made for Si as well. However, both Ca and Al were present only in the slag phase. In the case of Figure 4B (20 g RMA + 20 g Fe2O3), there were widespread regions showing the simultaneous presence of Fe and Si; these regions were depleted of both Ca and Al. However, there was a large particulate (bottom left corner) rich in Si and Ca with little Fe. In the case of Figure 4C (20 g RMA + 20 g red MS), the sizes of the metallic droplets rich in both Fe and Si had increased significantly. In addition, there were spherical as well as large particles/phases of irregular outlines primarily containing Ca and Al only.

3.2. Set II: Blends of RMB with Al2O3, Fe2O3, and Red MS

3.2.1. Blends of RMB with Al2O3 and Fe2O3

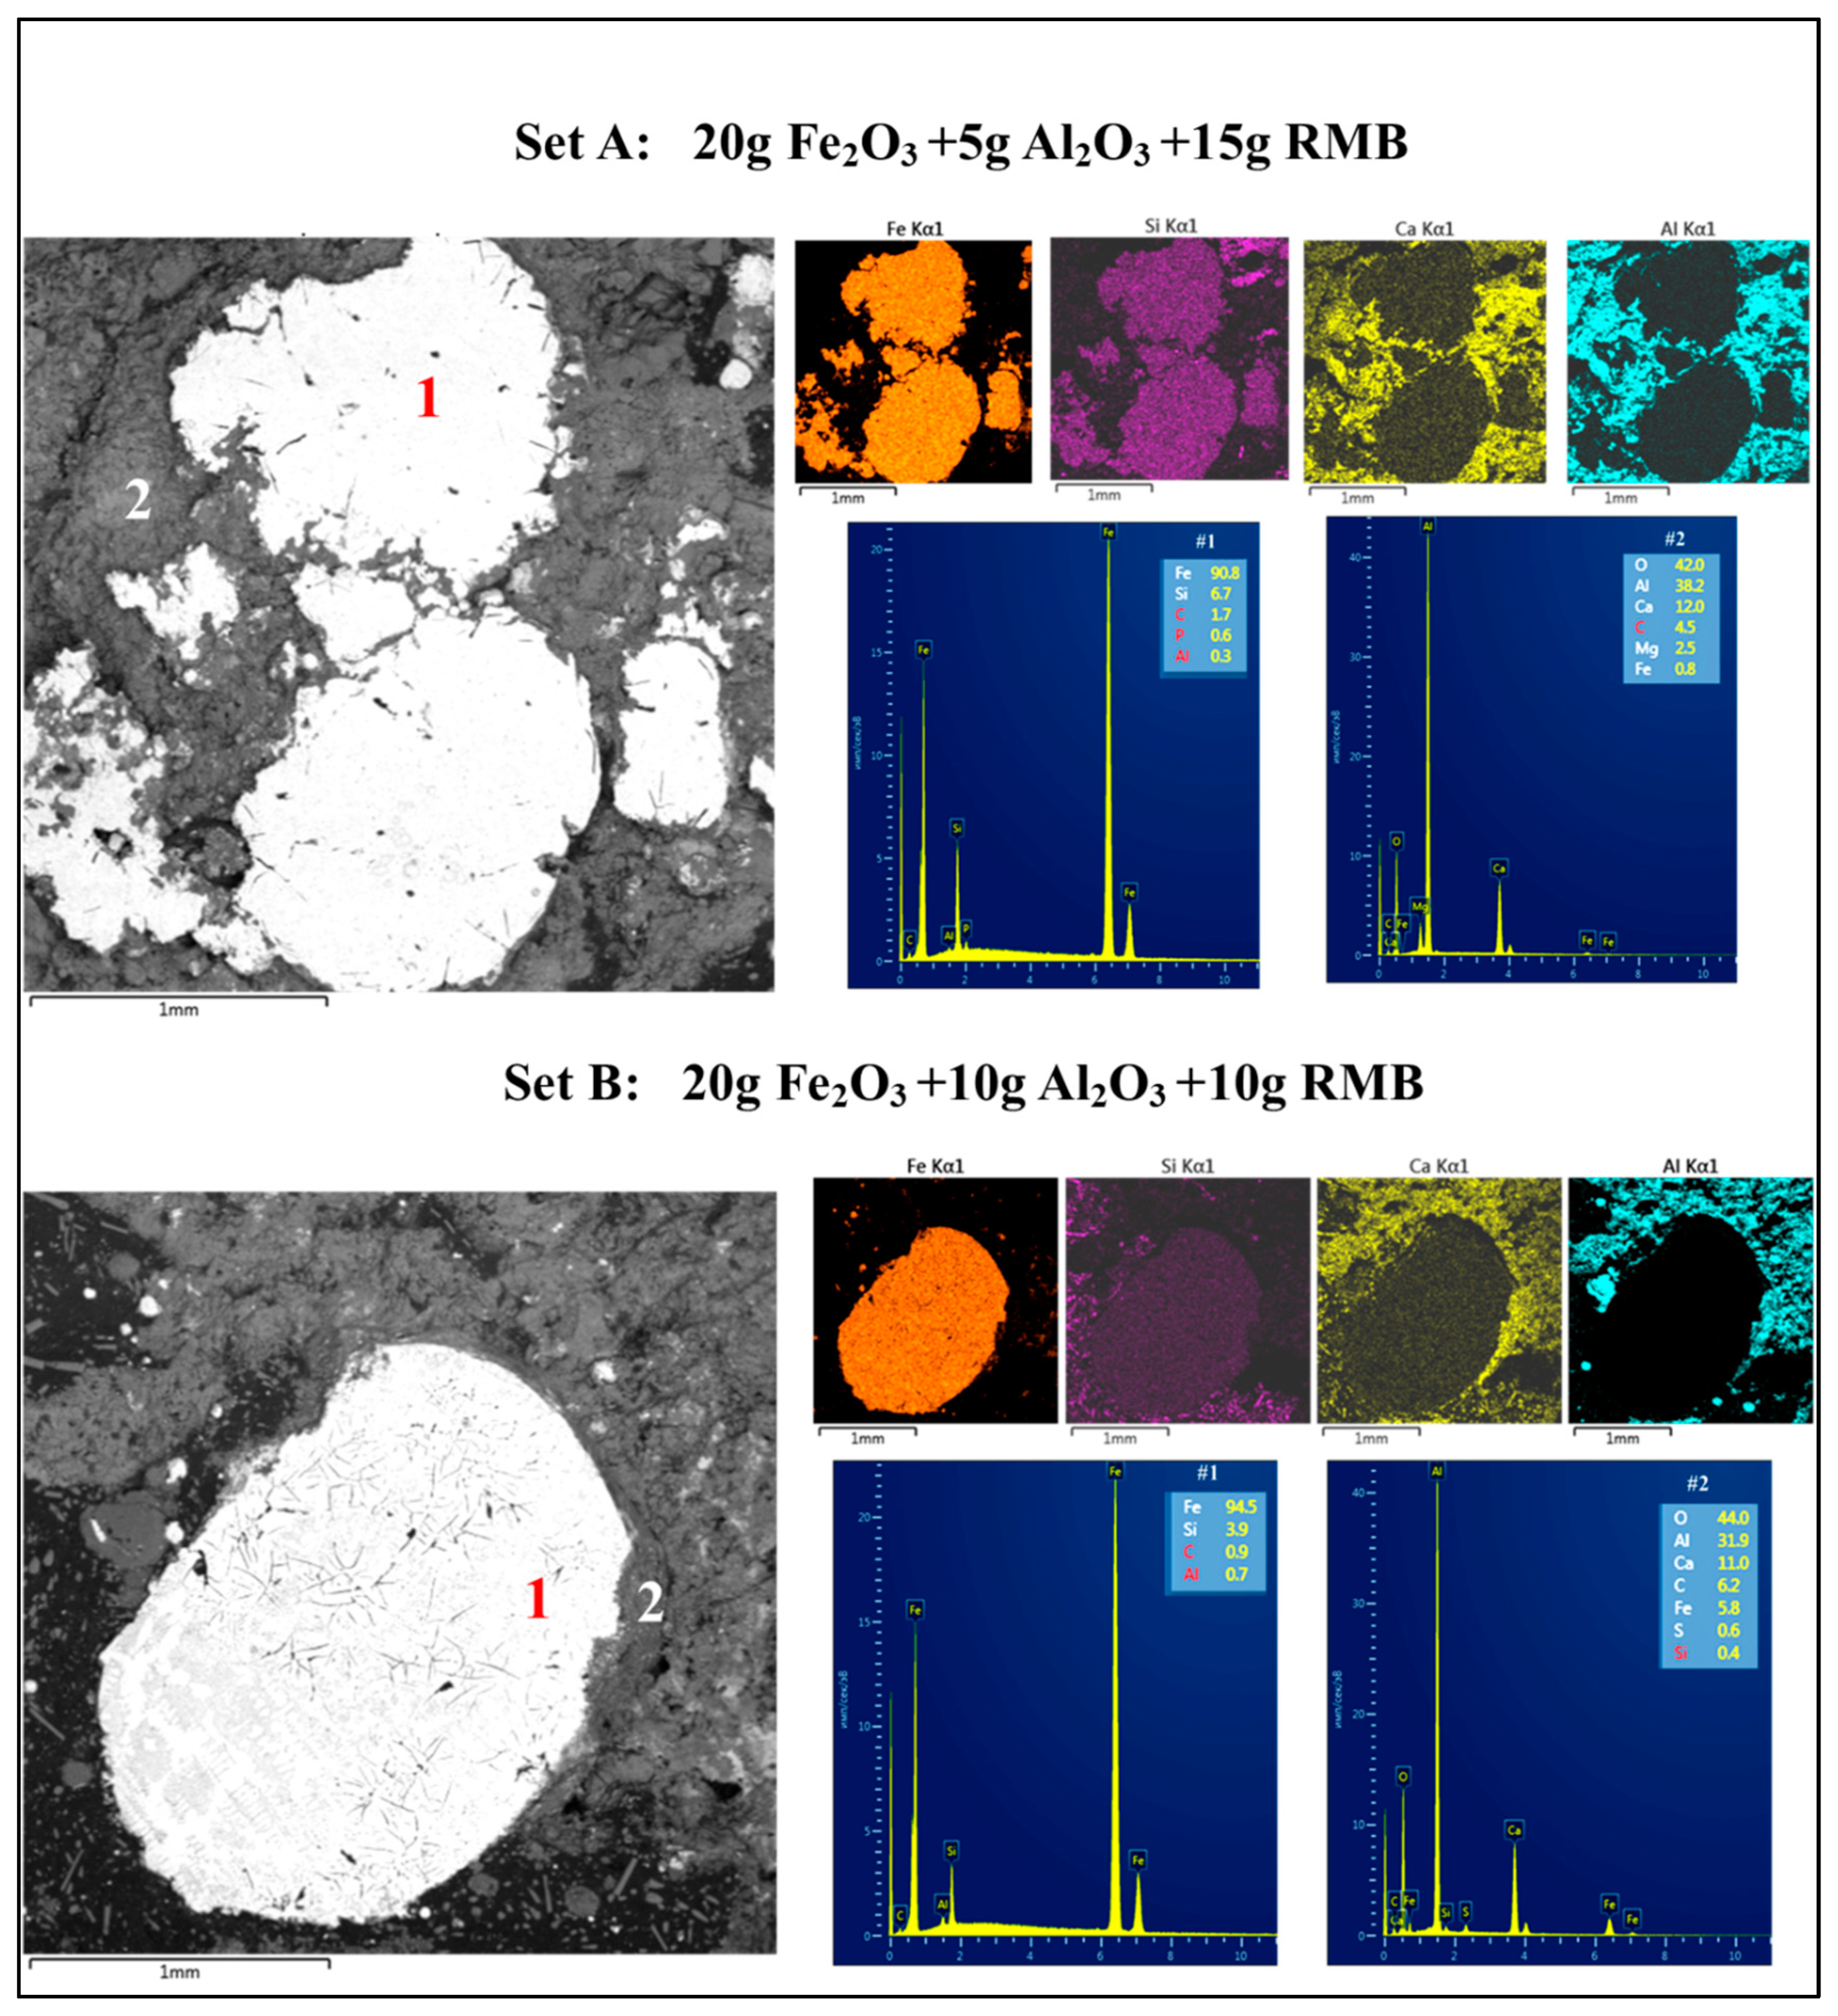
The results for two blend compositions are reported here: Set A (20 g Fe2O3 + 5 g Al2O3 + 15 g RMB) and Set B (20 g Fe2O3 + 10 g Al2O3 + 10 g RMB). The SEM-EDS elemental composition results for the residues after carbothermic reduction at 1600–1650 °C for 30 min are shown in Figure 5.
The first point to note in Figure 5 is the scale on the horizontal axis in the SEM images. This scale is 1 mm, whereas the corresponding scales in Figure 1, Figure 2, Figure 3 and Figure 4 were only 50 μm. This means that the sizes of the metallic droplets were much bigger (20 times or more) in the present scenario. The composition of the metallic phase in Set A was determined as: 90.8 wt.% Fe, 6.7 wt.% Si, 1.7 wt.% C, 0.3 wt.% Al and 0.6 wt.% P. The constituents of the slag phase were: 42.0 wt.% O, 12.0 wt.% Ca, 36.2 wt.% Al, 2.5 wt.% Mg, and 0.5 wt.% Fe. In Set B, the composition of the metallic phase was determined as: 94.5 wt.% Fe, 3.9 wt.% Si, 0.9 wt.% C, and 0.7 wt.% Al. The constituents of the slag phase were: 41.0 wt.% O, 11.0 wt.% Ca, 31.9 wt.% Al, 5.8 wt.% Fe, 0.6 wt.% S, and 0.4 wt.% Si. Most of the Si was found concentrated in the metallic phase and very little in the slag phase. Both calcium and aluminium were concentrated in the slag phase. These features are also reflected clearly in the elemental distribution maps of Sets A and B.

3.2.2. Blends of RMB with Al2O3 and Red MS

Results of the elemental distribution maps as SEM-EDS elemental profiles for blends with red MS are shown in Figure 6. Results for the two blend compositions are reported here: Set A (20 g red MS + 5 g Al2O3 + 15 g RMB) and Set B (20 g red MS + 10 g Al2O3 + 10 g RMB). The composition of the metallic phase in Set A was determined as: 88.7 wt.% Fe, 6.6 wt.% Si, 2.4 wt.% C, 1.8 wt.% Al and 0.5 wt.% P. The constituents of the slag phase were: 47.7 wt.% O, 10.9 wt.% Ca, 36.7 wt.% Al, and 1.1 wt.% S. In Set B, the composition of the metallic phase was determined as: 90.5 wt.% Fe, 6.5 wt.% Si, 1.3 wt.% C, 1.4 wt.% Al, and 0.5 wt.% P. The constituents of the slag phase were: 42.9 wt.% O, 14.1 wt.% Ca, 39.0 wt.% Al, 0.9 wt.% Fe, and 0.6 wt.% S. Most of the Si was once again found concentrated in the metallic phase and very little in the slag phase. While both Ca and Al were found concentrated in the slag phase, there was a clear indication of pickup of Al in the metallic phase. These features are reflected clearly in the elemental distribution maps of Sets A and B as well.

3.3. Set III: Blends of RMB with MS (Black) and Al2O3

The results for the three blend compositions are reported here: Set A (20 g MS + 20 g RMB), Set B (20 g MS +5 g Al2O3 + 15 g RMB) and Set C (20 g MS + 10 g Al2O3 + 10 g RMB). The SEM-EDS-Elemental composition results for the residues after carbothermic reduction at 1600–1650 °C for 30 min are shown in Figure 7.
It is important to note that the horizontal scale in Figure 7 is 100 μm as compared to 50 μm in Figure 5 and 1 mm in Figure 6; this information has serious implications for the sizes and recovery of metallic droplets. An iron-rich droplet containing 96.7 wt.% Fe, 1.8 wt.% C, 0.9 wt.% Al, and 0.6 wt.% Si was obtained from Set A (20 g MS + 20 g RMB). In Set B (20 g MS + 5 g Al2O3 + 15 g RMB), large clusters of metallic regions were observed; their composition was determined as: 92.3 wt.% Fe, 5.2 wt.% Si, 1.1 wt.% Al, 0.8 wt.% C, and 0.6 wt.% Cr. In Set C (20 g MS + 10 g Al2O3 + 10 g RMB), large areas of metallic regions were observed. Their composition was determined as: 91.1 wt.% Fe, 5.2 wt.% Si, 1.6 wt.% Al, 1.1 wt.% C, 0.7 wt.% Cr, and 0.3 wt.% P.

3.4. X-Ray Diffraction Investigations

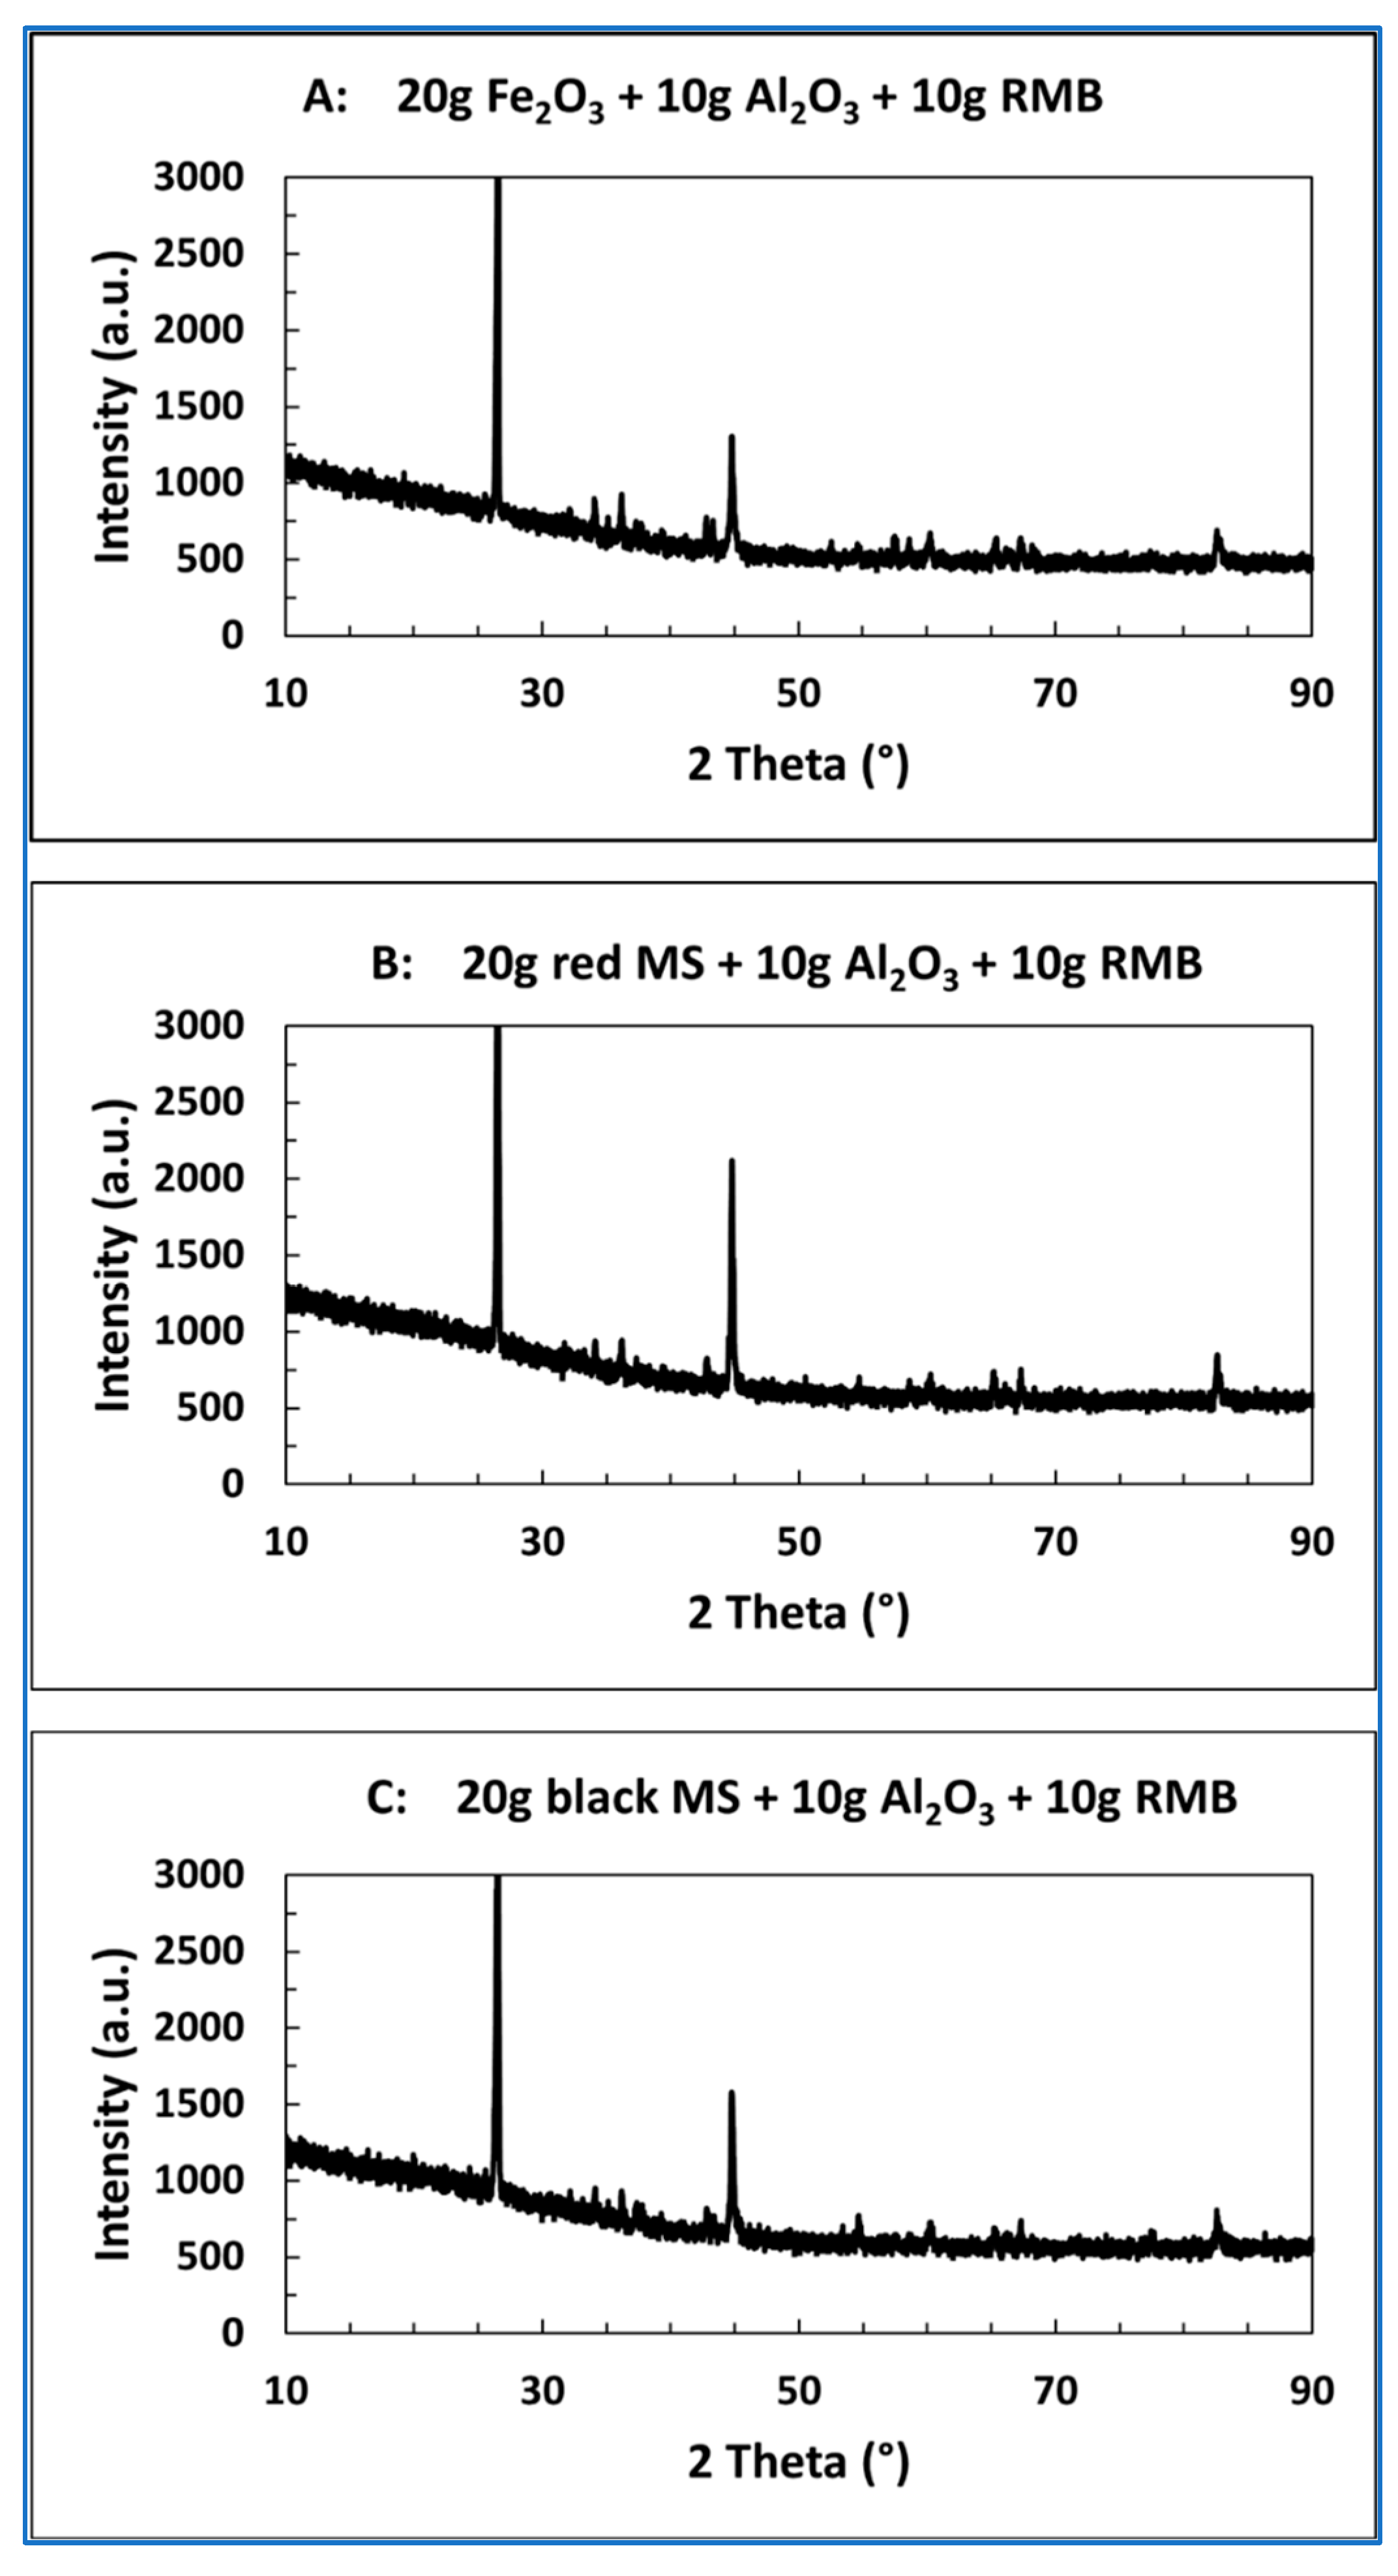
The XRD patterns of three representative examples are shown in Figure 8. All three patterns showed several small peaks in addition to two strong peaks for C and Al2O3. As small differences were observed in the heights of strong peaks (C and Al2O3) and in the location of minor peaks, XRD plots for the three blends are shown separately as Figure 8A–C. While the formation of new phases is indicated by the presence of small peaks, it is difficult to characterize these phases at the moment. The likelihood of forming amorphous phases also cannot be ascertained from the present data [61]. Heat treatments for longer times would be necessary for a significant evolution/concentration of new phases to extract quantitative structural information from the XRD data.

4. Discussion

There were significant differences in the basic characteristics and compositions of metallic droplets/regions as seen in Figure 1, Figure 2, Figure 3, Figure 4, Figure 5, Figure 6, Figure 7 and Figure 8. The compositions and size ranges of the metallic droplets are summarized in Table 4 for a quick comparison. Data have only been provided for Fe, Si, and Al due to their importance for soft magnetic materials; detailed information on other minor elements is available in the results section. High resolution SEM images for all 10 blends are shown in Figure 9 for identifying the size ranges of the metallic droplets with relative ease. These results will be discussed in terms of the three sets of the investigation.
Set I: The blend #1 contained only RMA without any additives. Its key constituents were: Fe2O3: 36.9 wt.%, SiO2: 11.8 wt.%, Al2O3: 8.71 wt.% and CaO: 23.8 wt.%. The levels of iron oxide present were on the low to medium side and relative proportions of impurity elements were on the high side. Very small sized (1–3 μm) metallic iron droplets were observed containing high levels of Si (9.0 wt.%). However, when Fe2O3 was added to RMA in a 1:1 proportion (blend #2), the composition changed to Fe2O3: 68.5 wt.%, SiO2: 5.9 wt.%, Al2O3: 4.35 wt.% and CaO: 11.9 wt.%. With enhanced availability of Fe as compared to various impurity elements, the levels of Si in the iron-based alloy were now down to 5.6 wt.%. Similar results were obtained from blend #3 (Fe2O3 additive replaced with red MS), albeit with significant increases in the sizes of the metallic droplets.
Set II: There were two key differences in the composition of the blends in Set II. Firstly, the red mud (RMB) had a much higher iron content as compared with the RMA used in Set I. Secondly, a portion of the red mud was replaced with alumina to reduce challenges associated with red mud processing. Studies in Set I had already shown the usefulness of adding Fe2O3 (or red MS) to RM to achieve better control over the composition of the iron alloys. In Set II, alumina was added to the mix in addition to Fe2O3 (or red MS) and the relative proportions of RMB were further reduced. These modifications led to major differences in the iron-based alloys produced. As seen in Table 4 and Figure 9, the size of the metallic droplets showed a massive growth in sizes increasing from 0.5–4 μm (blend # 2) to 60–300 μm (blends # 4, 5) with Fe2O3 and Al2O3 additives, and from 5–15 μm (blend # 3) to 100–500 μm (blends # 6, 7) with red MS and Al2O3 additives. This interesting finding can be interpreted in terms of atomic scale interactions between iron and alumina. Alumina is well-known to be non-wetting to iron and the interaction between Fe and Al2O3 is repulsive in nature [65]. In atomistic computer simulations, Fe and Al2O3 were shown to be mutually exclusive with a tendency to displace each other [66]. The repulsion between alumina and Fe tended to coagulate iron rich regions together into much bigger regions/sizes. This result is of great significance while extracting iron-based alloys from the residues after carbothermic reduction. Alumina is naturally present in red muds as complexes with SiO2/Na2O/K2O, etc.; however, the characteristics/behavior of these complexes can be significantly different from that of pure alumina [67]. An increase in the Al2O3 content in the slag can also increase the interfacial tension between the slag and the steel [68].
The second key facet is the elemental composition of the observed metallic regions. The concentrations of Si in metallic iron were found to range between 3.9 to 6.7 wt.%, ideal concentrations for soft magnetic materials. There was a pick-up of small amounts of Al as well with values of 0.03 and 0.7 wt.% for blends #4 and #5 (Fe2O3 based) and 1.8 and 1.4 wt.% for blends #6 and #7 (red MS based). The pick-up of Al by iron droplets has been previously reported by our group during valorization of iron and aluminium oxide rich industrial wastes [69]. It has been shown that alumina degradation can occur in the temperature range 1550–1700 °C in the presence of molten iron, carbon and inert atmospheres [70]. Small particle sizes of red MS (20–80 nm) [71] and an associated large surface area are expected to provide higher reactivity as compared to Fe2O3 powders (a few microns in size), aiding the pick-up of Al by metallic iron [64].
Set III: Here, the key iron oxide additive was primary (black) MS, which contains iron oxides in three chemical forms, i.e., FeO (wüstite), Fe3O4 (magnetite), and Fe2O3 (hematite). It may also contain impurities such as C, Ca, Si, Na, Al, Cr, Mn, etc. [72]. It is a major waste generated by the iron and steelmaking sector; nearly 39 million tonnes of MS were generated worldwide in 2021 [73] and this can amount to about 2% of the total steel rolled in rolling mills [74]. The results obtained with MS (a mixture of iron oxides) (blends #9, 10) were quite comparable to those obtained with red MS (Fe2O3 alone) (blends #6, 7). The only difference was in the particle sizes of the metallic regions; these had reduced from 100–500 μm to 50–150 μm. This result suggests that the presence of multiple oxides of iron as additives would not have a detrimental influence on the generation of Fe-Si or Fe-Si-Al alloys.
Concerning the formation of soft magnetic materials, a close inspection of Table 4 shows the formation of Fe-Si alloys in 8 out of 10 blends investigated; the only two unsuccessful cases were blend #1 (RMA) and blend #8 (20 g MS + 20 g RMB). Optimal levels of the alloying element silicon required for practical SMMs are between 3.2 to 6.5 wt.% Si [58,60]. In this study, Si levels observed in the metallic droplets were found to range between 3.9 to 6.7 wt.%; these values are right in the middle of the desired range. There was also clear evidence for the formation of Fe-Si-Al alloys in 4 out of 10 blends investigated. Previously, most studies were focused on extracting iron in the form of pig iron from a variety of RMs [6,75] and little attention was paid toward extracting designer valuable alloys from RMs.
Iron rich concentrates and ferroalloys generated in this study can be extracted by grinding the roasted reaction products followed by magnetic separation and sieving [75,76]. Blends #4 to 7 hold good promise for extraction due to their large grain sizes and poor adhesion to alumina rich slags and other reaction products. Future research is needed to map the effects of blend compositions, temperature, heat treatment times, and reductants toward enhancing the recovery of SMMs from a variety of RMs.

5. Conclusions

Based on our detailed study on the carbothermic reduction of two RMs in the presence of iron-based additives, alumina and carbonaceous reductants, we investigated the formation of Fe-Si and Fe-Si-Al soft magnetic materials. Key findings from this study are summarized below.
  • The carbothermic reduction behavior of two RMs and their blends with three iron-oxides (Fe2O3, black and red MS) and Al2O3 additives was investigated at 1600–1650 °C, 30 min as Sets I, II and III. These were followed by detailed characterization of the reduction products, especially the metallic phases.
  • Si levels in the iron-rich metallic droplets showed a wide variation: Set I (5.6 to 9.0 wt.%), Set II (3.9 to 6.7 wt.%) and Set III (6.5 to 6.6 wt.%), thereby indicating the key role of initial blend compositions on Si pick-up by metallic droplets.
  • A broad variation was observed in the particulate sizes of the metallic droplets/regions generated: Set I (0.5 to 15 μm), Set II (60 to 500 μm), and Set III (30 to 150 μm). Non-wetting and repulsive interaction between Al2O3 and Fe played a key role in the assimilation of small droplets and subsequent growth of metallic regions. The Al2O3 content in the slag can also affect the interfacial tension between the slag and the steel.
  • The formation of Fe-Si was observed in 8 out of 10 blends investigated. With Si levels ranging between 3.9 to 6.7 wt.%, these metallics will be a highly suitable raw material for producing SMMs (optimal range: 3.2 to 6.5 wt.% Si). The formation of Fe-Si-Al alloys, another type of SMM, was observed in 4 out of 10 blends investigated.
  • This study presents a new approach for recycling RMs and their transformation into valuable SMMs for the energy sector. It will have a positive influence on the sustainable developments in the field impacting resource recovery, conservation, and economic/environmental sustainability.
  • Industrial waste such as RMs have little value, high disposal rates and extensive transport costs. The novel approach to RM recycling developed in this study will help conserve the natural environment and resources and reduce the burden on waste storage facilities while closing the loop of a sustainable economy.

Author Contributions

R.K.: Conceptualization, Methodology, Supervision, Writing—Review and Editing; Y.K.: Resources, Investigation, Writing—Original Draft, Supervision; D.Z.: Investigation, Validation; K.L.: Data Curation, Analysis, Visualization; N.M.: Methodology, Investigation; I.B.: Formal analysis, Funding acquisition; J.K.: Resources, Funding acquisition; M.K.: Project administration, Funding acquisition; P.S.M.: Resources, Formal analysis. All authors have read and agreed to the published version of the manuscript.

Funding

This research received no external funding.

Institutional Review Board Statement

Not applicable.

Informed Consent Statement

Not applicable.

Data Availability Statement

The original contributions presented in the study are included in the article; further inquiries can be directed to the corresponding author.

Conflicts of Interest

The authors declare that they have no known competing financial interests or personal relationships that could have appeared to influence the work reported in this paper.

References

  1. Mahinroosta, M.; Karimi, Z.; Allahverdi, A. Recycling of red mud for value-added applications: A comprehensive review. Encycl. Renew. Sustain. Mater. 2020, 2, 561–582. [Google Scholar]
  2. Wang, M.; Liu, X. Applications of red mud as an environmental remediation material: A review. J. Hazard. Mater. 2021, 408, 124420. [Google Scholar] [CrossRef]
  3. Li, Z.; Gu, H.; Hong, B.; Wang, N.; Chen, M. An innovative process for dealkalization of red mud using leachate from Mn containing waste. J. Environ. Chem. Eng. 2022, 10, 107222. [Google Scholar] [CrossRef]
  4. Xue, S.G.; Wu, Y.J.; Li, Y.W.; Kong, X.F.; Zhu, F.; William, H.; Li, X.F.; Ye, Y.Z. Industrial wastes applications for alkalinity regulation in bauxite residue: A comprehensive review. J. Cent. South Univ. 2019, 26, 268–288. [Google Scholar] [CrossRef]
  5. Mukiza, E.; Zhang, L.; Liu, X.; Zhang, N. Utilization of red mud in road base and subgrade materials: A review. Resour. Conserv. Recycl. 2019, 141, 187–199. [Google Scholar] [CrossRef]
  6. Vigneshwaran, S.; Uthayakumar, M.; Arumugaprabu, V. Development and sustainability of industrial waste-based red mud hybrid composites. J. Clean. Prod. 2019, 230, 862–868. [Google Scholar] [CrossRef]
  7. Hua, Y.; Heal, K.V.; Friesl-Hanl, W. The use of red mud as an immobiliser for metal/metalloid-contaminated soil: A review. J. Hazard. Mater. 2017, 325, 17–30. [Google Scholar] [CrossRef]
  8. Liu, Y.; Lin, C.; Wu, Y. Characterization of red mud derived from a combined Bayer process and bauxite calcination method. J. Hazard. Mater. 2007, 146, 255–261. [Google Scholar] [CrossRef]
  9. Khairul, M.A.; Zanganeh, J.; Moghtaderi, B. The composition, recycling and utilisation of Bayer red mud. Resour. Conserv. Recyc. 2019, 141, 483–498. [Google Scholar] [CrossRef]
  10. Mayes, W.M.; Jarvis, A.P.; Burke, I.T.; Walton, M.; Feigl, V.R.; Klebercz, O.; Gruiz, K. Dispersal and attenuation of trace contaminants downstream of the Ajka bauxite residue (red mud) depository failure. Hungary. Environ. Sci. Technol. 2011, 45, 5147–5155. [Google Scholar] [CrossRef] [PubMed]
  11. Das, S.; Lee, S.-H.; Kumar, P.; Kim, K.H.; Lee, S.S.; Bhattacharya, S.S. Solid waste management: Scope and the challenge of sustainability. J. Clean. Prod. 2019, 228, 658–678. [Google Scholar] [CrossRef]
  12. Liu, Z.; Li, H. Metallurgical process for valuable elements recovery from red mud—A review. Hydrometallurgy 2015, 155, 29–43. [Google Scholar] [CrossRef]
  13. Wang, S.; Jin, H.; Deng, Y.; Xiao, Y. Comprehensive utilization status of red mud in China: A critical review. J. Clean. Prod. 2021, 289, 125136. [Google Scholar] [CrossRef]
  14. Snars, K.; Gilkes, R.J. Evaluation of bauxite residues (red muds) of different origins for environmental applications. Appl. Clay Sci. 2009, 46, 13–20. [Google Scholar] [CrossRef]
  15. Khanna, R.; Konyukhov, Y.; Zinoveev, D.; Jayasankar, K.; Burmistrov, I.; Kravchenko, M.; Mukherjee, P.S. Red Mud as a Secondary Resource of Low-Grade Iron: A Global Perspective. Sustainability 2022, 14, 1258. [Google Scholar] [CrossRef]
  16. Rai, S.; Bahadur, S.; Chaddha, M.J.; Agnihotri, A. Disposal practices and utilization of red mud (Bauxite Residue): A review in Indian context and abroad. J. Sustain. Metall. 2020, 6, 1–8. [Google Scholar] [CrossRef]
  17. Samal, S.; Ray, A.K.; Bandopadhyay, S.A. Proposal for resources, utilization and processes of red mud in India—A review. Int. J. Miner. Process. 2013, 118, 43–55. [Google Scholar] [CrossRef]
  18. Zhang, J.J.; Li, P.; Liang, M.; Jiang, H.; Yao, Z.; Zhang, X.; Yu, S. Utilization of red mud as an alternative mineral filler in asphalt mastics to replace natural limestone powder. Constr. Build. Mater. 2020, 237, 117821. [Google Scholar] [CrossRef]
  19. Li, H.; Shi, B.; Fu, X.; Zhang, H.; Yang, H. Preparation and application of red mud-based zero-valent iron heterogeneous Fenton catalyst: A new idea for red mud recycling. J. Environ. Chem. Eng. 2023, 11, 109998. [Google Scholar] [CrossRef]
  20. Shen, H.; Lou, B.; Liu, B.; Zhang, J.; Zhang, X.; Liu, J.; Zhang, R.; Chen, M.; Zhang, S. In-situ preparation of alumina-based cermet after reduction of iron oxide in red mud with aluminum dross. Ceram. Int. 2024, 50, 21630–21637. [Google Scholar] [CrossRef]
  21. Wang, K.; Dou, Z.; Liu, Y.; Li, X.; Lv, G.; Zhang, T.A. Summary of research progress on separation and extraction of valuable metals from Bayer red mud. Environ. Sci. Pollut. Res. 2022, 29, 89834–89852. [Google Scholar] [CrossRef]
  22. Agrawal, S.; Dhawan, N. Investigation of mechanical and thermal activation on metal extraction from red mud. Sustain. Mater. Technol. 2021, 27, e00246. [Google Scholar] [CrossRef]
  23. Li, W.; Li, Z.; Wang, N.; Hannian, G. Selective extraction of rare earth elements from red mud using oxalic and sulfuric acids. J. Environ. Chem. Eng. 2022, 10, 108650. [Google Scholar] [CrossRef]
  24. Zhang, D.R.; Chen, H.R.; Zhao, X.J.; Xia, J.L.; Nie, Z.; Zhang, R.Y.; Wen-Sheng Shu, W.S.; Pakostova, E. Fe(II) bio-oxidation mediates red mud transformations to form Fe(III)/Al (hydr)oxide adsorbent for efficient As(V) removal under acidic conditions. Chem. Eng. J. 2022, 439, 135753. [Google Scholar] [CrossRef]
  25. Tuazon, D.S.; Corder, D. Life cycle assessment of seawater neutralised red mud for treatment of acid mine drainage. Resour. Conserv. Recycl. 2008, 52, 1307–1314. [Google Scholar] [CrossRef]
  26. Li, C.; Yu, J.; Li, W.; He, Y.; Qiu, Y.; Li, P.; Wang, C.; Huang, F.; Wang, D.; Shiqiu Gao, S. Immobilization, enrichment and recycling of Cr (VI) from wastewater using a red mud/carbon material to produce the valuable chromite (FeCr2O4). Chem. Eng. J. 2018, 350, 1103–1113. [Google Scholar] [CrossRef]
  27. Lu, H.J.; Liang, P.; Gan, D.Q. Research on flow and sedimentation law of filling slurry and mechanical characteristics of backfill body. Rock Soil Mech. 2017, 38 (Suppl. S1), 263–270. [Google Scholar]
  28. Chen, X.Z.; Yang, X.C.; Guo, L.J.; Peng, X. Effect of curing age on the determination of cement content in cemented tailings backfill by EDTA titration method. Nonferrous Met. Eng. 2018, 9, 93–99. [Google Scholar]
  29. Feng, X.-P.; Liu, X.-M.; Sun, H.-H.; Bai, X.; Niu, X.-L. Study on the High Use Ratio of Red Mud in Cementitious Material. Multipurp. Utiliz. Miner. Resour. 2007, 4, 35–37. [Google Scholar]
  30. Dodoo-Arhin, D.; Konadu, D.S.; Annan, E.; Buabeng, F.P.; Yaya, A.; Agyei-Tuffour, B. Fabrication and Characterisation of Ghanaian Bauxite Red Mud-Clay Composite Bricks for Construction Applications. Am. J. Mater. Sci. 2013, 3, 110–119. [Google Scholar]
  31. Krivenko, P.; Kovalchuk, O.; Pasko, A.; Croymans, T.; Hult, M.; Lutter, G.; Vandevenne, N.; Schreurs, S.; Schroeyers, W. Development of alkali activated cements and concrete mixture design with high volumes of red mud. Construct. Build. Mater. 2017, 151, 819–826. [Google Scholar] [CrossRef]
  32. Tang, W.C.; Wang, Z.; Donne, S.W.; Forghani, M.; Liu, Y. Influence of red mud on mechanical and durability performance of self-compacting concrete. J. Hazard. Mater. 2019, 379, 120802. [Google Scholar] [CrossRef] [PubMed]
  33. Yang, J.; Zhang, D.; Hou, J.; He, B.; Xiao, B. Preparation of glass-ceramics from red mud in the aluminium industries. Ceram. Int. 2008, 34, 125–130. [Google Scholar] [CrossRef]
  34. Wiśniewska, K.; Pichór, W.; Kłosek-Wawrzyn, E. Influence of Firing Temperature on Phase Composition and Color Properties of Ceramic Tile Bodies. Materials 2021, 14, 6380. [Google Scholar] [CrossRef]
  35. Chiara, B.; Chiara, C.; Tam, P.; WAI, T.; Dimitrios, P. Review of Technologies in the Recovery of Iron, Aluminium, Titanium and Rare Earth Elements from Bauxite Residue (Red Mud). In Proceedings of the 3rd International Symposium on Enhanced Landfill Mining, Lisbon, Portugal, 8–10 February 2016; pp. 259–276. [Google Scholar]
  36. Pepper, R.A.; Couperthwaite, S.J.; Millar, G.J. Comprehensive examination of acid leaching behaviour of mineral phases from red mud: Recovery of Fe, Al, Ti, and Si. Miner. Eng. 2016, 99, 8–18. [Google Scholar] [CrossRef]
  37. Fanghai, L.; Xiangdong, S.; Fang, H.; Jiawei, W.; Haifeng, W. Co-Treatment of spent pot-lining and red mud for carbon reutilization and recovery of iron, aluminium and sodium by reductive roasting process. Metall. Mater. Trans. B 2020, 51, 1564–1575. [Google Scholar]
  38. Li, Y.; Wang, J.; Wang, X.; Wang, B.; Luan, Z. Feasibility study of iron mineral separation from red mud by high gradient superconducting magnetic separation. Phys. C Supercond. 2011, 471, 91–96. [Google Scholar] [CrossRef]
  39. Valeev, D.; Zinoveev, D.; Kondratiev, A.; Lubyanoi, D.; Pankratov, D. Reductive smelting of neutralized red mud for iron recovery and produced pig iron for heat resistant castings. Metals 2020, 10, 32. [Google Scholar] [CrossRef]
  40. Debadatta, D.; Pramanik, K. A study on chemical leaching of iron from red mud using sulphuric acid. Res. J. Chem. Environ. 2013, 17, 50–56. [Google Scholar]
  41. Liu, X.; Gao, P.; Yuan, S.; Lv, Y.; Han, Y. Clean utilization of high iron red mud by suspension magnetization roasting. Miner. Eng. 2020, 157, 106553. [Google Scholar] [CrossRef]
  42. Vakilchap, F.; Mousavi, S.M.; Shojaosadati, S.A. Role of Aspergillus niger in recovery enhancement of valuable metals from produced red mud in Bayer process. Biores. Technol. 2016, 218, 991–998. [Google Scholar] [CrossRef]
  43. Vachon, P.; Tyagi, R.D.; Auclair, J.C.; Wilkinson, K.J. Chemical and biological leaching of aluminium from red mud. Environ. Sci. Technol. 1994, 28, 26–30. [Google Scholar] [CrossRef] [PubMed]
  44. Kasliwal, P.; Sai, P.S.T. Enrichment of titanium dioxide in red mud: A kinetic study. Hydrometallurgy 1999, 53, 73–87. [Google Scholar] [CrossRef]
  45. Deep, A.; Malik, P.; Gupta, B. Extraction and separation of Ti(IV) using thiophosphinic acids and its recovery from ilmenite and red mud. Sep. Sci. Technol. 2001, 36, 671–685. [Google Scholar] [CrossRef]
  46. Davris, P.; Balomenos, E.; Panias, D.; Paspaliaris, I. Selective leaching of rare earth elements from bauxite residue (red mud), using a functionalized hydrophobic ionic liquid. Hydrometallurgy 2016, 164, 125–135. [Google Scholar] [CrossRef]
  47. Alkan, G.; Yagmurlu, B.; Cakmakoglu, S.; Hertel, T.; Kaya, Ş.; Gronen, L.; Stopic, S.; Friedrich, B. Novel Approach for Enhanced Scandium and Titanium Leaching Efficiency from Bauxite Residue with Suppressed Silica Gel Formation. Sci. Rep. 2018, 8, 5676. [Google Scholar] [CrossRef] [PubMed]
  48. Bai, B.; Bai, F.; Li, X.; Nie, Q.; Jia, X.; Wu, H. The remediation efficiency of heavy metal pollutants in water by industrial red mud particle waste. Environ. Technol. Innov. 2022, 28, 102944. [Google Scholar] [CrossRef]
  49. Yang, T.; Wang, Y.; Sheng, L.; He, C.; Sun, W.; He, Q. Enhancing Cd(II) sorption by red mud with heat treatment: Performance and mechanisms of sorption. J. Environ. Manag. 2020, 255, 109866. [Google Scholar] [CrossRef] [PubMed]
  50. Zhou, R.; Liu, X.; Luo, L.; Zhou, Y.; Wei, J.; Chen, A.; Tang, L.; Wu, H.; Deng, Y.; Zhang, F. Remediation of Cu, Pb, Zn and Cd-contaminated agricultural soil using a combined red mud and compost amendment. Int. Biodeterior. Biodegrad. 2017, 118, 73–81. [Google Scholar] [CrossRef]
  51. Vilarinho, I.S.; Dias, A.C.; Carneiro, J.; Pinto, C.; Labrincha, J.A.; Seabra, M.P. Red mud valorization in stoneware pastes: Technical and environmental assessment. Sustain. Mater. Technol. 2023, 38, e00762. [Google Scholar] [CrossRef]
  52. Hadfield, R.A. Metallurgy and Its Influence on Modern Progress; Van Nostrand: New York, NY, USA, 1926. [Google Scholar]
  53. Fiorillo, F.; Bertotti, G.; Appino, C.; Pasquale, M. Soft magnetic materials. In Wiley Encyclopaedia of Electrical and Electronics Engineering; Webster, J.G., Ed.; Wiley: Hoboken, NJ, USA, 2016. [Google Scholar]
  54. Cullity, B.D.; Graham, C.D. Introduction to Magnetic Materials; Wiley-IEEE Press: Hoboken, NJ, USA, 2008. [Google Scholar]
  55. Lamichhane, T.N.; Sethuraman, L.A.; Dalagan, L.A.; Wang, H.; Keller, J.; Paranthaman, M.P. Additive manufacturing of soft magnets for electrical machines—A review. Mater. Today Phys. 2020, 15, 100255. [Google Scholar] [CrossRef]
  56. Lucarini, S.; Hossain, M.; Garcia-Gonzalez, D. Recent advances in hard-magnetic soft composites: Synthesis, characterisation, computational modelling, and applications. Compos. Struct. 2022, 279, 114800. [Google Scholar] [CrossRef]
  57. Fortunati, S.; Cucale, S.; Schneider, J.; Franke, A.; Rudolf, K. Developments in the field of electrical steels over the last years. In Proceedings of the International Conference on Magnetism and Metallurgy WMM16, Rome, Italy, 13–15 June 2016. [Google Scholar]
  58. Silveyra, J.M.; Ferrara, E.; Huber, D.L.; Monson, T.C. Soft magnetic materials for a sustainable and electrified world. Science 2018, 362, 6413. [Google Scholar] [CrossRef] [PubMed]
  59. Birčáková, Z.; Kollár, P.; Weidenfeller, B.; Füzer, J.; Fáberová, M.; Bureš, R. Reversible and irreversible DC magnetization processes in the frame of magnetic, thermal and electrical properties of Fe-based composite materials. J. Alloys Compd. 2015, 645, 283–289. [Google Scholar] [CrossRef]
  60. Baricco, M.; Mastrandrea, E.; Antonione, C.; Viala, B.; Degauque, J.; Ferrara, E.; Fiorillo, F. Grain growth and texture in rapidly solidified Fe (Si) 6.5 wt.% ribbons. Mater. Sci. Eng. A 1997, 226–228, 1025–1029. [Google Scholar] [CrossRef]
  61. Azuma, D.; Ito, N.; Ohta, M. Recent progress in Fe-based amorphous and nanocrystalline soft magnetic materials. J. Magnet. Magn. Mater. 2020, 501, 166373. [Google Scholar] [CrossRef]
  62. Electric Vehicles—Worldwide. Available online: https://www.statista.com/outlook/mmo/electric%20vehicles/worldwide (accessed on 6 January 2025).
  63. Singh Raman, R.K. Characterisation of ‘rolled-in’, ‘fragmented’ and ‘red’ scale formation during secondary processing of steels. Eng. Fail. Anal. 2006, 13, 1044–1050. [Google Scholar] [CrossRef]
  64. Khanna, R.; Konyukhov, Y.; Li, K.; Jayasankar, K.; Maslennikov, N.; Zinoveev, D.; Kargin, J.; Leybo, D.; Kravechenko, M.; Mukherjee, P.S. Innovative Transformation and Valorization of Red Mill Scale Waste into Ferroalloys: Carbothermic Reduction in the Presence of Alumina. Sustainability 2023, 15, 16810. [Google Scholar] [CrossRef]
  65. Khanna, R.; Ikram-Ul Haq, M.; Wang, Y.; Seetharaman, S.; Sahajwalla, V. Chemical interactions of alumina–carbon refractories with molten steel at 1823 K (1550 C): Implications for refractory degradation and steel quality. Metall. Mater. Trans. B 2011, 42, 677–684. [Google Scholar] [CrossRef]
  66. Khanna, R.; Sahajwalla, V. An atomistic model for the graphite–alumina/liquid iron system: Monte-Carlo simulations on carbon dissolution. Acta Mater. 2005, 53, 1205–1214. [Google Scholar] [CrossRef]
  67. Rai, S.; Wasewar, K.; Agnihotri, A. Treatment of alumina refinery waste (red mud) through neutralization techniques: A review. Waste Manag. Res. 2017, 35, 563–580. [Google Scholar] [CrossRef] [PubMed]
  68. Dang, Q.; Song, M.; Luo, X.; Qu, M.; Wang, X. A modeling study of different kinds of sessile droplets on the horizontal surface with surface wettability and gravity effects considered. Energy Storage Sav. 2022, 1, 22–32. [Google Scholar] [CrossRef]
  69. Khanna, R.; Konyukhov, Y.; Ikram-ul-haq, M.; Burmistrov, I.; Cayumil, R.; Belov, V.A.; Rogachev, S.O.; Leybo, D.V.; Mukherjee, P.S. An innovative route for valorising iron and aluminium oxide rich industrial wastes: Recovery of multiple metals. J. Environ. Manag. 2021, 295, 113035. [Google Scholar] [CrossRef]
  70. Khanna, R.; Kongkarat, S.; Seetharaman, S.; Sahajwalla, V. Carbothermic reduction of alumina at 1823 K in the presence of molten steel: A Sessile Drop Investigation. ISIJ Int. 2012, 52, 993–999. [Google Scholar] [CrossRef]
  71. Schiemann, M.; Wirtz, S.; Scherer, V.; Bärhold, F. Spray roasting of iron chloride FeCl2: Laboratory scale experiments and a model for numerical simulation. Powder Technol. 2012, 228, 301–308. [Google Scholar] [CrossRef]
  72. Kumar, K.S.; Sah, R.; Sekhar, V.R.; Vishwanath, S.C. Development and use of mill scale briquettes in BOF. Ironmak. Steelmak. 2017, 44, 134–139. [Google Scholar] [CrossRef]
  73. Environment and Climate Change, Worldsteel Association. 2021. Available online: https://worldsteel.org/steel-topics/environment-and-climate-change/ (accessed on 6 January 2025).
  74. Paswan, D.; Malathi, M.; Minj, R.K.; Bandopadhyay, D. Mill scale: A potential raw material for iron and steel making. Steel World 2015, 21, 54–56. [Google Scholar]
  75. Grudinsky, P.; Zinoveev, D.; Yurtaeva, A.; Kondratiev, A.; Dyubanov, V.; Petelin, A. Iron recovery from red mud using carbothermic roasting with addition of alkaline salts. J. Sustain. Metall. 2021, 7, 858–873. [Google Scholar] [CrossRef]
  76. Rai, S.; Nimje, M.T.; Chaddha, M.J.; Modak, D.; Rai, K.R.; Agnihotri, A. Recovery of iron from bauxite residue using advanced separation techniques. Miner. Engg. 2019, 2134, 222–231. [Google Scholar] [CrossRef]
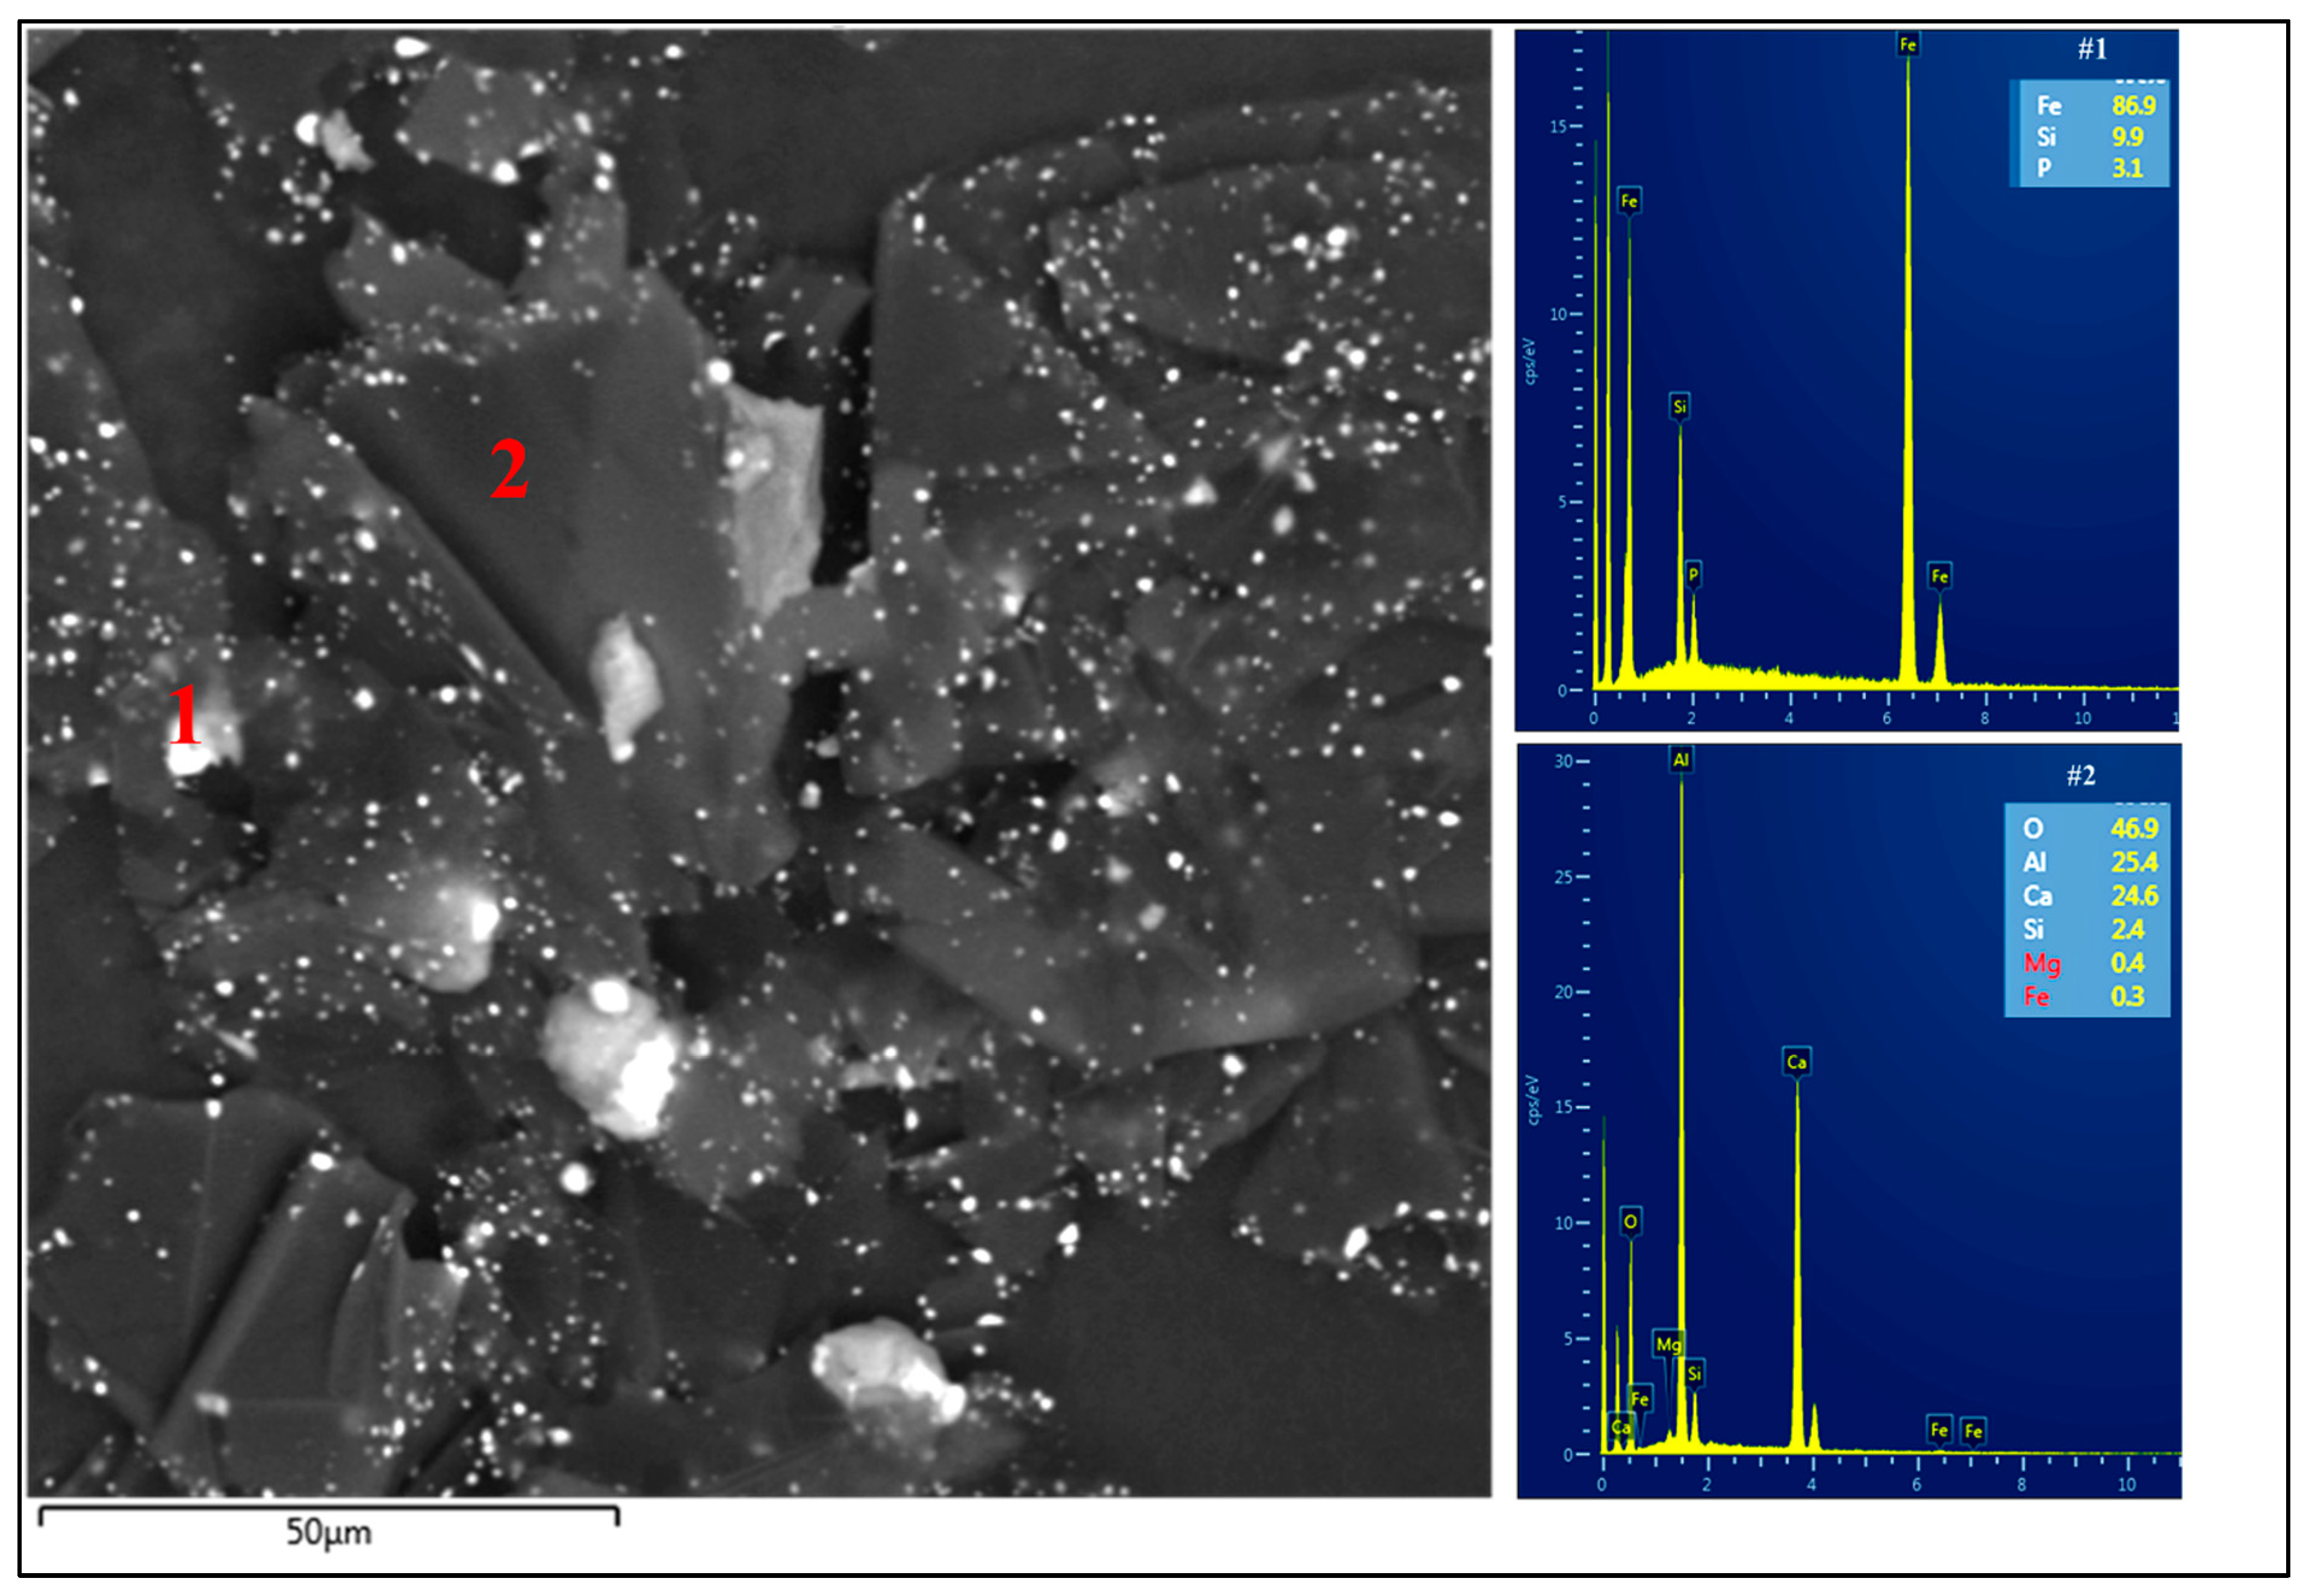
Figure 1. SEM-EDS plots of RMA after carbothermic reduction at 1600–1650 °C for 30 min.
Sustainability 17 01795 g001
Figure 2. SEM-EDS plots of the 20 g RMA + 20 g Fe2O3 blend after carbothermic reduction at 1600–1650 °C for 30 min.
Sustainability 17 01795 g002
Figure 3. SEM-EDS plots of the 20 g RMA + 20 g red MS blend after carbothermic reduction at 1600–1650 °C for 30 min.
Sustainability 17 01795 g003
Figure 4. Elemental distribution after carbothermal reduction: (A) RMA, (B) 20 g RMA + 20 g Fe2O3, and (C) 20 g RMA + 20 g red MS blends.
Sustainability 17 01795 g004
Figure 5. SEM-EDS elemental distribution images for Set A (20 g Fe2O3 + 5 g Al2O3 + 15 g RMB) and Set B (20 g Fe2O3 + 10 g Al2O3 + 10 g RMB) after carbothermic reduction at 1600–1650 °C for 30 min.
Sustainability 17 01795 g005
Figure 6. SEM-EDS elemental distribution images for Set A (20 g red MS + 5 g Al2O3 + 15 g RMB) and Set B (20 g red MS + 10 g Al2O3 + 10 g RMB) after carbothermic reduction at 1600–1650 °C for 30 min.
Sustainability 17 01795 g006
Figure 7. SEM-EDS profiles for Set A: (20 g MS + 20 g RMB); Set B: (20 g MS + 5 g Al2O3 + 15 g RMB); and Set C: (20 g MS + 10 g Al2O3 + 10 g RMB) after carbothermic reduction at 1600–1650 °C for 30 min.
Sustainability 17 01795 g007
Figure 8. X-ray diffraction patterns for the three (Fe2O3, red MS and black MS) blends with Al2O3 and RMB.
Sustainability 17 01795 g008
Figure 9. High resolution SEM images for blends #1 to 10 (based on data in Table 4) for estimating the sizes of metallic droplets or regions.
Sustainability 17 01795 g009
Table 1. Chemical composition of RMA and its blends for Set I (wt.%).
BlendsFe2O3Al2O3SiO2CaOMgONa2OSO32−P2O5TiO2
RMA36.911.88.723.81.00.30.10.43.5
20 g RMA + 20 g Fe2O368.55.94.411.90.50.10.10.21.8
20 g RMA + 20 g red MS68.55.94.411.90.50.10.10.21.8
Table 2. Chemical composition of RMB and its blends for Set II (wt.%).
BlendsFe2O3Al2O3SiO2CaOMgONa2OSO32−P2O5TiO2
RMB50.011.28.710.70.63.80.10.34.1
20 g Fe2O3 + 5 g Al2O3 + 15 g RMB68.816.73.34.00.21.40.010.11.5
20 g Fe2O3 + 10 g Al2O3 + 10 g RMB62.527.82.22.70.21.00.00.11.0
20 g red MS + 5 g Al2O3 + 15 g RMB68.816.73.34.00.21.40.10.11.5
20 g red MS + 10 g Al2O3 + 10 g RMB62.527.82.22.70.21.00.00.11.0
Table 3. Chemical composition of RMB blends with MS and Al2O3 for Set III (wt.%).
BlendsFe2O3Al2O3SiO2CaOMgONa2OSO32−P2O5TiO2
20 g MS + 20 g RMB75.05.64.45.30.31.90.10.22.0
20 g MS + 5 g Al2O3 + 15 g RMB68.816.73.34.00.21.40.10.11.5
20 g MS + 10 g Al2O3 + 10 g RMB62.527.82.22.70.21.00.00.11.0
Table 4. Composition and size ranges of metallic droplets after carbothermic reduction of the various blends investigated. The data for the Fe, Si and Al concentrations are reported in wt.%.
S.N.BlendsFeSiAlSize
1.RMA86.99.0-1–3 μm
2.20 g RMA + 20 g Fe2O392.35.6-0.5–4 μm
3.20 g RMA + 20 g red MS92.45.60.55–15 μm
4.20 g Fe2O3 + 5 g Al2O3 + 15 g RMB90.36.70.0360–300 μm
5.20 g Fe2O3 + 10 g Al2O3 + 10 g RMB94.53.90.760–300 μm
6.20 g red MS + 5 g Al2O3 + 15 g RMB88.76.61.8100–500 μm
7.20 g red MS + 10 g Al2O3 + 10 g RMB90.56.31.4100–500 μm
8.20 g MS + 20 g RMB96.7--30–150 μm
9.20 g MS + 5 g Al2O3 + 15 g RMB88.76.61.830–150 μm
10.20 g MS + 10 g Al2O3 + 10 g RMB90.56.51.430–150 μm
Disclaimer/Publisher’s Note: The statements, opinions and data contained in all publications are solely those of the individual author(s) and contributor(s) and not of MDPI and/or the editor(s). MDPI and/or the editor(s) disclaim responsibility for any injury to people or property resulting from any ideas, methods, instructions or products referred to in the content.